Article

Spatial and Seasonal Analysis of Phyllosphere Bacterial Communities of the Epiphytic Gymnosperm Zamia pseudoparasitica

by
Lilisbeth Rodríguez-Castro
1,2,*,
Adriel M. Sierra
3,
Juan Carlos Villarreal Aguilar
2,3 and
Kristin Saltonstall
2,*
1
Department of Microbiology, University of Panama, Panama City P.O. Box 3366, Panama
2
Smithsonian Tropical Research Institute (STRI), Ancón 0843-03092, Panama
3
Département de Biologie, Université Laval, Québec, QC G1V 0A6, Canada
*
Authors to whom correspondence should be addressed.
Appl. Biosci. 2025, 4(3), 35; https://doi.org/10.3390/applbiosci4030035
Submission received: 8 May 2025 / Revised: 23 June 2025 / Accepted: 2 July 2025 / Published: 11 July 2025

Abstract

Phyllosphere microbial communities influence the growth and productivity of plants, particularly in epiphytic plants, which are disconnected from nutrients available in the soil. We characterized the phyllosphere of 30 individuals of the epiphytic cycad, Zamia pseudoparasitica, collected from three forest sites during the rainy and dry seasons in the Republic of Panama. We used DNA metabarcoding to describe the total bacteria community with the 16S rRNA gene and the diazotrophic community with nifH gene. Common taxa included members of the Rhizobiales, Frankiales, Pseudonocardiales, Acetobacteriales, and the diazotrophic community was dominated by Cyanobacateria. We observed similar patterns of alpha diversity across sites and seasons, and no community differences were seen within sites between the rainy and dry seasons for either the 16S rRNA or nifH genes. However, pairwise comparisons showed some statistically significant differences in community composition between sites and seasons, but these explained only a small portion of the variation. Beta diversity partitioning indicated that communities were more phylogenetically closely related than expected by chance, indicative of strong environmental or host filtering shaping these phyllosphere communities. These results highlight the influence of host-driven selection and habitat stability in shaping phyllosphere microbiota, offering new insights into microbial assembly in tropical canopy ecosystems.

1. Introduction

Epiphytic plants represent a distinct ecological guild within the dynamic habitats of forest canopies, which have heterogeneous abiotic conditions for growth across spatial and temporal scales [1,2,3,4,5]. In tropical ecosystems, epiphytes are a key component of canopy plant biodiversity, with distinct biotic interactions for their reproduction (e.g., pollination and seed dispersal) and resource acquisition, making them key contributors to ecosystem functions [6,7]. Due to resource limitations, epiphytes often rely on species-specific functional adaptations and their associated microbes for nutrient acquisition, such as diazotrophs in coralloid roots [8,9].
Among plant-associated microbial assemblages, phyllosphere communities—microorganisms inhabiting the aerial surfaces of leaves—play critical roles in the fitness and development of their hosts, especially under challenging environmental conditions [10]. The global leaf surface area is estimated to exceed 108 km2, making the phyllosphere one of the largest microbial habitats on Earth. The microbial community composition of the phyllosphere is shaped by a range of biotic and abiotic factors, of which host identity is frequently reported as the primary driver, particularly across different plant species [11,12]. However, within host species, microbe–microbe interactions and localized resource availability can also strongly influence community assembly [13,14,15]. Environmental conditions such as temperature, relative humidity, and light also affect the phyllosphere, although their impacts tend to be more context-dependent and often explain a smaller proportion of variation [8,16,17,18]. Additionally, the generally low nutrient availability of the leaf surface [19,20], geographical location [21], and seasonal dynamics [12,22] can further modulate microbial structure. Phyllosphere communities can contribute significantly to plant functions, such as nutrient uptake, methanol emission, and biosynthesis of phytohormones [8,23,24], modulating plant functional traits that promote host fitness [25] and have an important role in terrestrial ecosystem functions [21]. In humid tropical forests, local environmental conditions in the phyllosphere often promote the activity of nitrogen-fixing bacteria (diazotrophs), as they play a key role in nitrogen cycling in the forest canopy [26,27,28].
The cycad Zamia pseudoparasitica J. Yates is the only strictly epiphytic gymnosperm species in the world [29]. This species is endemic to Panama and distributed at elevations between 50–1000 m.a.s.l. in undisturbed forest on the Atlantic side of the country [30]. It grows attached to horizontal branches and in branch forks of canopy trees at heights of 7–20 m [31,32]. While its biotic interactions with other organisms have been somewhat characterized [8,31,32,33], its phyllosphere microbiota remains an open research avenue. Unlike most epiphytic taxa (e.g., orchids, ferns, mosses, etc.), which are typically small, fast-growing, and adapted to high irradiance and limited nutrient and water availability, Z. pseudoparasitica is characterized by large, long-lived leaves (Figure 1) and a substantial aerial root system that hosts nitrogen-fixing cyanobacteria [8,9,33]. These functional traits suggest that this species supports a unique structural environment, providing an ecologically valuable and novel system for investigating the composition and dynamics of phyllosphere microbial communities.
In this study, we (i) characterized the phyllosphere bacterial communities inhabiting the phyllosphere of Z. pseudoparasitica plants collected at three locations and during both the rainy and dry seasons using 16S rRNA gene metabarcoding, and (ii) specifically targeted the diversity of diazotrophic bacterial community by sequencing the nifH nitrogenase subunit. We then compared these results to the diazotrophic taxonomic diversity obtained using 16S rRNA gene. We hypothesized that the bacterial communities colonizing the phyllosphere of Z. pseudoparasitica would vary across different sites in both the total and diazotrophic bacterial communities. We also expected to see seasonal shifts in these communities between the rainy and dry seasons. This dual use of specific functional (nifH) and broad taxonomic bacterial (16S rRNA gene) markers provides a holistic view of microbial community structure in the phyllosphere of Z. pseudoparasitica and its functional capabilities across spatial and temporal scales.

2. Materials and Methods

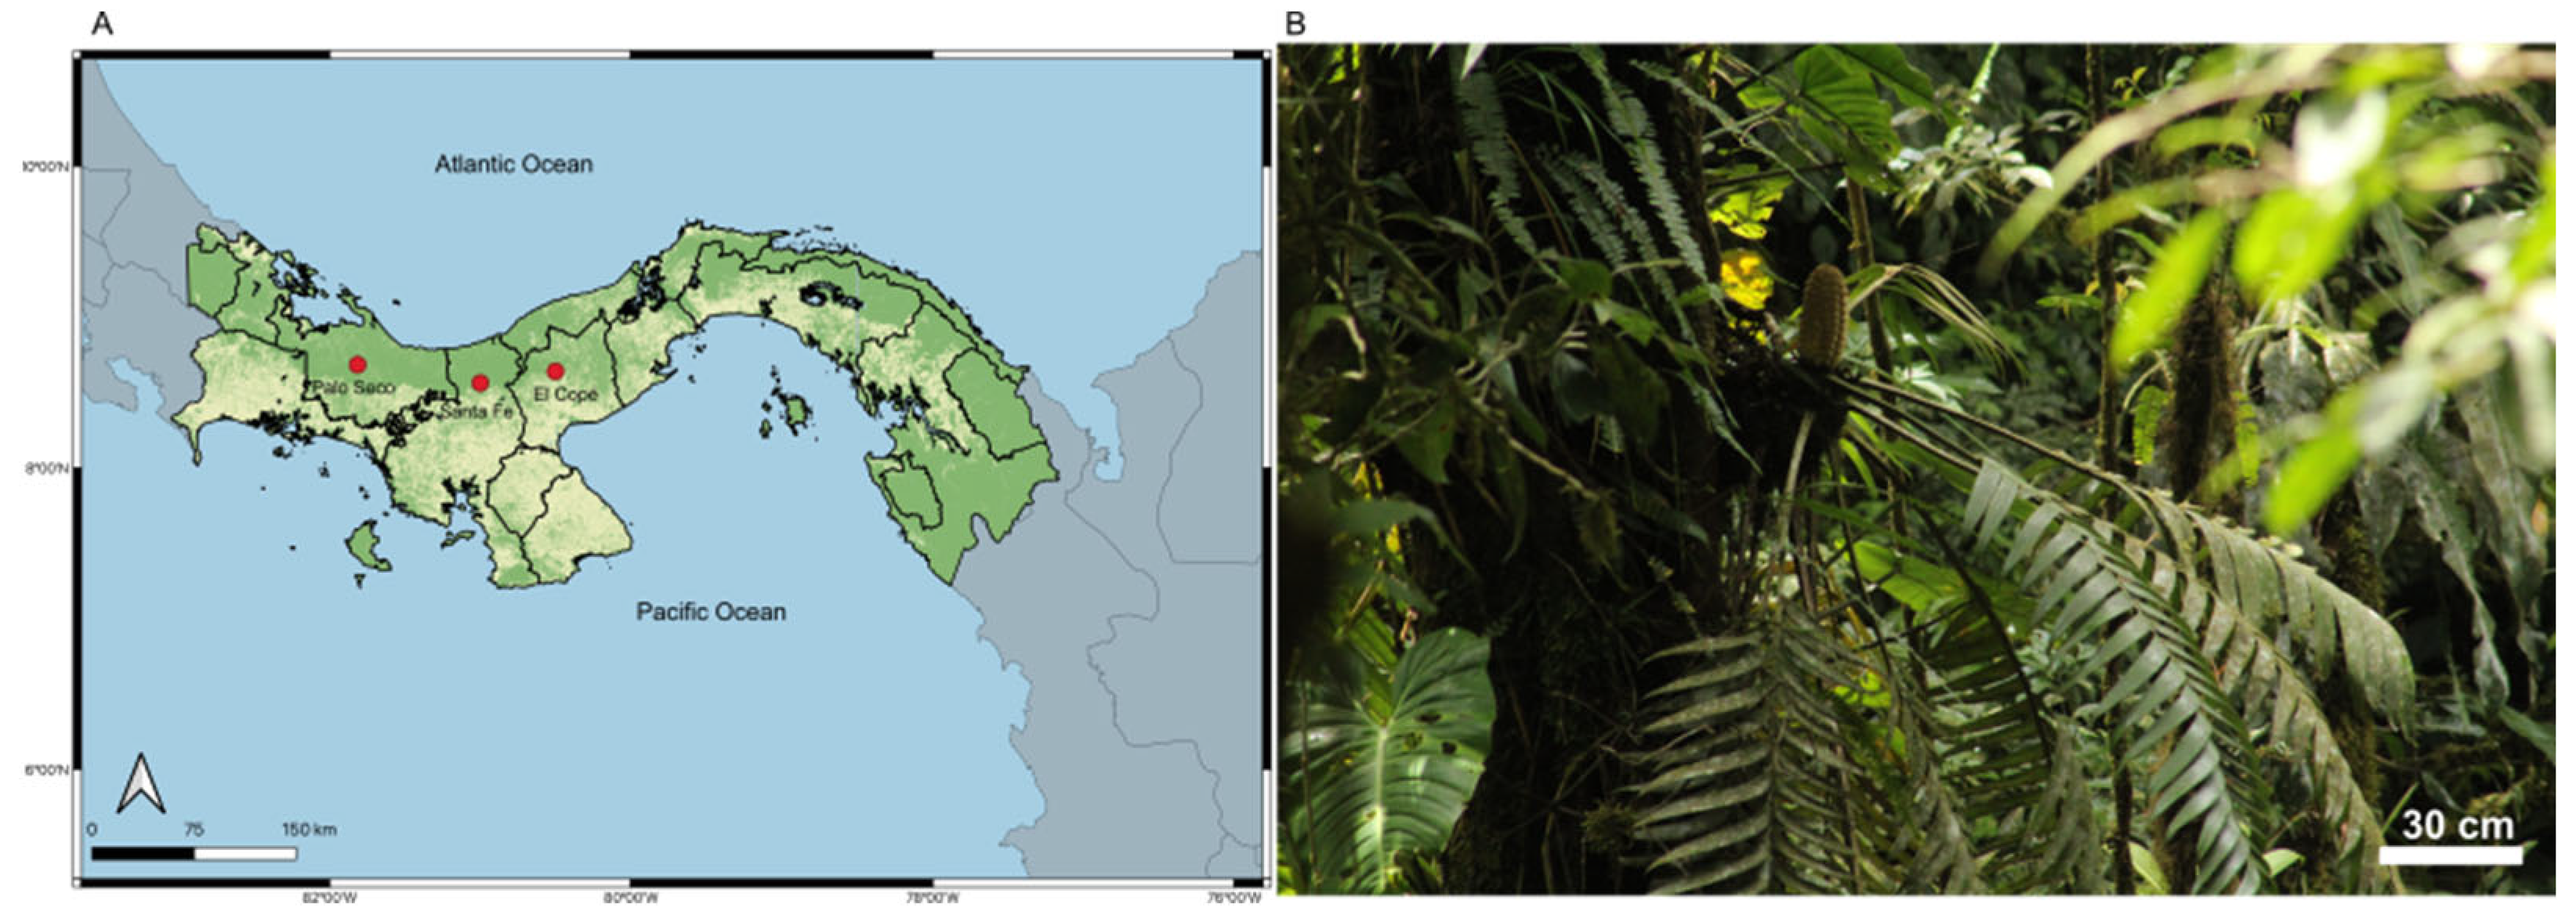
2.1. Study Sites and Field Sampling

We sampled adult plants of Zamia pseudoparasitica from three protected forest sites located on the Atlantic slope of western Panama: the Palo Seco Protected Forest in Bocas del Toro Province (hereafter, “Palo Seco”; 8°47′27.0″ N, 82°11′38.4″ W; 628 m.a.s.l.), Santa Fe National Park in Veraguas Province (as “Santa Fe”; 8°31′53.5″ N, 81°09′00.9″ W; 812 m.a.s.l.), and General de División Omar Torrijos Herrera National Park in Coclé Province (as “El Copé”; 8°40′04.9″ N, 80°35′27.5″ W; 754 m.a.s.l.) (Figure 1). These sites represent submontane evergreen tropical rainforests, characterized by daily temperatures ranging from 21 to 24 °C and annual rainfall between 1900–3000 mm. Zamia pseudoparasitica is a relatively common epiphyte in all these forests, with an average density estimate of 12.4 individuals per hectare [31].
At each site, we selected 10 medium-sized adult plants [8] to standardize sampling across individuals of comparable age. To minimize variability in microbial communities due to forest stratification, we sampled individuals living between 5 and 10 m above the ground. Samples were collected from the same plants during both the rainy (October 2022; rainfall range: 592–1205 mm) and dry seasons (April 2023; rainfall range: 126–318 mm) [34] to assess seasonal variation in phyllosphere communities.
We used an extended botanical pole pruner to collect the proximal third of the compound leaves, cutting near the rachis. Each leaf was gently lowered to avoid contact with other plants or the ground and handled with care to minimize contamination. Two leaflets free of epiphyllous bryophytes and lichens were selected from each leaf; always from the distal third of compound leaves to minimize positional variation. This standardized sampling approach aimed to capture representative intra-individual variation while controlling microhabitat heterogeneity across the leaf surface. Leaflets were stored in labeled sterile bags on ice (4 °C) for less than 12 h before transfer to −20 °C for laboratory processing.
On-site environmental variables were measured at the time of collection. Canopy cover was estimated using hemispherical smartphone photographs analyzed with the GLAMA-Gap Light Analysis Mobile App version 3.0 [35], a rapid and reliable method for quantifying canopy openness. Temperature and relative humidity at ground level were recorded using a digital thermo-hygrometer (WT83 WINTACT Shenzhen, China). Leaflet surface temperature was measured as the mean of three independent measures on different surface areas per sample using a non-contact infrared thermometer (Harbin model GP-400, Harbin, China) immediately after collection. We also measured the leaflet area using ImageJ 1.53e [36].

2.2. DNA Extraction and Amplicon Sequencing

We sampled the same 30 Z. pseudoparasitica individuals in both the dry and rainy seasons, for a total of 120 phyllosphere-characterized communities. We considered individual plants to be independent sampling units, and two leaflets were collected per season to capture intra-individual variation. Phyllosphere communities were isolated using 50 mL of a 1:50 diluted CTAB washing solution (1 M Tris, 5 M NaCl, 0.5 M EDTA, 1.2% CTAB) that was added to the sterile bags containing each leaflet and shaken for 10 min at 340 rpm. This solution with suspended bacteria was transferred to Falcon tubes and centrifuged at 10,000× g for 20 min [37]. The resulting pellet was subjected to DNA extraction using the DNeasy PowerSoil Pro Kit (QIAGEN, Germantown, MD, USA) following the manufacturer’s protocol and resuspended in a final volume of 50 µL. DNA concentration and quality were assessed with a Nanodrop spectrophotometer (ThermoFisher Scientific, Waltham, MA, USA).
We used a two-stage PCR protocol to prepare all sequencing libraries. To characterize the total bacterial community, we used the bacterial-specific primers 799F (5′-AACMGGATTAGATACCCKG-3′) and 1115R (5′-AGGGTTGCGCTCGTTG0-3′) [38,39], modified with partial Illumina adaptors on the 5′ end, to amplify the v5-v6 region of the 16S rRNA gene. In the first step, triplicate PCR reactions using these locus-specific primers were performed in a volume of 10 µL, containing 2.42 µL of Sigma PCR-grade water, 0.2 µL of each primer (10 µM), 5.08 µL KAPA 3G Plant 2× Mastermix (Roche Diagnostics GmbH, Mannheim, Germany), 0.1 µL BSA and 2 µL of DNA extract. The thermal cycling reaction started with denaturation at 95 °C for 3 min, followed by 30 cycles of denaturation at 95 °C for 30 s, annealing at 52 °C for 30 s, and extension at 72 °C for 1 min and 30 s, followed by a final extension at 72 °C for 10 min.
To characterize the diazotrophic bacterial community, we used the primer set polF (5′-TGCGAYCCSAARGCBGACTC-3′) and polR (5′-ATSGCCATCATYTCRCCGGA-3′) [40] to amplify a 360 bp portion of the nifH gene using a similar two-step, dual-index PCR protocol. Triplicate PCR reactions were carried out in 25 µL volumes, containing 13.17 µL Sigma PCR-grade water, 1 µL of each primer (10 µM), 12.5 µL KAPA 3G Plant 2× Mastermix (Roche Molecular Systems, Inc., Mannheim, Germany), 0.5 µL BSA, 1.25 µL magnesium, and 3 µL of DNA extract. The thermal cycling reaction started with denaturation at 95 °C for 3 min, followed by 35 cycles of denaturation at 95 °C for 30 s, annealing at 52 °C for 30 s, and extension at 72 °C for 1 min and 30 s, followed by a final extension at 72 °C for 10 min.
Triplicate PCR1 products were combined in equal volumes and 1 µL of this mixture was used as template for PCR2, which added unique indexes and remaining Illumina adaptors. The PCR2 thermal cycling regime included initial denaturation at 94 °C for 3 min, followed by five cycles of 94 °C for 30 s, 50 °C for 30 s, and 72 °C for 45 s, with a final extension of 72 °C for 5 min. PCR products were cleaned and normalized using Just-a-Plate PCR Normalization Plates (Charm Sciences, Inc., Lawrence, MA, USA) and the sequencing library was constructed by pooling 10 µL aliquots of each cleaned sample and concentrated with KAPA Pure magnetic beads (Roche Molecular Systems, Inc., Mannheim, Germany). The quality and concentration of the library was checked on Qubit and BioAnalyzer (Agilent Technologies, Inc., Santa Clara, CA, USA) instruments. Finally, both libraries were sequenced on a 2 × 250 bp run (v.2 chemistry) on an Illumina MiSeq at the Naos Molecular Laboratory (NML).

2.3. Data Analysis

2.3.1. Amplicon Sequence Data Processing

All analyses were performed using the R software v.4.4.2 (R Core Team 2024). Sequences were filtered, primers were trimmed, chimeric sequences removed, Amplicon Sequence Variants (ASVs) inferred, and taxonomy assigned using the R package dada2 v.1.32.0 [41,42] and associated packages such as cutadapt v.3.0 [43]. Taxonomy was assigned to each ASV using the SILVA v.132 taxonomic database [44] for 16S rRNA gene sequences and the nifH v.2.0.5 database [45] for nifH sequences.
The R package phyloseq v.1.48.0 [46] was used to process the ASV data for microbial community analyses. All samples containing fewer than 10 reads were removed, leaving 117 samples for the 16S rRNA gene analysis and 84 samples for the nifH analysis. All bacterial ASVs characterized with 16S rRNA gene that were not assigned to phylum level or matched chloroplast and mitochondrial sequences, as well as ASVs not assigned to phylum level with the nifH marker, were removed. We used the decontam v.1.24.0 package [47] to identify and remove potential contaminants by applying both frequency and prevalence methods. We also calculated the prevalence of ASVs and retained those found in at least 5% of the samples. A phylogenetic tree was constructed using a neighbor-joining algorithm with the GTR + GAMMA model in phangorn v.2.11.1 [48] for the 16S rRNA gene and nifH data to allow for comparisons of diversity using phylogenetic metrics.

2.3.2. Diversity and Composition of the Bacterial Community

Prior to analysis, ASV counts from the 16S rRNA and nifH datasets were converted to relative abundances to normalize for differences in sequencing depth across samples. Community composition was compared at the phylum and family levels across sites and seasons. Relative abundance data were also used to calculate alpha and beta diversity metrics, ensuring consistent normalization throughout diversity and community structure analyses.
To evaluate the effect of each site and environmental factors on taxonomic richness, we estimated the Observed Richness and Shannon indices using the table with normalized data. Shapiro–Wilk normality tests were used to select the appropriate test statistic, and we evaluated differences in Observed Richness and Shannon indices between each of the seasonal sampling sites using the Mann–Whitney test.
Variations in community composition in the phyllosphere of Z. pseudoparasitica between sites were analyzed using Bray–Curtis distance and permutational analysis of variance (PERMANOVA) with 999 permutations [49]. We then performed betadispersion tests to assess the homogeneity of variability within each site. Results were visualized with Principal Coordinates Analysis (PCoA).

2.3.3. Beta Diversity Partitioning (Beta Net Relatedness Index, βNRI)

We explored the ecological processes that determined bacterial community composition in the 16S rRNA dataset using phylogenetic beta diversity partitioning, as estimated in the microeco 1.15.0 R package [50]. This assessed the assembly mechanisms shaping Z. pseudoparasitica-associated microbial communities [51]. The β-nearest taxon index (βNRI) quantifies phylogenetic turnover between communities and infers the relative contributions of deterministic and stochastic processes shaping microbial communities [52,53]. Specifically, βNRI values greater than +2 or lower than −2 indicate that deterministic processes, such as variable or homogeneous selection, dominate community assembly, prevail. When βNRI values are between −2 and 2, observed phylogenetic turnover is as expected by chance, suggesting stochastic processes. Statistical differences in βNRI values between sites were assessed using analysis of variance (ANOVA).

3. Results

3.1. Variation in Environmental Factors Between Each Sampling Site and Season

Average rainfall differed markedly between the wet and dry seasons at the three forest sites (e.g., in Palo Seco: 605.0 mm in October vs. 64.7 mm in March; Santa Fe: 369.3 mm vs. 54.7 mm; and El Copé: 353.3 mm vs. 28.1 mm) [34], with Palo Seco having more rainfall and El Copé the driest overall. To assess the influence of site and season on each environmental parameter, we performed a three-way ANOVA on normalized data. However, no significant differences were observed for the environmental variables measured between sites during the rainy and dry season sampling (Table 1; ANOVA, p ≥ 0.05 for all measurements).

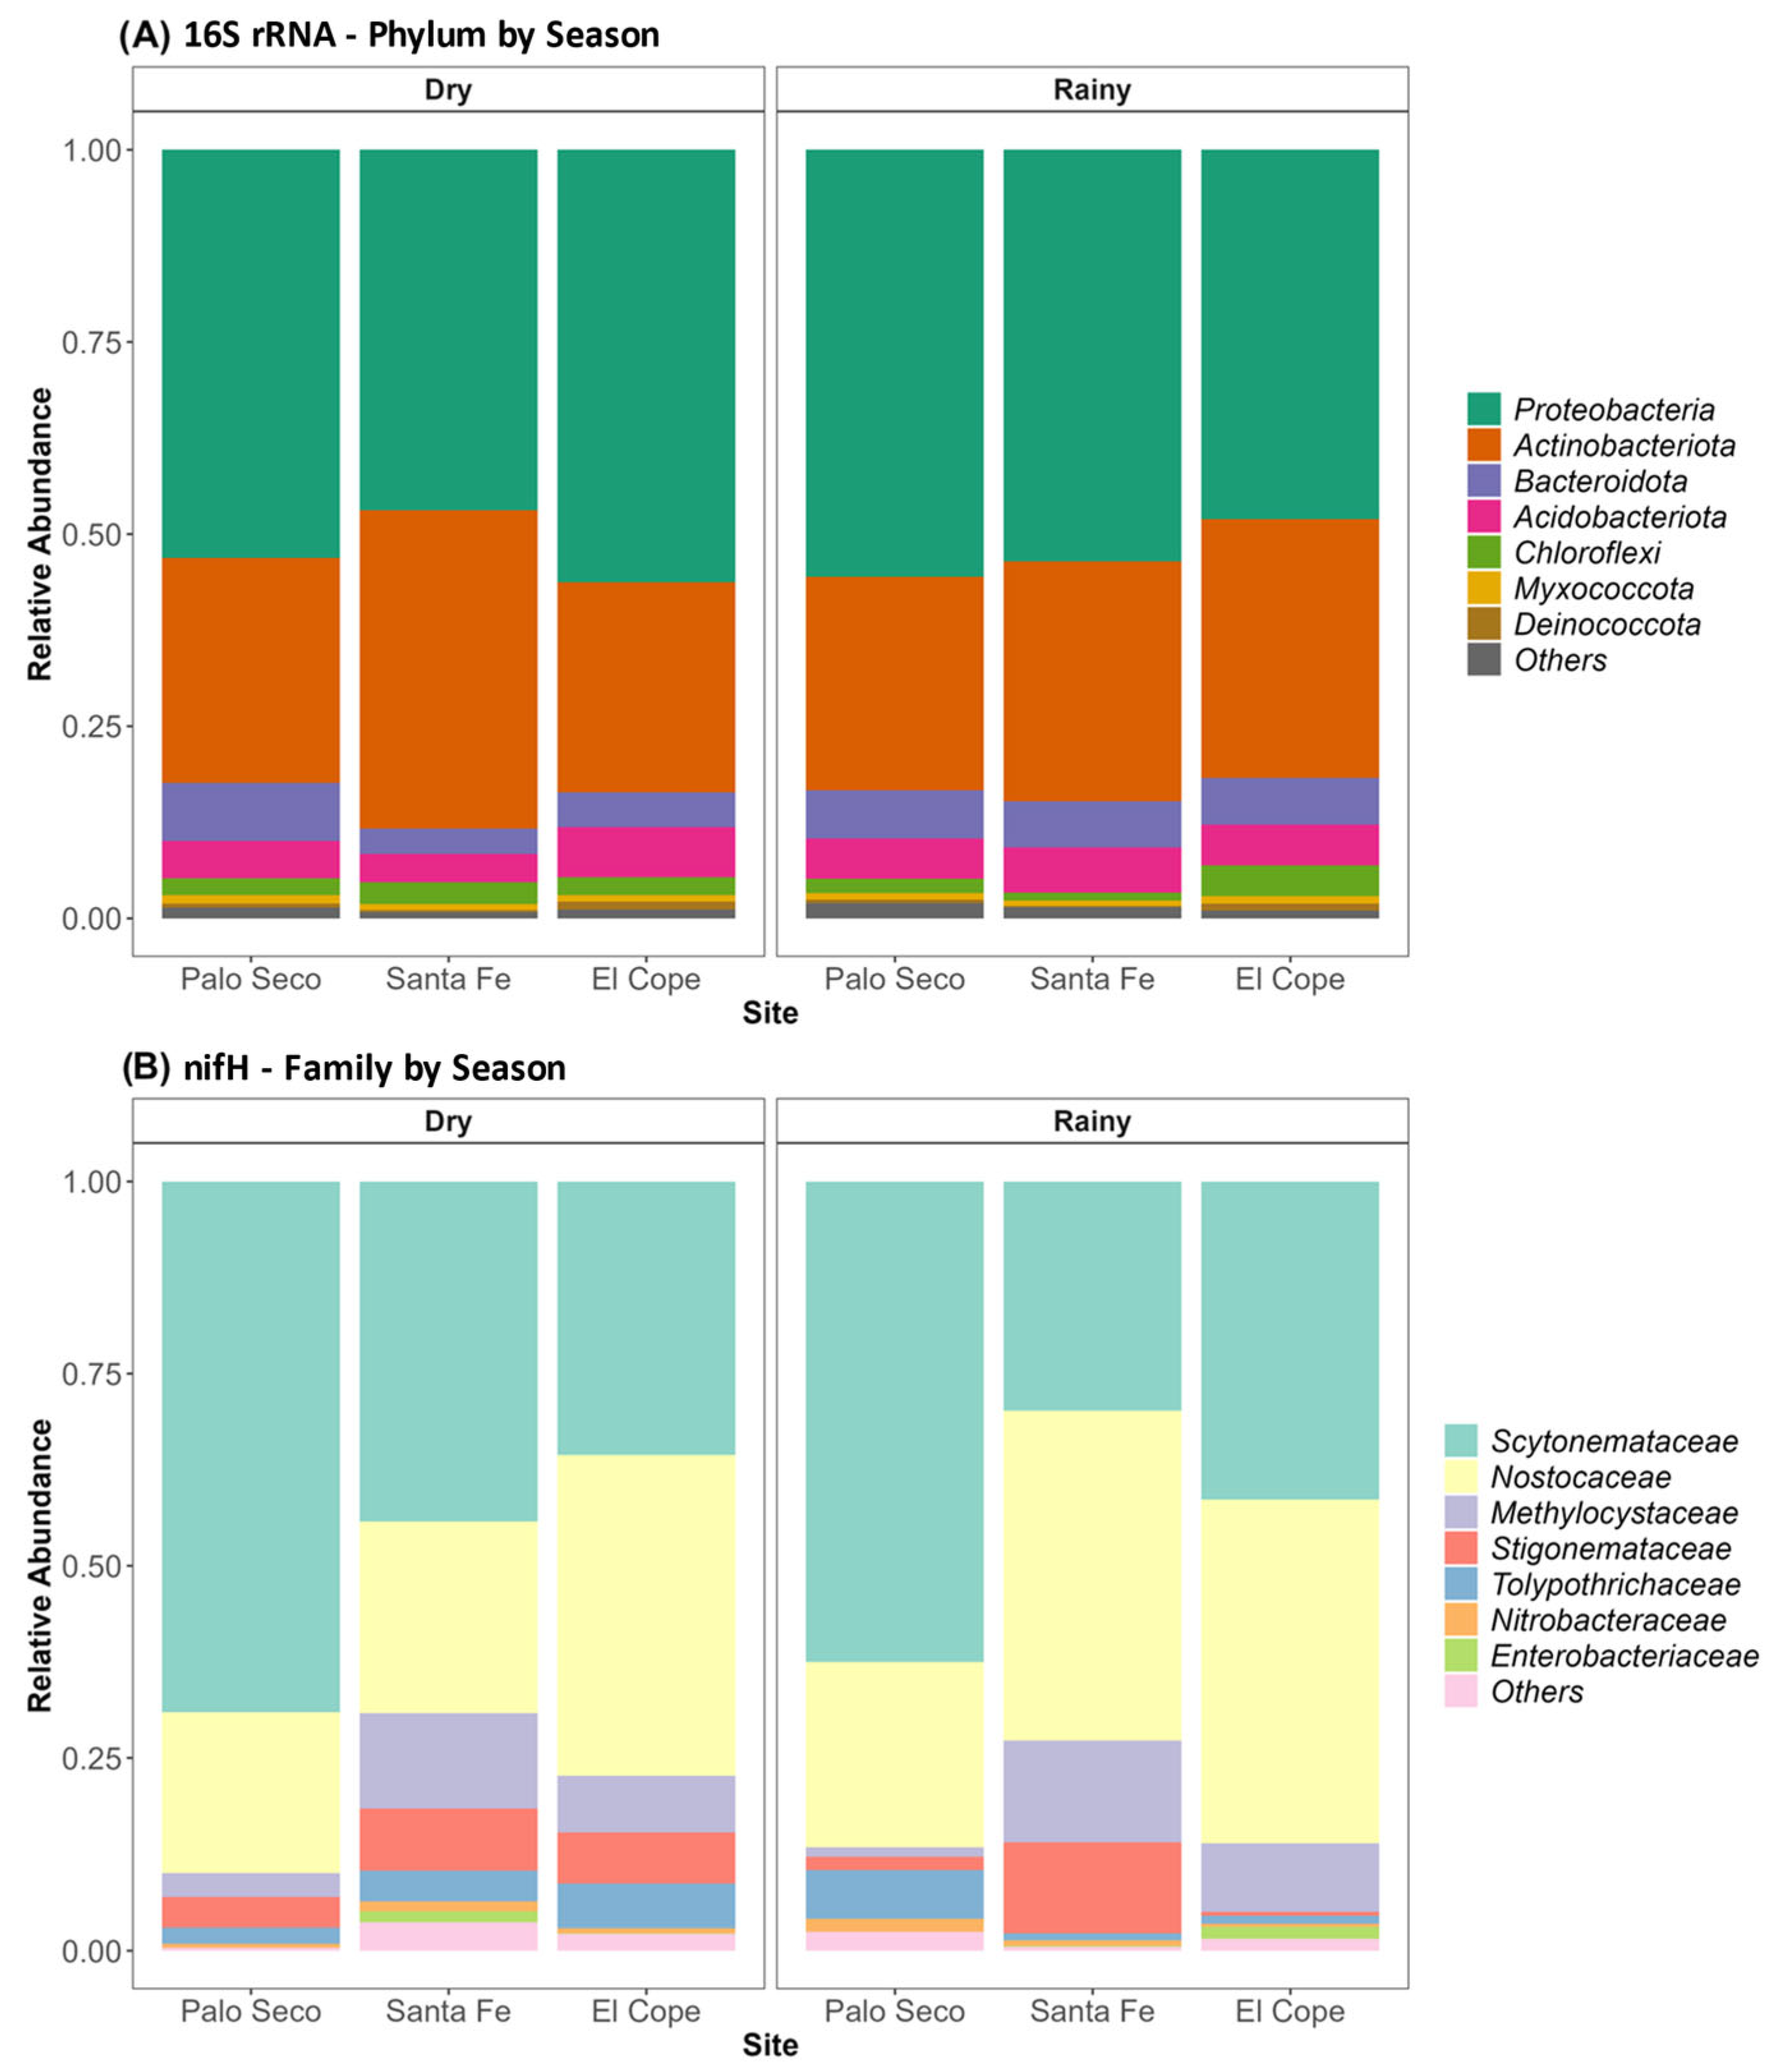
3.2. Bacterial Community Composition in the Phyllosphere of Z. pseudoparasitica

Our 16S rRNA metabarcoding analysis recovered a total of 2969 ASVs across 30 individuals of Zamia pseudoparasitica. Sequencing depth per sample averaged 1710 ± 211 reads (range: 892–1784). Communities were dominated by the phylum Proteobacteria (52.4%), followed by Actinobacteriota (31.6%), Bacteriota (5.6%), Acidobacteriota (5.6%), and Chloroflexi (2.4%), all of which, together, represented 97.3% of the ASVs (Figure 2A). The 10 most abundant bacterial orders were Rhizobiales (30.3%), Frankiales (11.7%), Pseudonocardiales (6.1%), Acetobacteriales (5.6%), Caudobacteriales (4.6%), Sphingomonadales (4.5%), Acidobacteriales (4.3%), Solirubrobacteriales (3.9%), Cytophagales (3.4%), and Burkholderiales (3.0%). Beijerinckiaceae was the most abundant family. We were able to identify 242 genera, represented mainly by Methylocella (13.3%, Proteobacteria), 1174-901-12 (9.3%, Proteobacteria) and Jatrophihabitans (5.7%, Actinobacteriota). After filtering out taxa using a prevalence threshold of 75%, we found a core microbiome composed of 68 ASVs (Table S1) that was consistent across sites and seasons.
We detected 970 nifH ASVs across 30 individuals, with an average number of reads of 7371 ± 5435 reads per sample (range: 282–22,357). This diazotrophic bacterial community was predominantly composed of Cyanobacteria (92.4%), followed by Proteobacteria (4.7%) and Firmicutes (2.4%). The most abundant cyanobacterial families were Scytonemataceae (44.8%), Nostocaceae (34.1%), Stigonemataceae (4.8%), and Tolypothrichaceae (4.7%). In addition, the non-cyanobacterial family Methylocystaceae, which belongs to the class Alphaproteobacteria (Phylum Pseudomonadota), was moderately abundant (8.2%). We identified 32 genera of diazotrophic bacteria, represented mainly by Brasilonema (32.6%, Scytonemataceae), Stigonema (3.4%, Stigonemataceae), and Methylocystis (3.3%, Methylocystaceae). Five nifH ASVs were prevalent across samples, all of which belonged to the phylum Cyanobacteria, with three assigned to the class Cyanophyceae and one to the genus Brasilonema (Scytonemataceae), a known filamentous cyanobacterium. The remaining ASVs lacked reliable taxonomic resolution beyond the phylum level (Table S2).
Alpha diversity estimates showed no statistically significant differences across sites or between seasons for either the 16S rRNA (Observed: p-value = 0.84; Shannon: p-value = 0.92) or nifH (Observed: p-value = 0.19; Shannon: p-value = 0.21) genes (Figure 3). However, visual inspection revealed some consistent patterns. For the 16S rRNA gene dataset (Figure 3A), samples from Palo Seco tended to show higher richness than those from Santa Fe, regardless of season, while El Copé exhibited intermediate values. For the nifH dataset (Figure 3B), diversity was more variable across sites and seasons, but El Copé tended to have higher diversity during the dry season compared to the other sites. These trends, while not statistically significant, may reflect site-specific ecological or microclimatic factors influencing phyllosphere microbial richness.
PERMANOVA based on Bray-Curtis distances revealed significant differences in bacterial community composition between sites for both the 16S rRNA gene (R2 = 0.106, p-value = 0.001) and nifH datasets (R2 = 0.085, p-value = 0.001) (Figure 4; Table S4). However, no differences were seen between the rainy and dry seasons (16S: R2 = 0.018, p-value = 0.15; nifH: R2 = 0.018, p-value = 0.47), although there was a significant interaction between site and season in the 16S rRNA data (16S rRNA gene: R2 = 0.42, p-value = 0.019; nifH: R2 = 0.40, p-value = 0.358). Similar results were obtained when using weighted UniFrac distances, where significant differences were detected between sites and for the site × season interaction (Table S3). Beta dispersion tests confirmed that community dispersion among sites was homogeneous for both markers (16S rRNA gene: p-value = 0.39; nifH: p-value = 0.56). While no differences in communities were seen within sites between the rainy and dry seasons, pairwise comparisons showed some statistically significant differences in community composition between sites and seasons for both the 16S rRNA and nifH genes, but these explained only a small portion of the variation (Table 2).

3.3. Beta Diversity Partitioning

To further explore variation in phyllosphere microbial communities across sites and seasons, we calculated the beta Net Relatedness Index (βNRI) using the 16S rRNA dataset. This index quantifies whether microbial communities are phylogenetically more related than expected under a null model and is also more sensitive to community structure when communities have similar richness but different phylogenetic composition. Across sites, microbial communities exhibited consistently negative βNRI values, suggesting that taxa within and between sites were more closely related than expected by chance, indicative of strong environmental filtering or habitat similarity shaping phylogenetic structure (Figure 5). Notably, βNRI differed significantly among sites for both rainy (Figure 5A) and dry (Figure 5B) seasons. In the rainy season, Santa Fe had significantly lower values than both Palo Seco and El Copé (p < 0.05). In the dry season, both Santa Fe and El Copé showed similar levels of phylogenetic clustering (mean βNRI ≈ –2.7), which was significantly lower than that found in Palo Seco (p < 0.001), suggesting stronger selection of closely related taxa at these two sites. These patterns suggest that although taxonomic composition may vary across space, evolutionary constraints or shared environmental filters promote the assembly of closely related microbial lineages in the phyllosphere of Z. pseudoparasitica.

3.4. Comparison of the Diazotrophic Communities Identified by 16S rRNA and nifH Markers

To evaluate the extent to which diazotrophic communities identified by functional and taxonomic markers overlapped, we compared the taxa identified using the nifH marker with those inferred from the 16S rRNA gene. A total of 24 putative nitrogen-fixing families were detected: 16 were unique to the nifH dataset, and eight were detected by both 16S rRNA and nifH genes (Table 3). Among these, members of Cyanobacteria and Proteobacteria were most common in the nifH gene dataset, while the genera Bradyrhizobium, Xanthomonas, and Methylocystis (all Proteobacteria) dominated the diazotrophic bacteria that were identified with 16S rRNA gene. Notably, all families detected in the 16S rRNA gene diazotroph subset were also present in the nifH gene dataset, and no diazotrophic families were found to be exclusive to the 16S rRNA gene dataset. However, Cyanobacteria were underrepresented in the 16S dataset, when compared to the nifH dataset. The Bray–Curtis similarity index between the two datasets was 0.28, indicating moderate overlap.

4. Discussion

We found that the communities of bacteria in the phyllosphere of Z. pseudoparasitica showed few differences across distinct forest sites or between seasons (dry and rainy) for both the complete bacterial (16S rRNA) and functional diazotroph (nifH) communities. No differences were found in alpha diversity, and although our results showed statistically significant differences in community composition (PERMANOVA, p < 0.05), the proportion of variation explained by these factors was relatively low, as seen in the R2 values (Sites = 0.106, Season = 0.018 for 16S, and Sites = 0.085, Season = 0.018 for nifH). This contrasts with our initial hypothesis and with previous findings in tropical areas, where both seasonality [13,42,54,55,56,57] and geographic location [22,54,58] have been shown to significantly impact phyllosphere bacterial community composition and diversity. This apparent compositional stability, even across areas with marked differences in rainfall between wet and dry seasons, may be explained by the consistently high humidity, limited temperature fluctuations, and stable canopy microclimates at our sites that are typical of tropical cloud forests. Additionally, as we sampled mature, long-lived leaves, the detected microbiome likely represents a stable, resident community in the biofilms covering the leaves rather than one undergoing frequent restructuring. It is possible that had we sampled younger plants or emerging leaves, more variability in the phyllosphere communities would have been detected.
The βNRI analysis provided additional insight into the phylogenetic structure of these communities. Most comparisons between sites and seasons showed significantly negative βNRI values, indicating that microbial communities were more phylogenetically clustered than expected. This supports our conclusion that deterministic processes, particularly environmental filtering, may be the dominant driver of community assembly in this environment, leading to the co-occurrence of closely related taxa across samples [59,60]. However, given that environmental variables such as temperature, humidity, and canopy openness did not vary significantly across sites, this phylogenetic clustering may also reflect host-associated selective pressures, such as leaf morphology, chemical exudates, or the long-lived nature of Z. pseudoparasitica leaves, rather than site-specific environmental factors. Spatial separation between sites, despite their similar microclimates, could also restrict microbial dispersal or reflect historical differences in community composition. Previous studies have demonstrated that microbial biogeography can arise from both environmental filtering and dispersal constraints, even across relatively short distances in tropical ecosystems [61]. Thus, while our results indicate a strong role of host and season, we cannot exclude that spatial distance between sites also contributes to structuring phyllosphere communities in Z. pseudoparasitica.
Across all samples, Proteobacteria and Actinobacteriota dominated the total bacterial community. Significant abundances of the phyla Bacteroidetes, Acidobacteria, and Chloroflexi were also detected, and our core microbiome analysis identified a small group of ASVs consistently present across ≥75% of samples for both 16S rRNA and nifH markers. These core taxa likely represent a resident microbial assemblage adapted to the long-lived leaves and stable canopy environment of Z. pseudoparasitica. Previous research has shown that the taxonomic composition of the phyllosphere is relatively limited compared to other habitats, with predominance of Proteobacteria, Actinobacteria, Firmicutes, and Bacteroidetes [22,37,54,62,63,64]. Bacteria belonging to the phylum Proteobacteria are recognized for their rich metabolic diversity and wide range of potential functions within the leaf bacterial community, including methylotrophy, nitrification, nitrogen fixation, and anoxygenic photosynthesis [26,65,66]. Additionally, the phyla Bacteroidetes and Actinobacteria play a diverse ecological role [67]. Bacteroidetes are frequently involved in the degradation of organic matter, and some taxa contribute to plant growth promotion, nutrient provision, or protection against pathogens. Actinobacteria are well recognized for their roles in decomposition and nutrient cycling, and some species are also implicated in bioremediation, bioweathering, the production of secondary metabolites, and plant growth promotion [68,69,70,71]. The most prominent bacterial genera, such as Methylobacterium, Bradyrhizobium, Pseudomonas, Bacillus, Massilia, Sphingomonas, Arthrobacter, and Pantoea, are common and prevalent microbial taxa present in tropical forests [54,72,73,74]. These genera may be competitive in the phyllosphere environment due to their abilities to both modify the challenging environment to enhance their colonization and establishment [75] and because they have traits that may enhance plant growth [76,77]. For example, Methylobacterium are facultative methylotrophs capable of utilizing single-carbon compounds such as methanol or methane, and some strains can also fix nitrogen [78]. Their presence suggests active metabolic engagement with host leaf exudates. The genera 1174-901-12 (Rhizobiales), Sphingomonas, and Methylobacterium have been shown to increase in plants infected by Pseudomonas syringae pv. actinidiae, a bacterial canker, suggesting potential antagonistic properties of these bacteria against phytopathogens. Our ability to detect a variety of known plant-growth-promoting genera in the phyllosphere of Z. pseudoparasitica at all three of our sampling sites suggests that there are active interactions between the host plant and the microbes inhabiting their leaf surfaces. This also likely contributes to the stability of these communities throughout the year.
This study, in combination with recent work by Sierra et al. [33] who studied leaf endophytes of Z. pseudoparasitica from El Copé, expands our knowledge of the bacterial communities associated with the leaf tissues of this unique plant. The high abundance of Frankiales and Rhizobiales in our dataset aligns with previous reports identifying Frankia-related taxa as important endophytes and their potential role in modulating host chemical profiles [33]. Phyllosphere microbes likely play a significant role in the functional adaptations of this endangered plant group [33,79]. Integrating the epiphytic phyllosphere microbiota with leaf and root endophytes will provide a more holistic understanding of the chemical symbiotic relationships that define cycads as holobionts [80].
The combined use of 16S rRNA and nifH markers provides us with a more complete picture of the structure and functional potential of the Z. pseudoparasitica phyllosphere microbiome than can be inferred from the analysis of a single gene region. While the 16S rRNA marker captured the broad taxonomic composition of the total bacterial community, it primarily identified taxa in the Proteobacteria and showed low resolution for some functionally important groups such as carbon and nitrogen-fixing Cyanobacteria. In contrast, the nifH primer set, which specifically targets diazotrophic bacteria, revealed a community strongly dominated by Cyanobacteria, particularly the families Scytonemataceae and Nostocaceae, but failed to amplify many known diazotrophic bacteria from other phyla. Technical biases likely caused these differences. Accurate identification of Cyanobacteria using the 16S rRNA gene can be difficult due to historical systematic inconsistencies and errors in commonly used reference databases. We also filtered out all sequences assigned to the order “Chloroplast” prior to calculating relative abundances, and it is possible that some legitimate Cyanobacteria ASVs were eliminated during the step in the analytical pipeline. In contrast, the nifH polF/R primer clearly amplified Cyanobacteria with ease in our study, despite in silico tests showing that they better capture the diversity of Proteobacteria than Cyanobacteria [45]. These results highlight the importance of using multiple loci, and functional gene markers in particular, to uncover ecologically relevant microbial guilds that may be missed by 16S rRNA gene surveys alone.

5. Conclusions

Our study illustrates that the phyllosphere of Z. pseudoparasitica is a complex but stable community that varies little across time and space in mature plants, despite our sampling locations being geographically isolated from each other and strong seasonal effects in the quantity of precipitation throughout the year. Facultative diazotrophic and methanotrophic bacteria were common in these communities, some of which also have known phytopathogenic properties. While we cannot infer from our data that biological nitrogen fixation or cycling of other nutrients are active processes in these phyllosphere environments, the potential for important ecosystem functions to occur is demonstrated by our results. In addition, while much is yet to be learned about how epiphytic plants interact with their environment, our results point to the ability of Z. pseudoparasitica to select and shape its phyllosphere community, possibly to maximize important functions such as nutrient cycling in the phyllosphere. Considering that the cycads, such as Zamia, first originated 300 mya [29], these associations could represent ancient symbioses that may have played a role in the diversification of the group across the tropics. However, this homogeneity in their microbiome may also make these plants more vulnerable to environmental change, as key bacterial partners could become isolated from these communities. Maintenance of mature tropical cloud forest habitat is key to ensuring the future of this intriguing epiphytic plant.

Supplementary Materials

The following supporting information can be downloaded at: https://www.mdpi.com/article/10.3390/applbiosci4030035/s1. Table S1: Core microbiome of the Z. pseudoparasitica phyllosphere (16S rRNA gene dataset); Table S2: Core diazotrophic taxa in the Z. pseudoparasitica phyllosphere (nifH gene dataset); Table S3: PERMANOVA based on weighted UniFrac distance; Table S4: Variation in phyllosphere microbial community composition explained by seasonal and site factors (PERMANOVA on Bray–Curtis dissimilarities).

Author Contributions

Conceptualization, L.R.-C. and J.C.V.A.; methodology, L.R.-C., J.C.V.A. and K.S.; formal analysis, L.R.-C.; investigation, L.R.-C.; resources, L.R.-C. and K.S.; data curation, L.R.-C.; writing—original draft preparation, L.R.-C.; writing—review and editing, L.R.-C., A.M.S., J.C.V.A., and K.S.; visualization, L.R.-C. and A.M.S.; supervision, K.S. and J.C.V.A.; project administration, L.R.-C.; funding acquisition, L.R.-C. All authors have read and agreed to the published version of the manuscript.

Funding

L.R.-C. This research was funded by a Smithsonian Institution Short Term Fellowship awarded to L.R-C. and SENACYT student research funds, awarded through the Department of Microbiology at the University of Panamá. A.M.S. Funded from the NSERC CREATE program through the Biodiversity, Ecosystem Services and Sustainability (BESS) doctoral scholarship, Canada. JCV-A acknowledges the Canada Research Chair (950-232698), the CRNSG-RGPIN 05967–2016, and the Canadian Foundation for Innovation (projects 36781, 39135).

Institutional Review Board Statement

Not applicable.

Informed Consent Statement

Not applicable.

Data Availability Statement

All supporting data can be accessed through Smithsonian FigShare at [10.25573/data.29321606]. Raw fastq files and metadata can be found in the NCBI SRA archive in BioProject [PRJNA1274491].

Acknowledgments

We thank Pedro Castillo for assistance with field collections and Marta Vargas for laboratory assistance. All lab work was performed in the Naos Molecular Laboratory at the Smithsonian Tropical Research Institute in Panama. L.R.-C. thanks the faculty of the Environmental Microbiology Program, Department of Microbiology, the International Garden of Cycads, and the Panamanian Carbon Observation Tower Alliance (PANACOTA) at the University of Panama for their support.

Conflicts of Interest

The authors declare no conflicts of interest. The funders had no role in the design of the study; in the collection, analysis, or interpretation of the data; in the writing of the manuscript; or in the decision to publish the results.

Abbreviations

The following abbreviations are used in this manuscript:
βNRIBeta Net Relatedness Index
ASVAmplicon Sequence Variant
m.a.s.l.Meters above sea level

References

  1. Cardelús, C.L.; Colwell, R.K.; Watkins, J.E.J.R. Vascular epiphyte distribution patterns: Explaining the mid-elevation richness peak. J. Ecol. 2006, 94, 144–156. [Google Scholar] [CrossRef]
  2. Hietz, P.; Hietz-Seifert, U. Composition and ecology of vascular epiphyte communities along an altitudinal gradient in central Veracruz, Mexico. J. Veg. Sci. 1995, 6, 487–498. [Google Scholar] [CrossRef]
  3. Hietz, P.; Hietz-Seifert, U. Intra-and interspecific relations within an epiphyte community in a Mexican humid montane forest. Selbyana 1995, 16, 135–140. [Google Scholar]
  4. Rosa-Manzano, E.; Guerra-Pérez, A.; Mendieta-Leiva, G.; Mora-Olivo, A.; Martínez-Ávalos, J.G.; Arellano-Méndez, L.U. Vascular epiphyte diversity in two forest types of the “El Cielo” Biosphere Reserve, Mexico. Botany 2017, 95, 599–610. [Google Scholar] [CrossRef]
  5. Woods, C.L.; Cardelús, C.L.; DeWalt, S.J. Microhabitat associations of vascular epiphytes in a wet tropical forest canopy. J. Ecol. 2015, 103, 421430. [Google Scholar] [CrossRef]
  6. Nadkarni, N.M. Complex consequences of disturbance on canopy plant communities of world forests: A review and synthesis. New Phytol. 2023, 240, 1366–1380. [Google Scholar] [CrossRef] [PubMed]
  7. Zhu, Y.-G.; Xiong, C.; Wei, Z.; Chen, Q.-L.; Ma, B.; Zhou, S.-Y.; Tan, J.; Zhang, L.-M.; Cui, H.-L.; Duan, G.-L. Impacts of global change on the phyllosphere microbiome. New Phytol. 2022, 234, 1977–1986. [Google Scholar] [CrossRef]
  8. Bell-Doyon, P.; Laroche, J.; Saltonstall, K.; Villarreal Aguilar, J.C. Specialized bacteriome uncovered in the coralloid roots of the epiphytic gymnosperm, Zamia pseudoparasitica. Environ. DNA 2020, 2, 418–428. [Google Scholar] [CrossRef]
  9. Sierra, A.M.; Toupin, S.; Alonso-García, M.; Villarreal, A.J.C. Diversity of symbiotic cyanobacteria in cycad coralloid roots using a short-read rbcL-X amplicon. Symbiosis 2024, 92, 271–288. [Google Scholar] [CrossRef]
  10. Stone, B.W.G.; Weingarten, E.A.; Jackson, C.R. The role of the phyllosphere microbiome in plant health and function. Annu. Plant Rev. Online 2018, 1, 533–556. [Google Scholar]
  11. Vorholt, J.A. Microbial life in the phyllosphere. Nat. Rev. Microbiol. 2012, 10, 828–840. [Google Scholar] [CrossRef]
  12. Laforest-Lapointe, I.; Messier, C.; Kembel, S.W. Host species identity, site and time drive temperate tree phyllosphere bacterial community structure. Microbiome 2016, 4, 27. [Google Scholar] [CrossRef] [PubMed]
  13. Redford, A.J.; Fierer, N. Bacterial succession on the leaf surface, a novel system for studying successional dynamics. Microb. Ecol. 2009, 58, 189–198. [Google Scholar] [CrossRef]
  14. Doan, H.K.; Ngassam, V.N.; Gilmore, S.F.; Tecon, R.; Parikh, A.N.; Leveau, J.J.H. Topography-Driven shape, Spread, and Retention of Leaf Surface Water Impacts Microbial Dispersion and Activity in the Phyllosphere. Phytobiomes J. 2020, 4, 268–280. [Google Scholar] [CrossRef]
  15. Remus-Emsermann, M.N.; De Oliveira, S.; Schreiber, L.; Leveau, J.J.H. Quantification of lateral heterogeneity in carbohydrate permeability of isolated plant leaf cuticles. Front. Microbiol. 2011, 2, 12467. [Google Scholar] [CrossRef] [PubMed]
  16. Brader, G.; Compant, S.; Vescio, K.; Mitter, B.; Trognitz, F.; Ma, L.-J.; Sessitsch, A. Ecology and Genomic Insights into Plant-Pathogenic and Plant-Nonpathogenic Endophytes. Annu. Rev. Phytopath. 2017, 55, 61–83. [Google Scholar] [CrossRef]
  17. Truchado, P.; Gil, M.I.; Moreno-Candel, M.; Allende, A. Impact of weather conditions, leaf age and irrigation water disinfection on the major epiphytic bacterial genera of baby spinach grown in an open field. Food Microbiol. 2019, 78, 46–52. [Google Scholar] [CrossRef]
  18. Hacquard, S.; Martin, F.M.; Wang, E. Impact of global chance on the plant microbiome. New Phytol. 2022, 234, 181–187. [Google Scholar] [CrossRef]
  19. Hirano, S.S.; Upper, C.D. Bacteria in the Leaf Ecosystem with Emphasis on Pseudomonas syringae—A Pathogen, Ice Nucleus, and Epiphyte. Microbiol. Molec. Biol. Rev. 2000, 64, 624–653. [Google Scholar] [CrossRef]
  20. Lindow, S.E.; Leveau, J.H.J. Phyllosphere microbiology. Curr. Opin. Biotechnol. 2002, 13, 238–243. [Google Scholar] [CrossRef]
  21. Boutin, S.; Lussier, E.; Laforest-Lapointe, I. Investigating the spatiotemporal dynamics of apple tree phyllosphere bacterial and fungal communities across cultivars in orchards. Can. J. Microbiol. 2024, 70, 238–251. [Google Scholar] [CrossRef] [PubMed]
  22. Redford, A.J.; Bowers, R.M.; Knight, R.; Linhart, Y.; Fierer, N. The ecology of the phyllosphere: Geographic and phylogenetic variability in the distribution of bacteria on tree leaves. Environ. Microbiol. 2010, 12, 2885–2893. [Google Scholar] [CrossRef] [PubMed]
  23. Moyes, A.B.; Kueppers, L.M.; Pett-Ridge, J.; Carper, D.L.; Vandehey, N.; O’Neil, J.; Frank, C. Evidence for foliar endophytic nitrogen fixation in a widely distributed subalpine conifer. New Phytol. 2016, 210, 657–668. [Google Scholar] [CrossRef] [PubMed]
  24. Dorokhov, Y.L.; Sheshukova, E.V.; Komarova, T.V. Methanol in Plant Life. Front. Plant Sci. 2018, 9, 1623. [Google Scholar] [CrossRef]
  25. Lajoie, G.; Maglione, R.; Kembel, S.W. Adaptive matching between phyllosphere bacteria and their tree hosts in a neotropical forest. Microbiome 2020, 8, 1–10. [Google Scholar] [CrossRef]
  26. Fürnkranz, M.; Wanek, W.; Richter, A.; Abell, G.; Rasche, F.; Sessitsch, A. Nitrogen fixation by phyllosphere bacteria associated with higher plants and their colonizing epiphytes of a tropical lowland rainforest of Costa Rica. ISME J. 2008, 2, 561–570. [Google Scholar] [CrossRef]
  27. Camelo, C.; Vera, S.; Bonilla, R. Mecanismos de acción de las rizobacterias promotoras del crecimiento vegetal. Corpoica. Cienc. Y Tecnol. Agropecu. 2011, 12, 159–166. Available online: http://www.redalyc.org/articulo.oa?id=449945031010 (accessed on 21 April 2021). [CrossRef]
  28. Spicer, M.E.; Woods, C.L. A case for studying biotic interactions in epiphyte ecology and evolution. Perspect. Plant Ecol. Evol. Syst. 2022, 54, 125658. [Google Scholar] [CrossRef]
  29. Taylor, A.S.; Haynes, J.L.; Stevenson, D.W.; Holzman, G.; Mendieta, J. Biogeographic Insights in Central American Cycad Biology. In Global Advances in Biogeography; Stevens, L., Ed.; InTech: Rijeka, Croatia, 2012; pp. 73–98. Available online: www.intechopen.com (accessed on 13 September 2022).
  30. Stevenson, D.W. The Zamiaceae in Panama with comments on phytogeography and species relationships. Brittonia 1993, 45, 1–16. [Google Scholar] [CrossRef]
  31. Bell-Doyon, P.; Villarreal, A.J.C. New Notes on the Ecology of the Epiphytic Gymnosperm and Panamanian Endemic Zamia pseudoparasitica. Neotrop. Nat. 2020, 2, 1–7. [Google Scholar]
  32. Monteza-Moreno, C.M.; Rodriguez-Castro, L.; Castillo-Caballero, P.L.; Toribio, E.; Saltonstall, K. Arboreal camera trapping sheds light on seed dispersal of the world’s only epiphytic gymnosperm: Zamia pseudoparasitica. Ecol. Evol. 2022, 12, e8769. [Google Scholar] [CrossRef]
  33. Sierra, A.M.; Meléndez, O.; Bethancourt, R.; Bethancourt, A.; Rodríguez-Castro, L.; López, C.A.; Sedio, B.E.; Saltonstall, K.; Villarreal, A.J.C. Leaf Endophytes Relationship with Host Metabolome Expression in Tropical Gymnosperms. J. Chem. Ecol. 2024, 50, 815–829. [Google Scholar] [CrossRef] [PubMed]
  34. Instituto de Meteorología e Hidrología de Panamá (IMHPA). Available online: https://www.imhpa.gob.pa/es/ (accessed on 7 January 2025).
  35. Tichý, L. Field test of canopy cover estimation by hemispherical photographs taken with a smartphone. J. Veg. Sci. 2015, 27, 427–435. [Google Scholar] [CrossRef]
  36. Rueden, C.; Dietz, C.; Horn, M.; Schindelin, J.; Northan, B.; Berthold, M.; Eliceiri, Y.K. ImageJ Ops, version 2.2.0; ImageJ Project: Madison, WI, USA, 2021. Available online: https://imagej.net/Ops (accessed on 25 October 2024).
  37. Kembel, S.W.; O’Connor, T.K.; Arnold, H.K.; Hubbell, S.P.; Wright, S.J.; Green, J.L. Relationships between phyllosphere bacterial communities and plant functional traits in a neotropical forest. Proc. Natl. Acad. Sci. USA 2014, 111, 13715–13720. [Google Scholar] [CrossRef]
  38. Hanshew, A.S.; Mason, C.M.; Raffa, K.F.; Currie, C.R. Minimization of chloroplast contamination in 16S rRNA gene pyrosequencing of insect herbivore bacterial communities. J. Microbiol. Meth. 2013, 95, 149–155. [Google Scholar] [CrossRef] [PubMed]
  39. Callahan, B.J.; Wong, J.; Heiner, C.; Steve, O.H.; Theriot, C.M.; Gulati, A.S.; McGill, S.K.; Dougherty, M.K. High-throughput amplicon sequencing of the full-length 16S rRNA gene with single-nucleotide resolution. Nucleic Acids Res. 2019, 47, e103. [Google Scholar] [CrossRef]
  40. Moynihan, M.A.; Reeder, C.F. moyn413/nifHdada2, version 2.0.5; Zenodo: Geneva, Switzerland, 2023. [CrossRef]
  41. Callahan, B.; McMurdle, P.; Rosen, M.; Han, A.; Johnson, A.; Holmes, S. DADA2: High-resolution sample inference from Illumina amplicon data. Nat. Meth. 2016, 13, 581–583. [Google Scholar] [CrossRef] [PubMed]
  42. R Core Team. R: A Language and Environment for Statistical Computing. In R Foundation for Statistical Computing; R Core Team: Vienna, Austria, 2023; Available online: https://www.R-project.org/ (accessed on 14 October 2024).
  43. Martin, M. Cutadapt Removes Adapter Sequences from High-Throughput Sequencing Reads. EMBnet. J. 2011, 17, 10–12. [Google Scholar] [CrossRef]
  44. Yilmaz, P.; Parfrey, L.W.; Yarza, P.; Gerken, J.; Pruesse, E.; Quast, C.; Schweer, T.; Peplies, J.; Ludwig, W.; Glöckner, F.O. The SILVA and “all-species living tree project (LTP)” taxonomic frameworks. Nucleic Acids Res. 2014, 42, D643–D648. [Google Scholar] [CrossRef]
  45. Gaby, J.C.; Buckley, D.H. A comprehensive, aligned nifH gene database: A multi-purpose tool for studies of nitrogen-fixing bacteria. Database. 2014, 2014, bauoo1. [Google Scholar] [CrossRef]
  46. McMurdie, P.J.; Holmes, S. phyloseq: An R Package for Reproducible Interactive Analysis and Graphics of Microbiome Census Data. PLoS ONE 2013, 8, e61217. [Google Scholar] [CrossRef]
  47. Davis, N.M.; Proctor, D.M.; Holmes, S.P.; Relman, D.A.; Callahan, B.J. Simple statistical identification and removal of contaminant sequences in marker-gene and metagenomics data. Microbiome 2018, 6, 226. [Google Scholar] [CrossRef] [PubMed]
  48. Schliep, K.P. phangorn: Phylogenetic analysis in R. Bioinformatics 2011, 27, 592–593. [Google Scholar] [CrossRef] [PubMed]
  49. Oksanen, J.; Simpson, G.L.; Blanchet, F.G.; Kindt, R.; Legendre, P.; Minchin, P.R.; O’Hara, R.; Solymos, P.; Stevens, M.H.H.; Szoecs, E.; et al. vegan: Community Ecology Package, version 2.5-6; R Foundation for Statistical Computing: Vienna, Austria, 2019. [Google Scholar]
  50. Chase, J.M.; Kraft, N.J.B.; Smith, K.G.; Vellend, M.; Inouye, B.D. Using null models to disentangle variation in community dissimilarity from variation in α-diversity. Ecosphere 2011, 2, art24. [Google Scholar] [CrossRef]
  51. Liu, C.; Cui, Y.; Li, X.; Yao, M. microeco: An R package for data mining in microbial community ecology. FEMS Microbiol. Ecol. 2021, 97, fiaa255. [Google Scholar] [CrossRef]
  52. Kembel, S.W.; Cowan, P.D.; Helmus, M.R.; Cornwell, W.K.; Morlon, H.; Ackerly, D.D.; Blomberg, S.P.; Webb, C.O. Picante: R tools for integrating phylogenies and ecology. Bioinformatics 2010, 26, 1463–1464. [Google Scholar] [CrossRef]
  53. Stegen, J.C.; Lin, X.; Fredrickson, J.K.; Chen, X.; Kennedy, D.W.; Murray, C.J.; Rockhold, M.L.; Konopka, A. Quantifying community assembly processes and identifying features that impose them. ISME J. 2013, 7, 2069–2079. [Google Scholar] [CrossRef]
  54. Rastogi, G.; Sbodio, A.; Tech, J.J.; Suslow, T.V.; Coaker, G.L.; Leveau, J.H. Leaf microbiota in an agroecosystem: Spatiotemporal variation in bacterial community composition on field-grown lettuce. Int. Soc. Microb. Ecol. J. 2012, 6, 1812–1822. [Google Scholar] [CrossRef]
  55. Bao, L.; Gu, L.; Sun, B.; Cai, W.; Zhang, S.; Zhuang, G.; Bai, Z.; Zhuang, X. Seasonal variation of epiphytic bacteria in the phyllosphere of Gingko biloba, Pinus bungeana and Sabina chinensis. FEMS Microbiol. Ecol. 2020, 96, fiaa017. [Google Scholar] [CrossRef]
  56. Copeland, J.K.; Yuan, L.; Layeghifard, M.; Wang, P.W.; Guttman, D.S. Seasonal community succession of the phyllosphere microbiome. Mol. Plant Microbe Interact. 2015, 28, 274–285. [Google Scholar] [CrossRef] [PubMed]
  57. Peñuelas, J.; Rico, J.; Ogaya, R.; Jump, A.S.; Terradas, J. Summer season and long-term drought increase the richness of bacteria and fungi in the foliar phyllosphere of Quercus ilex in a mixed Mediterranean forest. Plant Biol. 2012, 14, 565–575. [Google Scholar] [CrossRef]
  58. Finkel, O.M.; Burch, A.Y.; Lindow, S.E.; Post, A.F.; Belkin, S. Geographical location determines the population structure in phyllosphere microbial communities of a salt-excreting desert tree. Appl. Environ. Microbiol. 2011, 77, 7647–7655. [Google Scholar] [CrossRef]
  59. Stegen, J.C.; Lin, X.; Konopka, A.E.; Fredrickson, J.K. Stochastic and deterministic assembly processes in subsurface microbial communities. ISME J. 2012, 6, 1653–1664. [Google Scholar] [CrossRef]
  60. Tripathi, B.M.; Stegen, J.C.; Kim, M.; Dong, K.; Adams, J.M.; Lee, Y.K. Soil pH mediates the balance between stochastic and deterministic assembly of bacteria. ISME J. 2018, 12, 1072–1083. [Google Scholar] [CrossRef] [PubMed]
  61. Delmotte, N.; Knief, C.; Chaffron, S.; Innerebner, G.; Roschitzki, B.; Schlapbach, R.; von Mering, C.; Vorholt, J.A. Community proteogenomics reveals insights into the physiology of phyllosphere bacteria. Proc. Natl. Acad. Sci. USA 2009, 106, 16428–16433. [Google Scholar] [CrossRef] [PubMed]
  62. Martiny, J.B.H.; Bohannan, B.J.; Brown, J.H.; Colwell, R.K.; Fuhrman, J.A.; Green, J.L.; Horner-Devine, M.C.; Kane, M.; Krumins, J.A.; Kuske, C.R.; et al. Microbial biogeography: Putting microorganisms on the map. Nat. Rev. Microbiol. 2006, 4, 102–112. [Google Scholar] [CrossRef]
  63. Kecskeméti, E.; Berkelmann-Löhnertz, B.; Reineke, A. Are Epiphytic Microbial Communities in the Carposphere of Ripening Grape Clusters (Vitis vinifera L.) Different between Conventional, Organic, and Biodynamic Grapes? PLoS ONE 2016, 11, e0160852. [Google Scholar] [CrossRef] [PubMed]
  64. Grady, K.L.; Sorensen, J.W.; Stopnisek, N.; Guittar, J.; Shade, A. Assembly and seasonality of core phyllosphere microbiota on perennial biofuel crops. Nat. Commun. 2019, 10, 4135. [Google Scholar] [CrossRef]
  65. Atamna-Ismaeel, N.; Finkel, O.; Glaser, F.; von Mering, C.; Vorholt, J.A.; Koblížek, M.; Belkin, S.; Béjà, O. Bacterial anoxygenic photosynthesis on plant leaf surfaces. Environ. Microbiol. Rep. 2012, 4, 209–216. [Google Scholar] [CrossRef]
  66. Watanabe, K.; Kohzu, A.; Suda, W.; Yamamura, S.; Takamatsu, T.; Takenaka, A.; Koshikawa, M.K.; Hayashi, S.; Watanabe, M. Microbial nitrification in throughfall of a Japanese cedar associated with archaea from the tree canopy. SpringerPlus 2016, 5, 1596. [Google Scholar] [CrossRef]
  67. Romero, F.M.; Marina, M.; Pieckenstain, F.L. Novel components of leaf bacterial communities of field-grown tomato plants and their potential for plant growth promotion and biocontrol of tomato diseases. Res. Microbiol. 2016, 167, 222–233. [Google Scholar] [CrossRef] [PubMed]
  68. Liu, J.; Zhang, W.; Liu, Y.; Zhu, W.; Yuan, Z.; Su, X.; Ding, C. Differences in phyllosphere microbiomes among different Populus spp. in the same habitat. Front. Plant Sci. 2023, 14, 1143878. [Google Scholar] [CrossRef] [PubMed]
  69. Wang, Y.; Wu, J.; Sun, P.; Chen, C.; Shen, J. Community Structure of Phyllosphere Bacteria in Different Cultivars of Fingered Citron (Citrus medica ‘Fingered’) and Their Correlations With Fragrance. Front. Plant Sci. 2022, 13, 936252. [Google Scholar] [CrossRef]
  70. Yang, J.; Wang, Y.; Cui, X.; Xue, K.; Zhang, Y.; Yu, Z. Habitat filtering shapes the differential structure of microbial communities in the Xilingol grassland. Sci. Rep. 2019, 9, 19326. [Google Scholar] [CrossRef]
  71. Genitsaris, S.; Stefanidou, N.; Leontidou, K.; Matsi, T.; Karamanoli, K.; Mellidou, I. Bacterial Communities in the Rhizosphere and Phyllosphere of Halophytes and Drought-Tolerant Plants in Mediterranean Ecosystems. Microorganisms 2020, 8, 1708. [Google Scholar] [CrossRef] [PubMed]
  72. Rausch, C.; Daram, P.; Brunner, S.; Jansa, J.; Laloi, M.; Leggewie, G.; Amrhein, N.; Bucher, M. A phosphate transporter expressed in arbuscule-containing cells in potato. Nature 2001, 414, 462–470. [Google Scholar] [CrossRef]
  73. Lopez-Velasco, G.; Welbaum, G.E.; Boyer, R.R.; Mane, S.P.; Ponder, M.A. Changes in spinach phylloepiphytic bacteria communities following minimal processing and refrigerated storage described using pyrosequencing of 16S rRNA amplicons. J. Appl. Microbiol. 2011, 110, 1203–1214. [Google Scholar] [CrossRef]
  74. Knief, C.; Delmotte, N.; Chaffron, S.; Stark, M.; Innerebner, G.; Wassmann, R.; von Mering, C.; Vorholt, A.J. Metaproteogenomic analysis of microbial communities in the phyllosphere and rhizosphere of rice. ISME J. 2012, 6, 1378–1390. [Google Scholar] [CrossRef]
  75. Beattie, G.A.; Lindow, S.E. Bacterial colonization of leaves: A spectrum of strategies. Phytopathology 1999, 89, 353–359. [Google Scholar] [CrossRef]
  76. Innerebner, G.; Knief, C.; Vorholt, J.A. Protection of Arabidopsis thaliana against Leaf-Pathogenic Pseudomonas syringae by Sphingomonas Strains in a Controlled Model System. Appl. Environ. Microbiol. 2011, 77, 3202–3210. [Google Scholar] [CrossRef]
  77. Ottesen, A.R.; Gorham, S.; Pettengill, J.B.; Rideout, S.; Evans, P.; Brown, E. The impact of systemic and copper pesticide applications on the phyllosphere microflora of tomatoes. J. Sci. Food Agric. 2015, 95, 1116–1125. [Google Scholar] [CrossRef] [PubMed]
  78. Leducq, J.-B.; Sneddon, D.; Santos, M.; Condrain-Morel, D.; Bourret, G.; Martinez-Gomez, N.C.; Lee, J.A.; Foster, J.A.; Stolyar, S.; Shapiro, B.J.; et al. Comprehensive Phylogenomics of Methylobacterium Reveals Four Evolutionary Distinct Groups and Underappreciated Phyllosphere Diversity. Genome Biol. Evol. 2022, 14, evac123. [Google Scholar] [CrossRef] [PubMed]
  79. Roush, D.; Giraldo-Silva, A.; Garcia-Pichel, F. Cydrasil 3, a curated 16S rRNA gene reference package and web app for cyanobacterial phylogenetic placement. Sci. Data 2021, 8, 230. [Google Scholar] [CrossRef]
  80. Salzman, S.; Bustos-Díaz, E.D.; Whitaker, M.R.L.; Sierra, A.M.; Cibrián-Jaramillo, A.; Barona-Gómez, F.; Villarreal Aguilar, J.C. Chemical ecology of symbioses in cycads, an ancient plant lineage. New Phytol. 2025, 246, 1494–1504. [Google Scholar] [CrossRef] [PubMed]
Figure 1. (A) Map of Panama indicating the three sampling locations. (B) Female Zamia pseudoparasitica plant at Santa Fe National Park. A 20 cm scale bar is included for size reference. Photo replicated from Monteza et al. 2022; credit: Pedro Castillo.
Applbiosci 04 00035 g001
Figure 2. Relative abundance of the dominant taxa associated with the phyllosphere of Z. pseudoparasitica across three sampling sites and between two seasons. (A) Relative abundance of bacteria based on the 16S rRNA gene. Phyla with less than 0.5% relative abundance were grouped together and are shown as ‘Others’. (B) Relative abundance of diazotrophic bacteria based on the nifH gene. Families with less than 0.5% relative abundance were grouped as ‘Others’. The sample size per site was as follows: Palo Seco (n = 37), Santa Fe (n = 39), and El Copé (n = 39).
Applbiosci 04 00035 g002
Figure 3. Alpha diversity of Z. pseudoparasitica phyllosphere communities based on (A) all bacterial taxa (16S rRNA gene) and (B) the diazotrophic community (nifH). Observed richness and Shannon’s index were estimated for each site for both seasons. Boxes represent the first quartile, median, and third quartile, with whiskers indicating maximum and minimum values. Outliers are represented as black dots.
Applbiosci 04 00035 g003
Figure 4. Principal Coordinate Analysis (PCoA) ordinations summarizing the variation in microbial community composition between seasons and across sampling locations based on Bray–Curtis dissimilarity distances for (A) total bacterial communities (16S rRNA) and (B) diazotrophic communities (nifH) in the phyllosphere of Z. pseudoparasitica. Data were collected during two seasons (identified by the shape of the dots and linked by dash segments) at three locations (identified by different colors).
Applbiosci 04 00035 g004
Figure 5. Community phylogenetic relatedness in the Z. pseudoparasitica phyllosphere based on the Beta Net Relatedness Index (βNRI) between study forest sites in the rainy (A) and dry (B) seasons. Analysis corresponds to the bacteria characterized with the 16S rRNA marker. Significant differences between sites are indicated on top of the brackets as follows: p-value = * 0.05 and *** 0.001, and “ns” indicates non-significant differences (p > 0.05).
Applbiosci 04 00035 g005
Table 1. Seasonal variation in environmental variables (mean ± SD) at each site. All measurements were taken at the forest floor when the leaflets were collected.
SeasonFactorsPalo SecoSite
Santa Fe
El Copé
Rainy
Season
Leaflet
temperature (°C)
22.5 ± 2.521.1 ± 1.823.4 ± 1.1
Ambient temperature (°C)23.1 ± 3.623.8 ± 0.524.3 ± 1.2
Canopy cover (%)60.3 ± 11.057.2 ± 3.853.1 ± 5.5
Relative
humidity (%)
99.5 ± 12.198.7 ± 1.694.6 ± 1.5
Dry
Season
Leaflet
temperature (°C)
18.8 ± 4.220.1 ± 1.624.3 ± 1.0
Ambient temperature (°C)20.9 ± 2.625.3 ± 13.226.2 ± 1.5
Canopy cover (%)57.3 ± 5.658.2 ± 4.659.3 ± 4.1
Relative
humidity (%)
99.9 ± 10.899.9 ± 0.987.1 ± 14.8
Table 2. Pairwise PERMANOVA results (Bray–Curtis dissimilarities) showing differences in phyllosphere bacterial and diazotrophic community composition (16S rRNA and nifH) across sites and seasons. R2 values indicate effect size, while Bonferroni-adjusted p-values presented in bold indicate statistically significant comparisons.
16S rRNAnifH
Pairwise ComparisonsR2p-Valuep-AdjustedR2p-Valuep-Adjusted
El Copé dry vs. Palo Seco dry0.1280.0020.0300.1500.0030.045
El Copé dry vs. Santa Fe dry0.0770.0310.4650.0750.1961.000
El Copé dry vs. El Copé rainy0.0900.0150.2250.0600.2891.000
El Copé dry vs. Palo Seco rainy0.1320.0010.0150.1060.0040.060
El Copé dry vs. Santa Fe rainy0.0980.0040.0600.0730.1421.000
Palo Seco dry vs. Santa Fe dry0.1180.0020.0300.1090.0771.000
Palo Seco dry vs. El Copé rainy0.1410.0010.0150.1000.0390.585
Palo Seco dry vs. Palo Seco rainy0.0050.2581.0000.0750.321 1.000
Palo Seco dry vs. Santa Fe rainy0.0990.0080.1200.1450.0090.135
Santa Fe dry vs. El Copé rainy0.0840.0120.1800.0740.173 1.000
Santa Fe dry vs. Palo Seco rainy0.1290.0010.0150.0900.0851.000
Santa Fe dry vs. Santa Fe rainy0.0560.3211.0000.0600.5831.000
El Copé rainy vs. Palo Seco rainy0.1540.0010.0150.0680.1811.000
El Copé rainy vs. Santa Fe rainy0.1030.0020.0300.0750.0901.000
Palo Seco rainy vs. Santa Fe rainy0.1180.0010.0150.1220.0070.105
Table 3. Comparison of diazotrophic bacterial families detected using 16S rRNA and nifH gene amplicon sequencing. Families marked with ✓ were identified in each dataset. This comparison highlights the complementary nature of taxonomic (16S) and functional (nifH) markers used to characterize nitrogen-fixing microbial communities associated with Z. pseudoparasitica phyllosphere. Families marked with “✓” were detected with the respective marker, whereas “-” indicates absence in the corresponding dataset.
PhylumFamily16S rRNA GenenifH Gene
CyanobacteriaTolypothrichaceae-
Dermocarpellaceae-
Leptolyngbyaceae-
Rivulariaceae-
Scytonemataceae-
Stigonemataceae-
Nostocaceae
BacillotaClostridiaceae-
Desulfitobacteriaceae-
Eubacteriales Family XIII
Incertae Sedis
-
ThermodesulfobacteriotaDesulfobulbaceae-
BacteroidotaProlixibacteraceae-
FirmicutesPaenibacillaceae
ProteobacteriaBoseaceae-
Burkholderiales incertae sedis-
Chromatiaceae-
Methylocystaceae-
Nitrobacteraceae-
Beijerinckiaceae
Enterobacteriaceae
Erwiniaceae
Hyphomicrobiaceae
Pseudomonadaceae
Xanthomonadaceae
Disclaimer/Publisher’s Note: The statements, opinions and data contained in all publications are solely those of the individual author(s) and contributor(s) and not of MDPI and/or the editor(s). MDPI and/or the editor(s) disclaim responsibility for any injury to people or property resulting from any ideas, methods, instructions or products referred to in the content.

