Article

Bioinformatics Analysis of Unique High-Density Lipoprotein-MicroRNAs Cargo Reveals Its Neurodegenerative Disease Potential

by
Diana Marisol Abrego-Guandique
1,*,
Maria Cristina Caroleo
1,
Filippo Luciani
2 and
Erika Cione
3,*
1
Department of Health Sciences, University of Magna Graecia Catanzaro, 88100 Catanzaro, Italy
2
ASP-Cosenza, 87100 Cosenza, Italy
3
Department of Pharmacy, Health and Nutritional Sciences, University of Calabria, 87036 Rende, Italy
*
Authors to whom correspondence should be addressed.
Appl. Biosci. 2025, 4(3), 34; https://doi.org/10.3390/applbiosci4030034
Submission received: 18 April 2025 / Revised: 21 June 2025 / Accepted: 3 July 2025 / Published: 8 July 2025

Abstract

Recent findings have identified high-density lipoprotein (HDL) as a carrier of microRNAs, small non-coding RNAs that regulate gene expression, suggesting a potential novel functional and biochemical role for HDL-microRNA cargo. Here, we conduct an in-depth bioinformatics analysis of unique HDL-microRNA cargo to uncover their molecular mechanisms and potential applications as clinical biomarkers. First, using the Gene Expression Omnibus (GEO), we performed computational analysis on public human microRNA array datasets (GSE 25425; platform GPL11162) obtained from highly purified fractions of HDL in human plasma in order to identify their unique miRNA cargo. This led to the identification of eleven miRNAs present only in HDL, herein listed: hsa-miR-210, hsa-miR-26a-1, hsa-miR-628-3p, hsa-miR-31, hsa-miR-501-5p, hsa-miR-100-3p, hsa-miR-571, hsa-miR-100-5p, hsa-miR-23a, hsa-miR-550, and hsa-miR-432. Then, these unique miRNAs present in HDL were analyzed using a bioinformatics approach to recognize their validated target genes. The ClusterProfiler R package applied gene ontology and KEGG enrichment analysis. The key genes mainly enriched in the biological process of cellular regulation were identified and linked to neurodegeneration. Finally, the protein–protein interaction and co-expression network were analyzed using the STRING and GeneMANIA Cytoscape plugins.

1. Introduction

High-density lipoproteins (HDL) contribute to cardiovascular protection [1]. HDL also carries various proteins and nucleic acids, including microRNAs (miRNAs). These small non-coding RNA molecules play critical roles in gene regulation by binding to complementary mRNA sequences, leading to mRNA degradation or translational repression, which is also abnormally expressed in several diseases [2]. Notably, research has uncovered a novel function of HDL as a carrier of miRNAs, indicating that HDL’s role is not limited to lipid transport but also includes regulatory functions through the delivery of non-coding RNA [3]. Several studies report that HDL transports and regulates miRNAs, influencing both physiological and pathological processes [4,5]. Notably, HDL and miRNAs co-regulate key metabolic pathways, including HDL metabolism, reverse cholesterol transport, and bile acid secretion, highlighting their therapeutic potential for cardiovascular diseases [6]. Distinct miRNA profiles are associated with specific lipoprotein subclasses, suggesting that miRNAs play a functional role in lipoprotein-related processes and associated diseases [7], modulating cellular miRNA landscapes and thereby influencing critical processes such as inflammation, immunity, and neuroprotection [8].
Recently, Hussain and co-workers highlighted a potential association between plasma HDL cholesterol levels and the risk of incidence of dementia in a cohort of healthy older adults [9]. Notably, the study was conducted on 18,668 participants, of whom only 5% (933) had dementia. The participants with high HDL-C (>80 mg/dL) had a 27% higher risk of dementia (HR 1.27, 95% CI 1.03, 1.58). When stratified by age, the analyses demonstrated that the risk of incident dementia was higher in participants aged ≥75 years compared to those aged <75 years (HR 1.42, 95% CI 1.10–1.83 vs. HR 1.02, 95% CI 0.68–1.51). Associations remained significant after adjusting for covariates, including age, sex, country of enrolment, daily exercise, education, alcohol consumption, weight change over time, non-HDL-C, HDL-C-PRS, and APOE genotype [10].
Considering this, we analyzed the cargo of the unique miRNAs associated with HDL. Through bioinformatics analysis, we aim to investigate the unique cargo of HDL-miRNAs using publicly available human microRNA array datasets (GSE 25425; platform GPL11162), which were obtained from highly purified fractions of HDL extracted from human plasma. By integrating advanced computational methods, this study aims to deepen our understanding of lipoprotein-bound microRNAs and their role in human health.

2. Materials and Methods

2.1. Data Acquisition and Pre-Processing

Data from the Gene Expression Omnibus (GEO), a publicly available repository for high-throughput functional genomics datasets, were utilized [11,12]. Details of the dataset information are provided in the Supplementary Material. The gene expression dataset GSE25425 was retrieved from the GEO database using the GEO-query package. Data corresponding to the GPL11162 platform were selected, and the expression matrix was extracted.
To visualize the global structure of the data and detect sample-level patterns, Uniform Manifold Approximation and Projection (UMAP) was applied. UMAP is a dimensionality reduction technique that projected the high-dimensional gene expression data into a two-dimensional space, capturing its intrinsic structure [13].
The miRNA expression dataset analyzed in this study was obtained from a publicly available repository (GEO), where it had already undergone pre-processing and normalization by the original data contributors. Therefore, we did not apply any additional normalization steps. The sample distribution was assessed using Relative Quantitative Values (RQV), with UMAP and boxplot visualizations generated using the tools integrated within the GEO dataset platform.
To identify HDL-specific miRNAs, we applied a specific filter. In detail, we selected miRNAs that were detectable only in HDL samples and completely undetectable (i.e., RQV = not detectable (NA)) in both LDL and exosome fractions. Then, we filtered this subset by retaining only those miRNAs whose RQV values in the HDL samples were above the 40th percentile. This strategy enabled us to identify 11 miRNAs that were uniquely present in HDL. The corresponding RQV values are provided in Table S1.

2.2. MiRNA Target Gene Prediction

To identify the validated target genes of the human miRNAs, the multiMiR package was used, which integrates multiple databases for miRNA-target interactions, including miRTarBase, miRecords, and TarBase [14]. To ensure the reliability and biological relevance of the results, we applied a filtering step using the dplyr package. This filtering process retained only the genes that were supported by evidence from at least two independent databases, thereby reducing the probability of false positives. The processing of the validated targets followed a systematic approach consisting of three key steps: duplicate removal, filtering by database support, and summary of results. The total number of unique validated target genes was counted and summarized for each miRNA. This quantitative overview allowed for the identification of miRNAs with a larger set of potential regulatory targets.

2.3. GO and KEGG Pathway Enrichment Analysis

Gene ontology (GO) enrichment analysis, including biological processes (BP), cellular components (CC), and molecular functions (MF), was conducted to identify the functional roles of the miRNA-regulated target genes [15]. The analysis was performed using the ClusterProfiler R package (version 4.2.1) with a significance threshold of p.adjust < 0.05 and a q-value cutoff of 0.2, with p-values adjusted using the Benjamini–Hochberg (BH) method. The top 10 enriched pathways were visualized using dot plots (Figure S1A–C). Gene symbols were mapped to their corresponding Entrez IDs to ensure accurate gene identification using the org.Hs.eg.db package. KEGG pathway enrichment analysis was also conducted to predict the biological pathways in which the target genes are involved [16]. This analysis facilitated the identification of the key signaling pathways potentially influenced by miRNA regulation.

2.4. Integration of the Protein–Protein Interaction (PPI) Network

Using the STRING database, a protein–protein interaction (PPI) network was constructed to investigate the interactive relationships between the target genes [17]. The list of target genes was submitted to STRING to identify the known and predicted interactions among the proteins encoded by these genes. The PPI network was further analyzed using Cytoscape (version 3.9.1) to visualize and explore the network’s structure. The CytoHubba plugin was employed to identify the key hub genes within the network. Hub genes were ranked based on their node degree, and the top ten genes with the highest degree of connectivity were selected as potential hub genes. To refine the network and identify the key gene clusters, the MCODE (Molecular Complex Detection) plugin in Cytoscape was used to detect highly interconnected sub-networks [18]. These sub-networks represent the clusters of genes that may be functionally significant in the biological context of the study.

2.5. Data Visualization

A software installation was downloaded, and R (version 4.4.1) was installed as described at https://www.r-project.org/. Both R and RStudio must be installed. PPI network data were automatically output by STRING and exported into the Cytoscape software (version 3.9.1). The visualization results were output after adjusting the layout. The ggplot2 R package (version 3.3.3) and UpSetR package (Version 1.4.0) were used to show the other analysis results.

3. Results

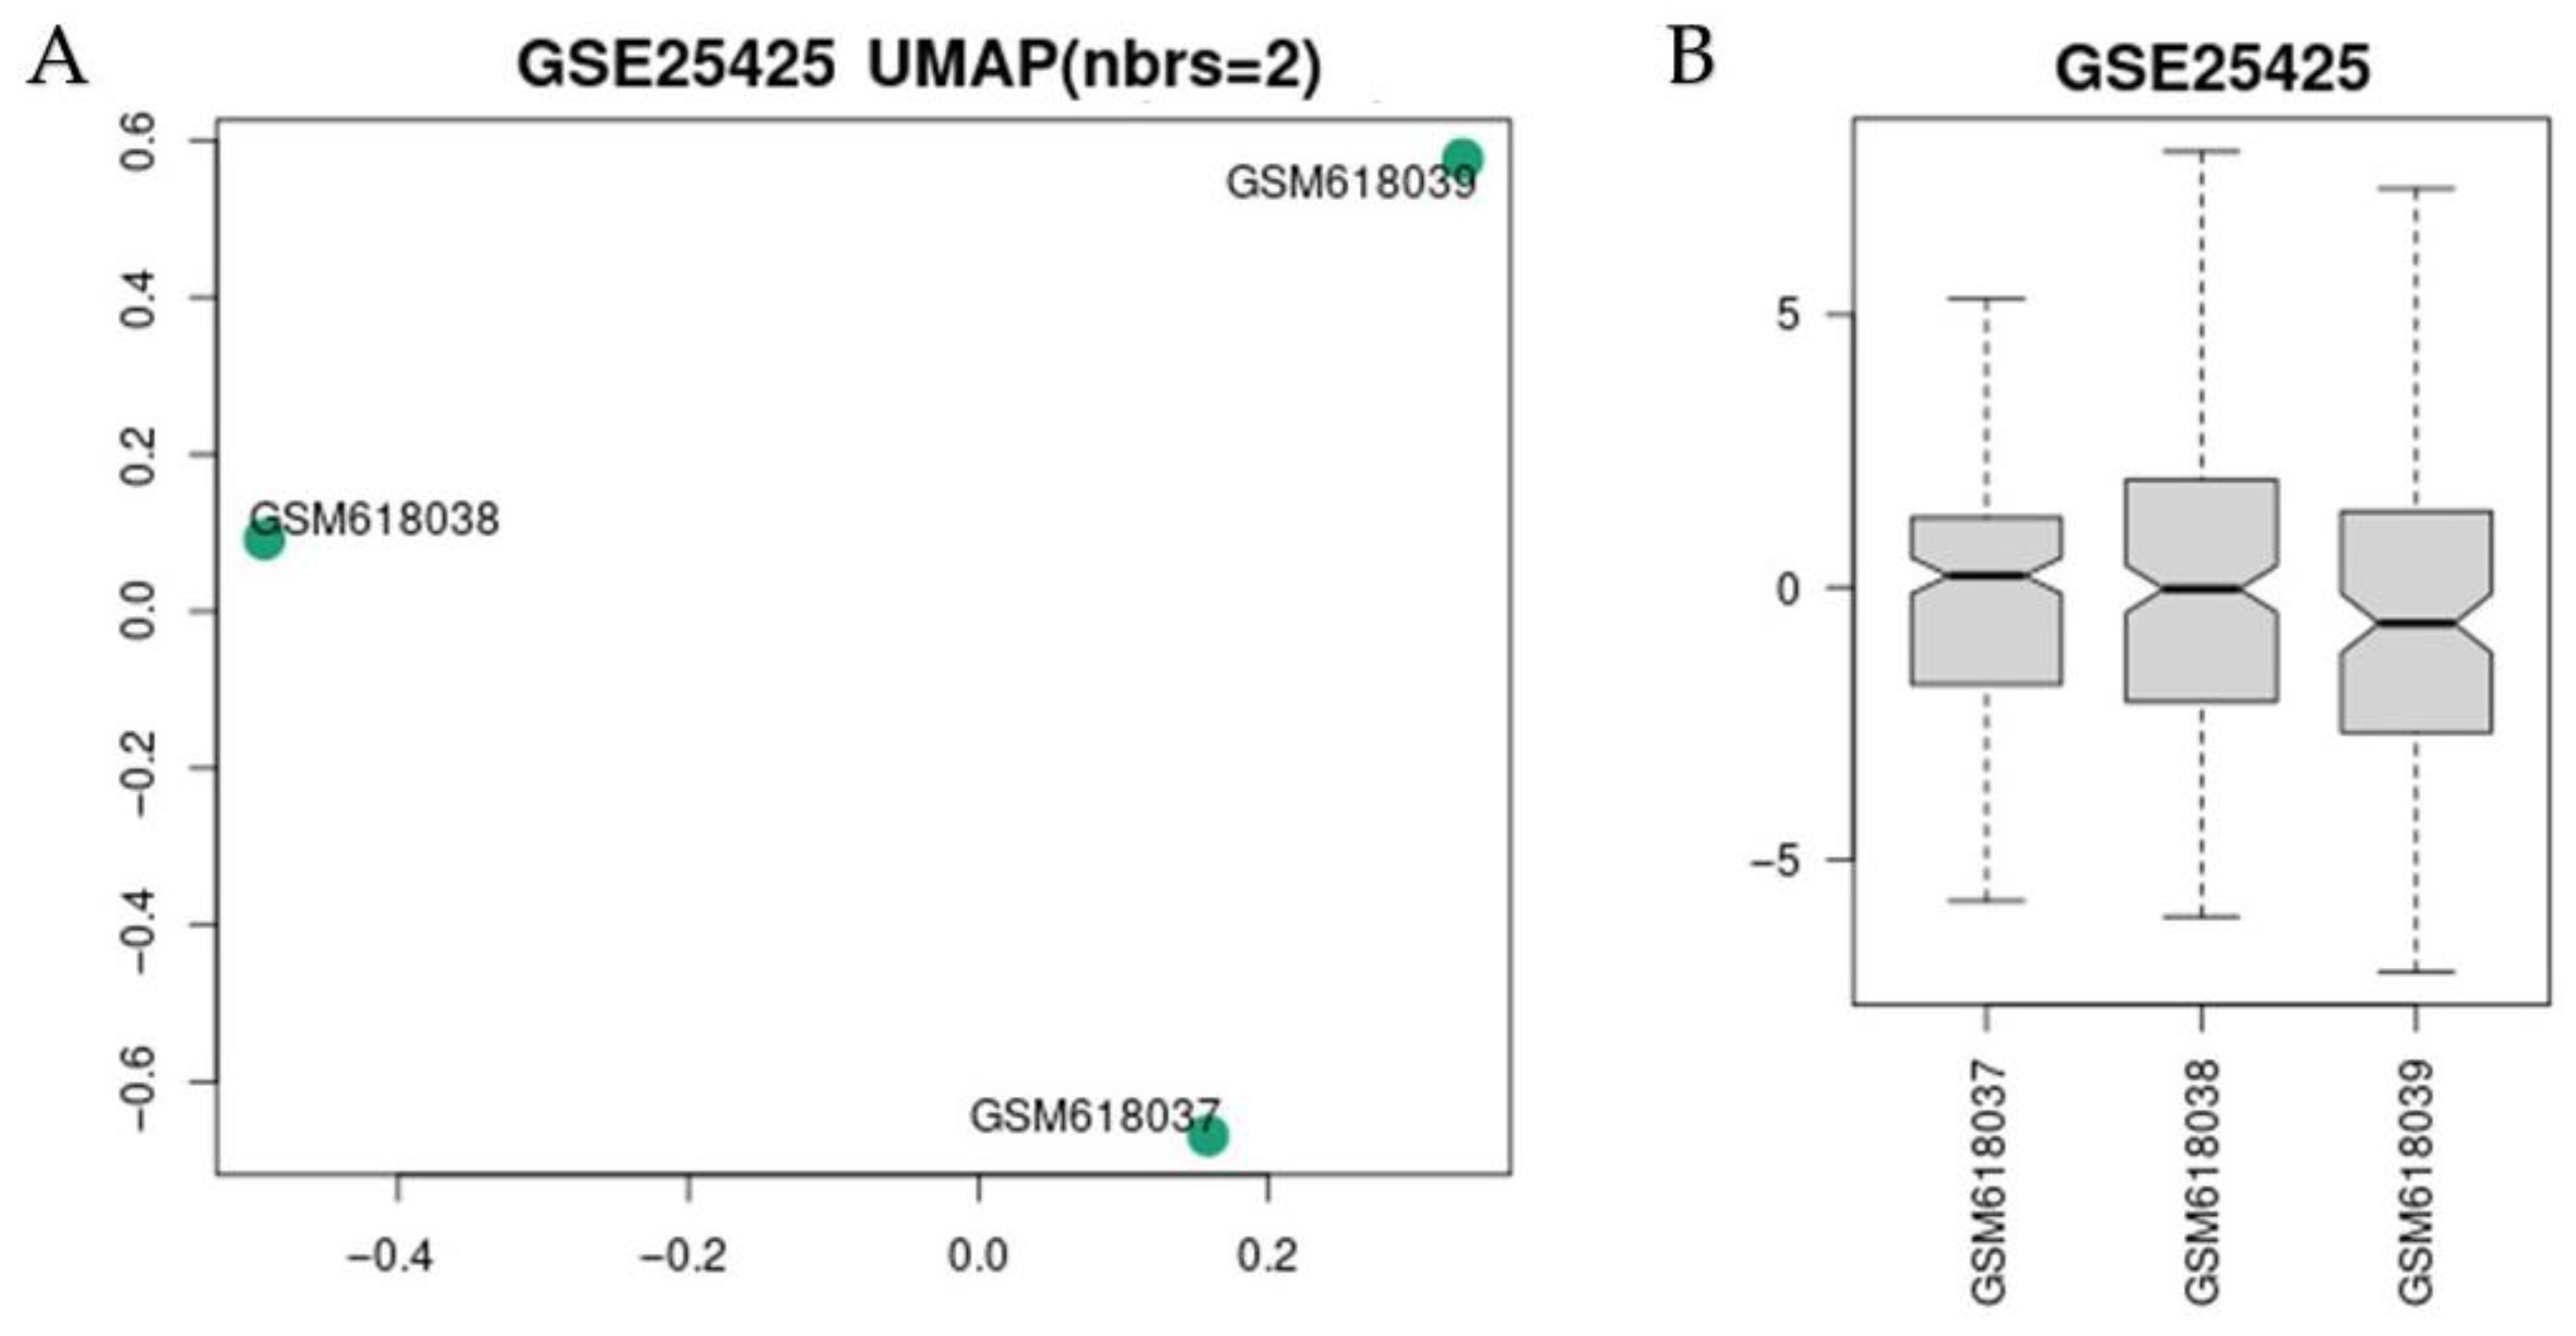
3.1. GEO Dataset Information

GSE25425 dataset, based on platform GPL11162. The GSE25425 dataset is a publicly available gene expression dataset hosted on the Gene Expression Omnibus (GEO) platform. The dataset investigates the molecular content of HDL, LDL, and exosomes derived from human plasma. The GEO dataset comprises 664 miRNAs in three different fractions: exosomes, LDL, and HDL.

3.2. Analysis of Exosome, LDL, and HDL Dataset

To evaluate the overall differences in gene expression profiles among exosome, LDL, and HDL samples, UMAP analysis was performed on the full dataset GSE25425. The UMAP plot (Figure 1A) demonstrates separation among the three samples, suggesting distinct feature profiles among the groups. Sample GSM618037 (exosome) is located in the lower-right quadrant of the UMAP space. Sample GSM618038 (LDL) clusters distinctly in the left-central region. Sample GSM618039 (HDL) occupies the upper-right position in the UMAP plot. The non-overlapping positions of the samples indicate significant variability among the groups, highlighting their unique molecular signatures. In Figure 1B, data are shown as a boxplot to monitor the distribution of the expression values for the three samples. All three samples exhibited a similar range and interquartile (IQR) distribution, with no significant asymmetry or outliers observed. Therefore, the median values across the three groups were comparable, indicating a consistent central tendency. The overall spread of the values remained uniform across the three groups, suggesting that while the UMAP identified differences in the overall structure of the data, the expression value distributions for each group were statistically similar.
A density plot was generated to examine the distribution of gene expression intensities across the samples (Figure 2A). The curves illustrate the distribution of expression values for each sample in the GSE25425 dataset. The major expression intensities are concentrated between −5 and 5 on the x-axis, with a peak around 0, indicating that most miRNAs exhibit low to moderate expression levels. A mean-variance trend analysis was conducted to assess the variability in gene expression relative to average expression levels (Figure 2B). The square root of the variance (sigma) was plotted against the average log-expression for all probes in the dataset.

3.3. Identification of Unique HDL-miRNA Cargo and KEGG Pathways Analysis

In the GEO dataset, composed of a total of 664 miRNAs, we identified eleven unique signatures of miRNAs for HDL cargo herein listed: hsa-miR-210, hsa-miR-26a-1, hsa-miR-628-3p, hsa-miR-31, hsa-miR-501-5p, hsa-miR-100-3p, hsa-miR-571 hsa-miR-100-5p, hsa-miR-23a, hsa-miR-550, and hsa-miR-432 (Figure 3).
A total of 4926 validated target genes were identified with 1038 targets present in more than two databases. This approach was used to enhance the robustness of the results. The KEGG pathway enrichment analysis revealed several significant disease-specific and signaling pathways. Notably, pathways associated with Alzheimer’s disease and neurodegeneration across multiple diseases were prominently enriched (Figure 4).
In addition, key signaling pathways were identified, including those regulating the pluripotency of stem cells, cellular senescence, the FoxO signaling pathway, the TGF-beta signaling pathway, and the mTOR signaling pathway. These enriched pathways highlight the critical biological processes and molecular mechanisms, such as cell cycle regulation, signal transduction, and cellular aging, that are influenced by the miRNA-regulated target genes. The findings underscore the relevance of these pathways in disease progression, cellular maintenance, and stem cell regulation.

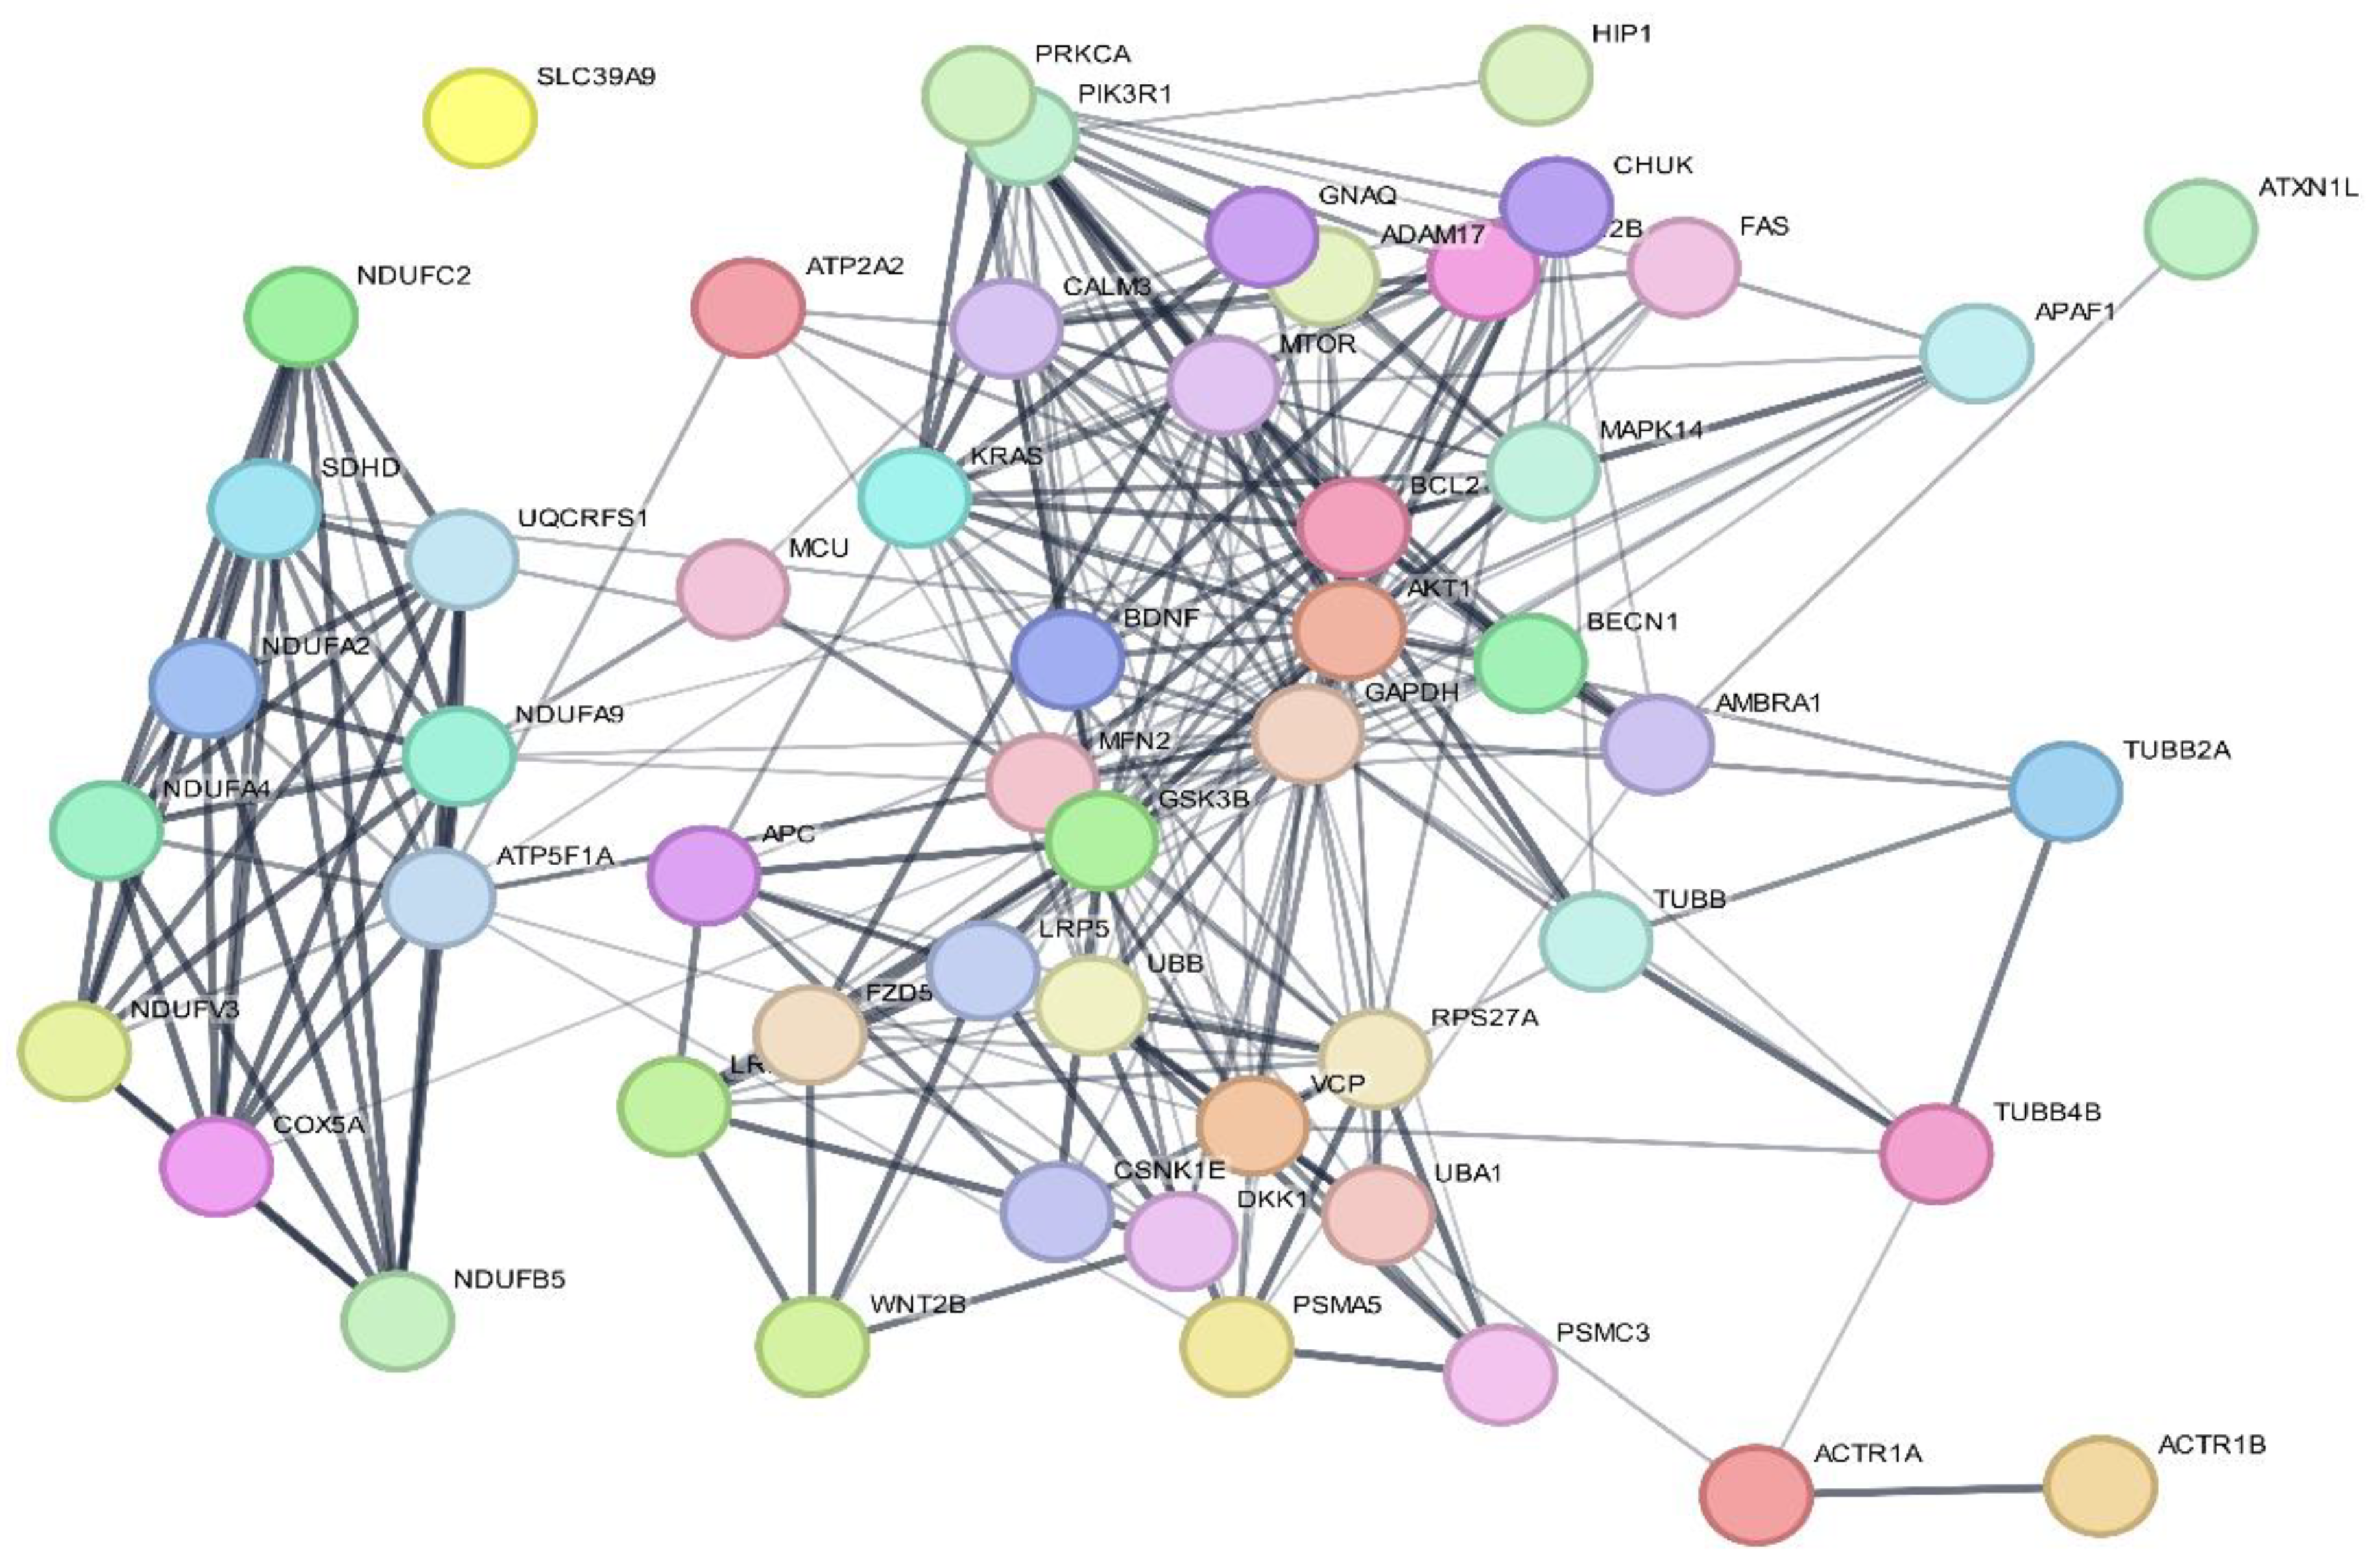
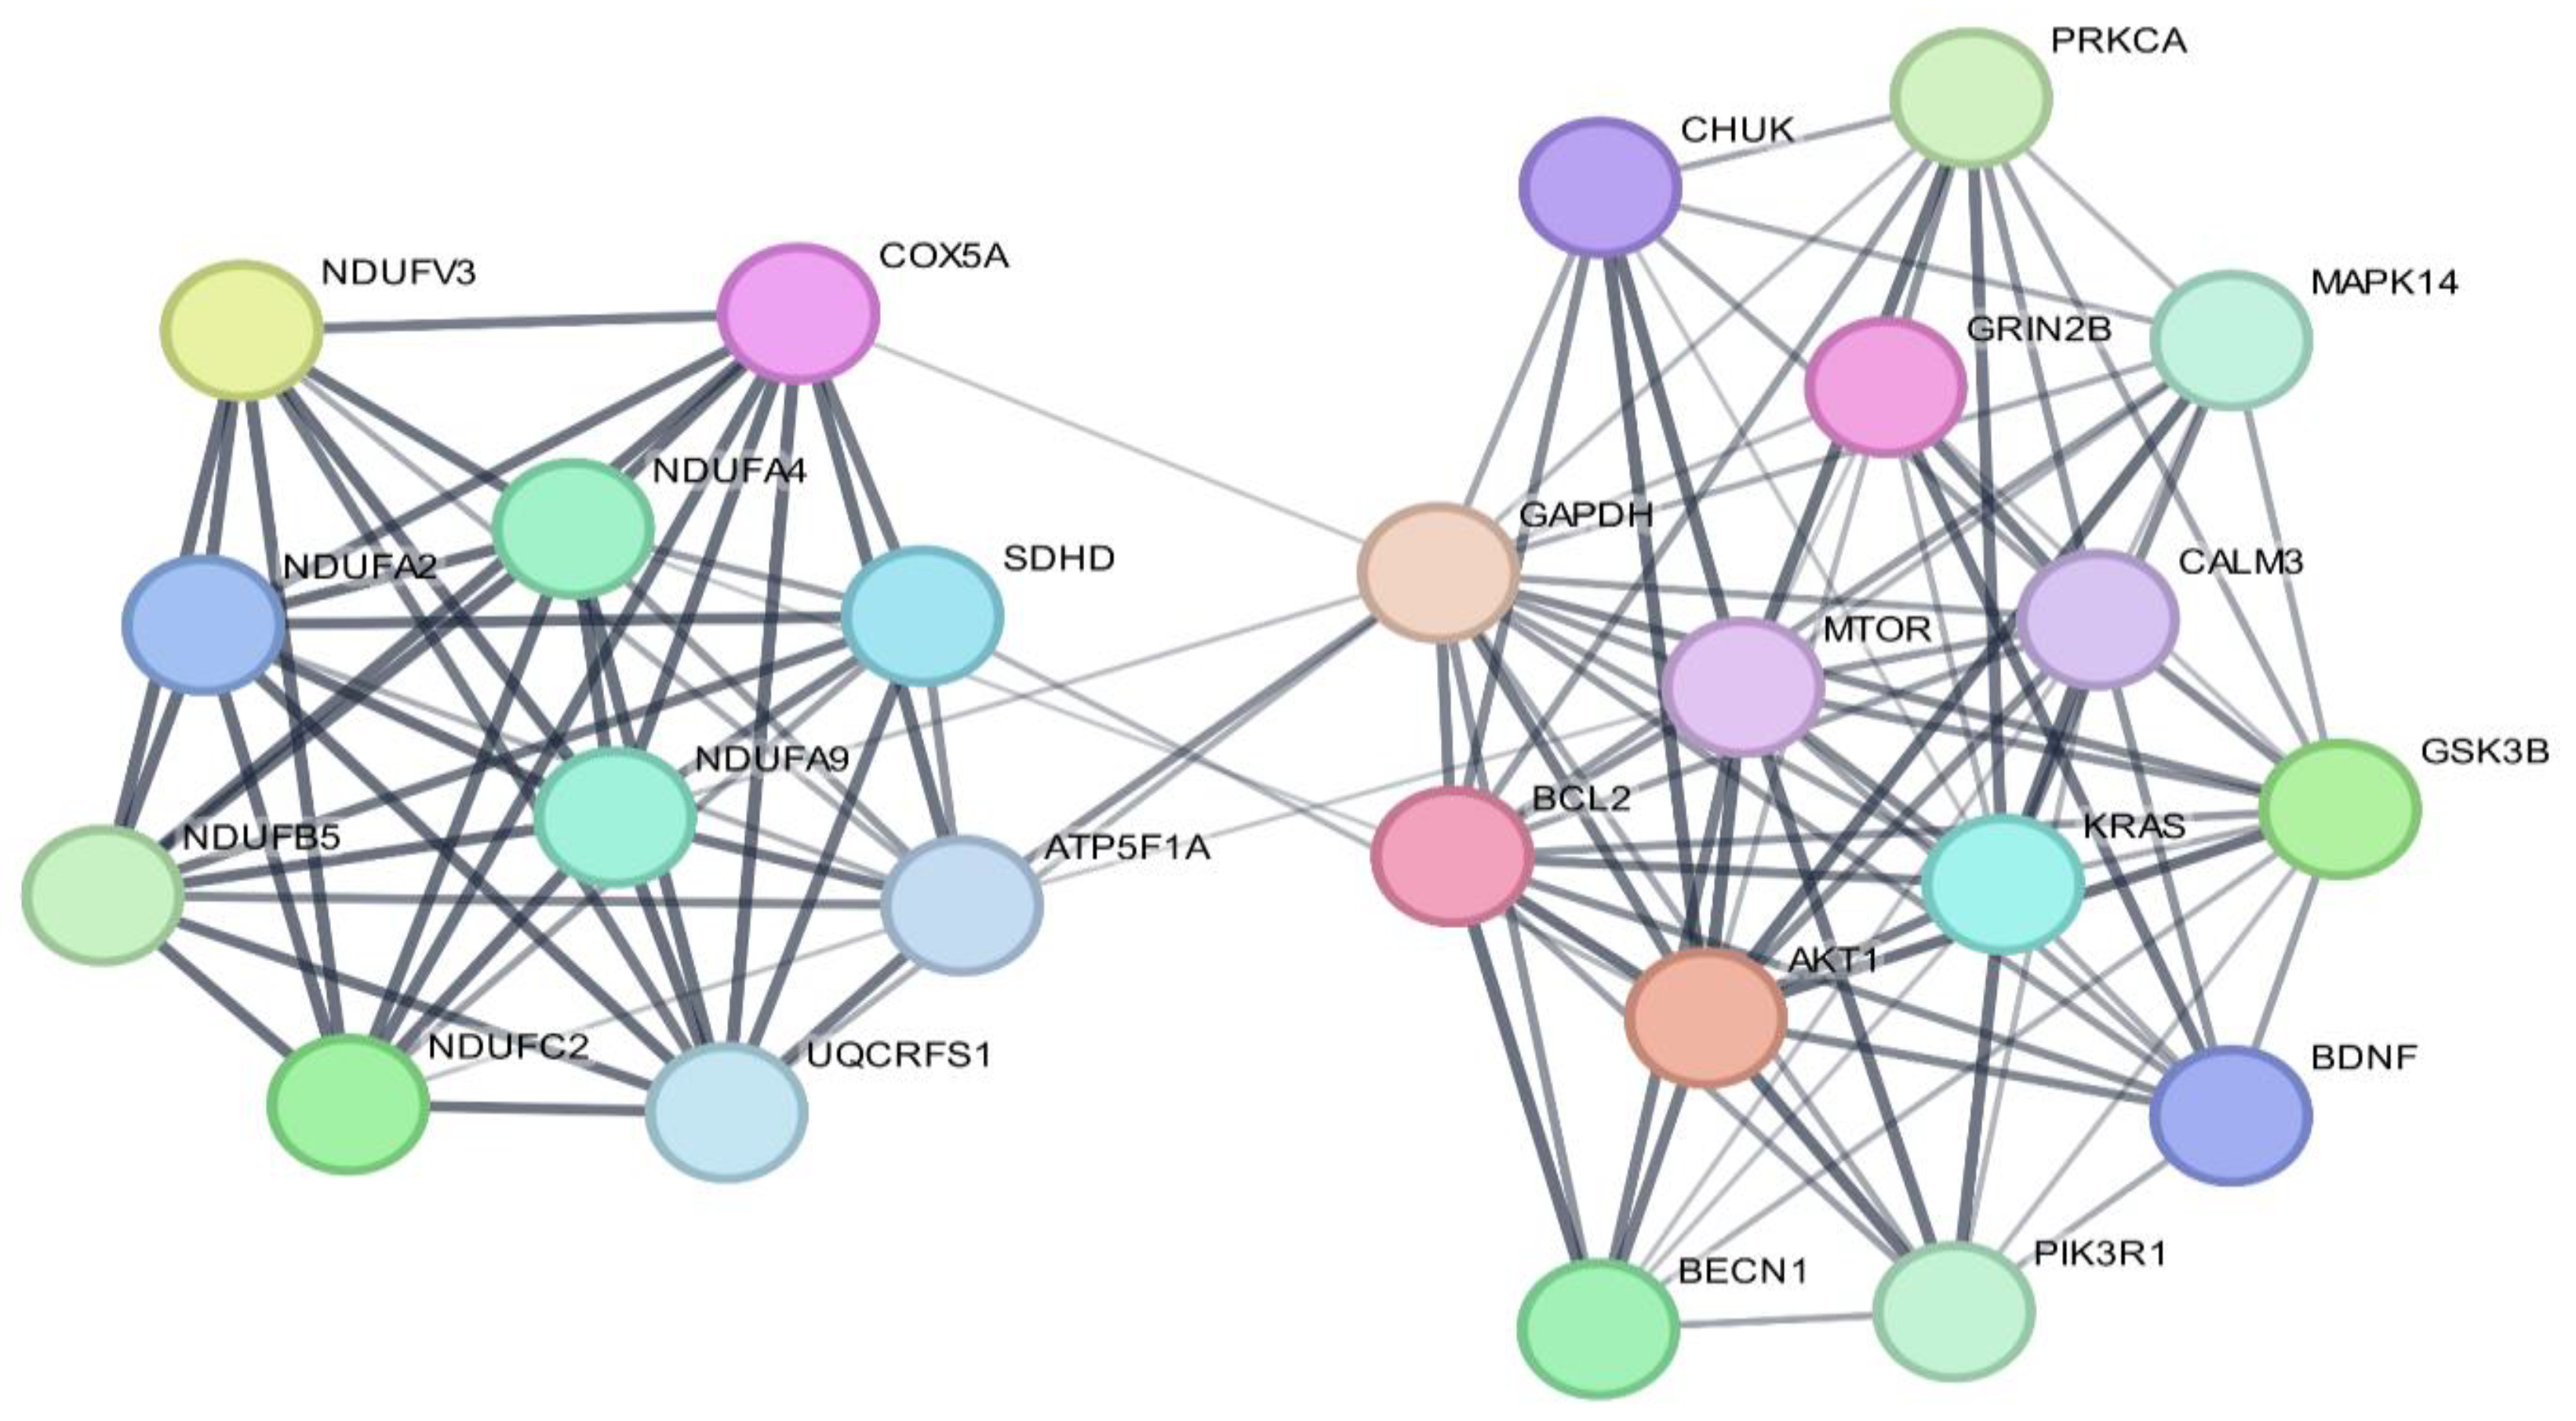
3.4. Protein–Protein Interactions

Interactions among these genes resulting in a translated protein were explored. The protein–protein interaction (PPI) was applied, and the most important modules were then screened. PPI networks were created (Figure 5), with 53 targets related to Alzheimer’s disease and pathways of neurodegeneration across multiple diseases, and 271 edges; the average number of neighbors was 10.42.
GADPH, AKT1, GSK3B, MTOR, BCL2, CALM3, KRAS, VCP, RPS27A, and UBB were identified as seed nodes (Table 1). The cluster network by Molecular Complex Detection (MCODE) was obtained with a count of 24 nodes and 125 edges, and the average number of neighbors was 10.41 (Figure 6).
The hub nodes with the most significant number of node degrees (≥9) include GADPH, mTOR, BCL2, CALM3, KRAS, AKT1, GSK3B, and BDNF, among others. The network shows two main clusters: the first enriched in NDUFA2, NDUFB5, and UQCRFS1, and the second composed of AKT1, MTOR, GSK3B, and BDNF. The central hub proteins are GAPDH, AKT1, and BCL2.

4. Discussion

Recently, Hussain and co-workers have highlighted a potential association between plasma HDL cholesterol levels and the risk of incidence of dementia in a cohort of healthy older adults. The study was conducted on 18,668 participants, of whom only 5% suffer from dementia [9]. In addition, metabolomics data revealed that medium/small HDL blood levels correlate with levels of tau and P-TAU in cerebrospinal fluid from ApoE4-negative AD [19].
The present work analyzed the GEO dataset of circulating HDL-microRNA cargo, identifying a unique HDL-miRNA signature comprising eleven microRNAs. The combined analysis of UMAP and boxplots reveals that while HDL, LDL, and exosome samples exhibit distinct patterns in feature space (UMAP), their overall distributions (boxplots) remain comparable. This dual observation suggests that while specific gene signatures or features differentiate these groups, the general data variability remains consistent across them. In addition, the similarity in the density profiles across samples suggests a consistent distribution of expression values, with no significant skewness or systematic deviations observed. Previous reports have demonstrated the transport of miRNAs by lipoproteins, especially HDL [7,20,21,22]. In plasma, HDL transports a specific profile of extracellular miRNAs consistent across individuals and distinct from extracellular vesicles (EVs) [12]. In detail, we detected eleven miRNAs unique to the HDL fraction, the hsa-miR-210, hsa-miR-26a-1, hsa-miR-628-3p, hsa-miR-31, hsa-miR-501-5p, hsa-miR-100-3p, hsa-miR-571, hsa-miR-100-5p, hsa-miR-23a, hsa-miR-550, and hsa-miR-432. Here, we employed a bioinformatic approach to identify which messenger is targeted by the unique HDL-miRNA cargo using validated targets. Several of the pathways associated with the miRNA signatures play roles in neurodegenerative diseases, including protein serine/threonine kinase signaling pathways [23], TORC1 [24], and ubiquitin signaling [25]. In addition, KEGG pathways reveal that some targets of the unique miRNAs-HDL cargo were involved in pathways of neurodegeneration and AD. Then, we created a PPI and identified a cluster with some proteins linked to the PI3K/AKT/mTOR signaling pathway, which has a role in the modulation of autophagy and the clearance of protein aggregates in neurodegeneration [26]. The unique HDL-miRNAs cargo identified and analyzed here suggests a mechanism that can exert systemic effects, potentially influencing the cellular pathways in several tissues [27]. In fact, studies have indicated that HDL-bound miRNAs may reflect systemic changes in lipid metabolism that correlate with neurodegenerative disease states [28]. HDL composition and miRNA cargo have been altered in various disease states [29].
This study directly addresses our principal aim by demonstrating that the unique miRNA cargo of HDL is intricately linked to the pathways implicated in neurodegenerative disorders. Our analysis extends the current understanding of HDL beyond its role in lipid transport to encompass signaling and regulatory functions in neurological processes.
It is known that dysfunctional HDL, which displaces altered proteins and lipid composition, is implicated in atherosclerosis and exhibits compromised anti-inflammatory and antioxidant capacity [30]. Furthermore, of the eleven miRNAs unique to HDL, miR-210 regulates numerous target genes involved in neuronal plasticity and neurodegenerative diseases [31]. At the same time, the miR-26 family triggers molecular events that are essential for neurogenesis [32]. Barros-Viegas and co-workers reported in an animal model of Alzheimer’s disease (AD) that miR-31 improves cognition and abolishes amyloid-β by targeting APP and BACE1 [33]. On the other hand, miR-100-5p contributes to neurodegeneration [34], and miR-23a/23b was down-regulated in the frontal cortex of mild cognitive impairment subjects [35]. miR-432 showed positive correlations with lipids in a study on epigenomics and lipidomics, which identified pathways involved in the early stages of AD [36]. Finally, recent large-scale plasma studies by Krüger et al. and Liu et al. confirm distinct circulating miRNA signatures across Alzheimer’s disease, reinforcing the relevance of miRNAs as systemic indicators of central pathology [37,38]. However, neither study explores HDL’s role in carrying functional miRNAs, which may actively influence cell communication and gene regulation in the brain via miRNAs [8].
Contrasting cognitive decline with a combination of diet, improved micronutrient intake, and physical activity can be a strategy, especially if these factors impact microRNAs in AD patients [39,40]. Nevertheless, we are still far from a resolution. Therefore, the identification of unique miRNA-HDL may favor a better understanding of the neurodegenerative disease. It is worth noting that HDL contains an important fraction of APOE, and currently, APOE isoforms, especially APOE ε4/ε4, are the most significant risk factors for AD [41,42]. At the same time, the changes in HDL in AD are APOE genotype-specific [43]. HDL delivers endogenous miRNAs to recipient cells with functional targeting capabilities [12,44] and serve as biomarkers for conditions in which diagnosis is difficult [45]. The potential for HDL to deliver miRNAs that modulate neuroinflammatory responses opens new avenues for understanding the mechanisms underlying neurodegenerative diseases. It highlights the importance of HDL-miRNA interactions in the progression of disease.
Additionally, the identification of HDL-specific miRNA signatures provides a foundation for developing early diagnostic biomarkers for neurodegenerative diseases. These miRNAs have the potential to serve as non-invasive indicators of disease progression, providing new tools for the early detection and monitoring of conditions like Alzheimer’s disease (AD). Lastly, the HDL-miRNA cargo identified in this study holds promising potential for therapeutic development by targeting specific pathways implicated in neurodegenerative diseases such as Alzheimer’s disease (AD). In this context, miRNAs can be employed to modulate key mechanisms such as autophagy, protein clearance, and neuroinflammation.
Despite the strengths of our integrative bioinformatics approach, this study has some limitations that should be acknowledged: (i) The analysis is based on a single, publicly available dataset composed of pooled samples, which limits the assessment of inter-individual variability; (ii) additionally, we used thresholds (RQV > 40th percentile) to identify biologically relevant miRNAs and this approach may have excluded low-abundance miRNAs with significant functional roles; (iii) the reliance on database-driven target predictions and pathway annotations may reflect known biases in curated content, favoring well-studied genes and pathways.

5. Future Perspectives

Future research should include the assessment of datasets from diverse populations and individuals with specific neurological disease conditions to fully understand the variability and functional significance of HDL-miRNA cargo. This broader scope would facilitate the uncovering of the influence of genetic, environmental, and lifestyle factors, including potential supplementation strategies [39], on HDL-miRNA profiles and their association with disease states. Considering this, future investigations should assess whether changes in HDL-miRNA cargo reflect or contribute to dysfunction in neurodegenerative contexts where systemic inflammation and metabolic stress have a role. The mechanisms by which HDL delivers miRNAs to recipient cells represents another exciting area for further study. Understanding the dynamics of miRNA transfer mediated by HDL could provide deeper insights into intercellular communication and its physiological roles. These future directions highlight the potential of using unique HDL-miRNA cargo as diagnostic and therapeutic tools while emphasizing the need for further experimental and translational studies to fully realize their clinical applications.

6. Conclusions

This study reveals the existence of a distinct subset of eleven miRNAs that are uniquely associated with HDL particles, thereby differentiating them from those carried by exosomes or LDL. Functional enrichment analysis of their validated target genes reveals a strong involvement in the molecular pathways associated with neurodegenerative diseases, such as the PI3K/AKT/mTOR signaling pathway, ubiquitin-mediated proteolysis, and cellular senescence. In addition, protein–protein interaction (PPI) network analysis identified central regulatory hubs, such as GAPDH, AKT1, mTOR, and GSK3B, which are known to play pivotal roles in neuronal homeostasis, synaptic plasticity, and neuroinflammation. The overlap between the targets of the HDL-associated miRNAs and these hub proteins suggests the existence of a functional interface through which HDL may modulate neurodegenerative pathways at a systemic level. These findings expand the current understanding of HDL, proposing a novel role as a carrier of regulatory miRNAs that may influence gene expression and intercellular communication in the brain. Moreover, several of these miRNAs—such as miR-210, miR-100-5p, and miR-23a—have been previously linked to cognitive impairment and Alzheimer’s disease, which reinforces their potential clinical relevance. This integrative view highlights the potential of HDL-miRNA cargo as a source of early biomarkers for neurodegenerative disorders.

Supplementary Materials

The following supporting information can be downloaded at: https://www.mdpi.com/article/10.3390/applbiosci4030034/s1, Figure S1: Gene ontology; Table S1: The table show microRNA identifiers alongside their respective chip codes and relative quantitative values (RQV) [12].

Author Contributions

Conceptualization, E.C. and F.L.; methodology, D.M.A.-G.; software, D.M.A.-G.; data curation, D.M.A.-G. and M.C.C.; writing—original draft preparation, E.C. and D.M.A.-G.; writing—review and editing, E.C., M.C.C. and D.M.A.-G. All authors have read and agreed to the published version of the manuscript.

Funding

This research received no external funding.

Institutional Review Board Statement

Not applicable.

Informed Consent Statement

Not applicable.

Data Availability Statement

The data presented in this study are available at Gene Expression Omnibus (GEO).

Conflicts of Interest

The authors declare no conflicts of interest.

Abbreviations

AKT1Protein kinase B (AKT1 is a specific isoform)
APPAmyloid Precursor Protein
APOEApolipoprotein E
BACEBeta-Site Amyloid Precursor Protein Cleaving Enzyme
BCL2B-cell lymphoma 2 (a family of regulator proteins)
BDNFBrain-Derived Neurotrophic Factor
BPBiological Processes
CALM3Calmodulin 3 (calcium-binding messenger protein)
CCCellular Components
EVExtracellular Vesicle
FPLCFast Protein Liquid Chromatography
GEOGene Expression Omnibus
GOGene Ontology
GPLGene Expression Omnibus Platform
GSK3BGlycogen Synthase Kinase 3 Beta
HDLHigh-Density Lipoprotein
KEGGKyoto Encyclopedia of Genes and Genomes
KRASKirsten rat sarcoma viral oncogene homolog (gene encoding a small GTPase protein)
MCODEMolecular Complex Detection
MFMolecular Functions
miRNAMicroRNA
mRNAMessenger RNA
mTORMechanistic Target of Rapamycin
PI3KPhosphoinositide 3-Kinase
PPIProtein–Protein Interaction
RNARibonucleic Acid
RPSRibosomal Protein Subunit (RPS27A in the document refers to Ribosomal Protein S27a)
TORC1Target of Rapamycin Complex 1
UBBUbiquitin B
VCPValosin-Containing Protein

References

  1. Ben-Aicha, S.; Escate, R.; Casaní, L.; Padró, T.; Peña, E.; Arderiu, G.; Mendieta, G.; Badimón, L.; Vilahur, G. High-density lipoprotein remodelled in hypercholesterolaemic blood induce epigenetically driven down-regulation of endothelial HIF-1α expression in a preclinical animal model. Cardiovasc. Res. 2020, 116, 1288–1299. [Google Scholar] [CrossRef] [PubMed]
  2. Peronace, C.; Cione, E.; Abrego-Guandique, D.M.; Fazio, M.D.; Panduri, G.; Caroleo, M.C.; Cannataro, R.; Minchella, P. FAM19A4 and hsa-miR124-2 Double Methylation as Screening for ASC-H- and CIN1 HPV-Positive Women. Pathogens 2024, 13, 312. [Google Scholar] [CrossRef] [PubMed]
  3. Michell, D.L.; Vickers, K.C. Lipoprotein carriers of microRNAs. Biochim. Biophys. Acta—Mol. Cell Biol. Lipids 2016, 1861, 2069–2074. [Google Scholar] [CrossRef]
  4. Baldán, Á.; de Aguiar Vallim, T.Q. miRNAs and High-Density Lipoprotein metabolism. Biochim. Biophys. Acta—Mol. Cell Biol. Lipids 2016, 1861, 2053–2061. [Google Scholar] [CrossRef] [PubMed]
  5. Fernández-Tussy, P.; Ruz-Maldonado, I.; Fernández-Hernando, C. MicroRNAs and Circular RNAs in Lipoprotein Metabolism. Curr. Atheroscler. Rep. 2021, 23, 33. [Google Scholar] [CrossRef]
  6. Canfrán-Duque, A.; Lin, C.S.; Goedeke, L.; Suárez, Y.; Fernández-Hernando, C. Micro-RNAs and high-density lipoprotein metabolism. Arterioscler. Thromb. Vasc. Biol. 2016, 36, 1076–1084. [Google Scholar] [CrossRef]
  7. Rossi-Herring, G.; Belmonte, T.; Rivas-Urbina, A.; Benítez, S.; Rotllan, N.; Crespo, J.; Llorente-Cortés, V.; Sánchez-Quesada, J.L.; de Gonzalo-Calvo, D. Circulating lipoprotein-carried miRNome analysis reveals novel VLDL-enriched microRNAs that strongly correlate with the HDL-microRNA profile. Biomed. Pharmacother. 2023, 162, 114623. [Google Scholar] [CrossRef]
  8. Graham, A. Modulation of the Cellular microRNA Landscape: Contribution to the Protective Effects of High-Density Lipoproteins (HDL). Biology 2023, 12, 1232. [Google Scholar] [CrossRef]
  9. Hussain, S.M.; Robb, C.; Tonkin, A.M.; Lacaze, P.; Chong, T.T.-J.; Beilin, L.J.; Yu, C.; Watts, G.F.; Ryan, J.; Ernst, M.E.; et al. Association of plasma high-density lipoprotein cholesterol level with risk of incident dementia: A cohort study of healthy older adults. Lancet Reg. Health—West. Pacific 2024, 43, 100963. [Google Scholar] [CrossRef]
  10. Saraceno, G.F.; Abrego-Guandique, D.M.; Cannataro, R.; Caroleo, M.C.; Cione, E. Machine Learning Approach to Identify Case-Control Studies on ApoE Gene Mutations Linked to Alzheimer’s Disease in Italy. BioMedInformatics 2024, 4, 600–622. [Google Scholar] [CrossRef]
  11. Barrett, T.; Wilhite, S.E.; Ledoux, P.; Evangelista, C.; Kim, I.F.; Tomashevsky, M.; Marshall, K.A.; Phillippy, K.H.; Sherman, P.M.; Holko, M.; et al. NCBI GEO: Archive for functional genomics data sets—Update. Nucleic Acids Res. 2013, 41, D991–D995. [Google Scholar] [CrossRef] [PubMed]
  12. Vickers, K.C.; Palmisano, B.T.; Shoucri, B.M.; Shamburek, R.D.; Remaley, A.T. MicroRNAs are transported in plasma and delivered to recipient cells by high-density lipoproteins. Nat. Cell Biol. 2011, 13, 423–433. [Google Scholar] [CrossRef]
  13. Dorrity, M.W.; Saunders, L.M.; Queitsch, C.; Fields, S.; Trapnell, C. Dimensionality reduction by UMAP to visualize physical and genetic interactions. Nat. Commun. 2020, 11, 1537. [Google Scholar] [CrossRef]
  14. Ru, Y.; Kechris, K.J.; Tabakoff, B.; Hoffman, P.; Radcliffe, R.A.; Bowler, R.; Mahaffey, S.; Rossi, S.; Calin, G.A.; Bemis, L.; et al. The multiMiR R package and database: Integration of microRNA–target interactions along with their disease and drug associations. Nucleic Acids Res. 2014, 42, e133. [Google Scholar] [CrossRef] [PubMed]
  15. The Gene Ontology Consortium. The Gene Ontology Resource: 20 years and still GOing strong. Nucleic Acids Res. 2019, 47, D330–D338. [Google Scholar] [CrossRef] [PubMed]
  16. Kanehisa, M.; Furumichi, M.; Tanabe, M.; Sato, Y.; Morishima, K. KEGG: New perspectives on genomes, pathways, diseases and drugs. Nucleic Acids Res. 2017, 45, D353–D361. [Google Scholar] [CrossRef]
  17. Szklarczyk, D.; Gable, A.L.; Nastou, K.C.; Lyon, D.; Kirsch, R.; Pyysalo, S.; Doncheva, N.T.; Legeay, M.; Fang, T.; Bork, P.; et al. The STRING database in 2021: Customizable protein–protein networks, and functional characterization of user-uploaded gene/measurement sets. Nucleic Acids Res. 2021, 49, D605–D612. [Google Scholar] [CrossRef]
  18. Bader, G.D.; Hogue, C.W.V. An automated method for finding molecular complexes in large protein interaction networks. BMC Bioinformatics 2003, 4, 2. [Google Scholar] [CrossRef]
  19. Nasab, A.S.; Noorani, F.; Paeizi, Z.; Khani, L.; Banaei, S.; Sadeghi, M.; Shafeghat, M.; Shafie, M.; Mayeli, M. A Comprehensive Investigation of the Potential Role of Lipoproteins and Metabolite Profile as Biomarkers of Alzheimer’s Disease Compared to the Known CSF Biomarkers. Int. J. Alzheimers. Dis. 2023, 2023, 3540020. [Google Scholar] [CrossRef]
  20. Ruiz, M.; Frej, C.; Holmér, A.; Guo, L.J.; Tran, S.; Dahlbäck, B. High-Density Lipoprotein–Associated Apolipoprotein M Limits Endothelial Inflammation by Delivering Sphingosine-1-Phosphate to the Sphingosine-1-Phosphate Receptor 1. Arterioscler. Thromb. Vasc. Biol. 2017, 37, 118–129. [Google Scholar] [CrossRef]
  21. Wagner, J.; Riwanto, M.; Besler, C.; Knau, A.; Fichtlscherer, S.; Röxe, T.; Zeiher, A.M.; Landmesser, U.; Dimmeler, S. Characterization of levels and cellular transfer of circulating lipoprotein-bound microRNAs. Arterioscler. Thromb. Vasc. Biol. 2013, 33, 1392–1400. [Google Scholar] [CrossRef]
  22. Niculescu, L.S.; Simionescu, N.; Sanda, G.M.; Carnuta, M.G.; Stancu, C.S.; Popescu, A.C.; Popescu, M.R.; Vlad, A.; Dimulescu, D.R.; Simionescu, M. MiR-486 and miR-92a identified in circulating HDL discriminate between stable and vulnerable coronary artery disease patients. PLoS ONE 2015, 10, e0140958. [Google Scholar] [CrossRef] [PubMed]
  23. Kawahata, I.; Fukunaga, K. Protein Kinases and Neurodegenerative Diseases. Int. J. Mol. Sci. 2023, 24, 5574. [Google Scholar] [CrossRef] [PubMed]
  24. Etchegaray, J.I.; Elguero, E.J.; Tran, J.A.; Sinatra, V.; Feany, M.B.; McCall, K. Defective Phagocytic Corpse Processing Results in Neurodegeneration and Can Be Rescued by TORC1 Activation. J. Neurosci. 2016, 36, 3170. [Google Scholar] [CrossRef]
  25. Schmidt, M.F.; Gan, Z.Y.; Komander, D.; Dewson, G. Ubiquitin signalling in neurodegeneration: Mechanisms and therapeutic opportunities. Cell Death Differ. 2021, 28, 570–590. [Google Scholar] [CrossRef] [PubMed]
  26. Heras-Sandoval, D.; Pérez-Rojas, J.M.; Hernández-Damián, J.; Pedraza-Chaverri, J. The role of PI3K/AKT/mTOR pathway in the modulation of autophagy and the clearance of protein aggregates in neurodegeneration. Cell. Signal. 2014, 26, 2694–2701. [Google Scholar] [CrossRef] [PubMed]
  27. Morrison, K.R.; Solly, E.L.; Shemesh, T.; Psaltis, P.J.; Nicholls, S.J.; Brown, A.; Bursill, C.A.; Tan, J.T.M. Elevated HDL-bound miR-181c-5p level is associated with diabetic vascular complications in Australian Aboriginal people. Diabetologia 2021, 64, 1402–1411. [Google Scholar] [CrossRef]
  28. Jääskeläinen, O.; Solje, E.; Hall, A.; Katisko, K.; Korhonen, V.; Tiainen, M.; Kangas, A.J.; Helisalmi, S.; Pikkarainen, M.; Koivisto, A.; et al. Low Serum High-Density Lipoprotein Cholesterol Levels Associate with the C9orf72 Repeat Expansion in Frontotemporal Lobar Degeneration Patients. J. Alzheimers Dis. 2019, 72, 127–137. [Google Scholar] [CrossRef]
  29. Wu, Q.; Sheng, Q.; Michell, D.; Ramirez-Solano, M.; Posey, O.; Phothisane, A.; Shaik, S.; Vickers, K.C.; Ormseth, M.J. Anti-Inflammatory Effect of High-Density Lipoprotein Blunted by Delivery of Altered MicroRNA Cargo in Patients With Rheumatoid Arthritis. Arthritis Rheumatol. 2024, 76, 684–695. [Google Scholar] [CrossRef]
  30. Rosenson, R.S.; Brewer, H.B.; Ansell, B.J.; Barter, P.; Chapman, M.J.; Heinecke, J.W.; Kontush, A.; Tall, A.R.; Webb, N.R. Dysfunctional HDL and atherosclerotic cardiovascular disease. Nat. Rev. Cardiol. 2016, 13, 48–60. [Google Scholar] [CrossRef]
  31. Watts, M.E.; Williams, S.M.; Nithianantharajah, J.; Claudianos, C. Hypoxia-Induced MicroRNA-210 Targets Neurodegenerative Pathways. Non-Coding RNA 2018, 4, 10. [Google Scholar] [CrossRef]
  32. Sauer, M.; Was, N.; Ziegenhals, T.; Wang, X.; Hafner, M.; Becker, M.; Fischer, U. The miR-26 family regulates neural differentiation-associated microRNAs and mRNAs by directly targeting REST. J. Cell Sci. 2021, 134, jcs257535. [Google Scholar] [CrossRef] [PubMed]
  33. Barros-Viegas, A.T.; Carmona, V.; Ferreiro, E.; Guedes, J.; Cardoso, A.M.; Cunha, P.; Pereira de Almeida, L.; Resende de Oliveira, C.; Pedro de Magalhães, J.; Peça, J.; et al. miRNA-31 Improves Cognition and Abolishes Amyloid-β; Pathology by Targeting APP and BACE1 in an Animal Model of Alzheimer’s Disease. Mol. Ther. Nucleic Acids 2020, 19, 1219–1236. [Google Scholar] [CrossRef] [PubMed]
  34. Wallach, T.; Mossmann, Z.J.; Szczepek, M.; Wetzel, M.; Machado, R.; Raden, M.; Miladi, M.; Kleinau, G.; Krüger, C.; Dembny, P.; et al. MicroRNA-100-5p and microRNA-298-5p released from apoptotic cortical neurons are endogenous Toll-like receptor 7/8 ligands that contribute to neurodegeneration. Mol. Neurodegener. 2021, 16, 80. [Google Scholar] [CrossRef] [PubMed]
  35. Weinberg, R.B.; Mufson, E.J.; Counts, S.E. Evidence for a neuroprotective microRNA pathway in amnestic mild cognitive impairment. Front. Neurosci. 2015, 9, 430. [Google Scholar] [CrossRef]
  36. Peña-Bautista, C.; Álvarez-Sánchez, L.; Cañada-Martínez, A.J.; Baquero, M.; Cháfer-Pericás, C. Epigenomics and Lipidomics Integration in Alzheimer Disease: Pathways Involved in Early Stages. Biomedicines 2021, 9, 1812. [Google Scholar] [CrossRef]
  37. Krüger, D.M.; Pena-Centeno, T.; Liu, S.; Park, T.; Kaurani, L.; Pradhan, R.; Huang, Y.; Risacher, S.L.; Burkhardt, S.; Schütz, A.; et al. The plasma miRNAome in ADNI: Signatures to aid the detection of at-risk individuals. Alzheimers Dement. 2024, 20, 7479–7494. [Google Scholar] [CrossRef]
  38. Liu, S.; Park, T.; Krüger, D.M.; Pena-Centeno, T.; Burkhardt, S.; Schutz, A.; Huang, Y.; Rosewood, T.; Chaudhuri, S.; Cho, M.; et al. Plasma miRNAs across the Alzheimer’s disease continuum: Relationship to central biomarkers. Alzheimers Dement. 2024, 20, 7698–7714. [Google Scholar] [CrossRef]
  39. Abrego-Guandique, D.M.; Cione, E.; Caroleo, M.C.; Bonilla, D.A.; Cannataro, R. Ketogenic diet and microRNAs: Focus on cognitive function. Front. Nutr. 2025, 12, 1545832. [Google Scholar] [CrossRef]
  40. Abrego Guandique, D.M.; Radbakhsh, S.; Bacchetti, T.; Aghaee-Bakhtiari, S.H.; Mahmoudi, A.; Akhonpour Manteghi, A.; Bazyari, M.J.; Cione, E.; Ferretti, G.; Sahebkar, A. Trehalose effect in patients with Alzheimer’s disease: Focus on circulating microRNAs assessed by direct hybridization. FEBS Open Bio 2024, 14, 2–91. [Google Scholar] [CrossRef]
  41. Abrego-Guandique, D.M.; Saraceno, G.F.; Cannataro, R.; de Burnside, M.M.; Caroleo, M.C.; Cione, E. Apolipoprotein E and Alzheimer’s Disease in Italian Population: Systematic Review and Meta-Analysis. Brain Sci. 2024, 14, 908. [Google Scholar] [CrossRef] [PubMed]
  42. Fortea, J.; Pegueroles, J.; Alcolea, D.; Belbin, O.; Dols-Icardo, O.; Vaqué-Alcázar, L.; Videla, L.; Gispert, J.D.; Suárez-Calvet, M.; Johnson, S.C.; et al. APOE4 homozygozity represents a distinct genetic form of Alzheimer’s disease. Nat. Med. 2024, 30, 1284–1291. [Google Scholar] [CrossRef] [PubMed]
  43. Hong, B.V.; Zheng, J.; Agus, J.K.; Tang, X.; Lebrilla, C.B.; Jin, L.-W.; Maezawa, I.; Erickson, K.; Harvey, D.J.; DeCarli, C.S.; et al. High-Density Lipoprotein Changes in Alzheimer’s Disease Are APOE Genotype-Specific. Biomedicines 2022, 10, 1495. [Google Scholar] [CrossRef] [PubMed]
  44. Tabet, F.; Vickers, K.C.; Cuesta Torres, L.F.; Wiese, C.B.; Shoucri, B.M.; Lambert, G.; Catherinet, C.; Prado-Lourenco, L.; Levin, M.G.; Thacker, S.; et al. HDL-transferred microRNA-223 regulates ICAM-1 expression in endothelial cells. Nat. Commun. 2014, 5, 3292. [Google Scholar] [CrossRef]
  45. Cione, E.; Michelini, S.; Abrego-Guandique, D.M.; Vaia, N.; Michelini, S.; Puleo, V.; Bertelli, M.; Caroleo, M.C.; Cannataro, R. Identification of Specific microRNAs in Adipose Tissue Affected by Lipedema. Curr. Issues Mol. Biol. 2024, 46, 11957–11974. [Google Scholar] [CrossRef]
Figure 1. UMAP and boxplot analysis of dataset GSE25425. (A) UMAP plot showing the distribution of three samples (GSM618037, GSM618038, and GSM618039) in a two-dimensional space. Each point represents a sample. (B) Boxplot representing the distribution of expression values for the three samples. The boxes display the median, interquartile range (IQR), and data spread for each sample.
Applbiosci 04 00034 g001
Figure 2. Expression density and mean-variance trend of dataset GSE25425. (A) Density plot showing the distribution of expression intensity values across samples. The curves represent the smoothed density for each sample, highlighting the overall spread and distribution of expression values. The peaks indicate the most frequent expression intensities, with a relatively consistent distribution among samples. (B) Mean-variance trend plot showing the relationship between the average log-expression (x-axis) and the square root of variance (sigma, y-axis) for all probes in the dataset.
Applbiosci 04 00034 g002
Figure 3. The most abundant miRNAs in HDL fractions.
Applbiosci 04 00034 g003
Figure 4. KEGG pathways analysis. The color of each dot represents the p.adjust of each term involved in the analysis. The size of each dot represents the counts of overlapped genes between the input genes and the total gene list on the KEGG pathway. The size of each dot represents the number of genes contributing to the term (count), and the color indicates the significance level (p.adjust), with red being more significant. The gene ratio on the x-axis denotes the proportion of genes mapped to each term.
Applbiosci 04 00034 g004
Figure 5. Protein–protein interaction (PPI) network of predicted target genes of HDL-specific miRNAs. The network was generated using the STRING database and visualized in Cytoscape. Each node represents a protein encoded by a gene targeted by at least one of the HDL-specific microRNAs. Edges indicate known or predicted functional associations based on curated databases, experimental data, co-expression, and text mining. Node colors reflect different functional clusters or modules identified through network topology-based clustering. Thicker edges denote stronger interaction confidence scores.
Applbiosci 04 00034 g005
Figure 6. PPI sub-network of key target genes regulated by HDL-enriched miRNAs. The cluster network by Molecular Complex Detection (MCODE) displays a curated subset of high-confidence protein targets modulated by HDL-specific miRNAs. Nodes represent individual proteins, while edges represent experimentally validated or predicted functional associations.
Applbiosci 04 00034 g006
Table 1. The scores of important centralities.
NodesNode DegreeBetweennessCloseness
GAPDH340.25150.7285
AKT1290.15130.6799
GSK3B260.08260.6219
MTOR190.03110.6071
BCL2190.04740.5930
CALM3190.03640.5730
KRAS170.01330.5483
VCP170.08700.5862
RPS27A170.02510.5483
UBB150.01730.5312
BDNF90.00130.5609
Disclaimer/Publisher’s Note: The statements, opinions and data contained in all publications are solely those of the individual author(s) and contributor(s) and not of MDPI and/or the editor(s). MDPI and/or the editor(s) disclaim responsibility for any injury to people or property resulting from any ideas, methods, instructions or products referred to in the content.

