Article

Exploring the Synergistic Impacts of Cover Crops and Fertilization on Soil Microbial Metabolic Diversity in Dryland Soybean Production Systems Using Biolog EcoPlates

by
Durga P. M. Chinthalapudi
1,2,
Sapna Pokhrel
3,
William L. Kingery
1,
Mark W. Shankle
4 and
Shankar Ganapathi Shanmugam
1,2,*
1
Department of Plant and Soil Sciences, Mississippi State University, Starkville, MS 39762, USA
2
Institute for Genomics, Biocomputing and Biotechnology, Mississippi State University, Starkville, MS 39762, USA
3
School of Plant and Environmental Sciences, Virgina Tech, Blacksburg, VA 24061, USA
4
Pontotoc Ridge-Flatwoods Branch Experiment Station, North Mississippi Research and Extension Center, 8320, Hwy 15 South, Pontotoc, MS 38863, USA
*
Author to whom correspondence should be addressed.
Appl. Biosci. 2023, 2(3), 328-346; https://doi.org/10.3390/applbiosci2030022
Submission received: 11 May 2023 / Revised: 29 June 2023 / Accepted: 30 June 2023 / Published: 6 July 2023
(This article belongs to the Special Issue Feature Papers in Applied Biosciences 2023)

Abstract

:
The metabolic diversity of soil microbiota embodies diverse functional capabilities that support ecosystem resilience, driving essential biogeochemical processes and facilitating the optimization of sustainable agricultural systems. Integrating cover crops into agricultural systems cultivates a diverse array of metabolic activities among soil microbes, synergistically enhancing ecosystem services and bolstering soil health for sustainable and productive farming practices. In an effort to gain deeper insights and expand our knowledge, we conducted a study examining the effects of cover crops and fertilizer sources, thereby shedding light on their combined impacts on the metabolic activity dynamics of soil microbial communities. In this investigation, we employed a split-plot design with two factors: (a) cover crop with three solo cover crop species—Cereal rye (Secale cereale), wheat (Triticum aestivum), hairy vetch (Vicia villosa), and one mixture of mustard (Brassica rapa) and cereal rye (Secale cereale) (CC-mix), (b) Fertilizer source includes poultry litter, chemical fertilizer, and no-fertilizer treatments. We assessed the metabolic potential of soil microbiota by using carbon substrates utilizing Biolog EcoPlates. The findings revealed that the plots with CC-mix treatment exhibited greater metabolic diversity compared to the other treatments, while among the fertilizer sources, poultry litter demonstrated higher metabolic activity. Furthermore, both treatment factors predominantly metabolized carbohydrates and polymers compared to other carbon substrate categories. The principal component analysis accounted for 46.4% of the variance, collectively represented by PC1 and PC2, emphasizing the substantial contributions of carbohydrates, amino acids, and carboxylic acids to the observed metabolic diversity. Canonical correspondence analysis revealed that pH had positively correlated with microbial functional diversity, whereas total carbon (TC), total nitrogen (TN), and water-stable aggregates (WSA) showed a negative correlation. In conclusion, cover cropping and type of fertilizer source had a notable impact on soil microbial functional diversity, with the cover crop mixture exhibiting a more pronounced influence than the individual cover crop treatments.

1. Introduction

Soil is a highly diverse, intricate, and dynamic ecosphere that comprises numerous living and non-living elements persistently communicating with each other. Soil health can undergo changes over time as a result of both natural occurrences and human activities. Soil health is improved through effective management and land-use choices that consider the diverse functions of soil [1]. Unsustainable soil management practices worsened soil erosion, a deterioration in soil microbiome activity, and a consequent reduction in nutrient availability for plant uptake [2]. Nature-based solutions (NBS) strategies, such as reduced soil tillage, soil covering with crop residuals or cover crops, soil amendments, and crop rotation to achieve microbial diversity, have been suggested as a substitution for conventional agriculture for improving soil health characteristics [3]. The association between soil biology and agricultural sustainability is paramount, as microbes play a pivotal role in facilitating the decomposition of intricate organic compounds into plant-available forms [4].
Over the past few years, our comprehension of soil microbial communities in dryland ecosystems has broadened, as these organisms play a vital role in maintaining soil health and ecosystem functions [5]. For instance, the soil microbiome mediates various essential ecosystem services, such as nitrogen incorporation [6], organic carbon decomposition, carbon capture [7], bio-remediation of environmental pollutants [3], and resistance to biotic and abiotic stresses [8,9]. Nonetheless, such ecosystem services are compromised by intensive farming systems and tillage practices [10] due to excessive synthetic fertilizers and monoculture cropping systems [10]. This lowers soil microbial functional diversity, which significantly influences crop performance [11]. Expanding diversified cropping systems promotes sustainable agriculture, potentially improving ecosystem functioning by enhancing soil microbial diversity as observed in natural ecosystems [12,13]. The objective is to enhance the functional diversity of soil microbiota by promoting microbial diversity, thereby boosting its capacity to metabolize a broad range of organic substances. Introducing diversity in organic matter residues in agricultural systems, e.g., cover crop mixtures, is anticipated to enhance functional diversity [14,15]. Integration of cover crops and organic amendments alters the abundance, diversity, and metabolic activities of microoganisms present in the agricultural soils, and these altered microbial groups have various effects on their soil ecosystem services [16], which require further exploration.
A large body of literature specifies that, different cover crops with varying crop rotations and periods have diverse impacts and roles on soil health properties and microorganisms [17,18]. The legume cover crops are potent nitrogen fixers (i.e., symbiotic association with Rhizobium) and can transform atmospheric nitrogen into available forms (NH3 and NH4) [19]. Legumes generate residue with a comparatively higher nitrogen content that is readily degradable and accessible to crops and soil microbes. Grass species with their root system have strong nutrient scavenging capability, specifically for N, and hence have been used to reduce N leaching [20]. Brassicaceous species cover crops have a deep root system, can provide an allelopathic effect to control weeds, and have bio fumigation properties for the suppression of soil pathogens [21,22]. Cover crops are characterized by their rapid growth rate and exhibit a range of C:N ratios, leading to the production of residues that possess a stoichiometry that differs from microbial biomass [23]. Winter cover crops such as cereal rye and hairy vetch are widely utilized due to their ability to withstand low temperatures, incorporate substantial biomass [24], N fixing [25], and stimulate soil biological activity [26]. Three-year research conducted by Buyer et al. (2010) reported that incorporating vetch and rye into crop rotations significantly enhanced soil microbial biomass and metabolic activity [27]. In addition, cover crops, compost, and manure are recognized as vital factors in sustainable farming as they supply vital nutrients to plants, enhance soil structure and quality, and add organic matter [28].
Single-cover crop species cannot deliver all the benefits for soil health [29]. Therefore, multifunctional cover crops, such as combining legumes and grasses or integrating multispecies mixture into crop production systems, can be more advantageous for improving soil health since they can expand the variety of substrates available to the ecosystem and provide a number of ecosystem services [29,30]. The inclusion of plant mixtures with varying C:N ratios can provide diverse substrate options for the soil system, which might expand the niche breadth of the soil microbiota, thus enhancing its metabolic potential [31]. For instance, a combination of oats, radish, and vetch showed significant enhancement in the abundance of gram-positive bacteria, and phosphatase function using phospholipid fatty acid analysis more effectively than a combination of oats and radish [32]. Given that different cover crop species have chemically different root exudates, Housman et al. (2021) reported that higher microbial biomass and improved enzymatic activity in multiple cover crops compared to solo species also differed effects between species [33]. Moreover, elevated soil microbial functional activity was observed in cover crop mixture plots compared to solo treatments [30].
The biological variation of microbial community composition is being studied from three perspectives, viz., species diversity, genetic diversity, and functional diversity [34,35]. The functional diversity of soil microbiome is a component of biodiversity that comprises a broad range of metabolic behaviors that can affect many elements of ecosystem functions, such as ecological stability, nutrient cycling, ecosystem dynamics, and so on [36]. Identifying the functional microbial diversity in soils entails selecting the most appropriate approaches for examining the maximum diversity present in the samples.
Cultivation-dependent approaches require the preparation of cell suspensions, dilution, inoculation on solid media, and phenotypic examination of microbial species. The majority of research on the structure of heterotrophic microbial communities has used isolate-based techniques [37]. The isolation of microbial samples varies among species, and cell type (cell, spore, or mycelium) generates bias. Furthermore, designing nutrient media and appropriate conditions for all members of microbial communities presents a significant challenge, which are major disadvantages of these approaches [36]. Microbial lipid-based techniques without actual culturing of the microorganisms, namely, PLFA and fatty acid methyl ester (FAME), have been extensively used for the examination of microbiome metabolic and compositional changes due to agricultural practices [38]. These techniques, however, unquestionably have drawbacks, including complicated operational protocols, time-consuming assays, poor precision, and inconsistent repeatability [39,40].
Community-Level Physiological Profiling (CLPP) offers an alternative approach, comparing and categorizing microbial communities based on their utilization of carbon substrates. The Biolog® EcoPlatesTM (Biolog Inc., Hayward, CA, USA) has been specifically designed to examine the functional diversity of microbial communities. This plate has 31 separate carbon source wells, each with three replications, representing six different types of carbon compound families: carbohydrates, carboxylic acids, amino acids, polymers, amines, and phenolic compounds, with a blank well as a control [41]. The principle behind this assay involves the reduction reaction of water-soluble colorless triphenyl tetrazolium chloride to purple triphenyl formazan [41]. This technique is straightforward to implement, as it does not necessitate the use of isolated cultures and preserves the metabolic traits of microbial communities at optimal levels [42].
Soybean (Glycine max L.) is a legume oil seed crop known to fix atmospheric nitrogen through symbiotic interactions with soil bacteria [43]. It has numerous applications, including the production of soy milk, soy sauces, tofu, edible oil, economically recoverable phytohormones, and biodiesel. Traditional soybean monoculture has been coupled with numerous ecological concerns, especially regarding soil health parameters, such as loss of organic matter [44] and available phosphorus [45]. Soil conservation and sustainable agriculture approaches such as cover cropping, crop rotations, and organic fertilizers have widely been recognized as substitutes for soybean monocropping with positive influences on soil organic carbon, aggregate soil stability, nutrient cycling, N fixation, and high-water holding capacity [46,47,48].
The ecosystem services of different cover crops with fertilizer sources vary, which allows us to evaluate cover crop-mediated soil health promotion processes specific to microbial functional diversity and to correlate soil physicochemical characteristics such as pH, organic carbon, active carbon (POXC), total nitrogen, and glomalin in dryland soybean production systems. Overall, the objective of this experiment was to examine the effect of cover crops and different types of fertilizer sources (organic and inorganic) on microbial community composition, functional diversity, and soil health parameters.
In this experiment, we executed of two-year field study in which cover crop solo and mixture species were integrated into dryland soybean production systems to test the following hypotheses:
  • Soil microbial functional diversity and soil health characteristics were positively affected by cover crop mixtures and organic amendments in dryland soybean production systems.
  • Cover crop mixture leads to higher microbial functional diversity compared to solo cover crop treatments.

2. Materials and Methods

2.1. Description of the Experimental Sites

The study area was situated at the Pontotoc Ridge-Flatwoods Branch Experimental Station in Pontotoc, MS, USA (34°09′ N, 88°58′ W). The soil type at the research location belongs to the Atwood silt loam series, characterized as a semi-active, mixed soil with fine-silty texture, thermic Typic Paleudalf, situated on a moderate 3% slope. The soil here consists of 13.9% clay, 17.6% sand, and 68.5% silt (Soil Survey, Natural Resources Conservation Service (NRCS)). The investigation was carried out under rainfed and zero tillage conditions, with initial soil characterization at the experimental site revealing 1.57% organic matter and a pH of 6.67. Prior to this study, the experimental site had been planted with corn and soybeans for 2016 and 2017, respectively. Cover crops were established in 2016 and maintained until 2019, while soybeans were cultivated from 2017–2019. The study site has an average January temperature of 5.4 °C, an average July temperature of 23 °C, and an annual average rainfall of 1483 mm [49].

2.2. Experimental Design and Field Methods

The study was arranged in a split-plot arrangement with a randomized block design and three replications each. In this experiment, two factors—cover crops as a primary factor and fertilizer source as a secondary factor were taken into consideration. The experimental design comprised 15 whole plots of 167.2 m2 each, with 45 sub-plots of 74.3 m2 designated for the different cover crop and fertilizer source treatments.
Cover crops included cereal rye (Secale cereale) (CR), wheat (Triticum aestivum) (WT), vetch (Vicia villosa) (VT), mustard (Brassica juncia) + cereal rye (CC-mix), and native vegetation (NV) (no cover crop with natural weeds) as a control. Sub-factor fertilizer sources contained poultry litter (PL) as an organic amendment, inorganic fertilizer (P, K, and S; CL), and no fertilizer (NO) as a control. Detailed information regarding cover crop planting dates, management practices, fertilizer source chemical composition, and application dosages was described by Pokhrel et al. (2021) [50].

2.3. Soil Sampling and Analysis of Physicochemical Properties

At each plot, soil samples were collected at rhizosphere region 1–15 cm depth after the termination of cover crops. Roughly 500 g of soil was collected into a Ziplock bag and preserved at a −20 °C freezer used for estimation of the metabolic diversity of microbial species. Soil physicochemical characters such as total C, active carbon (POXC), total nitrogen, glomalin (EE-GRSP), water stable aggregate (WSA), and soil pH were estimated from samples that were air-dried overnight, grounded, and passed through a 2.0 mm sieve. Detailed protocols for estimating these soil parameters were described in our previous studies [16,50].

2.4. BiologTM EcoPlates

The community-level physiological profiling of soil microbiota was analyzed using BiologTM EcoPlates. Each plate consists of 31 wells with different carbon sources and one control well. All these are replicated three times to control variation in the sample inoculum. The consumption of carbon substrates in wells by microbial communities results in the color development of their respective wells. This color development is quantified spectrophotometrically using a plate reader. Firstly, 10 g of soil was measured and placed in a 250 mL conical flask, then added 100 mL of sterilized NaCl solution (0.85%), later agitated at 150 rpm for 30 min, and then left undisturbed in a refrigerator for 30 min. The clear suspension was transferred to a petri dish, and with the help of a multi-channel pipette, samples were loaded into a Biolog EcoPlate. The inoculated sample plates were placed in the dark during incubation at 25 °C, and absorbance was measured using a BioTek 800 TS (AgilentTM, Santa Clara, CA, USA) microplate reader every 24 h for five days.

2.5. Soil Microbial Communities Catabolic Profiling

2.5.1. Quantification of Average Well Color Development in Biolog EcoPlates Wells

The metabolic process of soil microbial populations in individual wells of Biolog EcoPlate leads to the formation of formazan, thus change in color of the tetrazolium dye is induced [42]. The absorbance values of individual wells at 590 nm wavelength represent metabolic activity and are expressed as average well color development (AWCD) [37].
A W C D = i 31 C i R n
Here, Ci represents the absorbance value (OD) of each well containing a carbon source; R represents the absorbance value of a blank well (without carbon substrate); and n represents the total number of wells with carbon substrates.

2.5.2. Determination of Diversity Indices of Microbial Populations:

Average well-color development estimated from Biolog EcoPlates can be utilized to estimate microbial metabolic diversity indices proposed by Yan (2011) [51]. Absorbance measurements and optical density (OD) at 96 h were employed to estimate the average well-color development and metabolic diversity parameters. This time point was selected as it exhibited an ideal range of absorbance values for the analysis. The following functional diversity parameters were calculated:
(1)
Shannon Diversity Index (H′):
H = i = 1 31 P i ( ln P i )
Here, P i represents the ratio between ( C i R ) and the total absorbance of the total plate wells. ln denotes the natural logarithm with respect to P i . The Shannon diversity index (H’) is used to measure the microbial communities’ heterogeneousness based on the concept of uncertainty. Higher uncertainty refers to greater diversity present in communities, and it gives microbial species diversity and evenness within the community.
(2)
Shannon Evenness Index (E):
E = H ln S
This method centers on the uniformity of absorbance values at each well for all utilized carbon substrates [41]. In this equation, S represents the total absorbance value of 31 wells. The Shannon evenness index (E) identifies the evenness of microbial-type abundance in the communities.
(3)
Inverse Simpson Diversity Index (1/D):
D = n i × ( n i 1 ) N × ( N 1 )
The Simpson Diversity Index accounts for both the overall number of species and the proportional representation of each individual species [52]. In this formula, n i denotes the relative absorbance value in each i th well; N is the sum of the absorbance values of 31 wells [23]. The inverse Simpson diversity index (1/D) defines the species diversity by estimating the probability of one species encountering another [53].
(4)
McInthosh Index (U):
U = ( n i 2 )
The McInthosh index was calculated according to [54]. Where, n i is corrected absorbance value with blank, i.e., ( C i R ). It measures the microbial communities’ homogeneity [55].
(5)
Substrate richness (SR):
Substrate richness (R) refers to the count of carbon substrates that are utilized by soil microorganisms. It was estimated as the sum of oxidized wells, which had to be at least 0.5 after 96 h incubation [56].
(6)
Statistical analysis:
Diversity parameters were calculated using Microsoft Excel Version 16.74 (Microsoft Corporation 2023, Redmond, WA, USA). Analysis of variance (ANOVA) and LSD (least significant differences) for two factors was performed for the cover crop and fertilizer source factors using JMP®, Version 17.0. SAS Institute Inc., Cary, NC, 1989–2021. The plots were generated using the ‘ggplot2’ package Wickham (2016) within the R programming language (R Core Team, 2023) [57] and Sigma Plot, Version 15 (Systat Software Inc., San Jose, CA, USA).
To assess the functional composition of the bacterial community, we conducted a Principal Component Analysis (PCA) on the corrected values of Biolog absorbance. The Biolog absorbance values were adjusted by subtracting the absorbance values from the control well of the Biolog EcoPlate. PCA is a widely used statistical technique that simplifies complex multidimensional data into a smaller set of interpretable variables called principal components [37]. This analysis enabled us to examine whether the measured variables could effectively differentiate the soil management treatments based on their principal components. PERMANOVA is a multivariate statistical method that allows for the analysis of dissimilarities in microbial community composition based on categorical or continuous variables. It helps to determine whether there are significant differences in community structure between different treatments or groups [58]. In addition to PCA, Canonical Correspondence Analysis (CCA) was applied to explore and visualize the relationships between microbial communities and environmental variables. CCA helped us identify the key environmental factors that influenced the composition of microbial communities, providing valuable insights into the ecological processes that shape the dynamics of the microbial community [59].
The PERMANOVA (Permutational Multivariate Analysis of Variance) test, CCA (Canonical Correspondence Analysis), and PCA (Principal Component Analysis) were performed using a vegan package in R programming language [60].

3. Results

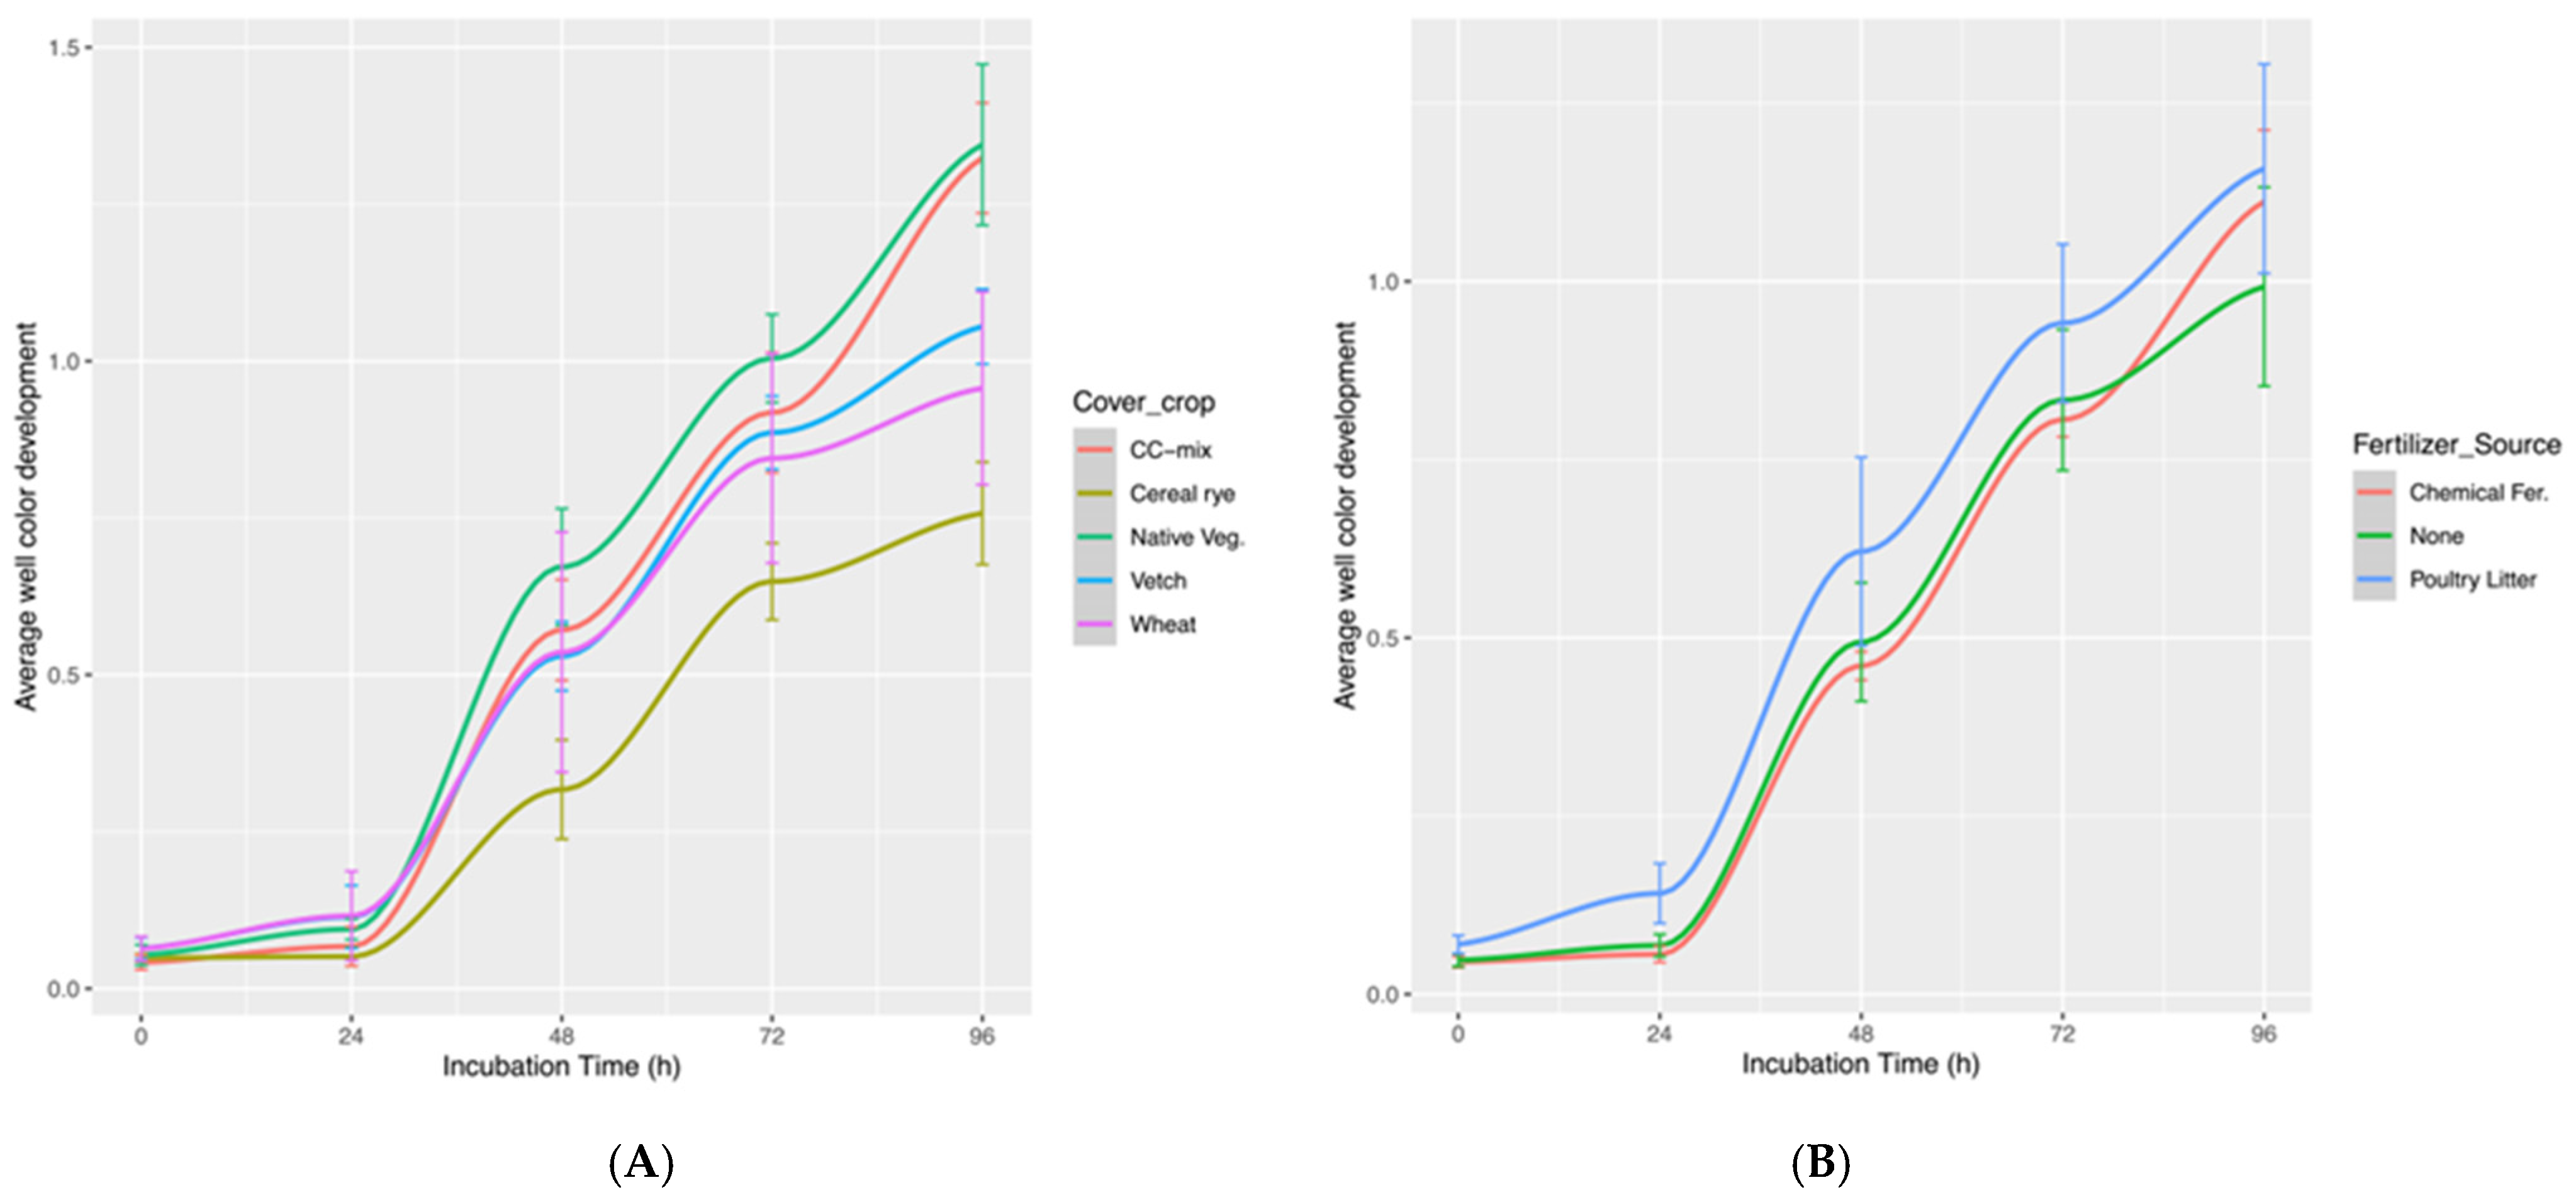
3.1. Differences in AWCD over Time in Soils with Cover Crops and Fertilizer Source Treatment

Generally, the amount of carbon substrate utilization is directly proportional to the metabolic ability of the respective microbial communities, as determined by AWCD [37]. Our results showed that AWCD values increased over time, indicating that soil microbiome has a greater ability to utilize carbon substrates when there is a longer interaction with the substrate (Figure 1A,B). The results revealed that the AWCD values from 0 to 24 h for all treatments were small, indicating a noticeable lag phase in the first 24 h. After 24 h, the metabolic activity of microbial populations rapidly increased for all treatments, indicating soil microbes were at their growth phase and capable of utilizing carbon substrates in plates.
Cereal rye treatment consistently exhibited the lowest AWCD at all incubation periods. Native vegetation treatment had significantly higher AWCD after 24, 48 h, and 72 h than other cover crop treatments followed by CC-mix (p < 0.05) (Figure 1A). After 96 h of incubation, both native vegetation and CC-mix had similar AWCD, which was higher than the remaining cover crop treatments. In regard to fertilizer source treatments, AWCD was highest with PL (Poultry litter) treatment, followed by chemical fertilizer. The fertilizer treatment exhibited the lowest AWCD after a 96-h incubation period (Figure 1B). During the entire incubation period, the AWCD values for each cover crop followed the following pattern NV > CC-mix > VT > WT > CR. These results suggest that the metabolic activity of soil microbial communities in utilizing carbon substrates differs among cover crops and fertilizer sources.

3.2. Influence of Cover Cropping and Fertilizer Source Treatments on Microbial Metabolic Diversity Indices

Absorbance measured as OD values at 96 h were used for the estimation of functional diversity parameters and average well-color development since these indicated the optimal range of absorbance. The influence of cover crops and fertilization on functional diversity indices such as the Shannon diversity index (H’), Shannon evenness index (E), McIntosh index (U), substrate richness (R), and inverse Simpson index (1/D) of soil microbial communities is shown in Table 1.
All the functional diversity indices except 1/D demonstrated significant differences (p < 0.05). The H’, E, R, and 1/D indices were most pronounced in the CC-mix treatment, succeeded by native vegetation and vetch treatments, whereas the values observed in the cereal rye treatment were considerably lower. Additionally, the native vegetation treatment demonstrated the highest AWCD and U values.
In the poultry litter treatment, the highest values were observed across all functional diversity indices, including AWCD, and were closely followed by the chemical fertilizer treatment (Table 1). Notably, significant differences were observed between fertilizer source treatments for diversity indices, with the exception of 1/D.
The microbial functional diversity indices also exhibited significant variations, which were influenced by the interaction between cover crop and fertilizer source treatments. Notably, the CC-mix + PL treatment demonstrated the highest values for all the diversity indices, followed by CC-mix + CL treatment for AWCD, U, and R indices and NV + NO for H’ and E. The soil samples under CR + NO treatment, on the other hand, displayed lower values for all the diversity indices. These results generally align with the patterns observed for the main effects of cover crop, except for the WT + PL treatment, which displayed higher values compared to the vetch treatment in combination with other fertilizer sources (Table 2).

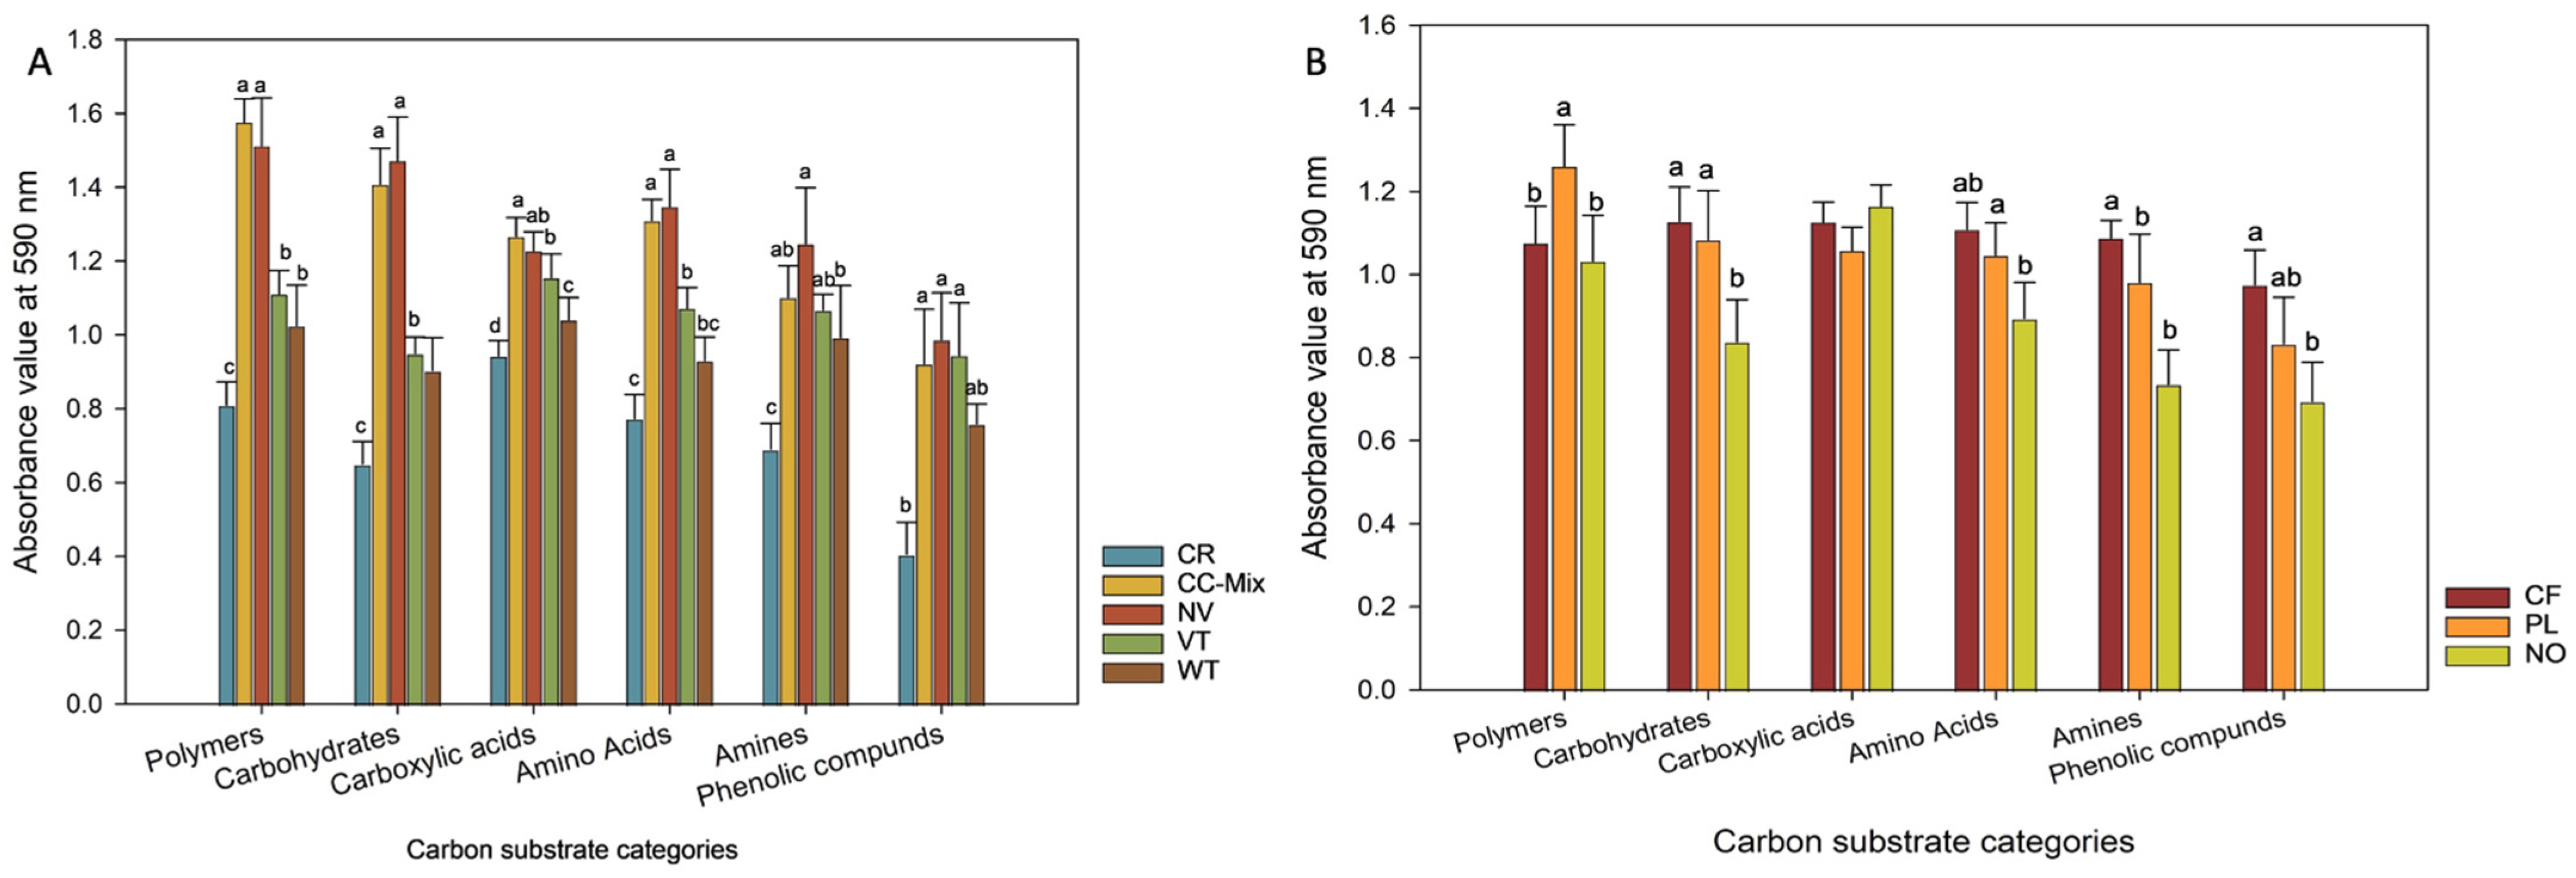
3.3. Classification of Carbon Substrate Utilization Categories in Biolog EcoPlate

The Biolog EcoPlate comprises 31 carbon substrates, which are classified into six distinct categories: carbohydrates, carboxylic acids, amino acids, polymers, amines, and phenolic acids (Table 3).
The metabolic activity of soil microbial populations on these six different categories of carbon substrates distinctly varies among cover crops and fertilizer source treatments. Figure 2A,B showed that the relative utilization of different carbon group substrates significantly differs with treatments (p < 0.001).
In the CC-mix treatment, higher utilization of carbon substrates in the polymer and carboxylic acid groups was observed, while the microbial communities from native vegetation treatment showed the highest consumption of carbohydrates, amino acids, amines, and phenolic compounds. Among fertilizer source treatments, the chemical fertilizer treatment showed greater carbon substrate utilization across all carbon groups except polymers, while the highest consumption of polymer group carbon substrates was evident in the poultry litter treatment. Collectively, both treatments indicated that carbohydrates and polymers were the primary carbon substrate groups harnessed by soil microbial communities residing within their respective treatments.

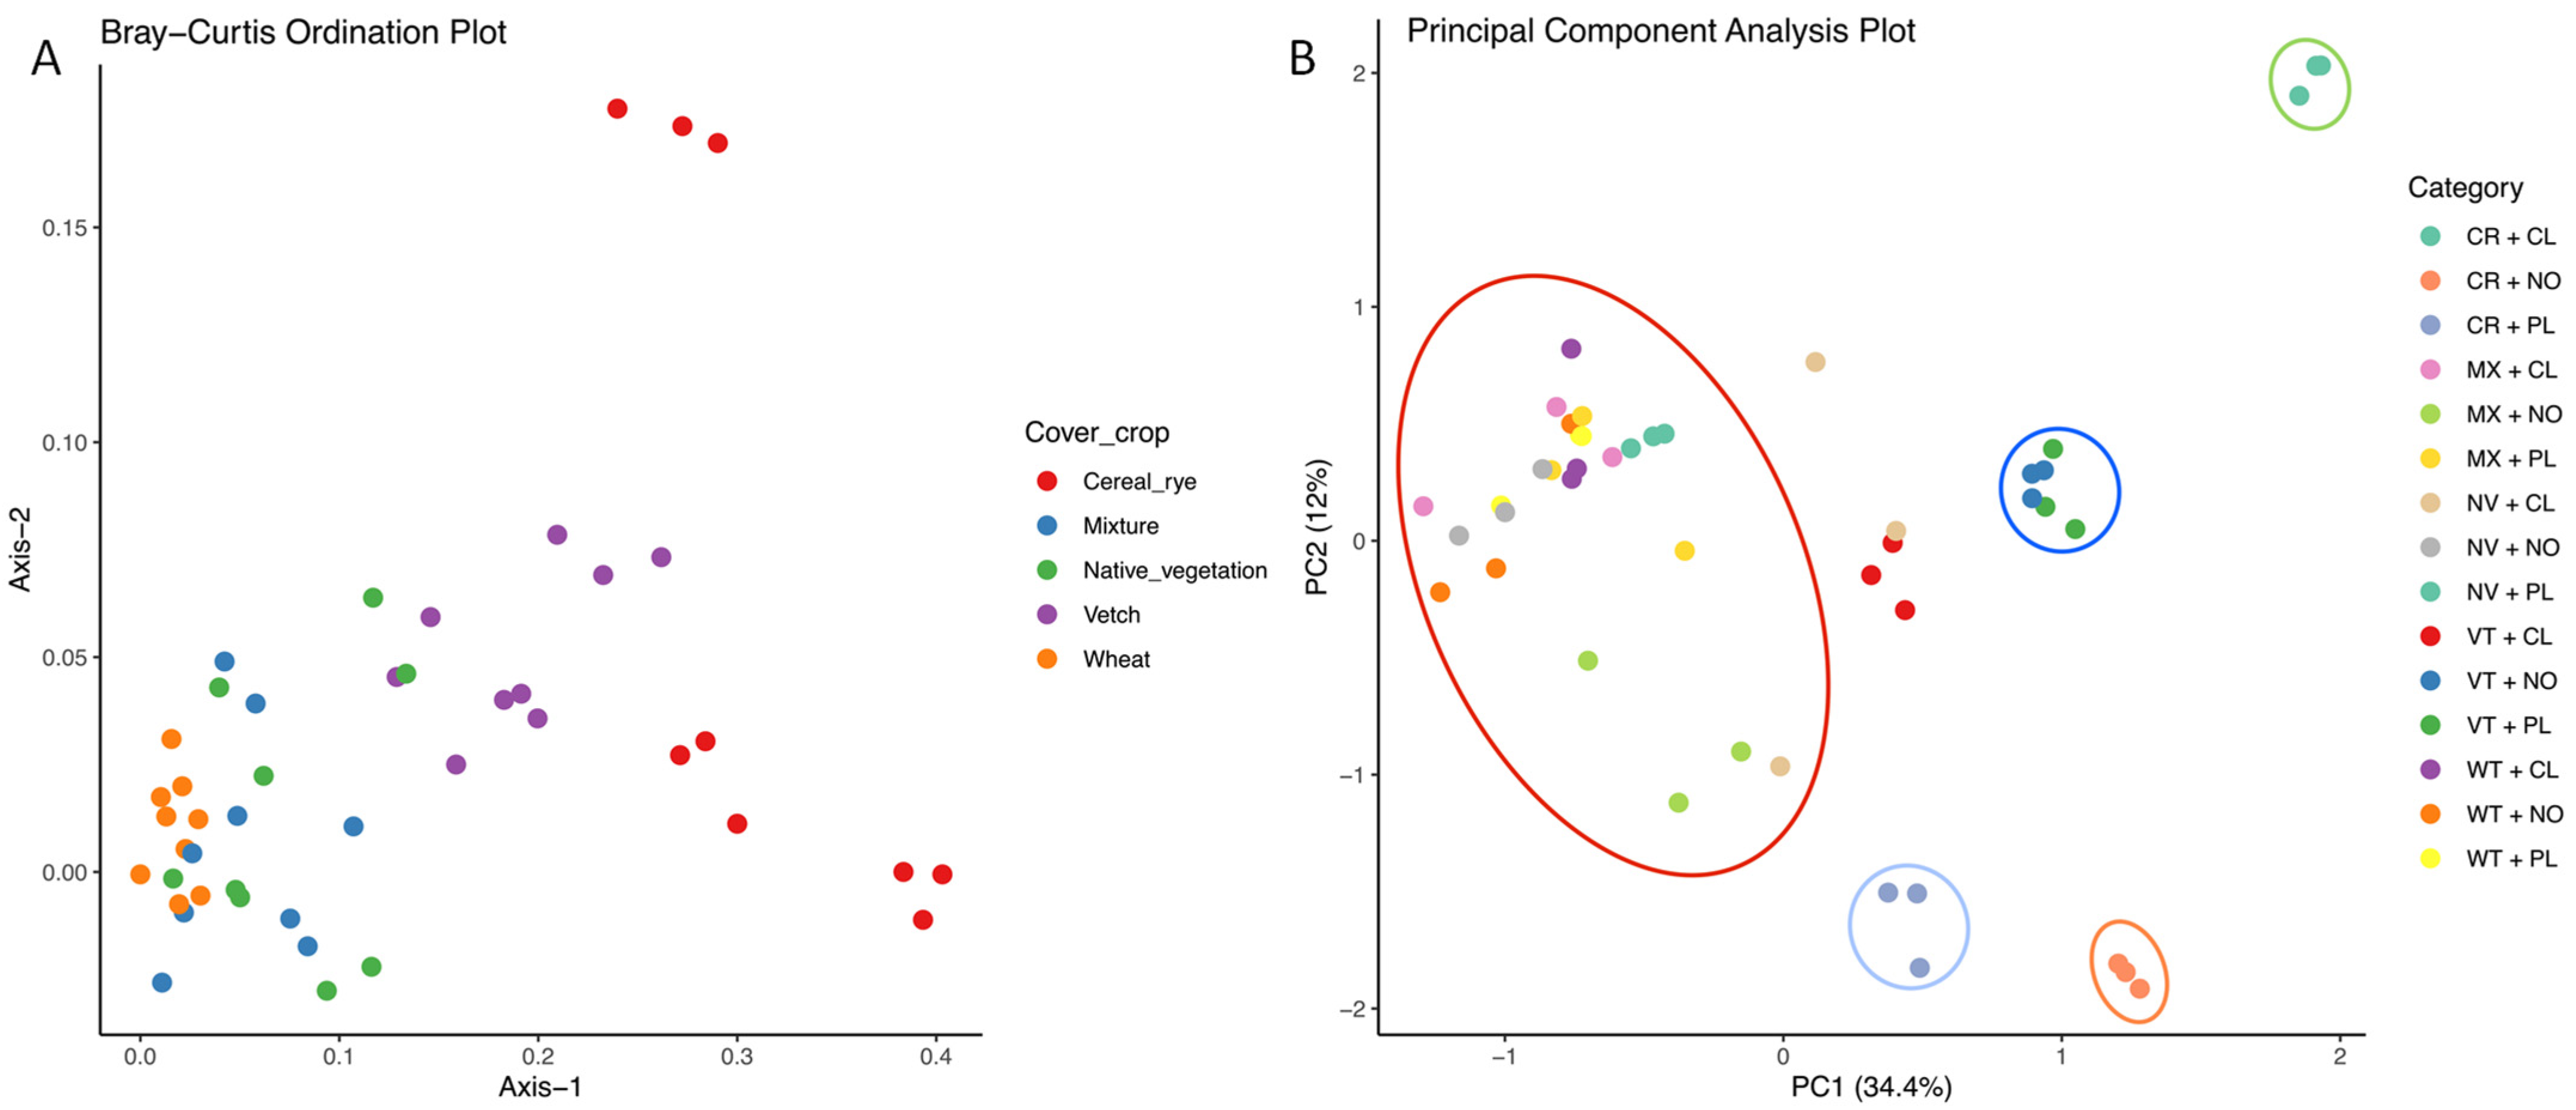
3.4. Analysis of Carbon Substrate Utilization by Soil Microbial Communities Using Principal Component Analysis (PCA)

To establish the degree of separation of treatments in relation to carbon substrate utilization, each of the cover crop and fertilizer treatments was subjected to principal component analysis and Bray–Curtis ordination. Principal components—PC1 and PC2 scores for 31 carbon substrates are given in Table 3. The higher loading scores represent larger effects of carbon substrate on the principal components. The first and second principal components described 34.4% and 12% variation, respectively. As shown in Figure 3A, there were distinct differences in the utilization of soil microbial communities from different cover crop treatments (PERMANOVA, p = 0.009).
The results from the principal component analysis showed that PC1 was positively correlated to carbon sources, including L-Asparagine, Tween 40, D- Malic acid, D- Galacturonic acid, D-Mannitol, Putrescine, Gamma-Amino-Butyric acid, N-Acetyl-D-Glucosamine, L-Arginine, and D-Glucosaminic acid, as evidenced by their high loading scores exceeding 0.5 (Table 3). On the other hand, PC2 showed a positive correlation with Glucose-1-Phosphate, Alpha-D-Lactose, and I-Erythritol. Collectively, these results highlight the significant contribution of carbohydrates, amino acids, and carboxylic acids to the two principal components.

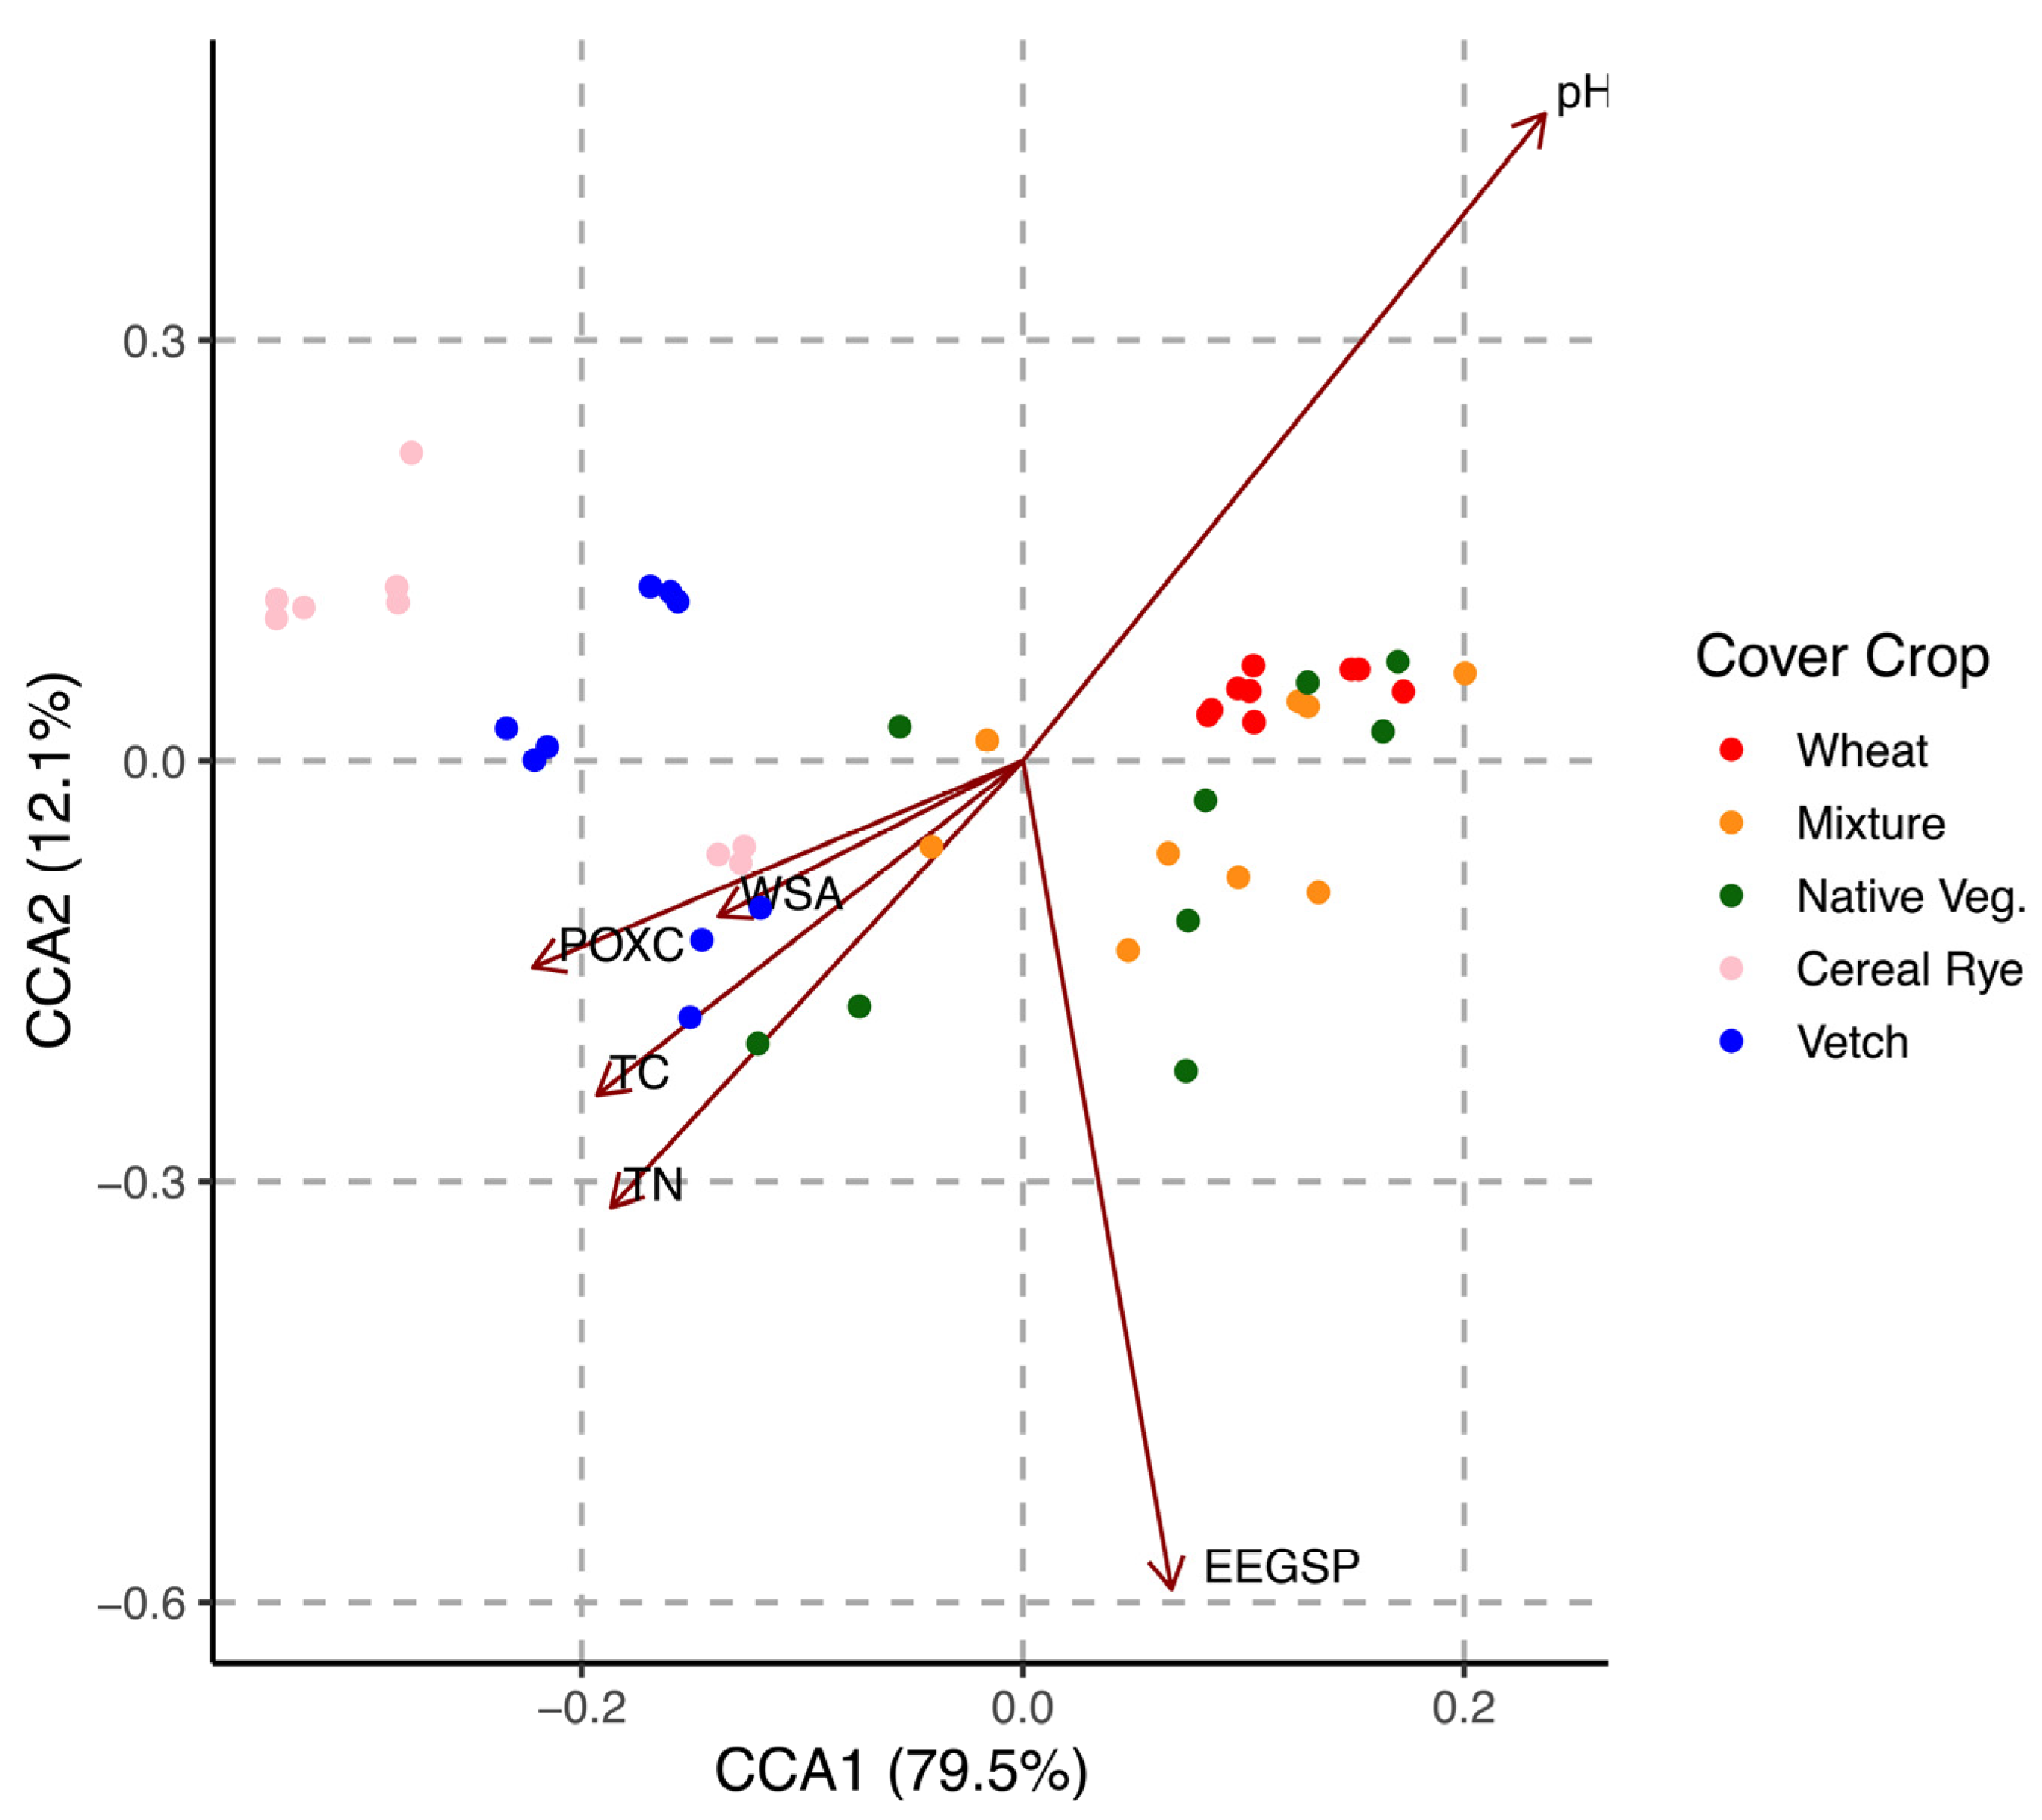
3.5. Association between Soil Microbial Metabolic Diversity and Soil Physicochemical Characteristics

The effects of cover crops and fertilizer source treatments on soil physicochemical characteristics are given in Table 4.
A canonical correspondence analysis (CCA) was carried out on the soil physicochemical properties and carbon substrate groups (Figure 4). The initial two CCA axes accounted for 79.5% and 12.1% of the variability in data, respectively. The cumulative amount of interpretation of the first 2 CCA axes reached 92.06 %, which could reflect the association between microbial community species based on carbon group utilization and soil parameters. The soil pH = 0.7367 indicated a substantial positive correlation with the major axis of the CCA, whereas total carbon TC = −0.28704, total nitrogen TN = −0.31267, and POXC = −0.25727 displayed a negative association.
The CCA also revealed a strong positive correlation between carbon substrate groups and primary axes, such as carbohydrates (0.94), polymers (0.67), and a bit less to carboxylic acids (0.39) and amino acids (0.23).

4. Discussion

This is one of the few experiments investigating the synergistic effects of cover cropping and fertilizer sources on both the physicochemical properties of the soil and the functional diversity of the microbial community. We hypothesized that the synergistic effects of cover crops and fertilizer sources would cause significant differences in the metabolic diversity and distribution of soil microbial populations. The results showed that different cover crop and fertilizer source treatments exerted different impacts on the metabolic activities of soil microorganisms in soybean fields.
AWCD is proportional to the number and species diversity of soil microbes that can metabolize carbon substrates, and it indicates the carbon source catabolic activity of microbial communities to utilize the carbon substrates [37,61]. In the present investigation, AWCD of soil microbial populations from cover crop and fertilizer source treatments exhibited classic microbial growth over time as the duration of incubation increased (Figure 1A,B), and these results were in accordance with other findings [40,53]. In this experiment, during the entire incubation period, native vegetation and cover crop mix (cereal rye + mustard) exhibited higher AWCD values than wheat, vetch, and cereal rye. Elevated values of average well-color development (AWCD) indicate a higher level of metabolic activity exhibited by soil microbial populations [62]. Additionally, plots with cover crop mix treatment showed high Shannon diversity and substrate richness, whereas native vegetation showed high U and E. Drost et al. (2020) reported multiple cover crop species results in elevated amounts of substrate niches that increased the functional diversity of soil microbial populations [30].
Incorporating a mix of two or more species in cover cropping can provide additional benefits by promoting both the abundance of beneficial soil microbial populations and the diversity of the soil microbiota [63]. The quality of the residue from cover crops, such as cereal rye, mustard, vetch, and wheat, differed significantly. Additionally, different types of fertilizer sources were used in our two-year study. Despite these variations, our findings showed that the community-level physiological profiling using the Biolog EcoPlates exhibited convergence in diversity indices between cover crop mix and native vegetation treatments. Studies have shown that mixed cover crops favor the release of certain allelochemicals, primary metabolites, and secondary metabolites significantly alter the soil microbial abundance and their functions [53]. However, cover crop biomass, quality, different soil types, C:N ratio of residues, environmental circumstances, and their interactions significantly influence the abundance and functional diversity of soil microbial populations [64]. Consistently, the cereal rye treatment exhibited the lowest average well-color development (AWCD) values, as well as lower diversity index values, which is consistent with previous findings [28]. The AWCD of the vetch cover crop was moderate relative to other treatments, as were the indexes of microbial functional diversity. Vetch, being a leguminous cover crop, has a low C: N ratio and decomposes rapidly, leading to the availability of more nitrogen in the soil. This is reflected in the significant differences observed in the soil’s physicochemical properties compared to other treatments (p = 0.0018, Table 4).
The AWCD values of fertilizer source treatments were also significantly different. Plots with poultry litter treatment showed higher AWCD than chemical fertilizer and no fertilizer (Table 1); these findings are similar to the other discoveries. Many researchers reported application of organic amendments results in elevated soil microbiological activity as determined by dehydrogenase function, which reflects the complete range of oxidative activity of microbial populations [65,66]. The utilization of organic amendments has been widely recognized for its beneficial impact on the structure and functioning of soil microbial communities [67,68,69,70]. A study conducted by Marinari et al. (2000) [67], it was found that the application of organic fertilizers resulted in enhanced soil microbial activity. The researchers attributed this effect to a synergistic interaction between the microbial populations present in the soil and the organic materials used as fertilizers.
The combined effects of fertilizer source and cover crop demonstrated significant differences in functional diversity parameters. Specifically, the soil samples from the CC-mix + poultry litter treatment plot exhibited higher values across all functional diversity indices. This outcome is likely attributed to the synergistic benefits derived from the combination of mixed cover crop species and the application of poultry litter as a fertilizer. Furthermore, it is interesting to note that the soil samples from the wheat + poultry litter treatment plot also displayed higher values compared to the main effects of wheat and even outperformed the main effects of the vetch treatment. This suggests that the addition of poultry litter to the wheat plot might have a greater contribution to the microbial communities in that specific plot.
Additionally, our observations revealed that cereal rye, as a cover crop in the main effects analysis, displayed lower values in the functional diversity indices. Interestingly, this pattern persisted when examining the combined effects of cereal rye with different fertilizer sources. The consistently lower values suggest that the influence of cover crops, as a collective factor, exerts a stronger impact on the functional diversity indices compared to individual cover crop effects alone. This finding highlights the significance of considering the combined effects of cover crops and fertilizer sources in shaping microbial functional diversity in the soil.
A total of 31 carbon substrates are classified into six categories, and the metabolism patterns of these six categories were significantly different among treatments (p < 0.001). Cover crop mix had a higher metabolism rate of polymers and carboxylic acids, whereas microbial communities under native vegetation treatment showed higher utilization of carbohydrates, amines, and phenolic compounds. Overall, both cover crop and fertilizer source treatments showed that carbohydrates and polymers were mainly used by the microbial populations in the soil. These results were in accordance with Lan et al. (2019) [53].
Nivelle et al. (2016) reported higher metabolism of phenolic compounds and carbohydrates under no-tillage with oats, phacelia, and flax [71]. Many researchers have reported a high degree of carbohydrate utilization by soil microbial communities in the uppermost soil layer (0–10 cm) [28,72], owing to the presence of sugars and organic matter generated by the decomposition process and rhizodeposits. This abundance of carbohydrates in the topsoil may offer greater accessibility to soil microbial communities. The higher utilization of polymers (Glycogen, alpha-cyclodextrin, tween-80, and tween-40) was observed by CC-mix treatment. Generally, these carbon substrates are more stable or recalcitrant; specifically, tween-40 and tween-80 don’t represent plant-derived products [73]; furthermore, they are often found in processed organic matter [74]. The microbial communities also exhibited better utilization of amines which includes phenylethylamine and putrescine. Additionally, phenylethylamine was discovered in fermented soybean, whereas putrescine was produced in a variety of soybean plant material, including immature roots [75,76]. These results infer that the major crop also has a role in structuring metabolic patterns of soil microbial populations.
Fertilizer source treatments also exhibited significant differences among the utilization of carbon groups. Poultry litter had higher consumption of polymers, whereas chemical fertilizer had higher utilization of carbohydrates, carboxylic acids, amino acids, amines, and phenolic compounds. Guanghua et al. (2008) reported chemical fertilizer treatment metabolized more polymers, whereas chemical fertilizer + FYM showed higher utilization rates in carboxylic acids, which contradicted our findings [77].
Through CCA analysis, it was determined that total carbon, total nitrogen, and POXC had a negative correlation with carbon substrate categories, indicating that these parameters have an effect on the metabolism of different carbon substrate categories in different cover crops and fertilizer sources. The soil characters’ pH and EEGSP positively correlated with the primary axis. Similar results were reported by Lan et al. (2019) [53]; however, they conducted an investigation in forest soils of Eucalyptus trees.
The present investigation revealed varying utilization patterns of the six categories of carbon substrates among the soil microbial communities subjected to different treatments (Figure 2A,B); this may be attributed to the varied structures of soil microbial communities resulting from the different treatments involving cover crop and fertilizer source. However, carbohydrates were found to be the dominant carbon substrate utilized across all treatments, as indicated by the results of principal component analysis (PCA). The PCA results further indicated that carbohydrates made the largest contribution to both PC1 and PC2, followed by amino acids and carboxylic acids. Polymers are also highly metabolized by soil microbial populations in CC-mix treatment; however, PCA didn’t reveal in the first two components.
Treatments strongly influenced microbial functional diversity distribution in both ordination plots; the differences in utilization of carbon substrates across cover crop and fertilizer source plots significantly influenced microbial functional diversity distribution (Figure 3A,B). The PCA separation suggests the significant combined effects of cover cropping and fertilizer sources on soil microbial metabolic activity and functional diversity (Figure 3B). The Bray–Curtis ordination plot clearly shows the grouping of wheat, cover crop mix, and native vegetation, whereas vetch and cereal rye formed separate groups. These results infer that grass species cover crops harboring soil microorganisms with similar catabolic profiles, whereas vetch, which is leguminous species distributed separately. The effect of fertilizer sources on vetch and cereal rye is also evident in the PCA ordination plot (Figure 3B). The use of different fertilizer sources with cereal rye resulted in the formation of three separate groups, indicating that the application of poultry litter, chemical fertilizer, or no fertilizer creates distinct microbial communities with unique catabolic profiles. Similarly, vetch with poultry litter and no fertilizer formed a single group, while vetch with chemical fertilizer formed a separate group. These results infer that combined impacts of cover cropping and fertilizer source significantly influence the metabolic activity and community structure of soil microbiota. To further confirm our findings, we conducted PERMANOVA, which revealed that both cover crops and fertilizer sources significantly influenced the metabolic patterns of soil microbial communities (p = 0.0012 (PCA), p = 0.009 (Bray–Curtis)). Our results are consistent with previous studies by Nair and Ngouajio (2012), Bucher and Lanyon (2005), and Gomez et al. (2005) that investigated the impact of organic manures such as compost, dairy manure, and FYM on the metabolic activity of soil microbiota [28,78,79].
Recent breakthroughs in plant-microbe interaction studies have demonstrated that plants may alter their rhizosphere microbial communities [80,81]. In addition to this, several primary metabolites, including sugars and organic acids, are secreted by soybean into the rhizosphere [82,83]. In addition to soybean root exudates, the root system of cover crops may supply alternate carbon pools that impact soil microorganisms’ metabolic activity and community structure in soybean fields.

5. Conclusions

Our study demonstrated that the Biolog EcoPlates approach utilizing community-level physiological profiling methodology was capable of detecting short-term changes resulting from management techniques. Our results showed that organic amendment considerably enhanced microbial functional diversity. We also demonstrated how the implementation of cover cropping impacted the functional diversity and metabolic capacity of the soil microbiota. Soil microbes occur in the active/labile portion of soil organic matter participating in various soil ecological services; thus, soil microbial metabolic activities may respond more rapidly than physicochemical properties of soils to changes in management techniques such as the use of cover crops, organic amendments application, and tillage operations or environmental circumstances [78]. Our results also demonstrated that cover cropping with multispecies can enhance and alter the metabolic diversity of soil microbial communities and the association between cover crop species and microbial communities’ metabolic patterns. Our findings suggest that the incorporation of cover crops, especially muti-species, could potentially benefit dryland soybean production through enhanced soil microbial metabolic diversity. However, it is important to note that these results only reflect a portion of the entire microbial communities in the soil to a limited extent; some microbial species don’t metabolize carbon substrates in the Biolog EcoPlates, and some might be in a dormant state and couldn’t be accounted for the overall metabolic diversity of microbial communities. Novel approaches like soil metagenomics (amplicon sequencing and shotgun metagenomics) should be utilized to further explore how carbon substrate associated with management practices affect the abundance, species diversity, and in-depth metabolic patterns of soil microbial populations.

Author Contributions

Conceptualization, M.W.S.; methodology, S.G.S. and W.L.K.; investigation, M.W.S., S.P., W.L.K. and S.G.S.; writing—original draft, D.P.M.C.; writing—review and editing, S.G.S. and M.W.S.; supervision, M.W.S. and S.G.S.; data curation and visualization, S.G.S. and D.P.M.C.; formatting and submission, S.G.S.; funding acquisition, M.W.S. All authors have read and agreed to the published version of the manuscript.

Funding

The research presented in this study was made possible through funding provided by the Mississippi Soybean Promotion Board (MSPB) under project number 21-2020, which was awarded to Mark W. Shankle.

Institutional Review Board Statement

Not Applicable.

Informed Consent Statement

Not Applicable.

Data Availability Statement

The corresponding author can be contacted for access to the data presented in this study upon request.

Acknowledgments

We extend our sincere gratitude to the dedicated individuals at the Pontotoc Ridge-Flatwoods Branch Experiment Station, located in Pontotoc, MS, USA. Their invaluable assistance in setting up the experimental site and conducting field operations is greatly appreciated. Additionally, we would like to express our deep appreciation to the lab members, colleagues, and friends from the Department of Plant and Soil Sciences and the Institute of Genomics Biocomputing and Biotechnology, Mississippi State University, who provided support and assistance throughout the duration of this study. Their contributions and guidance were instrumental in the successful execution of this research. We are immensely grateful for the collaborative efforts and contributions of all those involved, as their collective expertise and support were vital in the completion of this project.

Conflicts of Interest

The authors declare no conflict of interest.

References

  1. Doran, J.W. Soil Health and Global Sustainability: Translating Science into Practice. Agric. Ecosyst. Environ. 2002, 88, 119–127. [Google Scholar] [CrossRef] [Green Version]
  2. Bogužas, V.; Skinulienė, L.; Butkevičienė, L.M.; Steponavičienė, V.; Petrauskas, E.; Maršalkienė, N. The Effect of Monoculture, Crop Rotation Combinations, and Continuous Bare Fallow on Soil CO2 Emissions, Earthworms, and Productivity of Winter Rye after a 50-Year Period. Plants 2022, 11, 431. [Google Scholar] [CrossRef] [PubMed]
  3. Norris, C.E.; Congreves, K.A. Alternative Management Practices Improve Soil Health Indices in Intensive Vegetable Cropping Systems: A Review. Front. Environ. Sci. 2018, 6, 50. [Google Scholar] [CrossRef]
  4. Friedel, J.K.; Gabel, D.; Stahr, K. Nitrogen Pools and Turnover in Arable Soils under Different Durations of Organic Farming: II: Source-and-Sink Function of the Soil Microbial Biomass or Competition with Growing Plants? J. Plant. Nutr. Soil Sci. 2001, 164, 421–429. [Google Scholar] [CrossRef]
  5. Lüneberg, K.; Schneider, D.; Siebe, C.; Daniel, R. Drylands Soil Bacterial Community Is Affected by Land Use Change and Different Irrigation Practices in the Mezquital Valley, Mexico. Sci. Rep. 2018, 8, 1413. [Google Scholar] [CrossRef] [PubMed] [Green Version]
  6. Mahmud, K.; Makaju, S.; Ibrahim, R.; Missaoui, A. Current Progress in Nitrogen Fixing Plants and Microbiome Research. Plants 2020, 9, 97. [Google Scholar] [CrossRef] [Green Version]
  7. Six, J.; Frey, S.D.; Thiet, R.K.; Batten, K.M. Bacterial and Fungal Contributions to Carbon Sequestration in Agroecosystems. Soil Sci. Soc. Am. J. 2006, 70, 555–569. [Google Scholar] [CrossRef]
  8. Enebe, M.C.; Babalola, O.O. The Impact of Microbes in the Orchestration of Plants’ Resistance to Biotic Stress: A Disease Management Approach. Appl. Microbiol. Biotechnol. 2019, 103, 9–25. [Google Scholar] [CrossRef] [Green Version]
  9. Selvakumar, G.; Panneerselvam, P.; Ganeshamurthy, A.N. Bacterial Mediated Alleviation of Abiotic Stress in Crops. In Bacteria in Agrobiology: Stress Management; Maheshwari, D.K., Ed.; Springer: Berlin/Heidelberg, Germany, 2012; pp. 205–224. ISBN 978-3-642-23465-1. [Google Scholar]
  10. Dubey, A.; Malla, M.A.; Khan, F.; Chowdhary, K.; Yadav, S.; Kumar, A.; Sharma, S.; Khare, P.K.; Khan, M.L. Soil Microbiome: A Key Player for Conservation of Soil Health under Changing Climate. Biodivers Conserv. 2019, 28, 2405–2429. [Google Scholar] [CrossRef]
  11. Tsiafouli, M.A.; Thébault, E.; Sgardelis, S.P.; de Ruiter, P.C.; van der Putten, W.H.; Birkhofer, K.; Hemerik, L.; de Vries, F.T.; Bardgett, R.D.; Brady, M.V.; et al. Intensive Agriculture Reduces Soil Biodiversity across Europe. Glob. Chang. Biol. 2015, 21, 973–985. [Google Scholar] [CrossRef] [Green Version]
  12. Fierer, N.; Strickland, M.S.; Liptzin, D.; Bradford, M.A.; Cleveland, C.C. Global Patterns in Belowground Communities. Ecol. Lett. 2009, 12, 1238–1249. [Google Scholar] [CrossRef]
  13. Wagg, C.; Bender, S.F.; Widmer, F.; van der Heijden, M.G.A. Soil Biodiversity and Soil Community Composition Determine Ecosystem Multifunctionality. Proc. Natl. Acad. Sci. USA 2014, 111, 5266–5270. [Google Scholar] [CrossRef]
  14. Baumann, K.; Marschner, P.; Smernik, R.J.; Baldock, J.A. Residue Chemistry and Microbial Community Structure during Decomposition of Eucalypt, Wheat and Vetch Residues. Soil Biol. Biochem. 2009, 41, 1966–1975. [Google Scholar] [CrossRef]
  15. Hättenschwiler, S.; Tiunov, A.V.; Scheu, S. Biodiversity and Litter Decomposition in Terrestrial Ecosystems. Annu. Rev. Ecol. Evol. Syst. 2005, 36, 191–218. [Google Scholar] [CrossRef]
  16. Kodadinne Narayana, N.; Kingery, W.L.; Shankle, M.W.; Ganapathi Shanmugam, S. Differential Response of Soil Microbial Diversity and Community Composition Influenced by Cover Crops and Fertilizer Treatments in a Dryland Soybean Production System. Agronomy 2022, 12, 618. [Google Scholar] [CrossRef]
  17. Fageria, N.K.; Baligar, V.C.; Bailey, B.A. Role of Cover Crops in Improving Soil and Row Crop Productivity. Commun. Soil Sci. Plant Anal. 2005, 36, 2733–2757. [Google Scholar] [CrossRef]
  18. Balota, E.; Calegari, A.; Nakatani, A.; Coyne, M. Benefits of Winter Cover Crops and No-Tillage for Microbial Parameters in a Brazilian Oxisol: A Long-Term Study. Agri. Ecosyst. Environ 2014, 197, 31–40. [Google Scholar] [CrossRef] [Green Version]
  19. Somenahally, A.; DuPont, J.I.; Brady, J.; McLawrence, J.; Northup, B.; Gowda, P. Microbial Communities in Soil Profile Are More Responsive to Legacy Effects of Wheat-Cover Crop Rotations than Tillage Systems. Soil Biol. Biochem. 2018, 123, 126–135. [Google Scholar] [CrossRef]
  20. Kaspar, T.C.; Jaynes, D.B.; Parkin, T.B.; Moorman, T.B.; Singer, J.W. Effectiveness of Oat and Rye Cover Crops in Reducing Nitrate Losses in Drainage Water. Agric. Water Manag. 2012, 110, 25–33. [Google Scholar] [CrossRef]
  21. Haramoto, E.R.; Gallandt, E.R. Brassica Cover Cropping for Weed Management: A Review. Renew. Agric. Food Syst. 2004, 19, 187–198. [Google Scholar] [CrossRef]
  22. Kruger, D.H.M.; Fourie, J.C.; Malan, A.P. Cover Crops with Biofumigation Properties for the Suppression of Plant-Parasitic Nematodes: A Review. S. Afr. J. Enol. Vi. 2013, 34, 287–295. [Google Scholar] [CrossRef] [Green Version]
  23. Xu, W.; Ge, Z.; Poudel, D.R. Application and Optimization of Biolog EcoPlates in Functional Diversity Studies of Soil Microbial Communities. MATEC Web Conf. 2015, 22, 04015. [Google Scholar] [CrossRef]
  24. Lundquist, E.J.; Jackson, L.E.; Scow, K.M.; Hsu, C. Changes in Microbial Biomass and Community Composition, and Soil Carbon and Nitrogen Pools after Incorporation of Rye into Three California Agricultural Soils. Soil Biol. Biochem. 1999, 31, 221–236. [Google Scholar] [CrossRef]
  25. Abdul-Baki, A.A.; Teasdale, J.R.; Korcak, R.; Chitwood, D.J.; Huettel, R.N. Fresh-Market Tomato Production in a Low-Input Alternative System Using Cover-Crop Mulch. HortScience 1996, 31, 65–69. [Google Scholar] [CrossRef] [Green Version]
  26. Carrera, L.M.; Buyer, J.S.; Vinyard, B.; Abdul-Baki, A.A.; Sikora, L.J.; Teasdale, J.R. Effects of Cover Crops, Compost, and Manure Amendments on Soil Microbial Community Structure in Tomato Production Systems. Appl. Soil Ecol. 2007, 37, 247–255. [Google Scholar] [CrossRef]
  27. Buyer, J.S.; Teasdale, J.R.; Roberts, D.P.; Zasada, I.A.; Maul, J.E. Factors Affecting Soil Microbial Community Structure in Tomato Cropping Systems. Soil Biol. Biochem. 2010, 42, 831–841. [Google Scholar] [CrossRef]
  28. Nair, A.; Ngouajio, M. Soil Microbial Biomass, Functional Microbial Diversity, and Nematode Community Structure as Affected by Cover Crops and Compost in an Organic Vegetable Production System. Appl. Soil Ecol. 2012, 58, 45–55. [Google Scholar] [CrossRef]
  29. Chu, M.; Jagadamma, S.; Walker, F.R.; Eash, N.S.; Buschermohle, M.J.; Duncan, L.A. Effect of Multispecies Cover Crop Mixture on Soil Properties and Crop Yield. Agric. Environ. Lett. 2017, 2, 170030. [Google Scholar] [CrossRef] [Green Version]
  30. Sytske, M.D.; Rutgers, M.; Wouterse, M.; Wietse de Boer, P.; Bodelier, L.E. Decomposition of Mixtures of Cover Crop Residues Increases Microbial Functional Diversity. Geoderma 2020, 361, 114060. [Google Scholar] [CrossRef]
  31. Redin, M.; Recous, S.; Aita, C.; Dietrich, G.; Skolaude, A.C.; Ludke, W.H.; Schmatz, R.; Giacomini, S.J. How the Chemical Composition and Heterogeneity of Crop Residue Mixtures Decomposing at the Soil Surface Affects C and N Mineralization. Soil Biol. Biochem. 2014, 78, 65–75. [Google Scholar] [CrossRef]
  32. Chavarría, D.N.; Verdenelli, R.A.; Serri, D.L.; Restovich, S.B.; Andriulo, A.E.; Meriles, J.M.; Vargas-Gil, S. Effect of Cover Crops on Microbial Community Structure and Related Enzyme Activities and Macronutrient Availability. Eur. J. Soil Biol. 2016, 76, 74–82. [Google Scholar] [CrossRef]
  33. Housman, M.; Tallman, S.; Jones, C.; Miller, P.; Zabinski, C. Soil Biological Response to Multi-Species Cover Crops in the Northern Great Plains. Agric. Ecosyst. Environ. 2021, 313, 107373. [Google Scholar] [CrossRef]
  34. Bowles, T.M.; Acosta-Martínez, V.; Calderón, F.; Jackson, L.E. Soil Enzyme Activities, Microbial Communities, and Carbon and Nitrogen Availability in Organic Agroecosystems across an Intensively-Managed Agricultural Landscape. Soil Biol. Biochem. 2014, 68, 252–262. [Google Scholar] [CrossRef]
  35. Bundy, J.G.; Davey, M.P.; Viant, M.R. Environmental Metabolomics: A Critical Review and Future Perspectives. Metabolomics 2009, 5, 3–21. [Google Scholar] [CrossRef]
  36. Prosser, J.I. Molecular and Functional Diversity in Soil Micro-Organisms. In Diversity and Integration in Mycorrhizas; Smith, S.E., Smith, F.A., Eds.; Springer: Dordrecht, The Netherlands, 2002; pp. 9–17. ISBN 978-90-481-5933-8. [Google Scholar]
  37. Garland, J.L.; Mills, A.L. Classification and Characterization of Heterotrophic Microbial Communities on the Basis of Patterns of Community-Level Sole-Carbon-Source Utilization. Appl. Environ. Microbiol. 1991, 57, 2351–2359. [Google Scholar] [CrossRef] [Green Version]
  38. Miura, T.; Makoto, K.; Niwa, S.; Kaneko, N.; Sakamoto, K. Comparison of Fatty Acid Methyl Ester Methods for Characterization of Microbial Communities in Forest and Arable Soil: Phospholipid Fraction (PLFA) versus Total Ester Linked Fatty Acids (EL-FAME). Pedobiologia 2017, 63, 14–18. [Google Scholar] [CrossRef]
  39. Kim, J.-W.; Rehmann, L.; Ray, M.B. Development of Microalgal Bioassay Based on the Community Level Physiological Profiling (CLPP). Algal Res. 2017, 25, 47–53. [Google Scholar] [CrossRef]
  40. Ge, Z.; Du, H.; Gao, Y.; Qiu, W. Analysis on Metabolic Functions of Stored Rice Microbial Communities by BIOLOG ECO Microplates. Front. Microbiol. 2018, 9, 1375. [Google Scholar] [CrossRef] [Green Version]
  41. Sofo, A.; Ricciuti, P. A Standardized Method for Estimating the Functional Diversity of Soil Bacterial Community by Biolog® EcoPlatesTM Assay—The Case Study of a Sustainable Olive Orchard. Appl. Sci. 2019, 9, 4035. [Google Scholar] [CrossRef] [Green Version]
  42. Preston-Mafham, J.; Boddy, L.; Randerson, P.F. Analysis of Microbial Community Functional Diversity Using Sole-Carbon-Source Utilisation Profiles—A Critique. FEMS Microbiol. Ecol. 2002, 42, 1–14. [Google Scholar] [CrossRef]
  43. Gresshoff, P.M.; Hayashi, S.; Biswas, B.; Mirzaei, S.; Indrasumunar, A.; Reid, D.; Samuel, S.; Tollenaere, A.; van Hameren, B.; Hastwell, A.; et al. The Value of Biodiversity in Legume Symbiotic Nitrogen Fixation and Nodulation for Biofuel and Food Production. J. Plant Physiol. 2015, 172, 128–136. [Google Scholar] [CrossRef] [PubMed]
  44. Crop Rotations and Nitrogen Fertilization to Manage Soil Organic Carbon Dynamics—Studdert—2000—Soil Science Society of America Journal—Wiley Online Library. Available online: https://acsess.onlinelibrary.wiley.com/doi/full/10.2136/sssaj2000.6441496x?casa_token=1K9nk6ndXnMAAAAA%3Ah-zsB8QZf6qSdNskQBnm21ylLKSzeoTDor686VzO4EwZS6cHQX78UbjNq95WtJli_P927aW69lnldo (accessed on 24 November 2022).
  45. Fernandez-Gnecco, G.; Smalla, K.; Maccario, L.; Sørensen, S.J.; Barbieri, P.; Consolo, V.F.; Covacevich, F.; Babin, D. Microbial Community Analysis of Soils under Different Soybean Cropping Regimes in the Argentinean South-Eastern Humid Pampas. FEMS Microb. Ecol. 2021, 97, fiab007. [Google Scholar] [CrossRef] [PubMed]
  46. McDaniel, M.D.; Grandy, A.S. Soil Microbial Biomass and Function Are Altered by 12 Years of Crop Rotation. SOIL 2016, 2, 583–599. [Google Scholar] [CrossRef] [Green Version]
  47. Venter, Z.S.; Jacobs, K.; Hawkins, H.-J. The Impact of Crop Rotation on Soil Microbial Diversity: A Meta-Analysis. Pedobiologia 2016, 59, 215–223. [Google Scholar] [CrossRef]
  48. Tamburini, G.; Bommarco, R.; Wanger, T.C.; Kremen, C.; van der Heijden, M.G.A.; Liebman, M.; Hallin, S. Agricultural Diversification Promotes Multiple Ecosystem Services without Compromising Yield. Sci. Adv. 2020, 6, eaba1715. [Google Scholar] [CrossRef] [PubMed]
  49. IPS—Record of Climatological Observations—Select Month|IPS|National Climatic Data Center (NCDC). Available online: https://www.ncdc.noaa.gov/IPS/coop/coop.html?_page=2&state=MS&foreign=false&stationID=227111&_target3=Next+%3E (accessed on 18 April 2023).
  50. Pokhrel, S.; Kingery, W.L.; Cox, M.S.; Shankle, M.W.; Shanmugam, S.G. Impact of Cover Crops and Poultry Litter on Selected Soil Properties and Yield in Dryland Soybean Production. Agronomy 2021, 11, 119. [Google Scholar] [CrossRef]
  51. Zak, J.C.; Willig, M.R.; Moorhead, D.L.; Wildman, H.G. Functional Diversity of Microbial Communities: A Quantitative Approach. Soil Biol. Biochem. 1994, 26, 1101–1108. [Google Scholar] [CrossRef]
  52. Simpson’s Diversity Index. Available online: https://geographyfieldwork.com/Simpson%27sDiversityIndex.htm (accessed on 25 November 2022).
  53. Lan, X.; Du, H.; Peng, W.; Liu, Y.; Fang, Z.; Song, T. Functional Diversity of the Soil Culturable Microbial Community in Eucalyptus Plantations of Different Ages in Guangxi, South China. Forests 2019, 10, 1083. [Google Scholar] [CrossRef] [Green Version]
  54. Zhen, T.; Fan, W.; Wang, H.; Cao, X.; Xu, X. Monitoring Soil Microorganisms with Community-Level Physiological Profiles Using Biolog EcoPlatesTM in Chaohu Lakeside Wetland, East China. Eurasian Soil Sc. 2020, 53, 1142–1153. [Google Scholar] [CrossRef]
  55. YaNan, T.; HongQi, W. Application of biolog to study of environmental microbial function diversity. Environ. Sci. Technol. 2011, 34, 50–57. [Google Scholar]
  56. Németh, I.; Molnár, S.; Vaszita, E.; Molnár, M. The Biolog EcoPlateTM Technique for Assessing the Effect of Metal Oxide Nanoparticles on Freshwater Microbial Communities. Nanomaterials 2021, 11, 1777. [Google Scholar] [CrossRef]
  57. Wickham, H. Ggplot2: Elegant Graphics for Data Analysis, 2nd ed; Use R! Springer: Cham, Switzerland, 2016; ISBN 978-3-319-24277-4. [Google Scholar]
  58. Anderson, M.J.; Walsh, D.C.I. PERMANOVA, ANOSIM, and the Mantel Test in the Face of Heterogeneous Dispersions: What Null Hypothesis Are You Testing? Ecol. Monogr. 2013, 83, 557–574. [Google Scholar] [CrossRef]
  59. Ter Braak, C.J.F. The Analysis of Vegetation-Environment Relationships by Canonical Correspondence Analysis. Vegetatio 1987, 69, 69–77. [Google Scholar] [CrossRef]
  60. Oksanen, J. Vegan: Community Ecology Package. 2010. Available online: http://CRAN.R-project.org/package=vegan (accessed on 6 June 2023).
  61. Choi, K.-H.; Dobbs, F.C. Comparison of Two Kinds of Biolog Microplates (GN and ECO) in Their Ability to Distinguish among Aquatic Microbial Communities. J. Microbiol. Methods 1999, 36, 203–213. [Google Scholar] [CrossRef]
  62. Wang, Y.; Ouyang, Z.; Zheng, H.; Wang, X.; Chen, F.; Zeng, J. Carbon Metabolism of Soil Microbial Communities of Restored Forests in Southern China. J. Soils Sediments 2011, 11, 789–799. [Google Scholar] [CrossRef]
  63. Wortman, S.E.; Francis, C.A.; Bernards, M.L.; Drijber, R.A.; Lindquist, J.L. Optimizing Cover Crop Benefits with Diverse Mixtures and an Alternative Termination Method. Agron. J. 2012, 104, 1425–1435. [Google Scholar] [CrossRef] [Green Version]
  64. Garbeva, P.; van Veen, J.A.; van Elsas, J.D. Microbial Diversity in Soil: Selection Microbial Populations by Plant and Soil Type and Implications for Disease Suppressiveness. Annu. Rev. Phytopathol. 2004, 42, 243–270. [Google Scholar] [CrossRef]
  65. Perucci, P. Enzyme Activity and Microbial Biomass in a Field Soil Amended with Municipal Refuse. Biol. Fertil. Soils 1992, 14, 54–60. [Google Scholar] [CrossRef]
  66. Marinari, S.; Masciandaro, G.; Ceccanti, B.; Grego, S. Influence of Organic and Mineral Fertilisers on Soil Biological and Physical Properties. Bioresour. Technol. 2000, 72, 9–17. [Google Scholar] [CrossRef]
  67. Bulluck, L.R.; Brosius, M.; Evanylo, G.K.; Ristaino, J.B. Organic and Synthetic Fertility Amendments Influence Soil Microbial, Physical and Chemical Properties on Organic and Conventional Farms. Appl. Soil Ecol. 2002, 19, 147–160. [Google Scholar] [CrossRef]
  68. Naidu, R. Influence of Lime, Fertilizer and Manure Applications on Soil Organic Matter Content and Soil Physical Conditions: A Review. Nutr. Cycl. Agroecosyst. 1998, 51, 123–137. [Google Scholar]
  69. Melero, S.; Porras, J.C.R.; Herencia, J.F.; Madejon, E. Chemical and Biochemical Properties in a Silty Loam Soil under Conventional and Organic Management. Soil Tillage Res. 2006, 90, 162–170. [Google Scholar] [CrossRef]
  70. Marschner, H. Ion Uptake Mechanisms of Individual Cells and Roots. In Mineral Nutrition of Higher Plants; Elsevier: Amsterdam, The Netherlands, 1995; pp. 6–78. ISBN 978-0-12-473542-2. [Google Scholar]
  71. Nivelle, E.; Verzeaux, J.; Habbib, H.; Kuzyakov, Y.; Decocq, G.; Roger, D.; Lacoux, J.; Duclercq, J.; Spicher, F.; Nava-Saucedo, J.-E.; et al. Functional Response of Soil Microbial Communities to Tillage, Cover Crops and Nitrogen Fertilization. Appl. Soil Ecol. 2016, 108, 147–155. [Google Scholar] [CrossRef]
  72. Wu, Y.; Lyu, T.; Yue, B.; Tonoli, E.; Verderio, E.A.M.; Ma, Y.; Pan, G. Enhancement of Tomato Plant Growth and Productivity in Organic Farming by Agri-Nanotechnology Using Nanobubble Oxygation. J. Agric. Food Chem. 2019, 67, 10823–10831. [Google Scholar] [CrossRef] [PubMed] [Green Version]
  73. Nunan, N.; Lerch, T.Z.; Pouteau, V.; Mora, P.; Changey, F.; Kätterer, T.; Giusti-Miller, S.; Herrmann, A.M. Metabolising Old Soil Carbon: Simply a Matter of Simple Organic Matter? Soil Biol. Biochem. 2015, 88, 128–136. [Google Scholar] [CrossRef]
  74. Grandy, A.S.; Neff, J.C. Molecular C Dynamics Downstream: The Biochemical Decomposition Sequence and Its Impact on Soil Organic Matter Structure and Function. Sci. Total Environ. 2008, 404, 297–307. [Google Scholar] [CrossRef]
  75. Chen, Y.-H.; Liu, X.-W.; Huang, J.-L.; Baloch, S.; Xu, X.; Pei, X.-F. Microbial Diversity and Chemical Analysis of Shuidouchi, Traditional Chinese Fermented Soybean. Food Res. Int. 2019, 116, 1289–1297. [Google Scholar] [CrossRef]
  76. Eller, M.H.; Warner, A.L.; Knap, H.T. Genomic Organization and Expression Analyses of Putrescine Pathway Genes in Soybean. Plant Physiol. Biochem. 2006, 44, 49–57. [Google Scholar] [CrossRef]
  77. Guanghua, W.; Junjie, L.; Xiaoning, Q.; Jian, J.; Yang, W.; Xiaobing, L. Effects of Fertilization on Bacterial Community Structure and Function in a Black Soil of Dehui Region Estimated by Biolog and PCR-DGGE Methods. Acta Ecol. Sin. 2008, 28, 220–226. [Google Scholar] [CrossRef]
  78. Gomez, E.; Ferreras, L.; Toresani, S. Soil Bacterial Functional Diversity as Influenced by Organic Amendment Application. Bioresour. Technol. 2006, 97, 1484–1489. [Google Scholar] [CrossRef]
  79. Bucher, A.E.; Lanyon, L.E. Evaluating Soil Management with Microbial Community-Level Physiological Profiles. Appl. Soil Ecol. 2005, 29, 59–71. [Google Scholar] [CrossRef]
  80. Berendsen, R.L.; Pieterse, C.M.J.; Bakker, P.A.H.M. The Rhizosphere Microbiome and Plant Health. Trends Plant Sci. 2012, 17, 478–486. [Google Scholar] [CrossRef]
  81. Kanasugi, M.; Sarkodee-Addo, E.; Ansong Omari, R.; Mohammad Golam Dastogeer, K.; Fujii, Y.; Oppong Abebrese, S.; Bam, R.; Asuming-Brempong, S.; Okazaki, S. Exploring Rice Root Microbiome; The Variation, Specialization and Interaction of Bacteria and Fungi In Six Tropic Savanna Regions in Ghana. Sustainability 2020, 12, 5835. [Google Scholar] [CrossRef]
  82. Tawaraya, K.; Horie, R.; Shinano, T.; Wagatsuma, T.; Saito, K.; Oikawa, A. Metabolite Profiling of Soybean Root Exudates under Phosphorus Deficiency. Soil Sci. Plant Nutr. 2014, 60, 679–694. [Google Scholar] [CrossRef]
  83. Timotiwu, P.B.; Sakurai, N. Identification of Mono-, Oligo-, and Polysaccharides Secreted from Soybean Roots. J. Plant Res. 2002, 115, 0077–0085. [Google Scholar] [CrossRef] [PubMed]
Figure 1. Changes in average well color development (AWCD) of the soil microbial communities in cover crop (A) and fertilizer source (B) treatments with incubation time.
Applbiosci 02 00022 g001
Figure 2. Utilization of carbon substrate categories by soil microbial communities from the cover crop (A) and fertilizer source (B) treatments. Bars with letters denotes significance at the level 0.05 level using Fisher’s protected LSD. (CR = Cereal rye; CC-mix = Cereal rye and mustard; NV = Native vegetation; VT = Vetch; WT = Wheat, CF = Chemical fertilizer; PL = Poultry litter; and NO = No fertilizer).
Applbiosci 02 00022 g002
Figure 3. (A) Bray Curtis ordination and (B) Principal component analysis (PCA) of carbon substrate utilization of soil microbial communities from cover crops and fertilizer source treatments. (Category—CR + CL = Cereal rye + Chemical fertilizer; CR + NO = Cereal rye + No fertilizer; CR+PL = Cereal rye + Poultry litter; MX + CL = CC-mix + Chemical fertilizer; MX + NO = CC-mix + No fertilizer; MX + PL = CC-mix + Poultry litter; NV + CL = Native vegetation + Chemical fertilizer; NV + NO = Native vegetation + No fertilizer; NV + PL = Native vegetation + Poultry litter; VT + CL = Vetch + Chemical fertilizer; VT + NO = Vetch + No fertilizer; VT + PL = Vetch + Poultry litter; WT + CL = Wheat + Chemical fertilizer; WT + NO = Wheat + No fertilizer; WT + PL = Wheat + Poultry litter.).
Applbiosci 02 00022 g003
Figure 4. Canonical Correspondence Analysis (CCA) ordination plot revealing the relationship between cover crop treatments and soil physicochemical properties.
Applbiosci 02 00022 g004
Table 1. Main effects of cover crop and fertilizer source on soil microbial community diversity indices.
AWCD1H’EUR1/D
Cover Crop
Cereal rye0.76 (0.04) d3.14 (0.02) d0.91 (0.006) d5.15 (0.27) d16.55 (1.00) d67.79 (3.60)
CC-mix 21.32 (0.04) a3.31 (0.009) a0.96 (0.002) a8.03 (0.26) a25.6 (0.37) a71.88 (3.70)
Native vegetation1.34 (0.07) a3.29 (0.016) a0.96 (0.004) a8.25 (0.40) a25.33 (0.78) a66.30 (2.72)
Vetch1.05 (0.03) b3.24 (0.004) b0.94 (0.001) b6.77 (0.19) b21.44 (0.92) b84.41 (7.46)
Wheat0.95 (0.07) c3.20 (0.01) c0.93 (0.003) c6.23 (0.44) c19.88 (1.67) c84.00 (8.83)
CC*FT 3s*s*s*s*s*ns
Fertilizer Source
CL1.11 (0.054) a3.21 (0.019) b0.93 (0.005) b7.13 (0.26) a22.46 (0.58) a72.02 (2.12)
None0.99 (0.07) b3.22 (0.024) b0.94 (0.007) b6.32 (0.39) b20.46 (1.54) b77.67 (6.10)
PL1.15 (0.08) a3.27 (0.011) a0.95 (0.003) a7.21 (0.47) a22.4 (1.21) a74.97 (5.53)
1 Variable in column with no letters is not significant at the 0.05 level using Fisher’s protected LSD; Standard error in parenthesis. 2 CC-mix =Cereal rye and mustard; 3 CC*FT = Interaction between cover crop and fertilizer source (ns = non-significant, s* = significant. AWCD = Average color development; H’ = Shannon Diversity Index; E = Shannon evenness index; U = Mcinthosh Index; R = Substrate richness; 1/D = Inverse Simpson Diversity, CL = Chemical fertilizer, PL = Poultry litter.
Table 2. Combined effects of cover crop and fertilizer source on soil microbial community diversity indices.
Treatment 2AWCD1H’EUR
MX +PL1.57 (0.036) a3.33 (0.018) a0.97 (0.0032) a9.47 (0.28) a27 (0.83) a
MX + CL1.47 (0.038) ab3.32 (0.012) a0.967 (0.0032) a8.87 (0.29) ab26.33 (1.03) ab
NV + NO1.34 (0.047) bc3.32 (0.0134) a0.968 (0.0023) a8.09 (0.28) bc26 (0.93) ab
NV + PL1.32 (0.074) bc3.31 (0.0324) ab0.964 (0.0093) ab8.05 (0.23) bc26.33 (1.22) ab
WT + PL1.23 (0.048) cd3.26 (0.0284) bcd0.95 (0.0042) bcd7.76 (0.31) c25 (0.73) abc
MX + NO1.17 (0.083) cd3.30 (0.0173) abc0.963 (0.0024) abc7.17 (0.32) cd24.67 (0.69) abc
NV + CL1.12 (0.037) de3.23 (0.0182) d0.943 (0.0043) d7.18 (0.35) cd22.67 (0.73) cde
VT + NO1.12 (0.028) de3.24 (0.0284) cd0.943 (0.0032) cd7.15 (0.29) cd23.67 (0.83) bcd
VT + CL1.10 (0.047) de3.24 (0.0482) cd0.944 (0.0024) cd7.12 (0.23) cd22.67 (0.93) cde
WT + CL0.94 (0.058) ef3.17 (0.0284) ef0.923 (0.0032) ef6.26 (0.32) de21 (1.02) de
VT + PL0.93 (0.057) ef3.24 (0.0138) cd0.944 (0.0023) cd6.04 (0.29) e18 (1.10) fg
CR + CL0.91 (0.075) fg3.11 (0.0324) fg0.905 (0.0024) fg6.22 (0.28) de20 (1.12) ef
CR + PL0.73 (0.036) gh3.23 (0.0231) de0.940 (0.043) de4.76 (0.23) f16.33 (1.11) gh
WT + NO0.70 (0.037) h3.19 (0.2842) de0.931 (0.0024) de4.69 (0.24) f13.67 (1.03) hi
CR + NO0.63 (0.048) h3.07 (0.0124) g0.894 (0.0036) g4.47 (0.25) f13.33 (1.20) i
1 Variable in column with no letters are not significant at the 0.05 level using Fisher’s protected LSD; Standard Error in parenthesis. 2 Treatment = CR + CL = Cereal rye + Chemical fertilizer; CR + NO = Cereal rye + No fertilizer; CR + PL = Cereal rye + Poultry litter; MX + CL = CC-mix + Chemical fertilizer; MX + NO = CC-mix + No fertilizer; MX + PL = CC-mix + Poultry litter; NV + CL = Native vegetation + Chemical fertilizer; NV + NO = Native vegetation + No fertilizer; NV + PL = Native vegetation + Poultry litter; VT + CL = Vetch + Chemical fertilizer; VT + NO = Vetch + No fertilizer; VT + PL = Vetch + Poultry litter; WT + CL = Wheat + Chemical fertilizer; WT+NO = Wheat + No fertilizer; WT + PL = Wheat + Poultry litter.
Table 3. Carbon substrates present in Biolog EcoPlates related to PC1 and PC2.
Carbon SubstratePC1PC2
Polymers
Tween 400.96179268−0.03904354
Tween 800.342114980.03092762
Alpha-Cyclodextrin−0.83462371−0.41750008
Glycogen−0.63170406−0.23706666
Carbohydrates
Glucose-1-Phosphate−0.254536980.58790260
D-L-Alpha-Glycerol Phosphate0.19979821−0.74993661
D-Cellubiose−0.458062750.15852001
Alpha-D-Lactose−0.508816680.77378681
Beta-Methyl-D-Glucoside−0.704999350.02685358
D-Xylose−0.742693620.35992147
I-Erythritol−0.569686920.59688337
D-Mannitol0.85824297−0.38592539
N-Acetyl-D-Glucosamine0.58653954−0.02068943
Carboxylic acids
Pyruvic Acid Methyl Ester0.42378445−0.26569367
D-Glucosaminic acid0.52295150−0.39975288
D-Galactonic Acid-Gamma-Lactone0.63099447−0.06814916
D-Galacturonic acid0.92169910−0.40273613
Gamma-Amino-Butyric Acid0.75517974−0.05258175
Itaconic Acid−0.23717004−0.45819712
Beta-Keto Butyric Acid−0.65735782−0.34116388
D-Malic Acid0.93858412−0.04106865
Amino acids
L-Arginine0.601695200.39097528
L-Asparagine1.001499650.01168636
L-Phenylalanine−0.58543371−0.02388333
L-Serine0.088445830.36381245
L-Threonine−0.62958879−0.42939563
Glycyl-L-Glutamic Acid−0.78420635−0.36112807
Amines
Phenythyl-Amine−0.523597290.15857889
Putrescine0.843570730.29691745
Phenolic acids
2-Hydroxy Benzonic Acid−0.18237857−0.16476193
4-Hydroxy Benzonic Acid0.234060650.47218892
Table 4. Main effects of cover crops and fertilizer source treatments on soil physicochemical characteristics.
TC 1 (%)TN (%)WSA (%)EEGSP (mg/kg)POXC (mg/kg)pH
Cover crop
Cereal rye1.66 (0.104) 0.160 (0.006) ab52.11 (2.67)82.55 (2.86)550.77 (21.39)5.64 (0.12) ab
CC-mix 21.70 (0.07) 0.173 (0.009) ab49.11 (2.38)89.88 (3.42)569.33 (28.61) 5.56 (0.08) ab
Native vegetation1.58 (0.08) 0.156 (0.006) ab56.77 (2.89)85.77 (2.43)521.11 (18.94)5.75 (0.09) a
Vetch1.72 (0.10)0.178 (0.01) a55 (3.08)83.11 (3.34)561 (40.02)5.48 (0.07) b
Wheat1.52 (0.07) 0.153 (0.005) b46.44 (2.63)79.88 (0.44)503.22 (1.67)5.76 (0.06) a
CC*FT 3nsnsnsnsnsns
Fertilizer source
Mineral1.58 (0.06)0.15 (0.005)49.73 (2.12)81.2 (2.57)537.13 (22.53)5.48 (0.063) b
None1.60 (0.06)0.16 (0.006)52.2 (2.84)82.4 (2.52)530 (21.60)5.766 (0.08) a
Poultry litter1.72 (0.07)0.17 (0.007)53.73 (1.66)89.13 (2.20)555.46 (21.34)5.68 (0.04) a
1 Variable in column with no letters are not significant at the 0.05 level using Fisher’s protected LSD; Standard Error in parenthesis. 2 CC-mix =Cereal rye and mustard; 3 CC*FT = Interaction between cover crop and fertilizer source (ns = non-significant). TC = Total carbon; TN = Total nitrogen; WSA = Water-stable aggregate; EEGSP = Easily extractable soil glomalin; POXC = Permanganate oxidizable carbon.
Disclaimer/Publisher’s Note: The statements, opinions and data contained in all publications are solely those of the individual author(s) and contributor(s) and not of MDPI and/or the editor(s). MDPI and/or the editor(s) disclaim responsibility for any injury to people or property resulting from any ideas, methods, instructions or products referred to in the content.

