Abstract
Background: Expansion of OKF6/TERT-2 oral epithelial cells in vitro is important for studying the molecular biology of disease and pathology affecting the oral cavity. Keratinocyte serum-free medium (KSFM) is the medium of choice for this cell line. This study compares three media for OKF6/TERT-2 cultures: KSFM, Dulbecco’s Modified Eagle Medium/Nutrient Mixture of Hams F-12 (DMEM/F12), and a composite medium comprised of DMEM/F-12 and KSFM (1:1 v/v), referred to as DFK. The toxicological effects of electronic cigarette liquids (e-liquids) on OKF6/TERT-2 cells cultured in these media were also compared. Methods: Cells were cultured in KSFM, DMEM/F12, or DFK, and cellular morphology, growth, wound healing and the gene expression of mucins and tight junctions were evaluated. Additionally, cytotoxicity was determined after e-liquid exposures. Results: Switching from KSFM to DMEM/F12 or DFK 24 h post-seeding leads to typical cellular morphologies, and these cultures reach confluency faster than those in KSFM. Wound-healing recovery occurred fastest in DFK. Except for claudin-1, there is no difference in expression of the other genes tested. Additionally, e-liquid cytotoxicity appears to be amplified in DFK cultures. Conclusions: DMEM/F12 and DFK are alternative media for OKF6/TERT-2 cell culture to study the molecular biology of disease and pathology, provided cells are initially seeded in KSFM.
Keywords:
oral; mucosa; mucins; tight junctions; wound-healing; e-liquids; cytotoxicity; viability; confluency 1. Introduction
The epithelial lining of the oral mucosa is a critical barrier protecting the subepithelial and connective tissues from the external environment, and is the first mucosal surface that ingested substances encounter. The early exposure of cells in the upper respiratory tract and oral cavity makes them a valuable tool for studying physiology and pathophysiology. OKF6/TERT-2 cells are oral mucosal epithelial keratinocytes originally isolated by Dickson et al. from a human male that have been immortalized [1]. The OKF6/TERT-2 cell line has shown significant research utility, investigating topics such as oropharyngeal malignancy [2,3,4], infectious disease [5,6,7], and various nicotine-related products [8,9,10].
The keratinocyte serum-free medium (KSFM) is widely used to culture a broad range of epithelial cell lines [11,12,13,14,15,16,17,18], and is the primary medium for culturing OKF6/TERT-2 cells [5,7,19,20,21]. Dulbecco’s modified eagle medium/nutrient mixture of hams F-12 (DMEM/F-12) is another standard base medium [22]. DMEM/F-12, supplemented with 10% fetal bovine serum (FBS), is used for the culture of a wider spectrum of cells, including fibroblasts, neurons, muscle cells, and HeLa cells [22]. DMEM/F-12 with 10% FBS has less frequently been used to culture OKF6/TERT-2 cells [23,24]. To our knowledge regarding the OKF6/TERT-2 cell line, no studies use DMEM/F12 without FBS. Most other studies have used the Dickson et al. KSFM methodology [1] which does not include FBS.
The composition of KSFM Is proprietary, but after conversations with ThermoFisher technical support (Waltham, MA, USA), it is evident that KSFM differs substantially from DMEM/F12. It is possible that access to a combination of both sets of nutrients may increase the rate of cellular growth of OKF6/TERT-2 cells. The justification for a comparison of the growth of the OKF6/TERT-2 cell line in KSFM, DMEM/F12, and a 1:1 v/v mixture of DMEM/F-12 and KSFM (from this point on referred to as DFK) is two-fold: First, to establish that these three media support the growth of OKF6/TERT-2 cells. Second, to determine potential benefits, such as reduced KSFM-associated costs and the time to reach confluency (a potential procedural limitation), which would ultimately impact the use and versatility of this cell line. We note that other orally derived cell lines, such as human gingival fibroblasts [25,26], dental pulp stem cells [27], and normal human epidermal keratinocytes [28], are more commonly cultured in DMEM/F12. As such, the DFK combination medium for the growth of OKF6/TERT-2 oral epithelial cells may provide other researchers with increased flexibility for cell culturing.
In addition to comparing growth characteristics, including the time-to-confluency and morphology of OKF6/TERT-2 cells in KSFM, DMEM/F12, and DFK, the functional characteristics of these cells should also be measured. Similar to epithelial cells from other anatomic sites, the barrier function of the oral epithelium is critical in maintaining a well-defined “inside” vs. “outside” environment [29]. This is accomplished through protein complexes known as tight junctions, which include claudin-1, occludin, and zonula occluden protein 1 (ZO-1). These tight junctions function in the regulation of paracellular transport across the oral epithelium [30], as well as assisting in wound closure following mechanical injury, consequently preventing microbial invasion of the underlying connective tissue.
Roughly 800 µL of saliva remain on oral surfaces after swallowing [31], providing lubrication and moisture. Five to ten percent of the dry weight of saliva [32,33] or mucous [34,35] is composed of mucin glycoproteins. At least 20 mucins have been identified in saliva and play a role in oral microbial clearance; mucin dysregulation may alter susceptibility to pathogens [36] and promote dental decay [37]. Mucin glycoproteins are expressed by a wide range of epithelial cells and serve as a lubricant and protective agent in the saliva [38,39]. Mucin genes such as muc1 and muc4 are expressed broadly in epithelial cells, including the upper respiratory tract and oral cavity [40]. Alterations in mucin gene expression have been implicated in epithelial dysfunction, including malignant transformation [41,42] and breakdown of the nasal epithelial barrier [43]. For the OKF6/TERT-2 cell model to be representative of in vivo physiology, the production of mucins should remain consistent. Therefore, the expression of mucins and tight junctions will be used to further assess the functionality of the OKF6/TERT-2 cell line grown in these media.
The OKF6/TERT-2 cell line has conventionally been cultured using a standard KSFM medium. However, the flexibility of this cell line to be cultured in other media, such as DMEM/F12 or DFK, remains to be determined. The ability to diversify the growth and culture requirements of this cell line amplifies its research potential. Therefore, the aim of this study is to compare KSFM to DMEM/F12 and DFK as media that can support OKF6/TERT-2 cell cultures, analyzing growth, morphology, tight junctions, and mucin glycoproteins gene expression, as well as tissue repair. We hypothesize that alternative media can adequately support the growth of OKF6/TERT-2 cells. Electronic cigarette liquids (e-liquids) ± flavors have previously demonstrated a significant impact on the oral microenvironment [44,45,46,47,48,49,50]. From a practical point of view, toxicological experiments were also performed using e-liquids ± flavors to determine which of these media renders the cell cultures more suitable for such studies.
2. Materials and Methods
2.1. Culture Media
All culture media reagents and supplies were purchased from ThermoFisher Scientific (Waltham, MA, USA) unless otherwise indicated. The KSFM (catalog # 17005042, lot # 2401396) purchase includes the base medium, bovine pituitary extract (BPE), and epithelial growth factor (EGF). BPE and EFG supplements are always provided in excess, at least two times more than needed to prepare KSFM. Complete KSFM was prepared by adding 30 µg/mL BPE, 1 ng/mL EGF, 1 mM glutamine, 0.3 mM calcium chloride (0.4 final [calcium]), and 100 U/mL penicillin/streptomycin, as previously described [5]. Complete DMEM/F12 (catalog # 11320033, lot # 2522615) was prepared by adding the remainder EGF and BPE from the KSFM purchase along with 1 mM glutamine, 0.3 mM calcium chloride (1.3 mM final [calcium]), and penicillin/streptomycin as complete KSFM. DFK was prepared by mixing complete KSFM and complete DMEM/F12 at a 1:1 (v/v). No filtration is necessary, as all above reagents are purchased sterile. All media were stored at 4 °C.
2.2. Cell Culture, Morphology and Growth
OKF6/TERT-2 cells were kindly provided by Dr. Gill Diamond at the Louisville University School of Dentistry, but were originally established in the study by Dickson et al. [1]. Cells were routinely cultured and maintained with KSFM in T75 flasks between passages 10 and 20. For all experiments, cells were cultured at 37 °C and 5% CO2, feeding the cells with fresh media at 24 h and then every 1 or 2 days until confluent. For seeding experiments to evaluate initial cell morphology and growth (Figure 1), cells were seeded at 50,000 cells/well with KSFM or DMEM/F12 or DFK in 24-well plates. In latter experiments, to evaluate cell morphology and growth, cells were seeded in KSFM and cultured for 24 h as above. Spent media were removed and replaced with equal volumes of either fresh KSFM or DMEM/F12 or DFK (Figure 2). Cells were imaged at 100× magnification using a Nikon Eclipse TE2000-U inverted microscope equipped with a Nikon Digital Sight DS-Fi1 camera and NIS Elements Imagine Software (Nikon Instruments Inc., Melvin, NY, USA). For each type of media, three to six wells were trypsinized for 30 min at 37 °C and 5% CO2, and trypsin was quenched with 1% bovine serum in PBS for one minute. Cells were counted using the trypan blue exclusion assay with the hemocytometer and light microscopy every 24 h. Spent media were collected every 24 h of cell growth, pooled according to media type, and stored at 4 °C until pH was measured. For confocal microscopy experiments, cells were seeded in chamber slides using KSFM for the first 24 h at 37 °C and 5% CO2. Then, media was changed to fresh KSFM or switched to DFK and grown for four days as above.
2.3. Wound/Healing Assay
OKF6/TERT-2 cells were seeded and grown to confluency in 24-well plates using KSFM. Once confluent, media were removed, and using a sterile 1 mL pipet tip, a scratch (a straight line across the diameter of the well) was made in all cultures. Monolayers were washed twice with PBS to remove excess cellular debris, and 1 mL of either KSFM or DMEM/F12 or DFK media were added to all cultures. Scratched monolayers were immediately imaged at 100× magnification (0 h) using a Nikon Eclipse TE2000-U inverted microscope as indicated above, and cultures were incubated at 37 °C and 5% CO2. To assess wound recovery, cultures were imaged at 4, 8, 12, 16, 24, and 28 h after scratching.
To quantify and compare the rate of wound-healing recovery across all media, the computer image processing program ImageJ with the open source Wound Healing Size Tool (WHST) plugin optimized for in vitro wound-heal assay analysis was utilized [51,52]. The WHST supports accurate discrimination between the cell monolayer and open wound area by fixing a line dividing the two regions, driven both by its independent algorithmic analysis as well as user-defined input of variance filter radius values and manual modification of saturation percentage in contrast enhancement. The open wound area was defined by pixel area (pixels2), and was quantified using WHST analysis of the imaged monolayers over time.
2.4. Confocal Microscopy
Confluent monolayers in chamber slides were washed in PBS and fixed in 4% paraformaldehyde for 20 min, followed by PBS washes and aldehyde quenching using 0.1% glycine. Permeabilization was performed with 0.1% Triton X-100 in PBS for 15 min, followed by washes and blocking with 1% bovine serum albumin in PBS. Phalloidin-FITC conjugate at 5 µg/mL in PBS was added for 30 min to stain F-actin (green). Samples were then washed 3 times with PBS, and mounting media containing DAPI were added to stain the cell nucleus (blue). Cell samples were observed under a Carl Zeiss LSM880 laser scanning confocal microscope (Carl Zeiss Inc., White Plains, NY, USA) at 630× magnification with oil immersion using an excitation wavelength of 405 nm and 488 nm for DAPI and FITC, respectively. Z-stacks (height) were acquired at slow speed and high resolution with an optical slicing of 1 µm. The ZEN 3.5 software (Carl Zeiss Inc., White Plains, NY, USA) was used to obtain 3D images. The confocal microscope and software were accessed in the Biological Sciences Department at the College of Arts and Sciences, Lehigh University (Bethlehem, PA, USA). The average number of cells per field view was achieved by counting the number of nuclei (blue) in both KSFM and DFK (n = 8). To calculate the average area of cells, the total area of the field of view (135 µm × 135 µm) was divided by the average number of cells. The average height of the cultures in both media was calculated by averaging the number of slices (each slice = 1 µm) in all Z-stacks (n = 17 for KSFM and n = 18 for DFK). The cell volume was calculated by multiplying the cell area by the average height.
2.5. Expression of Mucins and Tight Junction Genes
OKF6/TERT-2 cells were seeded and grown to confluency in 6-well plates using either KSFM or DFK. Once confluent, media were collected and stored. Monolayers were washed twice with PBS to remove excess cellular debris, and RNA was collected with the mirVana miRNA isolation kit, 100% ethanol, and phenol:chloroform, following the manufacturer’s instructions. The RNA concentration was determined with the nanodrop, and the VILO reverse transcription kit was used to obtain cDNA. β-actin, claudin-1, occludin, zonula occluden (ZO-1), muc1, and muc4 were amplified with TaqMan primers. Cycle threshold (Ct) values were obtained using the QuantStudio 3 qPCR cycler (Applied Biosystems, Waltham, MA, USA). The initial denaturation was at 95 °C for 20 s followed by a total of 40 cycles, where each cycle was 1 s at 95 °C (denaturing) and 20 s at 60 °C (annealing and extension). Once Ct values were obtained, 2−ΔΔCt values were calculated using β-actin as the control. Data are presented as percentages of β-actin expression levels.
2.6. SDS-PAGE for Released Glycoproteins
Human saliva was collected from five healthy individuals under IRB approval code Cuadra_S19_18. Saliva samples were pooled and sterilized following a previously established protocol [44]. Approximately 12 mL of OKF6/TERT-2 cell culture supernatants in KSFM and DFK from two separate experiments were filtered through Amicon Ultra 30K centrifugal filters. The concentrates were resuspended in sterile water to dilute the salts and re-filtered. In addition, fresh KSFM and DFK media, as well as sterile human saliva, were also filter-concentrated. After Amicon filtration, all samples contained macromolecules above 30 kiloDaltons (kD), and protein concentrations were determined with the Micro BCA Protein Assay Kit, following the manufacturer’s instructions. Samples were adjusted to equal protein concentrations, and 30 µg of proteins were separated by SDS-PAGE. Then, all heavily glycosylated glycoproteins were stained using the PAS protocol [53,54]. After obtaining the image of all glycoproteins present in the gel, Coomassie blue was used to stain the rest of the proteins in the samples, and the gel was imaged again.
2.7. Effects of E-Liquid Treatments: Protein Concentration, Viability and Cytotoxicity
e-liquids were prepared as previously described [44,45]. Briefly, the flavorless e-liquid mixture was prepared by mixing equal volumes of propylene glycol and vegetable glycerine, and supplemented with 20 mg/mL nicotine. In addition, flavors including tobacco, menthol, cinnamon, strawberry, and blueberry were added to a final volume of 5% (v/v) to the flavorless e-liquid. These five flavors were obtained from Liquid Nicotine Wholesalers (Phoenix, AZ, USA). Tobacco and menthol flavors were chosen because they simulate conventional cigarette flavors. Cinnamon, strawberry, and blueberry were chosen because they are fruity flavors popular among young adult electronic cigarette users. All individual components of e-liquids were stored at room temperature, but once prepared, e-liquids ± flavors were stored at 4 °C.
To test the effects of e-liquids on OKF6/TERT-2 cells, confluent cultures in DFK or KSFM were exposed to 1% e-liquids (v/v) dissolved in either medium. Confluent monolayers were exposed to these e-liquid treatments at 37 °C and 5% CO2 for 24 h. Supernatants were removed and stored at −20 °C for LDH cytotoxicity assays. Cells were trypsinized, diluted to a final volume of 1 mL, and from the resulting cell suspension, only 10 µL were used for cell viability via trypan blue exclusion. The remaining cells were pelleted and stored at −20 °C. Cell pellets were lysed in a final volume of 1 mL 0.2% Triton-X 100 solution, syringe-filtered (0.22 µm), and assayed for total protein concentration, as indicated above (Section 2.6). The LDH cytotoxicity assay kit was used to perform cytotoxicity assays according to manufacturer’s instructions. Briefly, untreated cell monolayers were lysed with a lysis buffer (provided in the kit) and used as reference for 100% LDH activity. Supernatants were thawed, and 50 µL were added to 50 µL of the reaction mixture and allowed to incubate for 30 min in the dark at room temperature. Finally, 50 µL of stopping solution was added to all reactions, and absorbance was read at 595 nm.
2.8. Statistical Analysis
Means and standard errors of the mean (SEM) were calculated and analyzed for all quantitative experiments. Two-way ANOVA followed by a Bonferroni post-hoc analysis was used to compare the effects of KSFM vs. DMEM/F12 vs. DFK on the growth and wound healing ability of OKF6/TERT-2 cells over time. Additionally, linear regression analyses and correlation coefficients for wound-healing assays were performed over time and extrapolated to the x-intercept. Student’s t-test was used to compare the effects of DFK vs. KSFM on the height of OKF6/TERT-2 cells (based Z-stacks where each optical slice is 1 µm) and the expression of mucin and tight junction genes. For comparison of protein content and viability of OKF6/TERT-2 cells grown in DFK or KSFM in the presence of e-liquid ± flavors, a one-way ANOVA followed by a Bonferroni post-hoc analysis was used to determine statistical significance between treatment groups within the same media, and a student’s t-test was used to determine the statistical significance between media for each treatment group. All statistical tests were performed using GraphPad Prism® version 5.02 (GraphPad Software, San Diego, CA, USA). For all tests, p < 0.05 was considered statistically significant.
3. Results
3.1. Seeding OKF6/TERT-2 Cells in KSFM or DMEM/F12 or DFK
After attempting to seed OKF6/TERT-2 cells in KSFM or DMEM/F12 or DFK, cells adhered well to the surface when seeded with the KSFM media, as seen by day one in Figure 1. Cells in KSFM present the correct morphology with pseudopodia extensions, forming small microcolonies in the well. By day one, few cells remain adhered to the surface when seeded with DMEM/F12 or DFK, and these cells appear rounded, with a different phenotype when compared to cells in KSFM. By days two and three, however, cells cultured in DMEM/F12 or DFK begin to present the correct morphology, with scarce microcolonies. On the other hand, by days two and three, cells in KSFM begin to grow confluent, with a much higher cell number per field of view (Figure 1). Our results indicate that when seeding OKF6/TERT-2 cells, KSFM should be the medium used, as it yields the correct phenotype and enhanced growth within one day, compared to DMEM/F12 or DFK.

Figure 1.
Light microscopy displaying cellular morphology and confluency of OKF6/TERT-2 cells seeded in KSFM, DMEM/F12, or DFK media over the course of 3 days. Micrographs are representative images from three independent experiments. Total magnification = 100× and the white bars = 100 µm.
3.2. OKF6/TERT-2 Cells Seeded in KSFM and Switched to DMEM/F12 or DFK
OKF6/TERT-2 cells were seeded in KSFM, and 24 h later, they were either kept on this medium or switched to DMEM/F12 or DFK for the remainder of the experiment. Throughout the entire experiment, the cell morphology appears to be similar regardless of the media used (Figure 2A). However, the cellular confluency progresses slightly faster in the DMEM/F12 and DFK cultures. Cell counts demonstrate a significant difference in cell numbers between the DMEM/F12 or DFK compared to the KSFM cultures on day three (Figure 2B, upper Y axis, p < 0.001), supporting the visual observation in Figure 2A. On day four, all cell cultures appear nearly 100% confluent, but the cell counts in both DMEM/F12 and DFK cultures are about three times higher than those in KSFM cultures. These results indicate that, although cultures in KSFM do reach confluency, a protocol of seeding with KSFM (day 0) and switching to DMEM/F12 or DFK by day one is more efficient in terms of growth rate. Light microscopy suggests the possibility that cells cultured in DMEM/F12 and DFK, as compared to KSFM, have a smaller cellular size (Figure 2A) which could account for the larger cell number (Figure 2B, upper Y axis). Alternatively, it is possible that cells cultured in DMEM/F12 or DFK have adopted a cuboidal (taller) morphology while maintaining a similar cellular size. For this reason, 3D confocal imaging is presented below. In addition, pH levels were measured throughout the course of the growth experiment (Figure 2B, lower Y axis). Results indicate that there is a drop in pH, starting at 8.0, 7.91, and 7.79, and ending with 7.64, 7.39, and 7.34 for DMEM/F12, DFK, and KSFM, respectively. This decrease in pH for all spent media is consistent with cellular growth and metabolic activity. For the remainder of the study, OKF6/TERT-2 cells seeded and maintained in KSFM were compared to cells seeded in KSFM and switched to DMEM/F12 or DFK.

Figure 2.
Light microscopy displaying the cellular morphology and confluency of OKF6/TERT-2 cells seeded in KSFM and either kept in this medium (blue box) or switched to DMEM/F12 or DFK 24 h later until the end of the experiment. Micrographs are representative images from three separate experiments (A). Quantification of viable OKF6/TERT-2 cells in both media was measured via trypan blue exclusion and presented by solid lines where each point represents the mean ± SEM (n = 3 to 6). *** = p < 0.001. The media pH levels are presented by dashed lines and represent pooled spent media (B).
3.3. Wound Healing Assay in KSFM, DMEM/F12 and DFK
An important function of oral epithelial cells is their ability to close wounds after injury, which also helps limit microbes, microbial products, or environmental materials from entering connective tissues or the bloodstream. A wound-healing assay comparing the effects of each media on OFK6/TERT-2 monolayer recoveries from mechanical injury provides insight into the cell culture performance based on the nutrients present in the media. OKF6/TERT-2 epithelial cells demonstrate a significantly greater wound recovery rate in DFK compared to cultures in DMEM/F12 and KSFM (Figure 3A). For all practical purposes, 16 h cultures in DFK exhibit complete closure (Figure 3A). Cultures in DMEM/F12 completely recover by 28 h, and those in KSFM do not fully recover within the timeframe of the experiment (Figure 3A). Quantification of the gap size indicates a significant difference at 12 and 16 h of wound healing, where the cells in DFK close the gap faster (p < 0.001) compared to the other two conditions.
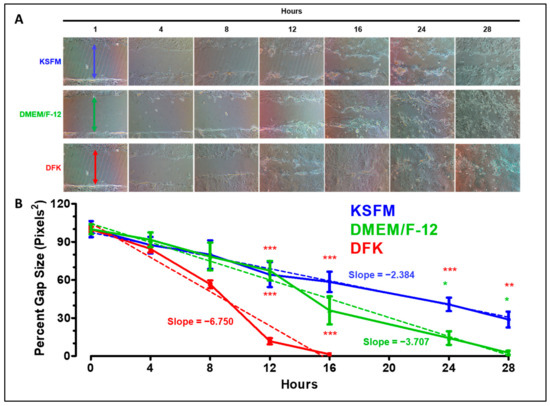
Figure 3.
Wound healing assay of OKF6/TERT-2 cells grown in KSFM, DMEM/F12, and DFK. Representative images show the wound-healing process over time from two independent experiments. The colored arrows at 0 h indicates the gap width of the initial wounds (A). ImageJ was used to measure the gap size over time. Each time-point represents the mean ± SEM (n = 4) of the gap size as a percentage of the initial size. * = p < 0.05; ** = p < 0.01; *** = p < 0.001. Dashed lines indicate linear regressions (B).
Linear regression analyses reveal that the correlation coefficients (R2 ≥ 0.8) for each culture illustrate a stable progression toward wound healing. Furthermore, the absolute value of the slopes indicate that faster recovery is correlated to greater steepness, where DFK > DMEM/F12 > KSFM (Figure 3B). Hence, OKF6/TERT-2 cells cultured in DFK recover faster from the injury compared to the other two media tested in the wound-healing assay. Thus, DFK provides a more suitable set of nutrients that better supports monolayer performance after mechanical injury.
The OKF6/TERT-2 cell model was originally established in KSFM (see introduction), and it is required for routine cell culture maintenance and passaging. In addition, KSFM is required for initial seeding of cell cultures for all experiments (Figure 1 and Figure 2). Based on the cellular growth (Figure 2) and wound healing (Figure 3) results, two points are discerned. First, OKF6/TERT-2 cells grow faster in DFK and DMEM/12 media compared to KSFM. Second, wound healing of OKF6/TERT-2 cells occur faster in DFK compared to the other two media. For these reasons, and given that OKF6/TERT-2 cells grown in KSFM and DFK yield the most polar results, the remainder of the study focuses on comparing the cellular and molecular aspects of OKF6/TERT-2 cell cultures in these two media. Nonetheless, if resources are limited, DMEM/F12 remains a viable and accessible option for culturing OKF6/TERT-2 cells after seeding them in KSFM.
3.4. Confocal Analysis of OKF6/TERT-2 Cell Morphology after Growth in KSFM and DFK
Mucosal epithelial cells are mainly of squamous morphology, demonstrating a high width-to-height ratio [55]. The results in Figure 2 could be explained by a change in DFK-cultured OKF6/TERT-2 cellular morphology, where the cells may elongate in height (i.e., cuboidal) or decrease their overall cellular size. If the cells adopt a more cuboidal phenotype, they will increase in height. Conversely, if the cells remain in a squamous morphology, they simply decrease in overall cellular size. To discern between these two possible outcomes, confluent monolayers were stained and observed under confocal microscopy, yielding a quantification of the z-axis (height). OKF6/TERT-2 cells grown for four days in KSFM and DFK are shown in Figure 4A, where the left side shows two-dimensional images, and the right side shows three-dimensional views of the cultures. No conspicuous difference in morphology is observed. However, as shown in Figure 4B, the number of cells per field of view is 1.73 times higher in DFK compared to KSFM (p < 0.001), which agrees with the results in Figure 2. Figure 4C shows that the mean area of OKF6/TERT-2 cells in KSFM is significantly larger than cells in DFK (p < 0.001). The height, as indexed by Z-stacks (Figure 4D), reveals that cells reach roughly 13 µm in height with no significant difference observed between media. Furthermore, Figure 4E shows that cells grown in KSFM have a significantly higher cellular volume (p < 0.001).
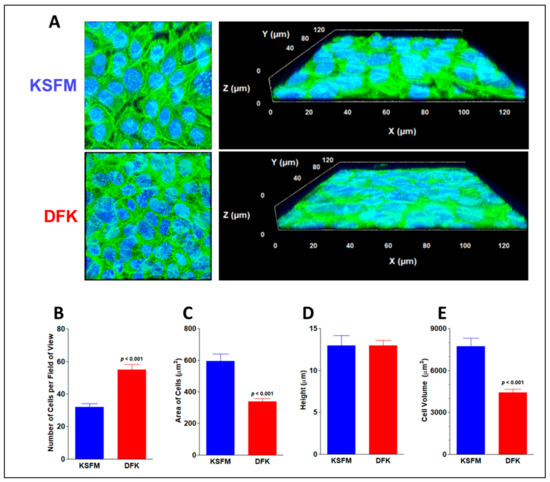
Figure 4.
Confocal imaging and cellular size of confluent OKF6/TERT-2 cells grown in KSFM and DFK. Representative confocal (2D) images of cell cultures grown in KSFM and DFK by day four from two independent experiments. Phalloidin green labels actin filaments and DAPI blue labels cellular nuclei. Each frame is 135 µm per side, total magnification = 630×. Z-stacks were tilted to render 3D images (A). Mean number of cells per field of view ± SE in both media (B). Average area of cells ± SE (n = 8) was calculated by dividing the total area of the field of view by the mean number of cells (C). Average height ± SE (n = 17 to 18) of cells after growth in each media was indexed by the Z-stacks (D). Average cell volume ± SE was calculated by multiplying area (n = 8) times the average height of cells (E).
Consequently, our results favor the idea of a decrease in cell size. Overall, the results indicate the morphology of the cells remains squamous and does not change based on the media but the cells in DFK are smaller in size than those in KSFM. A potential explanation is that cells grown in DFK undergo mitosis faster and do not have enough time to accumulate cellular content, hence they are smaller and more numerous per surface area.
3.5. Expression of Mucins and Tight Junction Genes after Growth in KSFM and DFK
Oral epithelial cells have several functions, including the production of mucins and tight junctions. Both of these cellular factors aim to prevent foreign materials, such as microbial products or environmental hazards, from interacting directly with oral tissues. In the case of mucins, muc1 and muc4 are among the most abundant in oral epithelial tissues. Tight junction genes occludin, claudin-1, and ZO-1 yield the most important proteins of these structures. These genes were tested via qPCR, and the results, presented in Figure 5, are compared to the levels of β-actin expression in terms of percentages. OKF6/TERT-2 cells grown in DFK express a slightly higher level of muc1 (3%) compared to their KSFM counterparts (1.8%), but this was not significant (p < 0.08). A much lower but detectable level of muc4 was found in these cells (0.01% in both cultures), once again, with no significant difference among them (Figure 5A). For the tight junction genes, ZO-1 was highly expressed in both cell cultures, with amounts of roughly 22 and 25% in KSFM and DFK, respectively (compared to β-actin). Interestingly, claudin-1 was upregulated in cells grown in DKF to 28%, which is significantly different than the 4% found in KSFM (p < 0.05). Cells grown in both DFK and KSFM expressed about 4% of occludin with no significant difference among the different cultures (Figure 5B). Taken together, OKF6/TERT-2 cells grown in DFK or KSFM express similar levels of muc1, muc4, occludin, and ZO-1. However, the growth of OKF6/TERT-2 cells in DFK yields a seven times higher expression of claudin-1 compared to that in KSFM, suggesting a more robust formation of tight junctions in the former medium.
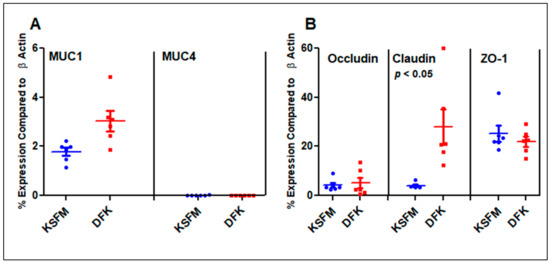
Figure 5.
mRNA expression levels of mucins (A) and tight junction (B) genes compared to β-actin as a percentage. Horizontal lines represent the mean ± SE of six data points from three independent experiments.
3.6. Release of Mucins after Growth in KSFM and DFK
After quantifying roughly 1 to 4% expression of muc1 compared to β-actin, the possibility that OKF6/TERT-2 cells could be releasing muc1 glycoproteins into the solution, as is the case with in vivo oral epithelial cells, was tested using sodium dodecyl sulfite polyacrylamide gel electrophoresis (SDS-PAGE). Because of the high levels of mucin glycosylation, MUC1 travels very little in SDS-PAGE and would appear as a high-molecular-weight (MW) band. To test whether mucins are released by OKF6/TERT-2 cells in vitro, supernatants from DFK and KSFM cultures were concentrated, separated by SDS-PAGE, and all glycoproteins were stained using the periodic-acid-Schiff (PAS) protocol, followed by Coomassie staining. Figure 6A shows high MW bands above 270 kDa in the supernatants of both DFK and KSFM cultures (lanes 2–5), which are not observed in the concentrates of fresh DFK or KSFM media (lanes 6 and 7), indicating that such high MW glycoproteins were produced and secreted by OKF6/TERT-2 cells during culture. These high MW materials are of similar size as those in human saliva (lanes 8–9), albeit much less abundant. In contrast, when the gel is further stained in Coomassie (Figure 6B), several bands in all samples (lanes 2–5), control media (lanes 6 and 7), and saliva (lanes 8 and 9) are revealed, indicating the presence of several proteins. Our results indicate that our cell model, whether cultured in KSFM or DFK, mimics the behavior of in vivo oral epithelial tissues in terms of glycoprotein production and secretion.
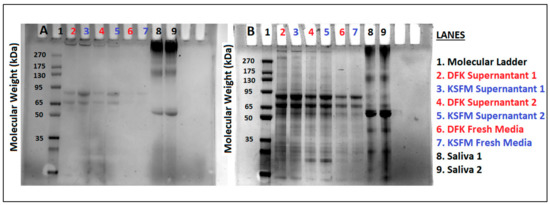
Figure 6.
Concentrated materials from OKF6/TERT-2 cell culture supernatants in both KSFM and DFK (lanes 2–5), uncultured KSFM or DFK media (lanes 6 and 7), or human saliva (lanes 8 and 9), were separated by SDS-PAGE. PAS staining, specific for glycoproteins, reveals high molecular weight materials in saliva lanes and supernatants (A). Coomassie stain shows all proteins found in the same gel (B). Lanes 2–5 represent two independent experiments comparing DFK vs. KSFM culture supernatants. Each lane was loaded with 30 µg of protein.
3.7. Effects of E-Liquids ± Flavors on OKF6/TERT Cells after KSFM and DFK Culturing
Protein content and cellular viability were assessed on cell cultures in both media after exposure to 1% e-liquids ± flavors (v/v) for 24 h. Figure 7A shows that the addition of 1% e-liquids ± flavors do not alter the total protein content in KSFM cultures with respect to those of untreated controls. Similarly, the addition of 1% e-liquids ± flavors do not alter the total protein content in DFK cultures with respect to those of untreated controls, except for the cinnamon-flavored e-liquid, which is significantly lower than the control (p < 0.001). In contrast, tobacco and menthol conditions between DFK and KSFM show a statistical difference in protein content (p < 0.05 and p < 0.001 for tobacco and menthol, respectively), where in both cases, protein levels in DFK are higher than in KSFM (Figure 7A). Figure 7B shows the total number of viable cells in DFK and KSFM cultures in the presence of 1% e-liquids ± flavors for 24 h. In untreated control cultures, there is a significant disparity of viable cell numbers between DFK and KSFM cultures (p < 0.001), confirming the results in Figure 2. Cinnamon flavor significantly reduces the number of viable cells in both DFK and KSFM cultures (p < 0.001). Lastly, menthol, strawberry, and blueberry flavors also significantly reduce the total number of viable cells in DFK cultures (p < 0.01), but not in KSFM cultures. In general, these results indicate that the detrimental effects of menthol, cinnamon, strawberry, and blueberry flavored e-liquids on OKF6/TERT-2 cells cultured in DFK are amplified in comparison to KSFM. Figure 7C shows the total levels of lactate dehydrogenase (LDH) activity in the culture-supernatants as a percentage of completely lysed cells. Unexpectedly, only a modest amount (roughly between 2 and 6%) of LDH activity is detected in all conditions and controls. Although modest, only treatments with menthol and cinnamon, in both KSFM and DFK, yield LDH activity that is roughly 6% and significantly different (p < 0.05) compared to their respective controls (Figure 7C). Interestingly, there is no significant difference in LDH activity between KSFM and DFK cultures within the same treatments.
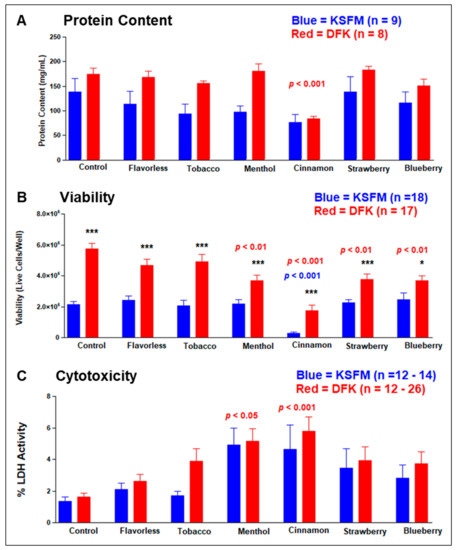
Figure 7.
Effects of e-liquids ± flavors on OKF6/TERT-2 cells growing in KSFM or DFK. Total protein content (A), cellular viability (B), and cytotoxicity (C) were measured, and each bar indicates their means ± SE. * = p < 0.05 and *** = p < 0.001 when comparing KSFM vs. DFK within each treatment in three separate experiments. The p values in blue and red signify statistical significance between control and treatment groups for either KSFM or DFK, respectively.
4. Discussion
The present study provides evidence that the OKF6/TERT-2 cell line grown in DFK, a novel medium composed of a 1:1 mixture of KSFM and DMEM/F-12, confers comparable morphology, mucin production, as well as ZO-1 and occludin gene expression. However, monolayer growth, wound healing performance, and claudin-1 expression occur at elevated levels when cells are cultured in DFK. In addition, e-liquids ± flavors seem to be more toxic to OKF6/TERT-2 cells cultured in DFK.
Seeding of OKF6/TERT-2 cells with KSFM, DMEM/F12 and DFK results in different cellular morphologies and growth rates (Figure 1), indicating that KSFM is required to initiate cell cultures as established by Dickson et al. [1]. However, once the cultures are established, the growth rate can be accelerated by switching to DMEM/F12 or DFK (Figure 2). Both alternatives yield similar growth rates and should be considered in such studies, as these can both improve culturing time and spare resources. While OKF6/TERT-2 cells cultured in DMEM/F12 or DFK yield comparable growth rates, cells cultured in DFK demonstrate quicker monolayer healing rates compared to the other two media. On the other hand, KSFM is required to maintain and passage OKF6/TERT-2 cells routinely grown in the laboratory, as previously established. Consequently, it appears that the combined nutrients from both KSFM and DMEM/F12 (DFK) augment OKF6/TERT-2 cell growth and wound-healing capacity.
The benefits of the DFK aggregate medium may be a consequence of the compositional differences between the two media. For example, DMEM/F12, KSFM, and DFK contain a final concentration of 1.3 mM, 0.4 mM, and 0.85 mM, respectively, based on the methods of this study. The increased cell density in DFK is the result of faster proliferation and consequently smaller cell size (Figure 3). Unlike telomerase immortalized gingival keratinocytes, which rarely reach confluence in KSFM containing 0.4 mM calcium [56], the present study suggests that OKF6/TERT-2 cells grow more rapidly in the DFK composite medium containing 0.85 mM calcium (Figure 2). Higher cytosolic calcium levels correlate with increased cellular differentiation, progressing from the proliferative basal layer to the superficial non-proliferative stratum corneum in vivo [57,58,59,60]. However, the biochemistry behind this process has been complicated by more recent reports of basal layer cells actually containing a relatively lower calcium content [61]. Possibly, the higher calcium in DFK, as a result of mixing DMEM/F12 with KSFM, compared to KSFM alone, could promote a proliferative phenotype in OKF6/TERT-2 cells, displaying gene expression and function (Figure 5 and Figure 6). Extracellular calcium is a media component shown to have variable effects on cell proliferation depending on cell type. For example, human gingival keratinocytes show increased proliferation at low calcium concentrations [62]. Conversely, immortalized human keratinocytes can proliferate at a wide range of calcium concentrations [63]. In addition, low-calcium conditions may stimulate proliferation, but a “calcium-switch” at a threshold of 0.1 mM initiates cellular differentiation [64]. Other differences, such as glutamine (1020 mg/L in KSFM vs. 365 mg/L in DMEM/F-12) and pyridoxine (0.06 mg/L in KSFM vs. 2.013 mg/L in DMEM/F-12) concentrations, may play a role in the culturing of OKF6/TERT-2 cells. Based on conversations with ThermoFisher technical support, arginine, asparagine, and d-calcium pantothenate also differ in concentrations between KSFM and DMEM/F12. However, when cells reach confluence and contact inhibition, they show a more non-proliferative phenotype. As expected, DFK enhances the transition from proliferative to non-proliferative states by reaching contact inhibition faster.
Confocal microscopy with 3D imaging of OKF6/TERT-2 monolayers showed a similar morphology of monolayers on both media. However, cells in the DFK medium yielded rapid proliferation without significant alterations to actin filament arrangement (Figure 3A). Both media led to the formation of small cell aggregates within 2 days. However, the coalescence of these aggregates occurred 24 h sooner in DFK (Figure 2A). Other oral epithelial cell lines demonstrate a typical ‘cobblestone’ appearance 2–3 days after seeding [56,65], which is similarly observed in OKF6/TERT-2 cells (Figure 1 and Figure 2A), as well as ex vivo oral mucosal epithelial cells grown in culture [66]. Our confocal imaging results indicate that this cellular morphology remains unchanged in DFK and KSFM media, and is consistent with the squamous morphology seen in the human oral cavity [67,68,69].
The expression and function of tight junction proteins are critical for epithelial cells from a range of anatomic sites, including the oral epithelium, to maintain a clear barrier between the outside environment and the sub-epithelial tissues. For example, there is a positive correlation between the expression of claudin-1 and occludin with proliferation and migration to close wounds [70]. Since claudin-1 is overexpressed in OKF6/TERT-2 cells cultured in DFK (Figure 5B), this could potentially support the faster recovery of the wound in this medium (Figure 3).
To remain an appropriate model for research on the oral epithelia, OKF6/TERT-2 cells should demonstrate a comparable expression of tight junctions in any media selected. Our results indicate that occludin and ZO-1 are similarly expressed (Figure 5B). This correlates with other studies where tight junction genes are well expressed, and even overexpressed when challenged. For example, exposure to the commensal organism Streptococcus gordonii leads to an elevated expression of the tight junctions ZO-1, ZO-2, and JAM-A, increasing the paracellular barrier function [71]. On the other hand, oral pathogens such as Porphyromonas gingivalis alter the expression levels of tight junctions [6,72,73], which ultimately leads to disease. This alteration in barrier integrity is correlated with susceptibility to severe allergic reactions [74] and the permeability of surfaces in many other anatomic sites, notably the intestinal mucosa [75].
MUC1 and MUC4 were found to be similarly expressed when cells were cultured in KSFM and DFK (Figure 5A), indicating that both media are effective in maintaining this phenotype in OKF6/TERT-2 cells. MUC1 is broadly expressed in mucosal tissues [76]. Similarly, mucins are released by OKF6/TERT-2 cells during culture and later found in the supernatant (Figure 6). This is consistent with other findings indicating that membrane-associated mucins are released into the solution [77,78,79], which in the case of the oral cavity, become part of saliva. Mucins also function as decoys for the clearance of microbial infections. For example, MUC1 binds to adenovirus, reducing infection into host cells [80], where the virus binds to O-linked carbohydrates on the mucin [81]. In addition, MUC1 also binds to non-oral bacteria [82,83], as well as oral species such as Streptococcus gordonii [84] or Streptococcus mutans [54,85], implicating a role in the maintenance and homeostasis of the oral microenvironment. Since both DFK and KSFM support the expression and release of mucins in OKF6/TERT-2 cells, similar to in vivo oral epithelial cells, this further suggests that either medium could be used for studies investigating mucin expression and function.
Based on linear regression, the results of wound-healing assays demonstrate that OKF6/TERT-2 cells recover within 16 h in DFK and 28 h in DMEM/F12, extrapolated to 41 h in KSFM (Figure 3). Other wound-healing studies with the same cell line used media containing FBS. For example, OKF6/TERT-2 cells cultured with KSFM with 1% FBS recover nearly 100% by 18 h [82]. In addition, the same cell line, cultured in Roswell Park Medical Institute (RPMI) medium with 10% FBS, recovered by 24 h after onset of the scratch in the wound-healing assay [83]. In a study by Shaikh et al. [86], using DMEM/F12 with 10% FBS, the full recovery of OKF6/TERT-2 cells took over three days. In our hands, cells cultured in complete DMEM/F12 without FBS (see materials and methods Section 2.1) achieved full recovery within two days (Figure 3). In contrast, DFK consists of a set of nutrients that yields faster wound recovery compared to DMEM/F12 alone (Figure 3). Shaikh’s group [86] also tested the effects of e-liquids on OKF6/TERT-2 cells and reported a decrease in viability after treatments, consistent with our results in Figure 7B. Alanazi et al. [87] show that the pathogenesis of yeast Candida albicans on a human gingival epithelial carcinoma cell line (grown in RPMI with 10% FBS) is increased after the microbe is exposed to tobacco-flavored aerosol. While many studies make use of media with FBS, few studies used serum-free media. For example, Cátala-Valentín and coworkers [88] grew OKF6/TERT-2 cells in KSFM, using a protocol similar to ours, and treated cariogenic S. mutans with an aerosol containing menthol and nicotine. Subsequently, researchers found that S. mutans adherence to OKF6/TERT-2 cells increases after aerosol treatments. Furthermore, another study by Cátala-Valentín et al. [50] shows a significant decrease of cytokine expression after OKF6/TERT-2 cells were challenged with Staphylococcus aureus and exposed to a flavorless aerosol.
The cytotoxicity assay employed in Figure 7C measures LDH activity in the supernatant, suggesting compromised cell membranes, but does not specify how the cells are dying (necrosis vs. apoptosis). Although the viability data (Figure 7B) and the LDH activity data (Figure 7C) appear to be counterintuitive, a potential explanation is that e-liquid treatments induce apoptosis where cytoplasmic contents, including LDH, are packaged within apoptotic bodies and are not released into the supernatant. On the other hand, necrosis is a result of cell membrane rupture where cytoplasmic materials are spilled into the extracellular space (i.e., supernatant). Necrosis could range from a subtle to a more abrupt event, whereas apoptosis is a gradual and organized process resulting in apoptotic bodies. Since Figure 7A shows that the overall protein content is comparable in most samples, it may be plausible that apoptotic bodies were pelleted with intact cells, lysed, and detected in the protein assay.
The oral cavity is frequently the first site of exposure to external insults. Therefore, a biologically representative model of the oral environment is essential considering the vast array of pathophysiological conditions that may occur in the mouth. For example, the oral epithelium was recently identified to contain angiotensin converting enzyme-2 (ACE2) [89], which works as a receptor for the spike protein on severe acute respiratory syndrome coronavirus-2 (SARS-CoV-2). The use of chewing gum containing ACE2 decoy proteins may protect the host from microbial infection [90]. Consequently, DMEM/F12 or DFK may facilitate research in such host-pathogen studies. Since our research interests focus on the use of electronic cigarettes and their effects on oral mucosa, this study compared the applicability of DFK or KSFM on OKF6/TERT-2 cultures exposed to e-liquids ± flavors. An oral epithelial cell line amenable to multiple culture conditions will not only facilitate further research in these areas using monolayer culturing techniques, but also provide a basis for further improved organotypic 3D cultures, a more realistic representation of in vivo tissues [91,92,93,94].
In the present study, we compared the effects of DMEM/F12, DFK, and KSFM on the OKF6/TERT-2 cell line, illustrating that both DMEM/F12 and DFK are viable alternative media, and more importantly, showing that these cells retain appropriate characteristics to study various aspects of oral physiology. This is crucial for interpreting results in studies where OKF6/TERT-2 cells are compared to other cell lines using the same medium. While our results are novel to the field of in vitro oral biology, they are not without limitations. For example, multi-layer 3D cultures reflect the oral environment more accurately, increasing the pertinence of in vitro experimentation [91,92,93,94]. However, the present study was conducted on a monolayer before extension to a more complex 3D model. Using a single cell line for the evaluation of DFK is another limitation. Future studies should explore additional oral cell lines in DFK or other media to further expand in vitro oral epithelial models as well as host-bacteria models. In addition, expression levels of only five genes were measured. These genes were chosen because they are involved in maintaining the integrity of the oral epithelium. Other genes and gene products, such as toll-like receptors, cytokines, adhesion proteins, etc., should be analyzed. Furthermore, in e-liquid experiments, the LDH activity assay was employed, although other protocols to evaluate cytotoxicity are also available. Despite these limitations, our study establishes that OKF6/TERT-2 cells can be cultured efficiently in DFK.
5. Conclusions
Based on the results of these experiments, KSFM is essential to seeding OKF6/TERT-2 cells. However, continued growth of the cultures can be achieved by either keeping the cells in KSFM or switching to DMEM/F12 or DFK. Subsequently, both DMEM/F12 and DFK yield faster cell growth, denser cultures, and quicker wound healing. In addition, claudin-1 expression is enhanced in OKF6/TERT-2 cells cultured in DFK. Furthermore, toxicity of e-liquids ± flavors is amplified in DFK cultures. Switching cultures from KSFM to DMEM/F12 or DFK is a more favorable protocol because it decreases culturing time and expedites research efforts. Given the desirable outcomes of this novel DFK medium, i.e., the growth and functional characteristics of OKF6/TERT-2 cells, this cell-line becomes more accessible to other groups investigating oral biology, therefore expanding its utility. Future studies from our group aim to dissect the effects of e-liquids ± flavors on the oral mucosa, specifically on (1) the cellular and molecular biology, including changes in gene expression and wound healing; (2) the physiological stress response, including glutathione and cytokine alterations; (3) the potential apoptotic events following exposure to e-liquids; and (4) the host-bacteria interactions using both commensal and pathogenic oral species.
Author Contributions
Conceptualization, G.A.C. and D.L.P.; methodology, G.A.C., A.S., R.S., J.M. and D.L.P.; software, G.A.C., R.S. and D.L.P.; investigation, G.A.C., A.S., R.S., J.M. and D.L.P.; validation, G.A.C. and D.L.P.; formal analysis, G.A.C., A.S., R.S., J.M. and D.L.P.; writing—original draft preparation, G.A.C. and A.S.; writing—G.A.C., A.S. and D.L.P.; project administration, G.A.C. and D.L.P.; funding acquisition, G.A.C. and D.L.P. All authors have read and agreed to the published version of the manuscript.
Funding
This research was supported by intramural funding from Muhlenberg College and DeBusk College of Osteopathic Medicine, Lincoln Memorial University.
Institutional Review Board Statement
The study was conducted in accordance with the Declaration of Helsinki, and approved by the Ethics Committee of Muhlenberg College (Cuadra_S19_18 from 13 May 2019).
Informed Consent Statement
Verbal informed consent was obtained from all subjects involved in the study.
Data Availability Statement
The contributions presented in the study are included in the publication. Any further questions or inquiries can be directed to the corresponding author.
Acknowledgments
The authors would like to thank Marten Edwards and Bruce Wightman from Muhlenberg College for their review of the manuscript. In addition, the authors are grateful for Lee Graham at Lehigh University for his technical assistance with confocal microscopy. The authors also thank Emily Luo, Grant McElroy, and Sophie Tomov for their technical assistance with cell counting and wound-healing assay analysis.
Conflicts of Interest
The authors declare no conflict of interest.
References
- Dickson, M.A.; Hahn, W.C.; Ino, Y.; Ronfard, V.; Wu, J.Y.; Weinberg, R.A.; Louis, D.N.; Li, F.P.; Rheinwald, J.G. Human Keratinocytes That Express HTERT and Also Bypass a P16(INK4a)-Enforced Mechanism That Limits Life Span Become Immortal yet Retain Normal Growth and Differentiation Characteristics. Mol. Cell Biol. 2000, 20, 1436–1447. [Google Scholar] [CrossRef] [PubMed]
- Reyes, J.D. Intestinal Transplantation: An Unexpected Journey. Robert E. Gross Lecture. J. Pediatr. Surg. 2014, 49, 13–18. [Google Scholar] [CrossRef]
- Trachootham, D.; Chingsuwanrote, P.; Yoosadiang, P.; Mekkriangkrai, D.; Ratchawong, T.; Buraphacheep, N.; Kijanukul, S.; Saekhow, S.; Pongpitchayadej, O.; Vongvachvasin, K.; et al. Partial Substitution of Glucose with Xylitol Suppressed the Glycolysis and Selectively Inhibited the Proliferation of Oral Cancer Cells. Nutr. Cancer 2017, 69, 862–872. [Google Scholar] [CrossRef] [PubMed]
- Goessel, G.; Quante, M.; Hahn, W.C.; Harada, H.; Heeg, S.; Suliman, Y.; Doebele, M.; von Werder, A.; Fulda, C.; Nakagawa, H.; et al. Creating Oral Squamous Cancer Cells: A Cellular Model of Oral–Esophageal Carcinogenesis. Proc. Natl. Acad. Sci. USA 2005, 102, 15599–15604. [Google Scholar] [CrossRef] [PubMed]
- Hanel, A.N.; Herzog, H.M.; James, M.G.; Cuadra, G.A. Effects of Oral Commensal Streptococci on Porphyromonas Gingivalis Invasion into Oral Epithelial Cells. Dent. J. 2020, 8, 39. [Google Scholar] [CrossRef]
- Chen, W.; Alshaikh, A.; Kim, S.; Kim, J.; Chun, C.; Mehrazarin, S.; Lee, J.; Lux, R.; Kim, R.H.; Shin, K.H.; et al. Porphyromonas Gingivalis Impairs Oral Epithelial Barrier through Targeting GRHL2. J. Dent. Res. 2019, 98, 1150–1158. [Google Scholar] [CrossRef]
- Alekseev, O.; Donegan, W.E.; Donovan, K.R.; Limonnik, V.; Azizkhan-Clifford, J. HSV-1 Hijacks the Host DNA Damage Response in Corneal Epithelial Cells through ICP4-Mediated Activation of ATM. Investig. Ophthalmol. Vis. Sci. 2020, 61, 39. [Google Scholar] [CrossRef]
- Nanjappa, V.; Renuse, S.; Sathe, G.J.; Raja, R.; Syed, N.; Radhakrishnan, A.; Subbannayya, T.; Patil, A.; Marimuthu, A.; Sahasrabuddhe, N.A.; et al. Chronic Exposure to Chewing Tobacco Selects for Overexpression of Stearoyl-CoA Desaturase in Normal Oral Keratinocytes. Cancer Biol. Ther. 2015, 16, 1593–1603. [Google Scholar] [CrossRef]
- Rajagopalan, P.; Patel, K.; Jain, A.P.; Nanjappa, V.; Datta, K.K.; Subbannayya, T.; Mangalaparthi, K.K.; Kumari, A.; Manoharan, M.; Coral, K.; et al. Molecular Alterations Associated with Chronic Exposure to Cigarette Smoke and Chewing Tobacco in Normal Oral Keratinocytes. Cancer Biol. Ther. 2018, 19, 773–785. [Google Scholar] [CrossRef]
- Patil, S.; Patel, K.; Advani, J.; Subbannayya, T.; Rajagopalan, P.; Babu, N.; Solanki, H.; Bhandi, S.; Sidransky, D.; Chatterjee, A.; et al. Multiomic Analysis of Oral Keratinocytes Chronically Exposed to Shisha. J. Oral Pathol. Med. 2019, 48, 284–289. [Google Scholar] [CrossRef]
- Li, W.-C.; Ralphs, K.L.; Slack, J.M.W.; Tosh, D. Keratinocyte Serum-Free Medium Maintains Long-Term Liver Gene Expression and Function in Cultured Rat Hepatocytes by Preventing the Loss of Liver-Enriched Transcription Factors. Int. J. Biochem. Cell Biol. 2007, 39, 541–554. [Google Scholar] [CrossRef]
- Cross, W.R.; Eardley, I.; Leese, H.J.; Southgate, J. A Biomimetic Tissue from Cultured Normal Human Urothelial Cells: Analysis of Physiological Function. Am. J. Physiol. Renal. Physiol. 2005, 289, F459–F468. [Google Scholar] [CrossRef] [PubMed]
- Hu, L.; Pu, Q.; Zhang, Y.; Ma, Q.; Li, G.; Li, X. Expansion and Maintenance of Primary Corneal Epithelial Stem/Progenitor Cells by Inhibition of TGFβ Receptor I-Mediated Signaling. Exp. Eye Res. 2019, 182, 44–56. [Google Scholar] [CrossRef] [PubMed]
- Millhouse, E.; Jose, A.; Sherry, L.; Lappin, D.F.; Patel, N.; Middleton, A.M.; Pratten, J.; Culshaw, S.; Ramage, G. Development of an in Vitro Periodontal Biofilm Model for Assessing Antimicrobial and Host Modulatory Effects of Bioactive Molecules. BMC Oral Health 2014, 14, 80. [Google Scholar] [CrossRef] [PubMed]
- Villar, C.C.; Lin, A.L.; Cao, Z.; Zhao, X.-R.; Wu, L.-A.; Chen, S.; Sun, Y.; Yeh, C.-K. Anticandidal Activity and Biocompatibility of a Rechargeable Antifungal Denture Material. Oral Dis. 2013, 19, 287–295. [Google Scholar] [CrossRef]
- Volk, J.; Leyhausen, G.; Geurtsen, W. Glutathione Level and Genotoxicity in Human Oral Keratinocytes Exposed to TEGDMA. J. Biomed Mater. Res. B Appl. Biomater. 2012, 100, 391–399. [Google Scholar] [CrossRef]
- Volk, J.; Leyhausen, G.; Wessels, M.; Geurtsen, W. Reduced Glutathione Prevents Camphorquinone-Induced Apoptosis in Human Oral Keratinocytes. Dent. Mater. 2014, 30, 215–226. [Google Scholar] [CrossRef]
- Wessels, M.; Rimkus, J.; Leyhausen, G.; Volk, J.; Geurtsen, W. Genotoxic Effects of Camphorquinone and DMT on Human Oral and Intestinal Cells. Dent. Mater. 2015, 31, 1159–1168. [Google Scholar] [CrossRef]
- Perduns, R.; Volk, J.; Plum, M.; Gutzki, F.; Kaever, V.; Geurtsen, W. Effects of HEMA on Nrf2-Related Gene Expression Using a Newly Developed 3D Co-Culture Model of the Oral Mucosa. Dent. Mater. 2019, 35, 1214–1226. [Google Scholar] [CrossRef]
- Reyes, M.; Peña-Oyarzún, D.; Silva, P.; Venegas, S.; Criollo, A.; Torres, V.A. Nuclear Accumulation of β-Catenin Is Associated with Endosomal Sequestration of the Destruction Complex and Increased Activation of Rab5 in Oral Dysplasia. FASEB J. 2020, 34, 4009–4025. [Google Scholar] [CrossRef]
- Yiannis, C.; Huang, K.; Tran, A.N.; Zeng, C.; Dao, E.; Baselyous, O.; Mithwani, M.A.; Paolini, R.; Cirillo, N.; Yap, T.; et al. Protective Effect of Kava Constituents in an in Vitro Model of Oral Mucositis. J. Cancer Res. Clin. Oncol. 2020, 146, 1801–1811. [Google Scholar] [CrossRef] [PubMed]
- DMEM-Dulbecco’s Modified Eagle Medium-US. Available online: https://www.thermofisher.com/us/en/home/life-science/cell-culture/mammalian-cell-culture/classical-media/dmem.html (accessed on 8 January 2022).
- Almela, T.; Brook, I.M.; Moharamzadeh, K. Development of Three-Dimensional Tissue Engineered Bone-Oral Mucosal Composite Models. J. Mater. Sci. Mater. Med. 2016, 27, 65. [Google Scholar] [CrossRef] [PubMed]
- Barker, E.; AlQobaly, L.; Shaikh, Z.; Franklin, K.; Moharamzadeh, K. Implant Soft-Tissue Attachment Using 3D Oral Mucosal Models—A Pilot Study. Dent. J. 2020, 8, 72. [Google Scholar] [CrossRef] [PubMed]
- Basso, F.G.; Cardoso, L.M.; Ribeiro, I.M.; Rizzi, E.; Pansani, T.N.; Hebling, J.; de Souza Costa, C.A. Influence of Bisphosphonates on Oral Implantology: Sodium Alendronate and Zoledronic Acid Enhance the Synthesis and Activity of Matrix Metalloproteinases by Gingival Fibroblasts Seeded on Titanium. Arch. Oral Biol. 2021, 127, 105134. [Google Scholar] [CrossRef]
- Ravosa, M.J.; Ning, J.; Liu, Y.; Stack, M.S. Bisphosphonate Effects on the Behaviour of Oral Epithelial Cells and Oral Fibroblasts. Arch. Oral Biol. 2011, 56, 491–498. [Google Scholar] [CrossRef] [PubMed]
- Fageeh, H.N.; Bhandi, S.; Mashyakhy, M.; Kahtani, A.A.; Badran, Z.; Mehta, D.; Fageeh, H.I.; Balaji, T.M.; Baeshen, H.A.; Varadarajan, S.; et al. Viability of Quercetin-Induced Dental Pulp Stem Cells in Forming Living Cellular Constructs for Soft Tissue Augmentation. J. Pers. Med. 2021, 11, 430. [Google Scholar] [CrossRef]
- Omata, Y.; Lewis, J.B.; Rotenberg, S.; Lockwood, P.E.; Messer, R.L.W.; Noda, M.; Hsu, S.D.; Sano, H.; Wataha, J.C. Intra- and Extracellular Reactive Oxygen Species Generated by Blue Light. J. Biomed Mater. Res. A 2006, 77, 470–477. [Google Scholar] [CrossRef]
- Furuse, M.; Takai, Y. Recent Advances in Understanding Tight Junctions. Fac. Rev. 2021, 10, 18. [Google Scholar] [CrossRef]
- Anderson, J.M. Molecular Structure of Tight Junctions and Their Role in Epithelial Transport. Physiology 2001, 16, 126–130. [Google Scholar] [CrossRef]
- Dawes, C. Salivary Flow Patterns and the Health of Hard and Soft Oral Tissues. J. Am. Dent. Assoc. 2008, 139, 18S–24S. [Google Scholar] [CrossRef]
- Bansil, R.; Turner, B.S. Mucin Structure, Aggregation, Physiological Functions and Biomedical Applications. Curr. Opin. Colloid Interface Sci. 2006, 11, 164–170. [Google Scholar] [CrossRef]
- CREETH, J.M. Constituents of Mucus and Their Separation. Br. Med. Bull. 1978, 34, 17–24. [Google Scholar] [CrossRef] [PubMed]
- Rose, M.C.; Voynow, J.A. Respiratory Tract Mucin Genes and Mucin Glycoproteins in Health and Disease. Physiol. Rev. 2006, 86, 245–278. [Google Scholar] [CrossRef] [PubMed]
- Grondin, J.A.; Kwon, Y.H.; Far, P.M.; Haq, S.; Khan, W.I. Mucins in Intestinal Mucosal Defense and Inflammation: Learning From Clinical and Experimental Studies. Front. Immunol. 2020, 11, 2054. [Google Scholar] [CrossRef] [PubMed]
- Ueta, E.; Tanida, T.; Doi, S.; Osaki, T. Regulation of Candida Albicans Growth and Adhesion by Saliva. J. Lab. Clin. Med. 2000, 136, 66–73. [Google Scholar] [CrossRef]
- Leone, C.W.; Oppenheim, F.G. Physical and Chemical Aspects of Saliva as Indicators of Risk for Dental Caries in Humans. J. Dent. Educ. 2001, 65, 1054–1062. [Google Scholar] [CrossRef]
- Gendler, S.J.; Spicer, A.P.; Lalani, E.N.; Duhig, T.; Peat, N.; Burchell, J.; Pemberton, L.; Boshell, M.; Taylor-Papadimitriou, J. Structure and Biology of a Carcinoma-Associated Mucin, MUC1. Am. Rev. Respir. Dis. 1991, 144, S42–S47. [Google Scholar] [CrossRef]
- Gum, J.R. Mucin Genes and the Proteins They Encode: Structure, Diversity, and Regulation. Am. J. Respir. Cell Mol. Biol. 1992, 7, 557–564. [Google Scholar] [CrossRef]
- Sen, S.; Sharma, S.; Gupta, A.; Gupta, N.; Singh, H.; Roychoudhury, A.; Mohanty, S.; Sen, S.; Nag, T.C.; Tandon, R. Molecular Characterization of Explant Cultured Human Oral Mucosal Epithelial Cells. Investig. Ophthalmol. Vis. Sci. 2011, 52, 9548–9554. [Google Scholar] [CrossRef]
- Supruniuk, K.; Czarnomysy, R.; Muszyńska, A.; Radziejewska, I. Anti-Cancer Effects of Pyrazole-Platinum(II) Complexes Combined with Anti-MUC1 Monoclonal Antibody versus Monotherapy in DLD-1 and HT-29 Colon Cancer Cells. Transl. Oncol. 2022, 18, 101348. [Google Scholar] [CrossRef]
- Abdelwhab, A.; Shaker, O.; Aggour, R.L. Expression of Mucin1 in Saliva in Oral Squamous Cell Carcinoma and Oral Potentially Malignant Disorders (Case Control Study). Oral Dis. 2022, 29, 1487–1494. [Google Scholar] [CrossRef] [PubMed]
- Zhang, C.; Wang, Y.; Liao, W.; Liang, T.; Liu, W.; Xie, J.; Wang, X.; Yang, P.; Lu, W.; Zhang, X. MUC1 Deficiency Induces the Nasal Epithelial Barrier Dysfunction via RBFOX3 Shortage Augments Ubiquitin-Proteasomal Degradation in Allergic Rhinitis Pathogenesis. Allergy 2022, 77, 1596–1599. [Google Scholar] [CrossRef] [PubMed]
- Xu, C.P.; Palazzolo, D.L.; Cuadra, G.A. Mechanistic Effects of E-Liquids on Biofilm Formation and Growth of Oral Commensal Streptococcal Communities: Effect of Flavoring Agents. Dent. J. 2022, 10, 85. [Google Scholar] [CrossRef] [PubMed]
- Fischman, J.S.; Sista, S.; Lee, D.; Cuadra, G.A.; Palazzolo, D.L. Flavorless vs. Flavored Electronic Cigarette-Generated Aerosol and E-Liquid on the Growth of Common Oral Commensal Streptococci. Front. Physiol. 2020, 11, 585416. [Google Scholar] [CrossRef]
- Palazzolo, D.L.; Nelson, J.M.; Ely, E.A.; Crow, A.P.; Distin, J.; Kunigelis, S.C. The Effects of Electronic Cigarette (ECIG)-Generated Aerosol and Conventional Cigarette Smoke on the Mucociliary Transport Velocity (MTV) Using the Bullfrog (R. Catesbiana) Palate Paradigm. Front. Physiol. 2017, 8, 1023. [Google Scholar] [CrossRef]
- Ramenzoni, L.L.; Schneider, A.; Fox, S.C.; Meyer, M.; Meboldt, M.; Attin, T.; Schmidlin, P.R. Cytotoxic and Inflammatory Effects of Electronic and Traditional Cigarettes on Oral Gingival Cells Using a Novel Automated Smoking Instrument: An In Vitro Study. Toxics 2022, 10, 179. [Google Scholar] [CrossRef] [PubMed]
- Tellez, C.S.; Juri, D.E.; Phillips, L.M.; Do, K.; Yingling, C.M.; Thomas, C.L.; Dye, W.W.; Wu, G.; Kishida, S.; Kiyono, T.; et al. Cytotoxicity and Genotoxicity of E-Cigarette Generated Aerosols Containing Diverse Flavoring Products and Nicotine in Oral Epithelial Cell Lines. Toxicol. Sci. 2021, 179, 220–228. [Google Scholar] [CrossRef]
- Beklen, A.; Uckan, D. Electronic Cigarette Liquid Substances Propylene Glycol and Vegetable Glycerin Induce an Inflammatory Response in Gingival Epithelial Cells. Hum. Exp. Toxicol. 2021, 40, 25–34. [Google Scholar] [CrossRef]
- Cátala-Valentín, A.R.; Almeda, J.; Bernard, J.N.; Cole, A.M.; Cole, A.L.; Moore, S.D.; Andl, C.D. E-Cigarette Aerosols Promote Oral S. Aureus Colonization by Delaying an Immune Response and Bacterial Clearing. Cells 2022, 11, 773. [Google Scholar] [CrossRef]
- Suarez-Arnedo, A.; Torres Figueroa, F.; Clavijo, C.; Arbeláez, P.; Cruz, J.C.; Muñoz-Camargo, C. An Image J Plugin for the High Throughput Image Analysis of in Vitro Scratch Wound Healing Assays. PLoS ONE 2020, 15, e0232565. [Google Scholar] [CrossRef]
- Schindelin, J.; Rueden, C.T.; Hiner, M.C.; Eliceiri, K.W. The ImageJ Ecosystem: An Open Platform for Biomedical Image Analysis. Mol. Reprod. Dev. 2015, 82, 518–529. [Google Scholar] [CrossRef] [PubMed]
- Moller, H.J.; Poulsen, J.H. Improved Method for Silver Staining of Glycoproteins in Thin Sodium Dodecyl Sulfate Polyacrylamide Gels. Anal. Biochem. 1995, 226, 371–374. [Google Scholar] [CrossRef]
- Culp, D.J.; Robinson, B.; Cash, M.N.; Bhattacharyya, I.; Stewart, C.; Cuadra-Saenz, G. Salivary Mucin 19 Glycoproteins: Innate Immune Functions in Streptococcus Mutans-Induced Caries in Mice and Evidence for Expression in Human Saliva. J. Biol. Chem. 2015, 290, 2993–3008. [Google Scholar] [CrossRef] [PubMed]
- Stratified Epithelium. Available online: https://www.kenhub.com/en/library/anatomy/stratified-epithelium (accessed on 16 June 2022).
- Moffatt-Jauregui, C.E.; Robinson, B.; de Moya, A.V.; Brockman, R.D.; Roman, A.V.; Cash, M.N.; Culp, D.J.; Lamont, R.J. Establishment and Characterization of a Telomerase Immortalized Human Gingival Epithelial Cell Line. J. Periodontal. Res. 2013, 48, 713–721. [Google Scholar] [CrossRef]
- Forslind, B. Quantitative X-Ray Microanalysis of Skin. Particle Probe Evaluation of the Skin Barrier Function. Acta Derm. Venereol. Suppl. 1987, 134, 1–8. [Google Scholar]
- Forslind, B.; Lindberg, M.; Malmqvist, K.G.; Pallon, J.; Roomans, G.M.; Werner-Linde, Y. Human Skin Physiology Studied by Particle Probe Microanalysis. Scanning Microsc. 1995, 9, 1011–1025, discussion 1025–1026. [Google Scholar] [PubMed]
- Forslind, B.; Lindberg, M.; Roomans, G.M.; Pallon, J.; Werner-Linde, Y. Aspects on the Physiology of Human Skin: Studies Using Particle Probe Analysis. Microsc. Res. Tech. 1997, 38, 373–386. [Google Scholar] [CrossRef]
- Pallon, J.; Malmqvist, K.G.; Werner-Linde, Y.; Forslind, B. Pixe Analysis of Pathological Skin with Special Reference to Psoriasis and Atopic Dry Skin. Cell Mol. Biol. 1996, 42, 111–118. [Google Scholar]
- Leinonen, P.T.; Hägg, P.M.; Peltonen, S.; Jouhilahti, E.-M.; Melkko, J.; Korkiamäki, T.; Oikarinen, A.; Peltonen, J. Reevaluation of the Normal Epidermal Calcium Gradient, and Analysis of Calcium Levels and ATP Receptors in Hailey–Hailey and Darier Epidermis. J. Investig. Dermatol. 2009, 129, 1379–1387. [Google Scholar] [CrossRef]
- Turunen, A.; Syrjänen, S. Extracellular Calcium Regulates Keratinocyte Proliferation and HPV 16 E6 RNA Expression in Vitro. APMIS 2014, 122, 781–789. [Google Scholar] [CrossRef]
- Fujisaki, H.; Futaki, S.; Yamada, M.; Sekiguchi, K.; Hayashi, T.; Ikejima, T.; Hattori, S. Respective Optimal Calcium Concentrations for Proliferation on Type I Collagen Fibrils in Two Keratinocyte Line Cells, HaCaT and FEPE1L-8. Regen. Ther. 2018, 8, 73–79. [Google Scholar] [CrossRef] [PubMed]
- Bikle, D.D.; Xie, Z.; Tu, C.-L. Calcium Regulation of Keratinocyte Differentiation. Expert Rev. Endocrinol. Metab. 2012, 7, 461–472. [Google Scholar] [CrossRef] [PubMed]
- Oda, D.; Watson, E. Human Oral Epithelial Cell Culture, I. Improved Conditions for Reproducible Culture in Serum-Free Medium. Vitr. Cell Dev. Biol. 1990, 26, 589–595. [Google Scholar] [CrossRef] [PubMed]
- Morino, T.; Takagi, R.; Yamamoto, K.; Kojima, H.; Yamato, M. Explant Culture of Oral Mucosal Epithelial Cells for Fabricating Transplantable Epithelial Cell Sheet. Regen. Ther. 2018, 10, 36–45. [Google Scholar] [CrossRef] [PubMed]
- Groeger, S.; Meyle, J. Oral Mucosal Epithelial Cells. Front. Immunol. 2019, 10, 208. [Google Scholar] [CrossRef] [PubMed]
- Kasai, Y.; Sugiyama, H.; Takagi, R.; Kondo, M.; Owaki, T.; Namiki, H.; Okano, T.; Takeda, N.; Yamato, M. Brush Biopsy of Human Oral Mucosal Epithelial Cells as a Quality Control of the Cell Source for Fabrication of Transplantable Epithelial Cell Sheets for Regenerative Medicine. Regen. Ther. 2016, 4, 71–77. [Google Scholar] [CrossRef]
- Pelaez-Prestel, H.F.; Sanchez-Trincado, J.L.; Lafuente, E.M.; Reche, P.A. Immune Tolerance in the Oral Mucosa. Int. J. Mol. Sci. 2021, 22, 12149. [Google Scholar] [CrossRef]
- Leonardo, T.R.; Shi, J.; Chen, D.; Trivedi, H.M.; Chen, L. Differential Expression and Function of Bicellular Tight Junctions in Skin and Oral Wound Healing. Int. J. Mol. Sci. 2020, 21, 2966. [Google Scholar] [CrossRef]
- Ye, P.; Harty, D.; Commandeur, Z.; Hunter, N. Binding of Streptococcus Gordonii to Oral Epithelial Monolayers Increases Paracellular Barrier Function. Microb. Pathog. 2013, 56, 53–59. [Google Scholar] [CrossRef]
- Lagha, A.B.; Groeger, S.; Meyle, J.; Grenier, D. Green Tea Polyphenols Enhance Gingival Keratinocyte Integrity and Protect against Invasion by Porphyromonas Gingivalis. Pathog. Dis. 2018, 76, fty030. [Google Scholar] [CrossRef]
- Guo, W.; Wang, P.; Liu, Z.-H.; Ye, P. Analysis of Differential Expression of Tight Junction Proteins in Cultured Oral Epithelial Cells Altered by Porphyromonas Gingivalis, Porphyromonas Gingivalis Lipopolysaccharide, and Extracellular Adenosine Triphosphate. Int. J. Oral Sci. 2018, 10, e8. [Google Scholar] [CrossRef]
- Rosace, D.; Gomez-Casado, C.; Fernandez, P.; Perez-Gordo, M.; Dominguez, M.D.C.; Vega, A.; Belver, M.T.; Ramos, T.; Vega, F.; Marco, G.; et al. Profilin-Mediated Food-Induced Allergic Reactions Are Associated with Oral Epithelial Remodeling. J. Allergy Clin. Immunol. 2019, 143, 681–690.e1. [Google Scholar] [CrossRef] [PubMed]
- Najarro, K.M.; Boe, D.M.; Walrath, T.M.; Mullen, J.E.; Paul, M.T.; Frankel, J.H.; Hulsebus, H.J.; Idrovo, J.-P.; McMahan, R.H.; Kovacs, E.J. Advanced Age Exacerbates Intestinal Epithelial Permeability after Burn Injury in Mice. Exp. Gerontol. 2022, 158, 111654. [Google Scholar] [CrossRef] [PubMed]
- Gendler, S.J. MUC1, the Renaissance Molecule. J. Mammary Gland. Biol. Neoplasia 2001, 6, 339–353. [Google Scholar] [CrossRef]
- Wreschner, D.H.; McGuckin, M.A.; Williams, S.J.; Baruch, A.; Yoeli, M.; Ziv, R.; Okun, L.; Zaretsky, J.; Smorodinsky, N.; Keydar, I.; et al. Generation of Ligand-Receptor Alliances by “SEA” Module-Mediated Cleavage of Membrane-Associated Mucin Proteins. Protein Sci. 2002, 11, 698–706. [Google Scholar] [CrossRef] [PubMed]
- Levitin, F.; Stern, O.; Weiss, M.; Gil-Henn, C.; Ziv, R.; Prokocimer, Z.; Smorodinsky, N.I.; Rubinstein, D.B.; Wreschner, D.H. The MUC1 SEA Module Is a Self-Cleaving Domain. J. Biol. Chem. 2005, 280, 33374–33386. [Google Scholar] [CrossRef]
- Parry, S.; Silverman, H.S.; McDermott, K.; Willis, A.; Hollingsworth, M.A.; Harris, A. Identification of MUC1 Proteolytic Cleavage Sites in Vivo. Biochem. Biophys. Res. Commun. 2001, 283, 715–720. [Google Scholar] [CrossRef] [PubMed]
- Arcasoy, S.M.; Latoche, J.; Gondor, M.; Watkins, S.C.; Henderson, R.A.; Hughey, R.; Finn, O.J.; Pilewski, J.M. MUC1 and Other Sialoglycoconjugates Inhibit Adenovirus-Mediated Gene Transfer to Epithelial Cells. Am. J. Respir. Cell Mol. Biol. 1997, 17, 422–435. [Google Scholar] [CrossRef]
- Walters, R.W.; Pilewski, J.M.; Chiorini, J.A.; Zabner, J. Secreted and Transmembrane Mucins Inhibit Gene Transfer with AAV4 More Efficiently than AAV5. J. Biol. Chem. 2002, 277, 23709–23713. [Google Scholar] [CrossRef]
- Ling, L.-Q.R.; Lin, Z.; Paolini, R.; Farah, C.S.; McCullough, M.; Lim, M.A.W.T.; Celentano, A. Commonly Prescribed Anticoagulants Exert Anticancer Effects in Oral Squamous Cell Carcinoma Cells In Vitro. Biology 2022, 11, 596. [Google Scholar] [CrossRef]
- Dennis, M.; Wang, G.; Luo, J.; Lin, Y.; Dohadwala, M.; Sidell, D.; DeConde, A.; Abemayor, E.; Elashoff, D.A.; Sharma, S.; et al. Snail Controls the Mesenchymal Phenotype and Drives Erlotinib Resistance in Oral Epithelial and HNSCC Cells. Otolaryngol. Head Neck Surg. 2012, 147, 726–732. [Google Scholar] [CrossRef]
- Lima, B.P.; Davies, J.R.; Wickström, C.; Johnstone, K.F.; Hall, J.W.; Svensater, G.; Herzberg, M.C. Streptococcus Gordonii Poised for Glycan Feeding through a MUC5B-Discriminating, Lipoteichoic Acid-Mediated Outside-In Signaling Circuit. J. Bacteriol. 2022, 204, e0011822. [Google Scholar] [CrossRef] [PubMed]
- Frenkel, E.S.; Ribbeck, K. Salivary Mucins Protect Surfaces from Colonization by Cariogenic Bacteria. Appl. Environ. Microbiol. 2015, 81, 332–338. [Google Scholar] [CrossRef] [PubMed]
- Shaikh, Z.N.; Alqahtani, A.; Almela, T.; Franklin, K.; Tayebi, L.; Moharamzadeh, K. Effects of Electronic Cigarette Liquid on Monolayer and 3D Tissue-Engineered Models of Human Gingival Mucosa. J. Adv. Periodontol. Implant. Dent. 2019, 11, 54–62. [Google Scholar] [CrossRef] [PubMed]
- Alanazi, H.; Semlali, A.; Chmielewski, W.; Rouabhia, M. E-Cigarettes Increase Candida Albicans Growth and Modulate Its Interaction with Gingival Epithelial Cells. Int. J. Environ. Res. Public Health 2019, 16, 294. [Google Scholar] [CrossRef] [PubMed]
- Cátala-Valentín, A.; Bernard, J.N.; Caldwell, M.; Maxson, J.; Moore, S.D.; Andl, C.D. E-Cigarette Aerosol Exposure Favors the Growth and Colonization of Oral Streptococcus Mutans Compared to Commensal Streptococci. Microbiol. Spectr. 2022, 10, e02421-21. [Google Scholar] [CrossRef]
- Xu, H.; Zhong, L.; Deng, J.; Peng, J.; Dan, H.; Zeng, X.; Li, T.; Chen, Q. High Expression of ACE2 Receptor of 2019-NCoV on the Epithelial Cells of Oral Mucosa. Int. J. Oral Sci. 2020, 12, 8. [Google Scholar] [CrossRef]
- Daniell, H.; Nair, S.K.; Esmaeili, N.; Wakade, G.; Shahid, N.; Ganesan, P.K.; Islam, M.R.; Shepley-McTaggart, A.; Feng, S.; Gary, E.N.; et al. Debulking SARS-CoV-2 in Saliva Using Angiotensin Converting Enzyme 2 in Chewing Gum to Decrease Oral Virus Transmission and Infection. Mol. Ther. 2021, 30, 1966–1978. [Google Scholar] [CrossRef]
- Yessentayeva, S.Y.; Orakbay, L.Z.; Adilhanova, A.; Yessimov, N. Approaches to the Use of Stem Cells in Regenerative Medicine. Anal. Biochem. 2022, 645, 114608. [Google Scholar] [CrossRef]
- Moysidou, C.-M.; Barberio, C.; Owens, R.M. Advances in Engineering Human Tissue Models. Front. Bioeng. Biotechnol. 2020, 8, 620962. [Google Scholar] [CrossRef]
- Klausner, M.; Handa, Y.; Aizawa, S. In Vitro Three-Dimensional Organotypic Culture Models of the Oral Mucosa. Vitr. Cell Dev. Biol. Anim. 2021, 57, 148–159. [Google Scholar] [CrossRef] [PubMed]
- Gibbs, S.; Roffel, S.; Meyer, M.; Gasser, A. Biology of Soft Tissue Repair: Gingival Epithelium in Wound Healing and Attachment to the Tooth and Abutment Surface. Eur. Cell Mater. 2019, 38, 63–78. [Google Scholar] [CrossRef] [PubMed]
Disclaimer/Publisher’s Note: The statements, opinions and data contained in all publications are solely those of the individual author(s) and contributor(s) and not of MDPI and/or the editor(s). MDPI and/or the editor(s) disclaim responsibility for any injury to people or property resulting from any ideas, methods, instructions or products referred to in the content. |
© 2023 by the authors. Licensee MDPI, Basel, Switzerland. This article is an open access article distributed under the terms and conditions of the Creative Commons Attribution (CC BY) license (https://creativecommons.org/licenses/by/4.0/).