1. Introduction
Tokenization is increasingly presented as a way to modernize financial markets by making ownership records programmable, enabling fractional participation, and reducing operational frictions across issuance, settlement, and servicing processes [
1,
2,
3]. In this narrative, real-world assets such as government bonds, private credit, real estate, commodities, and fund shares can be represented as blockchain-based tokens and potentially become more accessible to a broader investor base. Yet the strongest practical claim surrounding tokenization is not simply that assets can be issued on chain but that tokenization can improve liquidity in markets that have historically been difficult to enter or exit.
This claim deserves closer scrutiny. Recent institutional work highlights the potential benefits of tokenization in transparency, composability, and post-trade efficiency while also emphasizing persistent constraints related to fragmented regulation, limited interoperability, immature infrastructure, and weak secondary market depth [
1,
4,
5]. In other words, tokenization can change the technical form of ownership without necessarily producing active trading.
This distinction is especially important in the emerging market for tokenized real-world assets. Public dashboards now track a growing universe of non-stablecoin RWAs across multiple chains and platforms [
6]. However, the distribution of tokenized value across categories says little by itself about the ease with which investors can trade, transfer, or exit those positions. A large tokenized market can remain illiquid if activity is concentrated in minting and redemption flows, if participation is narrow, or if tokens circulate only within limited institutional or operational settings. This question matters not only for researchers but also for investors evaluating exit risk, issuers designing token structures, and regulators assessing whether tokenized markets are becoming meaningfully tradable in practice.
The empirical literature remains narrower than the policy debate. Existing evidence is concentrated primarily in tokenized real estate. Swinkels studies 58 tokenized residential properties and shows that properties change hands roughly once per year on average [
7]. Kreppmeier et al. analyze 173 U.S. real estate tokens and 238,433 blockchain transactions, finding broad ownership but limited diversification and important roles for crypto-market determinants in secondary activity [
8]. Laschinger et al. examine liquidity mechanisms in real estate tokenization, while Cornelli shows that tokenized real estate can fill gaps in underserved local markets, although liquidity preservation during shocks depends on institutional buyback features [
9,
10]. Taken together, these studies provide valuable evidence on tokenized real estate, but comparable cross-category empirical evidence for tokenized Treasuries, commodities, and private-credit-linked assets remains limited.
This paper addresses this gap by asking two questions. First, how does observed liquidity differ across tokenized real-world assets when liquidity is measured directly rather than inferred from issuance growth? Second, which token characteristics are associated with higher observed liquidity across assets and over time? To answer these questions, this paper builds an Ethereum-based token–month panel using RWA.xyz as the main data source, while Etherscan is used only for contract-level validation and contextual checks. The analysis is limited to Ethereum-based assets to improve consistency and comparability across tokens. This study is therefore designed as a focused exploratory panel rather than as a full cross-chain census of tokenized RWAs. In turn, this paper examines observed liquidity within tokenized RWA markets, not the causal effect of tokenization relative to non-tokenized assets.
This paper makes three contributions. First, it develops an empirical framework for observed RWA liquidity that separates turnover, participation breadth, and whether a token is active at all in a given month. Second, it moves beyond the mainly real-estate-based evidence by comparing liquidity across a focused sample of tokenized Treasuries, gold-backed commodities, and private-credit-related assets. Third, it shows a practical way to study liquidity in a young and data-constrained market by combining descriptive evidence, non-parametric tests, and panel regressions. The contribution of this paper is therefore mainly empirical: it builds a transparent token–month panel and uses it to study observed liquidity in an underexplored part of tokenized finance.
The remainder of this paper proceeds as follows.
Section 2 positions this study within the literature on tokenization, liquidity, and market structure.
Section 3 describes the data, defines the liquidity measures and explanatory variables, and presents the empirical strategy.
Section 4 discusses the descriptive patterns, group difference tests, regression results, and broader structural interpretation.
Section 5 concludes with implications, limitations, and directions for future research.
3. Data and Methodology
3.1. Data Sources and Sample Construction
The empirical analysis combines two levels of evidence. First, aggregate market information from RWA.xyz [
6] is used to describe the broader growth and composition of the tokenized real-world asset (RWA) market. Second, a formal empirical analysis is conducted on a token–month panel constructed from manually collected monthly observations for selected Ethereum-based RWA tokens. The Ethereum restriction is intentional. It provides a more consistent and comparable sample because Ethereum offers the most transparent and verifiable token-level activity data for this set of assets while also reducing cross-chain measurement inconsistency. Supplemental contract-level observations from Etherscan [
29] are used only as a supporting reference when token activity patterns require additional verification or illustration.
The empirical unit is the token–month. The sample covers the six months from December 2025 to May 2026 and includes nine non-stablecoin tokenized RWAs: BUIDL, BENJI, OUSG, USTB, USDY, SCOPE, STAC, PAXG, and XAUT. These tokens were selected to represent three segments of the tokenized RWA market that can be tracked consistently in public blockchain data: U.S. Treasury-backed tokens, gold-backed commodity tokens, and private-credit-related tokens. The sample is intentionally focused, not exhaustive. Token selection was based on four criteria: category relevance, non-stablecoin investment exposure, Ethereum-based observability, and the availability of comparable month-end data for the core variables used in the analysis.
The six-month window was chosen to keep the panel balanced across the three categories. In particular, the private credit segment could only be included on a comparable basis from December 2025 onward using the same publicly observable month-end indicators as the Treasury and commodity segments. The sample therefore starts in December 2025 because this is the earliest month in which all three categories can be included in a common panel. The final panel contains 54 token–month observations. USDC was collected separately as a benchmark for scale and market activity, but it is excluded from the baseline estimations because its main economic role is transactional settlement rather than tokenized investment exposure. The panel should therefore be read as a purposive design for comparability and transparency, not as a census of the broader tokenized RWA market.
For each token–month observation, the dataset records the total on-chain asset value, number of holders, monthly transfer volume, and monthly active addresses. The panel is constructed from monthly snapshots taken at calendar month-end or, where an exact month-end value was unavailable, the nearest available end-of-month observation. Using a consistent month-end convention improves comparability across months and supports a balanced descriptive and exploratory panel framework. Monthly frequency was used because this study is designed to compare cross-token liquidity patterns over time in a young market where daily microstructure quality data are not consistently observable across the selected assets. Before estimation, the data were preprocessed in a manner consistent with the definitions of the empirical variables. Turnover was constructed as monthly transfer volume divided by total asset value. Because the logarithm is undefined at zero, token–month observations with zero transfer volume are excluded from specifications that use log turnover, and observations with zero active addresses are excluded from specifications that use log active addresses or the log active ratio. Repeated monthly observations for the same token are retained as part of the token–month panel structure and are handled through month fixed effects in the baseline models and token fixed effects in robustness analysis. The empirical analysis was implemented in Python version 3.13.5 using pandas version 2.2.3, SciPy version 1.17.0, and statsmodels version 0.14.6. The figures were generated using Matplotlib version 3.10.8.
An important measurement caveat is that on-chain transfers are not equivalent to economic trades. Monthly transfer volume may reflect genuine secondary market activity, but it may also include minting and redemption events, Treasury movements, custodial rebalancing, or other operational flows. For this reason, the analysis treats transfer-based variables as proxies for observed liquidity rather than direct measures of execution quality, bid–ask spreads, market depth, or price impact. The empirical results should therefore be interpreted as evidence on relative on-chain activity and tradability across tokens and over time, not as a complete market microstructure assessment.
3.2. Liquidity Measures and Explanatory Variables
The baseline analysis employs a size-adjusted proxy for observed on-chain liquidity constructed from the token–month variables in the dataset. Following standard turnover logic in liquidity measurement [
23], the baseline turnover measure is defined as follows:
where
i indexes tokens, and
t indexes months.
The variable captures observed on-chain transfer activity relative to token size. It does not constitute a direct measure of secondary-market execution quality because transfer volume may include operational or administrative flows in addition to trading and does not directly capture bid–ask spreads, market depth, or price impact. Nevertheless, it provides a more comparable liquidity proxy than raw transfer volume alone, especially when tokens differ sharply in scale.
Given the variables available in the RWA.xyz-based dataset, the empirical analysis uses two supplementary liquidity indicators. The first is
, which captures the breadth of active participation in a given month. The second is
, a binary indicator equal to 1 if monthly transfer volume is greater than zero and 0 otherwise. In the robustness analysis, the paper also considers an alternative participation-based measure,
, where
is defined as monthly active addresses divided by total holders. The focus on participation breadth is consistent with the literature linking ownership structure, participation, and tradability [
27].
The explanatory variables are restricted to those consistently observable in the token–month panel. The baseline specification therefore includes , where size is measured using total asset value; , which measures holder breadth; and asset-class indicators for Treasury, Gold, and Private Credit. Month fixed effects are added to capture common temporal shocks affecting all tokens in the sample. In alternative specifications, token fixed effects are also used to absorb time-invariant token-specific heterogeneity.
Table 1 summarizes the core variables used in the empirical analysis, their construction, and their data treatment. The baseline liquidity proxy is
, defined as monthly transfer volume divided by total asset value, which scales observed activity by token size. In addition to turnover, the analysis uses
and
to capture alternative dimensions of observed liquidity. The robustness analysis also considers
, which relates active participation to the broader holder base. All continuous size and participation variables are log-transformed because the data are highly skewed, with substantial differences between small and large tokens.
3.3. Hypotheses and Empirical Strategy
The hypotheses are grounded in three related strands of the literature. First, the tokenization literature suggests that blockchain-based claims can alter ownership structures, transfer mechanics, and market access, but it does not imply that all tokenized assets should display similar realized liquidity [
11,
12,
13]. This motivates H1, which expects observed liquidity to differ across tokenized RWA asset classes. Second, theory and prior empirical evidence suggest that participation breadth matters for market activity. Broader ownership can increase the pool of potential counterparties and support more persistent trading, whereas concentrated ownership may preserve control at the cost of lower liquidity [
7,
27]. This motivates H2. Third, the liquidity literature shows that size alone is not a sufficient indicator of tradability because liquidity depends on trading frictions, price impact, funding conditions, and the interaction between market structure and order flow [
22,
23,
24,
25]. This motivates H3, which distinguishes issuance scale from observed secondary-market liquidity.
Because the dataset covers only already-tokenized assets, the paper does not estimate whether tokenization itself increases liquidity relative to non-tokenized counterparts. Instead, it examines how observed liquidity varies across tokenized real-world assets according to asset class and token characteristics. The analysis evaluates three hypotheses using the variables available in the token–month panel. Given the short sample period and focused design, the findings should be interpreted as exploratory rather than causal or broadly generalizable.
H1. Observed liquidity differs across tokenized RWA asset classes.
H2. Tokens with broader holder bases exhibit higher observed liquidity.
H3. Larger tokens do not necessarily exhibit higher observed liquidity once participation breadth and asset-class differences are taken into account.
The empirical strategy proceeds in three stages.
First, the paper reports descriptive statistics and category-level comparisons for the token–month panel. Because the liquidity proxies are skewed and the sample includes both very small and very large tokens, medians are emphasized alongside means. The descriptive analysis documents the extent of heterogeneity across Treasury-backed tokens, gold-backed tokens, and private-credit-related assets.
Second, the paper uses non-parametric methods to evaluate cross-sectional differences. Kruskal–Wallis tests are used to compare the liquidity proxies across asset classes because the sample is small and the variables are highly non-normal.
Third, the paper estimates exploratory panel regressions with month fixed effects to examine the token characteristics associated with observed liquidity. The baseline specification is defined as follows:
where
i indexes tokens,
t indexes months, and
denotes the asset class to which token
i belongs. The variable
denotes the liquidity proxy for token
i in month
t. In the main specification, the dependent variable is
, where
is defined as monthly transfer volume divided by total asset value. This variable is defined only for observations in which transfer volume is strictly positive.
The parameter is the constant term. The variable is the natural logarithm of total asset value and captures token scale, whereas is the natural logarithm of the number of holders and captures ownership breadth. The term represents asset-class fixed effects, which absorb systematic differences across token categories. The term represents month fixed effects, which absorb common monthly shocks, and denotes the residual error term.
As an additional specification, the analysis uses
as the dependent variable, where
This specification captures the presence of observed monthly activity rather than the intensity of turnover. Given the short six-month panel and the limited set of consistently available covariates, all regression results should be interpreted as exploratory associations that provide preliminary evidence on observed liquidity patterns within tokenized RWA markets.
4. Results and Discussion
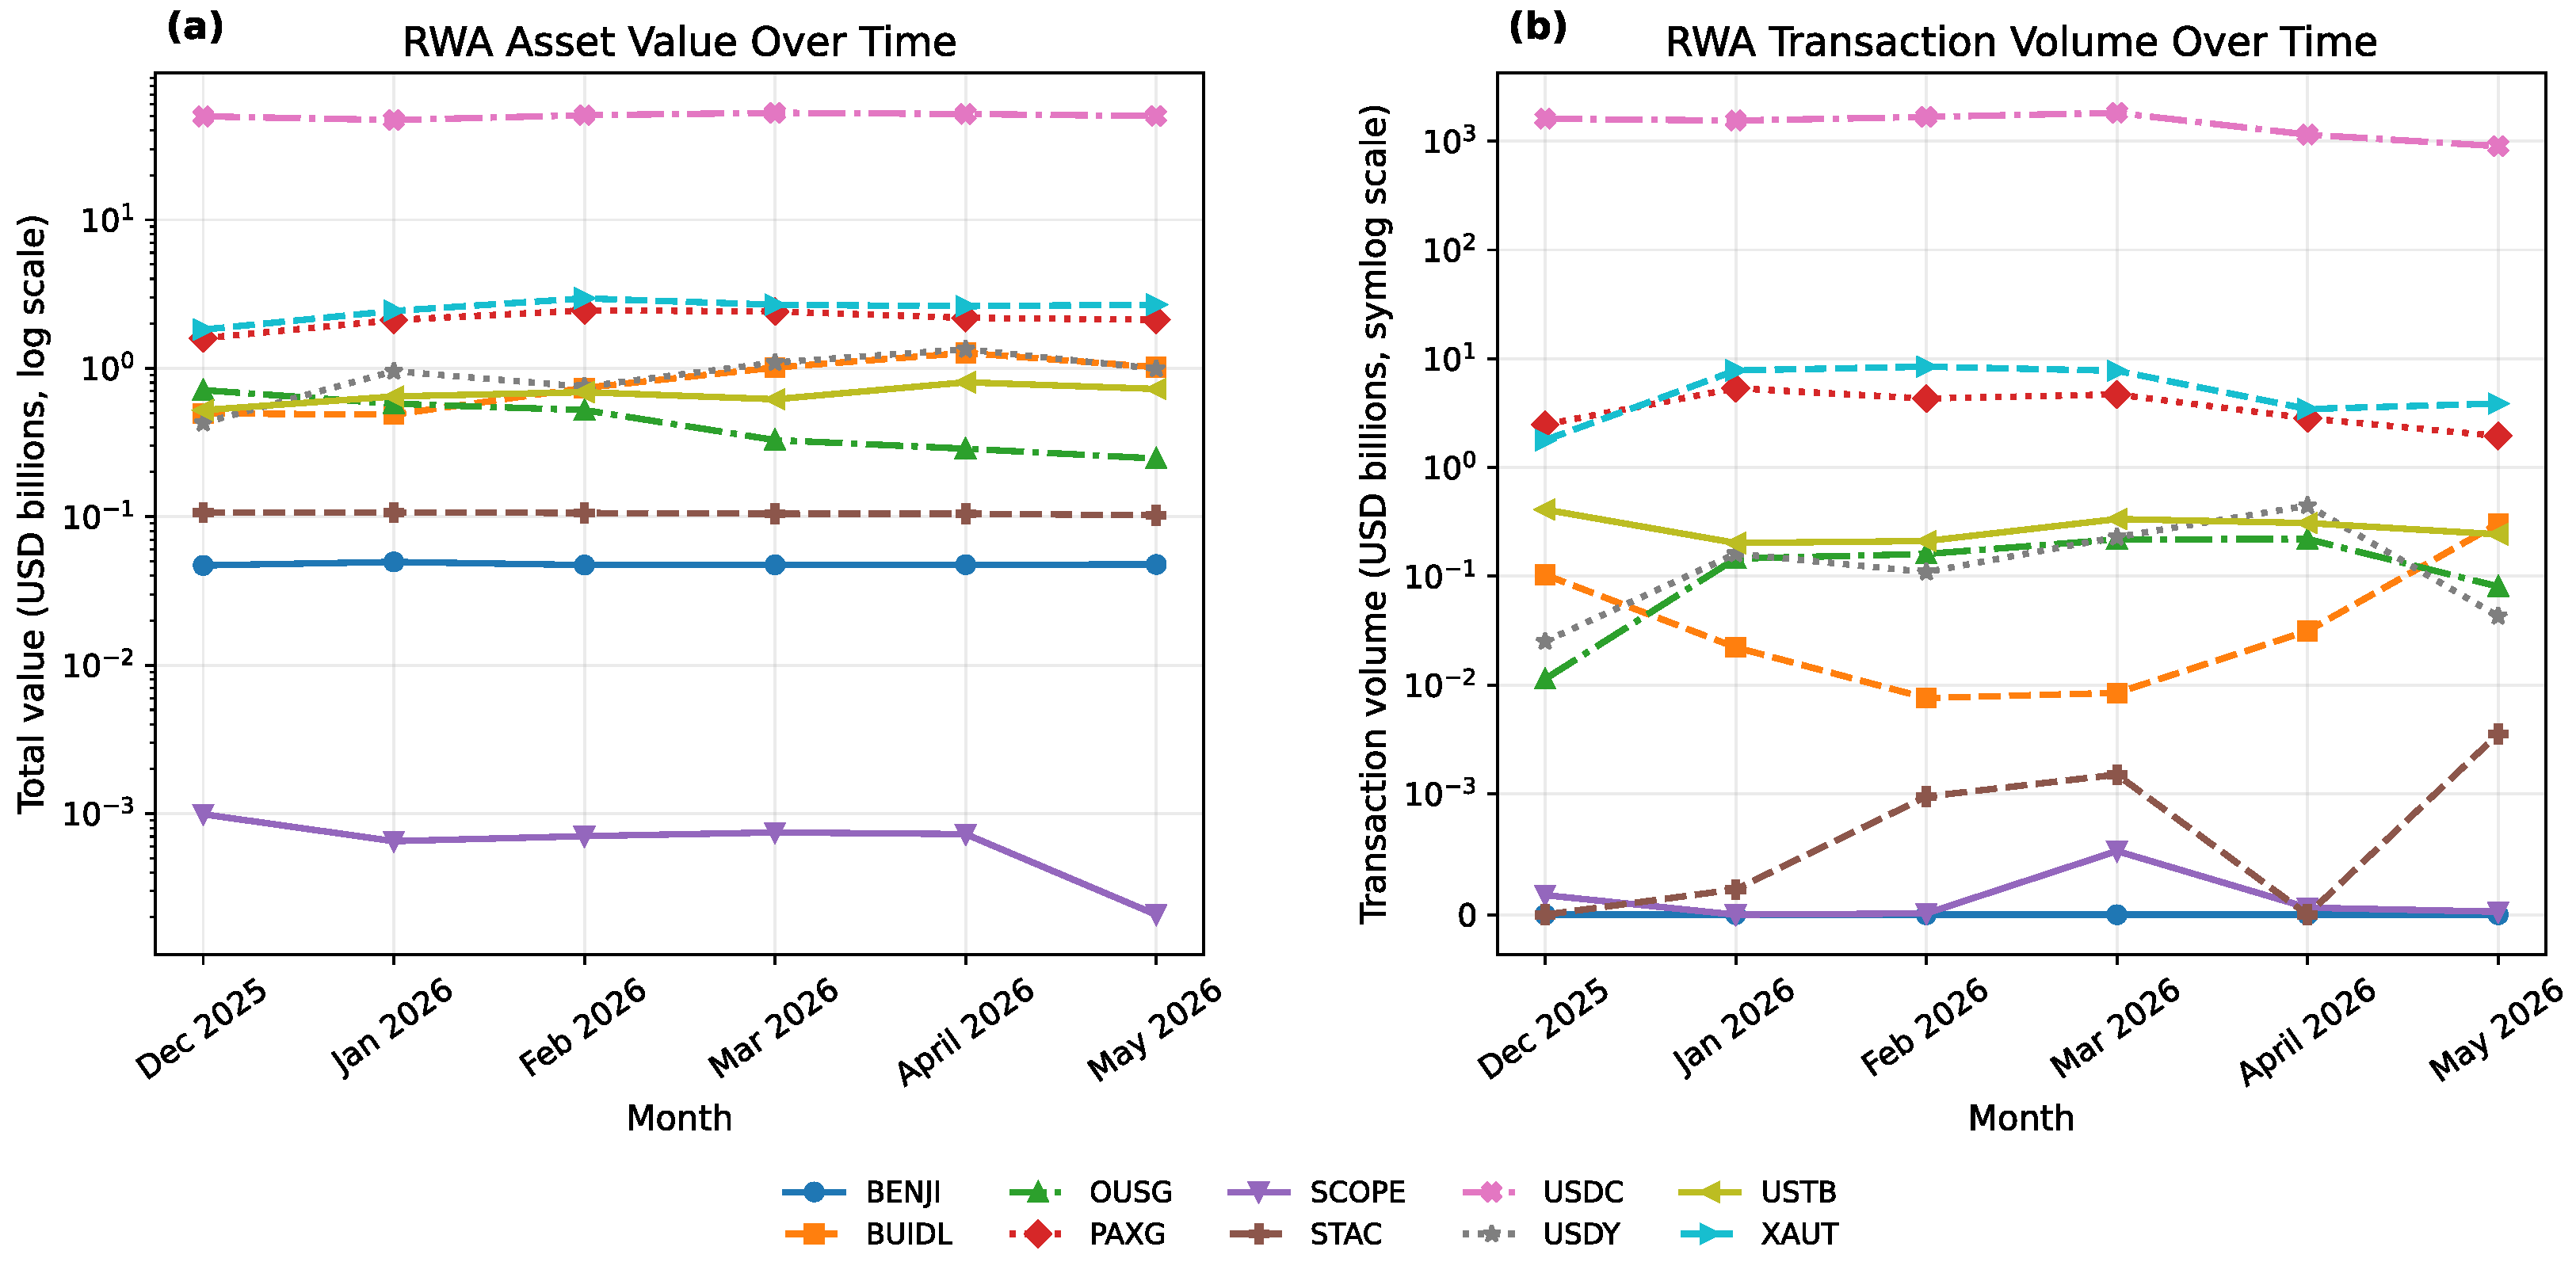
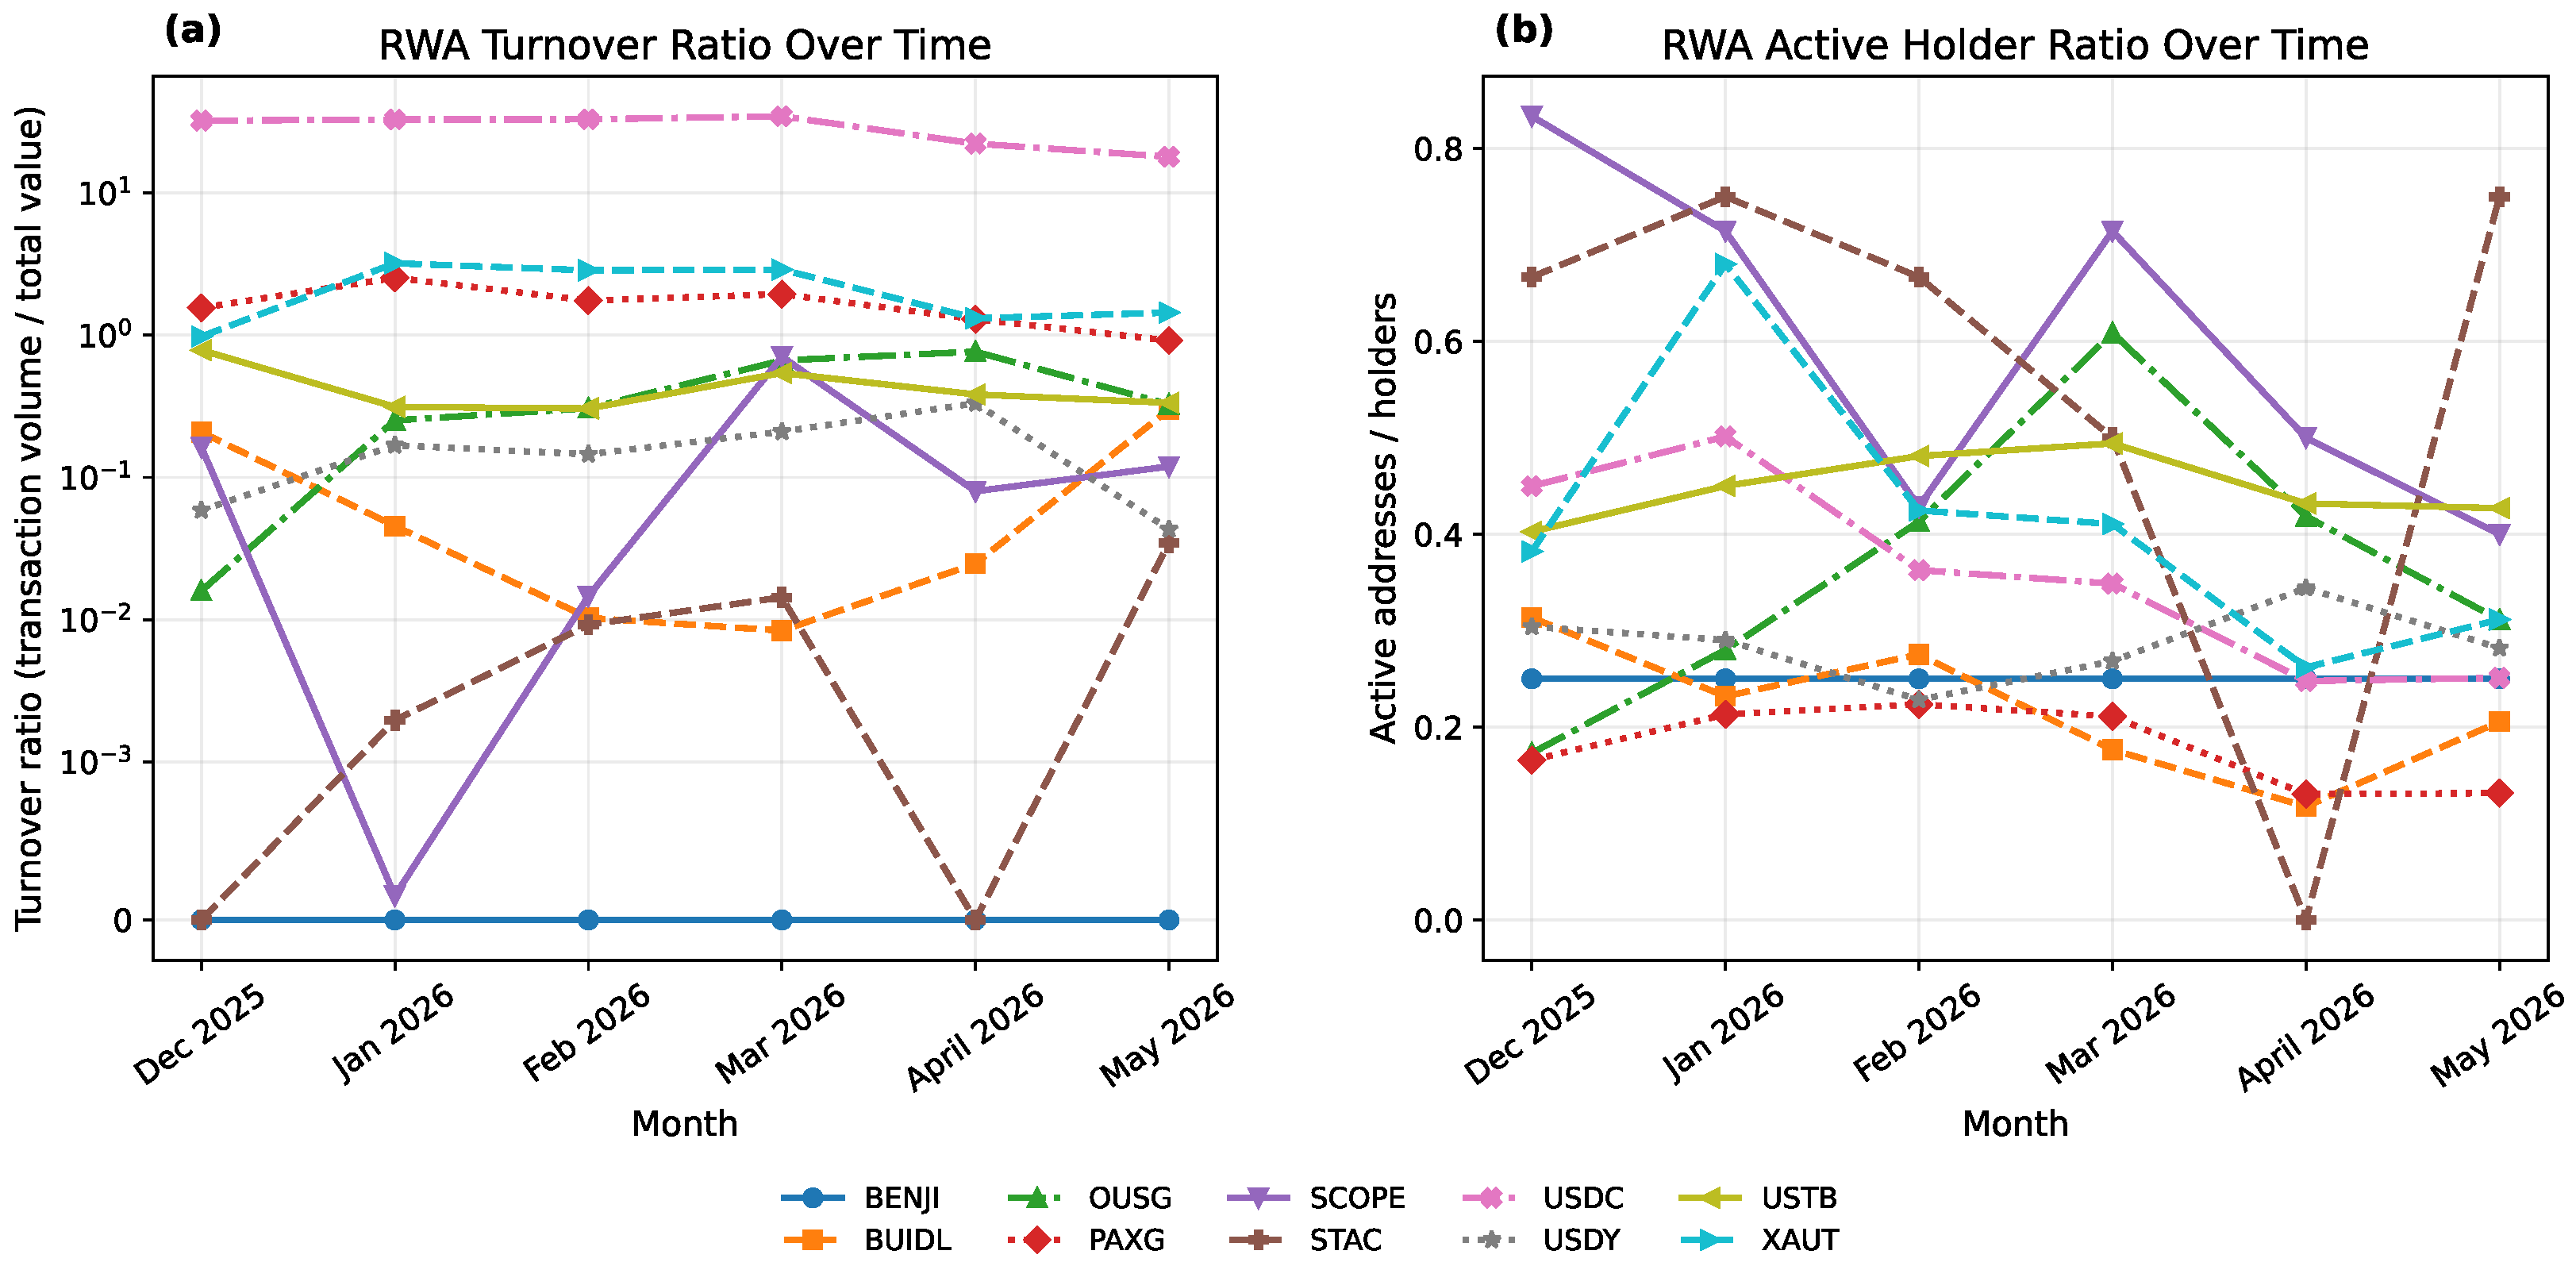
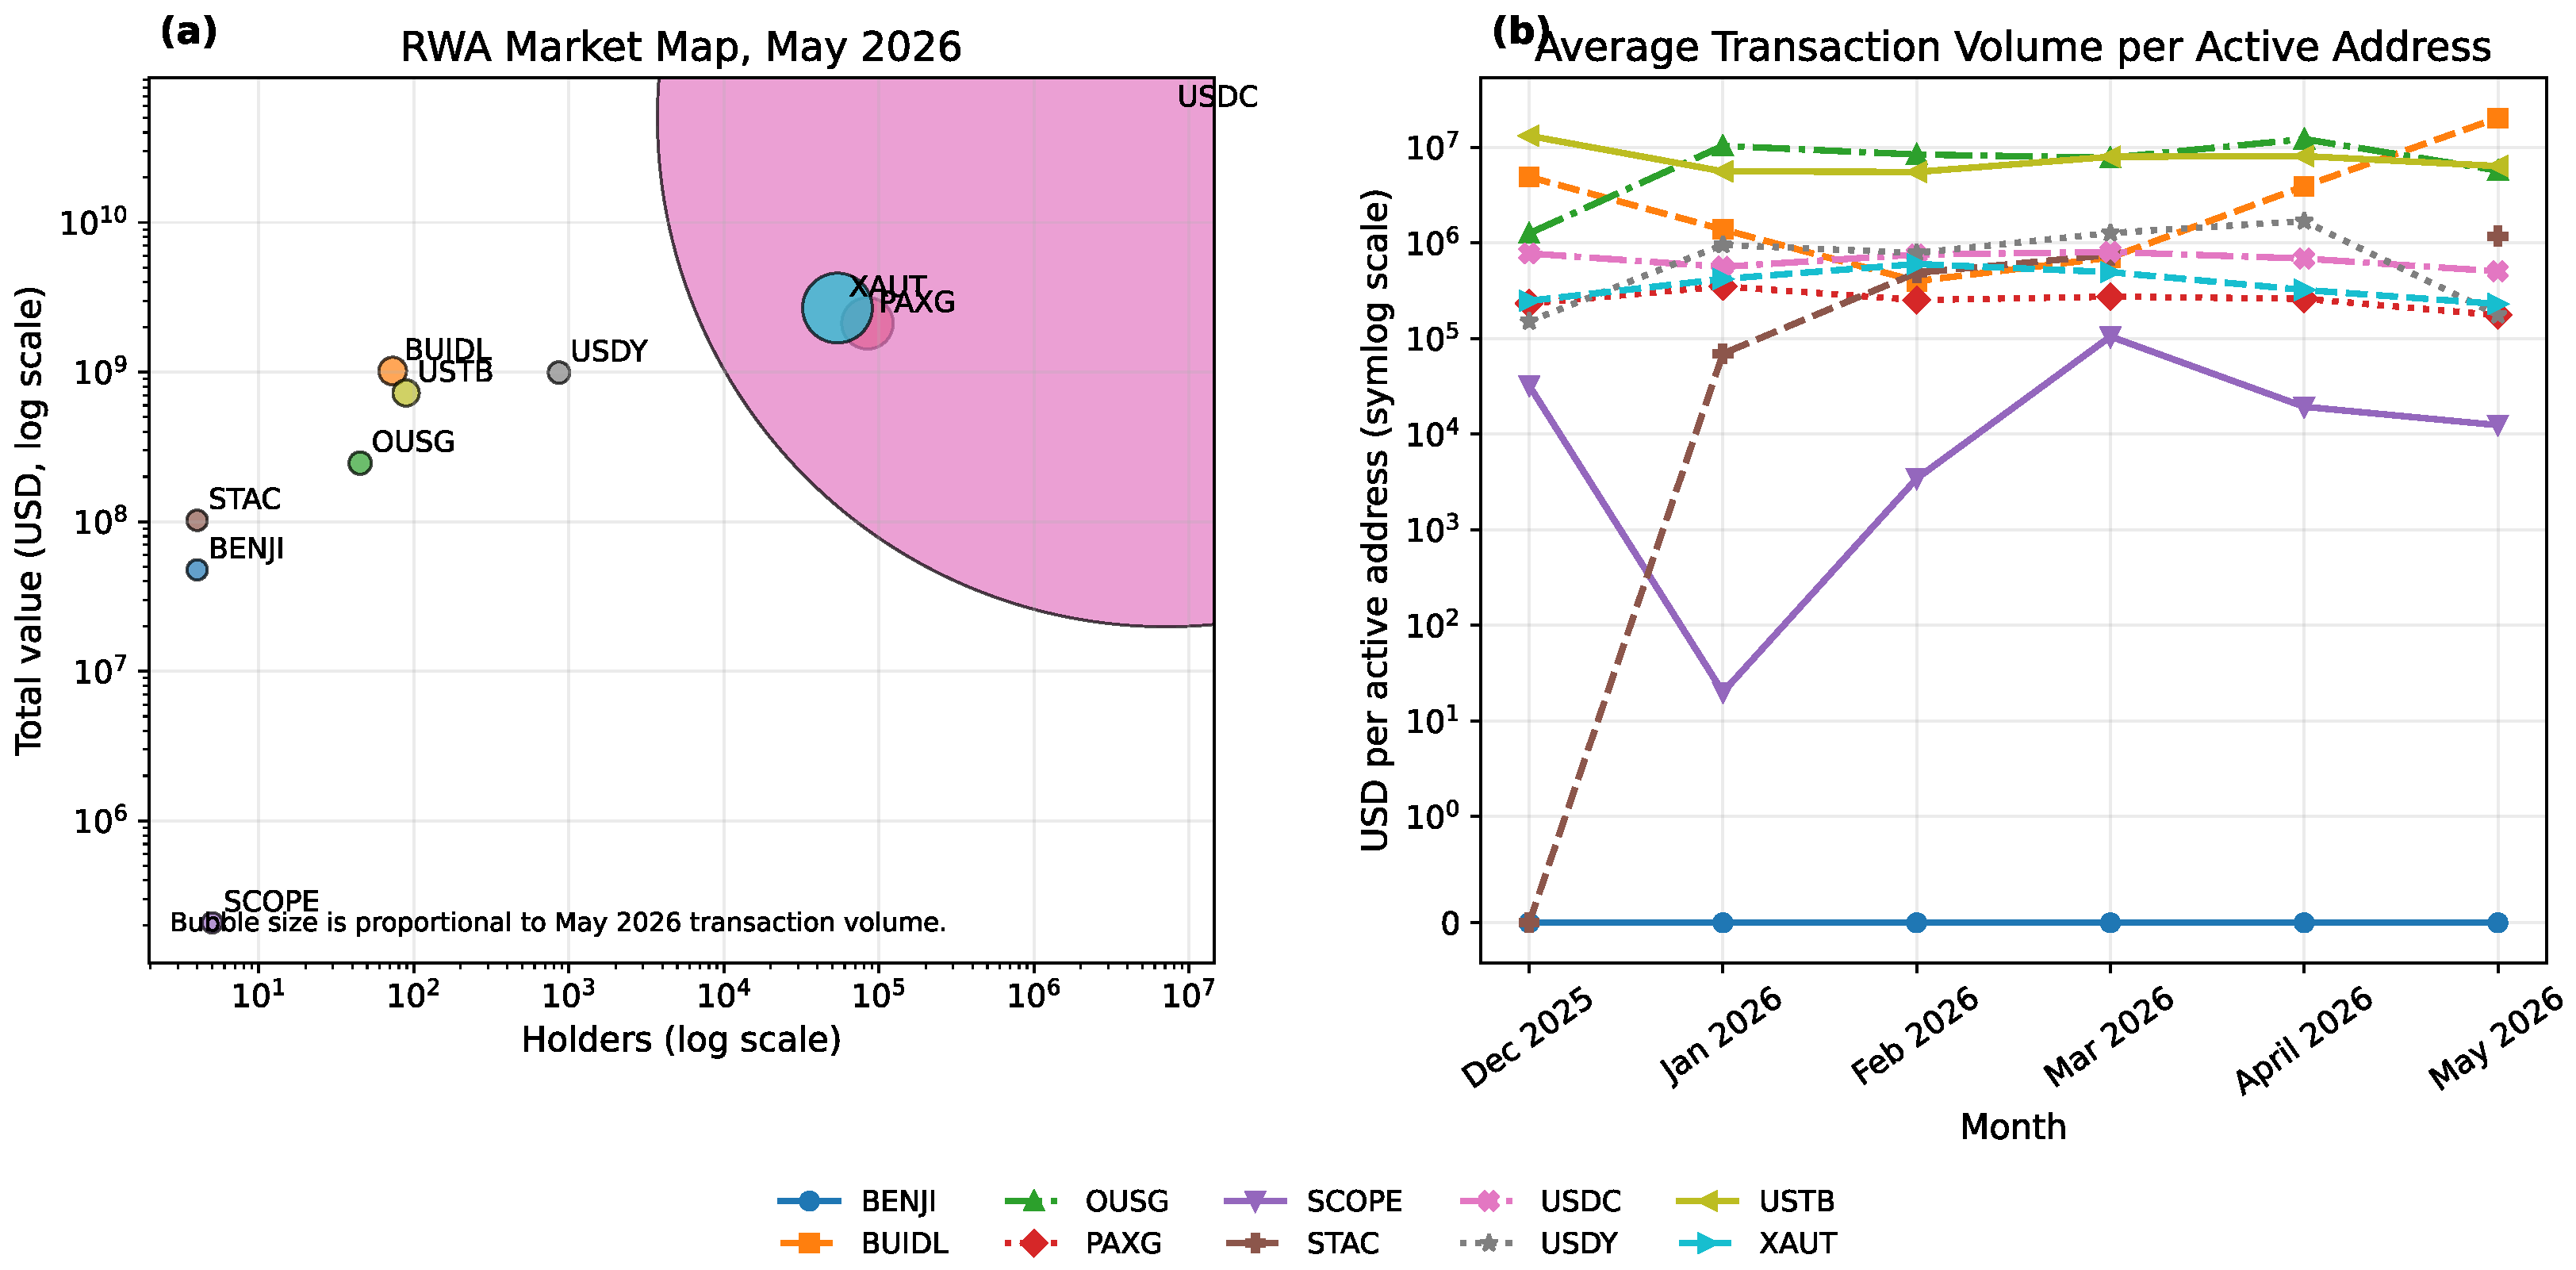
Descriptive evidence is summarized in
Figure 1,
Figure 2 and
Figure 3. Taken together, these figures compare market scale, transfer activity, turnover intensity, participation breadth, and transaction intensity across the sampled tokenized real-world assets.
Figure 1 shows that total asset value differs sharply across assets, with USDC included only as a stablecoin benchmark for scale and market activity. The comparison between asset value and transaction volume indicates that a larger asset base does not necessarily correspond to stronger on-chain activity.
Figure 2 strengthens this interpretation by showing that turnover and active participation vary substantially across tokens so that some products with meaningful asset value remain comparatively inactive. Finally,
Figure 3 highlights cross-sectional differences in market structure and transaction intensity. The market map identifies variation in size and holder breadth, while the right panel reports average transaction volume per active address, which should be interpreted as activity intensity rather than as a direct concentration measure.
4.1. Descriptive Evidence from the Token–Month Panel
The token–month panel reveals substantial heterogeneity across the sampled RWA tokens. As shown in
Figure 1 and
Figure 2, gold-backed tokens such as PAXG and XAUT combine broader holder bases with stronger recurring on-chain activity than most Treasury and private-credit-related tokens. By contrast, BENJI and STAC display very weak turnover in several months despite maintaining non-trivial asset value, while BUIDL combines relatively large scale with more modest participation breadth and uneven activity intensity. These patterns are consistent with a market structure in which some institutional-grade Treasury and credit products function primarily as issuance, yield, or treasury management instruments rather than actively traded assets.
Figure 3 provides a complementary cross-sectional view. The right panel indicates that average transaction volume per active address differs materially across assets and over time. This should be interpreted as transaction intensity among active participants, not as a formal concentration measure. Together, these figures reinforce this paper’s main descriptive point that tokenized asset value and observed liquidity are distinct dimensions.
Table 2 summarizes the distribution of the core empirical variables. The results show wide dispersion across the token–month panel. Log turnover has a mean of −1.667, a median of −1.184, and the largest relative spread, ranging from −8.782 to 1.165, indicating that observed liquidity varies sharply across token–month observations. Log active addresses is also highly dispersed, with a mean of 3.994, a median of 2.944, and a range from 0.000 to 9.827, suggesting substantial differences in participation breadth across tokens and months. The variation in log size, which ranges from 12.247 to 21.807, and in log holders, which ranges from 1.099 to 11.340, further shows that the sample includes both very small and very large assets with markedly different ownership profiles.
Taken together, these descriptive patterns support the central argument of this paper in an exploratory sense. Tokenization does not automatically translate into active secondary market liquidity. Instead, the panel shows that liquidity conditions differ markedly across token types, with gold-backed tokens occupying the strongest observed position, Treasury tokens displaying an intermediate but internally diverse profile, and private-credit-related tokens remaining the weakest overall.
4.2. Group Differences in Observed Liquidity
Table 3 reports the baseline non-parametric tests of observed liquidity across asset classes. The results indicate strong cross-category heterogeneity. The Kruskal–Wallis tests reject equality across asset classes for both log turnover and log active addresses at the 1% level. Substantively, this result is consistent with the descriptive evidence that gold-backed tokens, especially PAXG and XAUT, display stronger observed liquidity than Treasury and private-credit-related assets. Gold-backed tokens combine broader holder participation with greater recurring on-chain activity, whereas several Treasury and credit-linked tokens exhibit weaker participation and lower turnover despite their sometimes large outstanding asset values.
4.3. Panel Evidence on Liquidity Determinants
Table 4 reports baseline panel regressions using the available token–month observations from the Ethereum-based RWA sample. Model (1) uses log turnover as the main proxy for observed liquidity, while Model (2) uses an active month indicator equal to one when transfer volume is positive. Both models include asset class and month fixed effects in order to account for broad category differences and common monthly shocks. The active month model should be interpreted only as a model of activity incidence, not liquidity strength, because any positive transfer volume is treated equally regardless of magnitude.
Within this small exploratory panel, the results are consistent with a positive association between holder breadth and the presence of monthly activity. In Model (2), the coefficient on log holders is positive and statistically significant at the 1% level, indicating that tokens with broader participation are more likely to remain active over time. By contrast, log size is not statistically significant in either specification, suggesting that larger asset value alone does not guarantee stronger observed liquidity once asset class and month effects are taken into account.
Relative to the omitted gold category, both Treasury and private credit tokens exhibit significantly lower turnover in Model (1), which is consistent with the descriptive evidence that gold-backed tokens such as PAXG and XAUT display stronger on-chain liquidity profiles. In Model (2), the positive coefficients on Treasury and private credit should be interpreted more cautiously, because the binary active month specification captures whether any monthly transfer activity occurs rather than the intensity of that activity. Taken together, the regressions suggest that participation breadth is more closely associated with persistent observed activity than sheer size, while asset class differences remain central to observed liquidity outcomes. Given the short panel and limited covariate set, these results should be interpreted as exploratory associations rather than as definitive estimates.
Table 5 reports three robustness checks based on alternative specifications and sample restrictions. Column (1) replaces asset class fixed effects with token fixed effects in the log turnover regression. In this specification, the coefficients on log size and log holders remain statistically insignificant, suggesting that the baseline turnover results are not driven solely by stable cross-token differences. Because token fixed effects absorb all time-invariant token characteristics, asset class coefficients are not separately identified in this column.
Column (2) excludes the two gold-backed tokens, PAXG and XAUT, which are the most liquid assets in the sample. In this restricted specification, the Treasury coefficient remains positive and statistically significant relative to the omitted private credit category. This indicates that Treasury tokens continue to exhibit stronger turnover than thinner credit-linked assets even after the unusually liquid gold-backed tokens are removed from the sample.
Column (3) uses the log active ratio, defined as the natural logarithm of active addresses divided by holders, as an alternative proxy for observed liquidity. In this specification, the coefficient on private credit is positive and statistically significant relative to the omitted gold category, while the Treasury coefficient is small and statistically insignificant. This result suggests that participation intensity relative to the holder base captures a different dimension of market activity than turnover. In other words, a token category may appear weak in turnover terms while still showing comparatively high activity relative to its ownership base. Taken together, the robustness checks suggest that the main conclusions are reasonably stable, although the short sample, the small number of tokens, and the limited set of consistently observable covariates mean that these results should still be interpreted cautiously and in an exploratory sense.
4.4. Interpretation of Main Empirical Findings
The empirical results provide preliminary support for all three hypotheses, although the strength of the evidence differs across them.
First, the results provide support for H1, which states that observed liquidity differs across tokenized RWA asset classes. The descriptive analysis, the Kruskal–Wallis tests in
Table 3, and the baseline regressions in
Table 4 all point in the same direction. Gold-backed tokens, particularly PAXG and XAUT, occupy the strongest observed liquidity position in the sample. They combine broader holder bases, larger active address counts, and higher turnover than most Treasury and private-credit-related tokens. By contrast, several Treasury and private-credit-related assets remain much thinner despite their sometimes substantial asset value. This result suggests that token category is not merely a background classification but an economically meaningful dimension of observed liquidity outcomes within the sample.
Second, the results provide support for H2, which states that tokens with broader holder bases exhibit higher observed liquidity. In the baseline panel regressions, log holders is positive and statistically significant in the active month specification, indicating that tokens with broader participation are more likely to record non-zero monthly activity. Although the holder variable is not statistically significant in every turnover-based specification, the overall pattern still suggests that participation breadth matters for whether a token remains active over time. This finding is also consistent with the descriptive evidence that the most liquid tokens in the sample tend to have the broadest ownership base.
Third, the results are consistent with H3, which states that larger tokens do not necessarily exhibit higher observed liquidity once participation breadth and asset class differences are taken into account. Across the baseline and robustness regressions, log size is not statistically significant. This is a useful result for interpreting tokenized RWA markets because it separates issuance scale from liquidity intensity. A token may have a large outstanding asset value and still display weak turnover or limited recurring activity. In the present sample, size alone is therefore not a reliable indicator of observed liquidity.
Taken together, these findings provide exploratory support for this paper’s central argument that tokenization and liquidity should not be treated as synonymous within tokenized RWA markets. The ability to issue an asset on chain does not automatically produce active secondary market use. Instead, the evidence suggests that observed liquidity depends more on participation breadth and asset type than on raw scale alone. In practical terms, this means that the development of tokenized markets should not be judged only by growth in outstanding value but also by whether tokens become meaningfully tradable after issuance.
These results should be interpreted as evidence of liquidity differences and correlates within tokenized RWA markets, not as a direct causal test of whether tokenization itself increases liquidity relative to non-tokenized alternatives. Given the short time horizon and focused sample design, the findings are best understood as preliminary empirical evidence rather than as broad or definitive conclusions about the full RWA universe.
5. Conclusions
This paper examines observed liquidity within tokenized real-world asset markets rather than the causal effect of tokenization relative to non-tokenized assets. Based on the descriptive, non-parametric, and exploratory panel evidence from the Ethereum-based token–month panel used in this paper, the results provide preliminary evidence that liquidity varies substantially across tokenized RWA categories and token characteristics. In particular, tokenization should not be treated as synonymous with observed secondary market liquidity.
This paper contributes by operationalizing observed RWA liquidity through publicly observable on-chain proxies and by linking those proxies to token characteristics. The central empirical insight is that large outstanding asset value does not, by itself, demonstrate liquid secondary markets. In the observed dataset from December 2025 to May 2026, gold-backed tokens such as PAXG and XAUT display the strongest observed liquidity, combining broader holder participation with higher turnover and more persistent activity. By contrast, several Treasury and private-credit-related tokens exhibit weaker and more uneven liquidity despite sometimes substantial asset value. The results therefore suggest that participation breadth and asset category are more closely associated with observed liquidity outcomes than raw scale alone.
This study has several limitations. The dataset is restricted to nine Ethereum-based non-stablecoin RWA tokens, with USDC retained only as a benchmark, observed over a relatively short six-month period. This focused design improves comparability across tokens and categories, but it also means that the resulting evidence should be interpreted as coming from a purposive exploratory sample rather than from a comprehensive representation of the broader tokenized RWA market. In addition, the available dataset is limited to four core variables: total asset value, holder count, transfer volume, and active addresses.
These limitations also define the next research agenda. Longer token histories would support stronger panel designs and allow for a more credible analysis of liquidity persistence and changes over time. Broader token coverage across multiple chains would help determine whether the patterns documented here generalize beyond the Ethereum-based sample. Richer data on transferability rules, redemption rights, ownership concentration, and trading venues would also enable a more complete modeling of liquidity determinants. Even so, the present study points to a consistent implication: tokenization changes the form of ownership, but observed liquidity within tokenized markets depends on additional conditions related to participation breadth, accessibility, and market design. The evidence therefore supports a more limited but still important claim that tokenizing assets should not by itself be interpreted as evidence of a liquid secondary market.