1. Introduction
In recent years, artificial intelligence (AI) has rapidly evolved into one of the most influential technological forces shaping modern financial markets. Advances in machine learning, large language models, and generative AI have not only increased the economic relevance of technology firms but also reshaped how investors allocate capital and form expectations about future productivity. As a result, AI-related equities are becoming increasingly central to global financial systems.
A particularly notable turning point occurred with the public release of ChatGPT by OpenAI on 30 November 2022. This event is widely regarded as a major breakthrough in generative AI and triggered a sharp increase in global attention toward AI technologies. More recent developments, including advanced AI systems such as large-scale coding and reasoning models, further highlight the rapid and ongoing evolution of this technological domain. Financial markets reacted quickly to these developments, with AI-related firms experiencing substantial increases in valuation, trading activity, and investor attention.
From an economic perspective, the impact of AI on financial markets can be understood through several channels. First, AI-driven innovation may directly affect firm-level fundamentals, particularly in sectors such as semiconductors, cloud computing, and digital platforms. Second, technological breakthroughs may influence investor attention, accelerating the diffusion of information across markets. This perspective is consistent with a growing literature emphasizing the role of attention and information frictions in financial markets (e.g., [
1,
2]). It is also closely related to the literature linking news and market volatility (e.g., [
3]). Third, these developments may alter the structure of financial interconnectedness by changing how shocks are transmitted across asset classes.
A large body of literature has examined financial market connectedness using spillover-based approaches. The framework proposed by [
4,
5,
6] has become a standard tool for measuring the transmission of shocks across markets. Subsequent studies have extended this framework in several directions, including frequency-domain analysis ([
7]), time-varying parameter models ([
8]), and applications to a wide range of asset classes such as equities, commodities, and cryptocurrencies (e.g., [
9,
10,
11]).
Despite these advances, empirical evidence on how the recent wave of generative AI has affected cross-market spillovers remains limited. In particular, while the literature has extensively studied financial connectedness across asset classes, it is still unclear whether AI-driven technological shocks lead to a general intensification of financial linkages or instead reshape the structure and direction of spillovers in more subtle ways.
To guide the empirical analysis, we adopt a conceptual framework that captures four key channels of financial transmission: (i) AI-driven technological innovation, proxied by major AI-related equities; (ii) aggregate market conditions, represented by the S&P 500 index; (iii) speculative and decentralized financial activity, captured by cryptocurrencies, which is consistent with recent studies on decentralized financial systems (e.g., [
12]); and (iv) macroeconomic fundamentals, proxied by gold and crude oil prices.
Using daily data from January 2021 to December 2025, we analyze spillover dynamics among these asset classes within a time-varying parameter vector autoregression (TVP-VAR) framework. We use the release of ChatGPT as a reference point to compare market dynamics before and after the emergence of generative AI.
Our findings suggest that the impact of AI on financial markets is better characterized as a structural transformation rather than a simple increase in connectedness. While the overall level of connectedness declines modestly following the emergence of generative AI, the roles played by different assets change substantially over time, leading to a more dispersed configuration of financial linkages. These results are robust to alternative model specifications, including different lag lengths and forecast horizons.
This paper contributes to the literature in three ways. First, it provides new empirical evidence on the relationship between AI and financial market connectedness. Second, it introduces a conceptual framework linking technological innovation to cross-market spillovers. Third, it highlights the importance of analyzing not only the magnitude but also the structure of financial interconnectedness in the presence of technological change.
2. Data
2.1. Data Description
This study examines the connectedness among artificial intelligence (AI)-related equities, cryptocurrencies, and traditional financial assets. The selection of assets is guided by a conceptual framework that captures key channels through which financial shocks may propagate in the context of technological innovation.
Specifically, we classify assets into four groups. First, AI-related equities represent the technological innovation channel. These firms are directly involved in the development and commercialization of AI technologies and are therefore expected to serve as primary sources of technology-driven shocks. The selected companies—NVIDIA, Microsoft, Alphabet, Meta Platforms, and Advanced Micro Devices—play central roles in semiconductor production, cloud computing, and large-scale AI infrastructure.
Second, the S&P 500 index is included to capture aggregate market conditions. As a broad measure of equity market performance, it reflects macro-financial dynamics and serves as a benchmark for overall market sentiment.
Third, cryptocurrencies, represented by Bitcoin and Ethereum, are included to capture speculative and decentralized financial activity. These markets are characterized by high volatility and strong sensitivity to technological narratives, making them relevant in the context of AI-driven innovation.
Fourth, gold and crude oil (WTI) are used as proxies for macroeconomic fundamentals. Gold is commonly viewed as a safe-haven asset, while crude oil reflects global economic activity and supply-demand conditions.
This classification allows us to construct a parsimonious yet economically meaningful system that captures interactions between AI-driven sectors and the broader financial environment.
We acknowledge that other important asset classes, such as government bonds and foreign exchange markets, are not included in the analysis. This choice is primarily motivated by the need to maintain tractability within the TVP-VAR framework and to avoid over-parameterization, which could reduce estimation reliability. Nevertheless, the selected asset set captures key dimensions of financial interconnectedness relevant to the research question.
The data are obtained from publicly available sources, including Yahoo Finance. Daily continuously compounded returns are calculated as the log differences of closing prices.
Since trading calendars differ across asset classes, particularly between cryptocurrency markets (which trade continuously) and traditional financial markets, observations are aligned using the intersection of available trading days. Specifically, dates with missing values are excluded, and the analysis is conducted using only the dates for which all assets have available data.
This approach ensures consistency in the estimation of the VAR system, although it may reduce the effective sample size. As a robustness consideration, alternative synchronization schemes are discussed in the supplementary analysis.
2.2. Sample Period
The sample period runs from 1 January 2021 to 31 December 2025. This timeframe was chosen with a few practical considerations in mind. Most importantly, starting in 2021 allows us to sidestep the unusually volatile market conditions observed during the COVID-19 shock in 2020, which could otherwise distort the analysis.
In addition, this period offers a relatively stable baseline before the widespread adoption of generative AI technologies began to meaningfully influence financial markets. At the same time, it still captures the more recent rise in investor interest in AI-related firms, along with the growing links between technology stocks, cryptocurrencies, and traditional asset classes.
Using daily data over this period also makes it possible to track short-term movements and better understand how spillovers across markets evolve over time, rather than relying only on more aggregated trends.
2.3. ChatGPT Event Definition
To investigate the potential impact of technological breakthroughs in artificial intelligence on financial market connectedness, we focus on the public release of ChatGPT on 30 November 2022 as a key technological event. The introduction of ChatGPT marked a major milestone in the development and adoption of generative AI technologies and triggered a sharp increase in global interest in artificial intelligence.
Following this event, AI-related firms experienced substantial increases in market attention, investment flows, and stock market valuations. As a result, the launch of ChatGPT is widely regarded as a turning point in the global AI boom.
Based on this technological milestone, the sample is divided into two subperiods:
This event-based framework allows us to examine whether the emergence of generative AI technologies has altered the spillover dynamics among AI-related equities, cryptocurrencies, and global financial assets.
3. Econometric Methodology
3.1. Vector Autoregression
Our empirical analysis follows the connectedness framework proposed by [
4,
5,
6], which measures spillover effects across financial markets based on forecast error variance decompositions derived from vector autoregressive (VAR) models. This methodology has been widely adopted in the literature to analyze systemic risk and financial market interconnectedness.
To capture the evolving structure of financial market interactions, we employ the time-varying parameter VAR (TVP-VAR) approach, which allows model parameters to change over time and provides a flexible framework for analyzing dynamic spillovers among financial assets.
To analyze the dynamic interactions among AI-related equities, cryptocurrencies, and traditional financial assets, we employ a vector autoregression (VAR) framework.
Let denote an vector of asset returns at time t.
The VAR(
p) model is defined as
where
(
) are coefficient matrices and
is a vector of error terms with zero mean and covariance matrix
.
The VAR can be rewritten in moving average form as
where
represents the impulse response coefficient matrices.
3.2. Forecast Error Variance Decomposition
To measure spillover effects across markets, we employ the generalized forecast error variance decomposition (FEVD) proposed by Pesaran and Shin [
13]. The
H-step-ahead forecast error variance decomposition is defined as
where
denotes a selection vector with one in the
i-th position and zeros elsewhere,
represents the impulse response coefficient matrices at horizon
h, and
is the variance–covariance matrix of the error terms. The term
denotes the
j-th diagonal element of
.
The element measures the contribution of shocks in variable j to the H-step-ahead forecast error variance of variable i, thereby capturing the extent to which shocks are transmitted across markets.
Since the rows of the variance decomposition matrix do not necessarily sum to one, the entries are normalized as follows:
This normalization ensures that the contributions of shocks across all variables sum to unity for each i, facilitating the interpretation of spillover effects.
3.3. Connectedness Measures
Based on the normalized variance decomposition, we construct several connectedness measures following Diebold and Yilmaz.
The total connectedness index (TCI) is defined as
The TCI summarizes the average contribution of spillovers across all markets and provides an overall measure of financial interconnectedness.
Directional spillovers transmitted from market
i to all other markets are given by
Directional spillovers received by market
i from all other markets are defined as
The measure captures the extent to which market i transmits shocks to other markets, while measures the shocks received by market i from the rest of the system.
Finally, the net spillover for market
i is defined as
The net spillover indicates whether a given market acts as a net transmitter or a net receiver of shocks. A positive value implies that the market predominantly transmits shocks to others, whereas a negative value indicates that it primarily receives shocks from other markets.
3.4. Time-Varying Connectedness
Recent studies increasingly employ time-varying connectedness approaches to analyze dynamic spillovers and evolving network structures in financial markets (e.g., [
8,
14,
15]). This approach is particularly suitable for capturing gradual structural changes in financial markets driven by technological innovation.
To capture the evolving structure of financial market interactions, we employ a time-varying parameter vector autoregression (TVP-VAR) model. Unlike the standard VAR model with fixed coefficients, the TVP-VAR framework allows the parameters to change over time, thereby accommodating potential structural shifts in financial market dynamics.
The TVP-VAR (
p) model can be written as
where
is an
vector of asset returns,
(
) are time-varying coefficient matrices, and
is a vector of error terms with a time-varying variance–covariance matrix
.
The model can be expressed in state-space form. The observation equation is given by
where
is a vector stacking the time-varying coefficients, and
is a matrix of lagged variables.
The state equation describes the evolution of the coefficients:
where
represents the innovations to the state vector, and
Q is the covariance matrix governing the degree of time variation.
The TVP-VAR model is estimated using the Kalman filter, which recursively updates the coefficient estimates as new information becomes available. This approach allows for flexible modeling of gradual structural changes in the relationships among financial assets. Following recent literature on time-varying connectedness based on TVP-VAR models (e.g., [
8,
14]), the TVP-VAR framework avoids the arbitrary choice of rolling window size required in traditional rolling-window VAR approaches, thereby providing a more flexible and data-driven representation of time variation.
Compared with rolling-window VAR models, which assume constant parameters within each window and require an exogenous choice of window length, the TVP-VAR approach models parameter changes continuously over time. This feature is particularly important in our context, as the impact of technological innovations such as generative AI is likely to evolve gradually rather than through discrete structural breaks. As a result, the TVP-VAR framework provides a more suitable representation of dynamic spillover processes in the presence of evolving market conditions.
Based on the estimated time-varying parameters, we compute the dynamic impulse response functions and the corresponding time-varying forecast error variance decompositions. These are then used to construct time-varying connectedness measures, enabling us to track the evolution of spillovers across markets over time.
From an economic perspective, the TVP-VAR framework captures changes in the transmission of shocks that may arise from technological innovation, shifts in investor behavior, or evolving market conditions. In particular, it allows us to assess whether the emergence of generative AI is associated with changes in the structure of financial interconnectedness rather than assuming a constant relationship over the sample period.
4. Empirical Results
4.1. Static Connectedness
Table 1 reports the static connectedness measures based on the full sample. The total connectedness index (TCI) is estimated at 55.75%, indicating a substantial degree of spillovers across AI-related equities, cryptocurrencies, and traditional financial assets. This result suggests that more than half of the forecast error variance is explained by cross-market shocks, highlighting the strong interconnectedness of global financial markets.
The directional spillover measures reveal substantial heterogeneity across asset classes. The S&P 500 index emerges as the dominant transmitter of shocks, with a net spillover of 22.32, indicating its central role in propagating shocks across markets. Among AI-related equities, Microsoft (NET = 6.32), NVIDIA (NET = 5.05), Alphabet (NET = 1.32), and AMD (NET = 2.08) act as net transmitters of shocks, suggesting that major technology firms play an important role in driving financial market spillovers. In contrast, Meta Platforms (NET = −6.82) is identified as a net receiver, indicating a more passive role in the spillover network.
Cryptocurrencies, including Bitcoin (NET = −6.59) and Ethereum (NET = −6.36), are also identified as net receivers of shocks, suggesting that digital asset markets are influenced by developments in equity markets, particularly those related to AI-driven firms. Traditional assets such as gold (NET = −11.42) and crude oil (NET = −5.89) exhibit strong receiver behavior, indicating that these markets primarily absorb shocks from other financial assets rather than transmit them.
Overall, these results indicate that financial spillovers are primarily driven by equity markets, particularly AI-related firms and broad market indices, while cryptocurrencies and traditional assets tend to absorb shocks from other markets.
4.2. Total Connectedness Dynamics
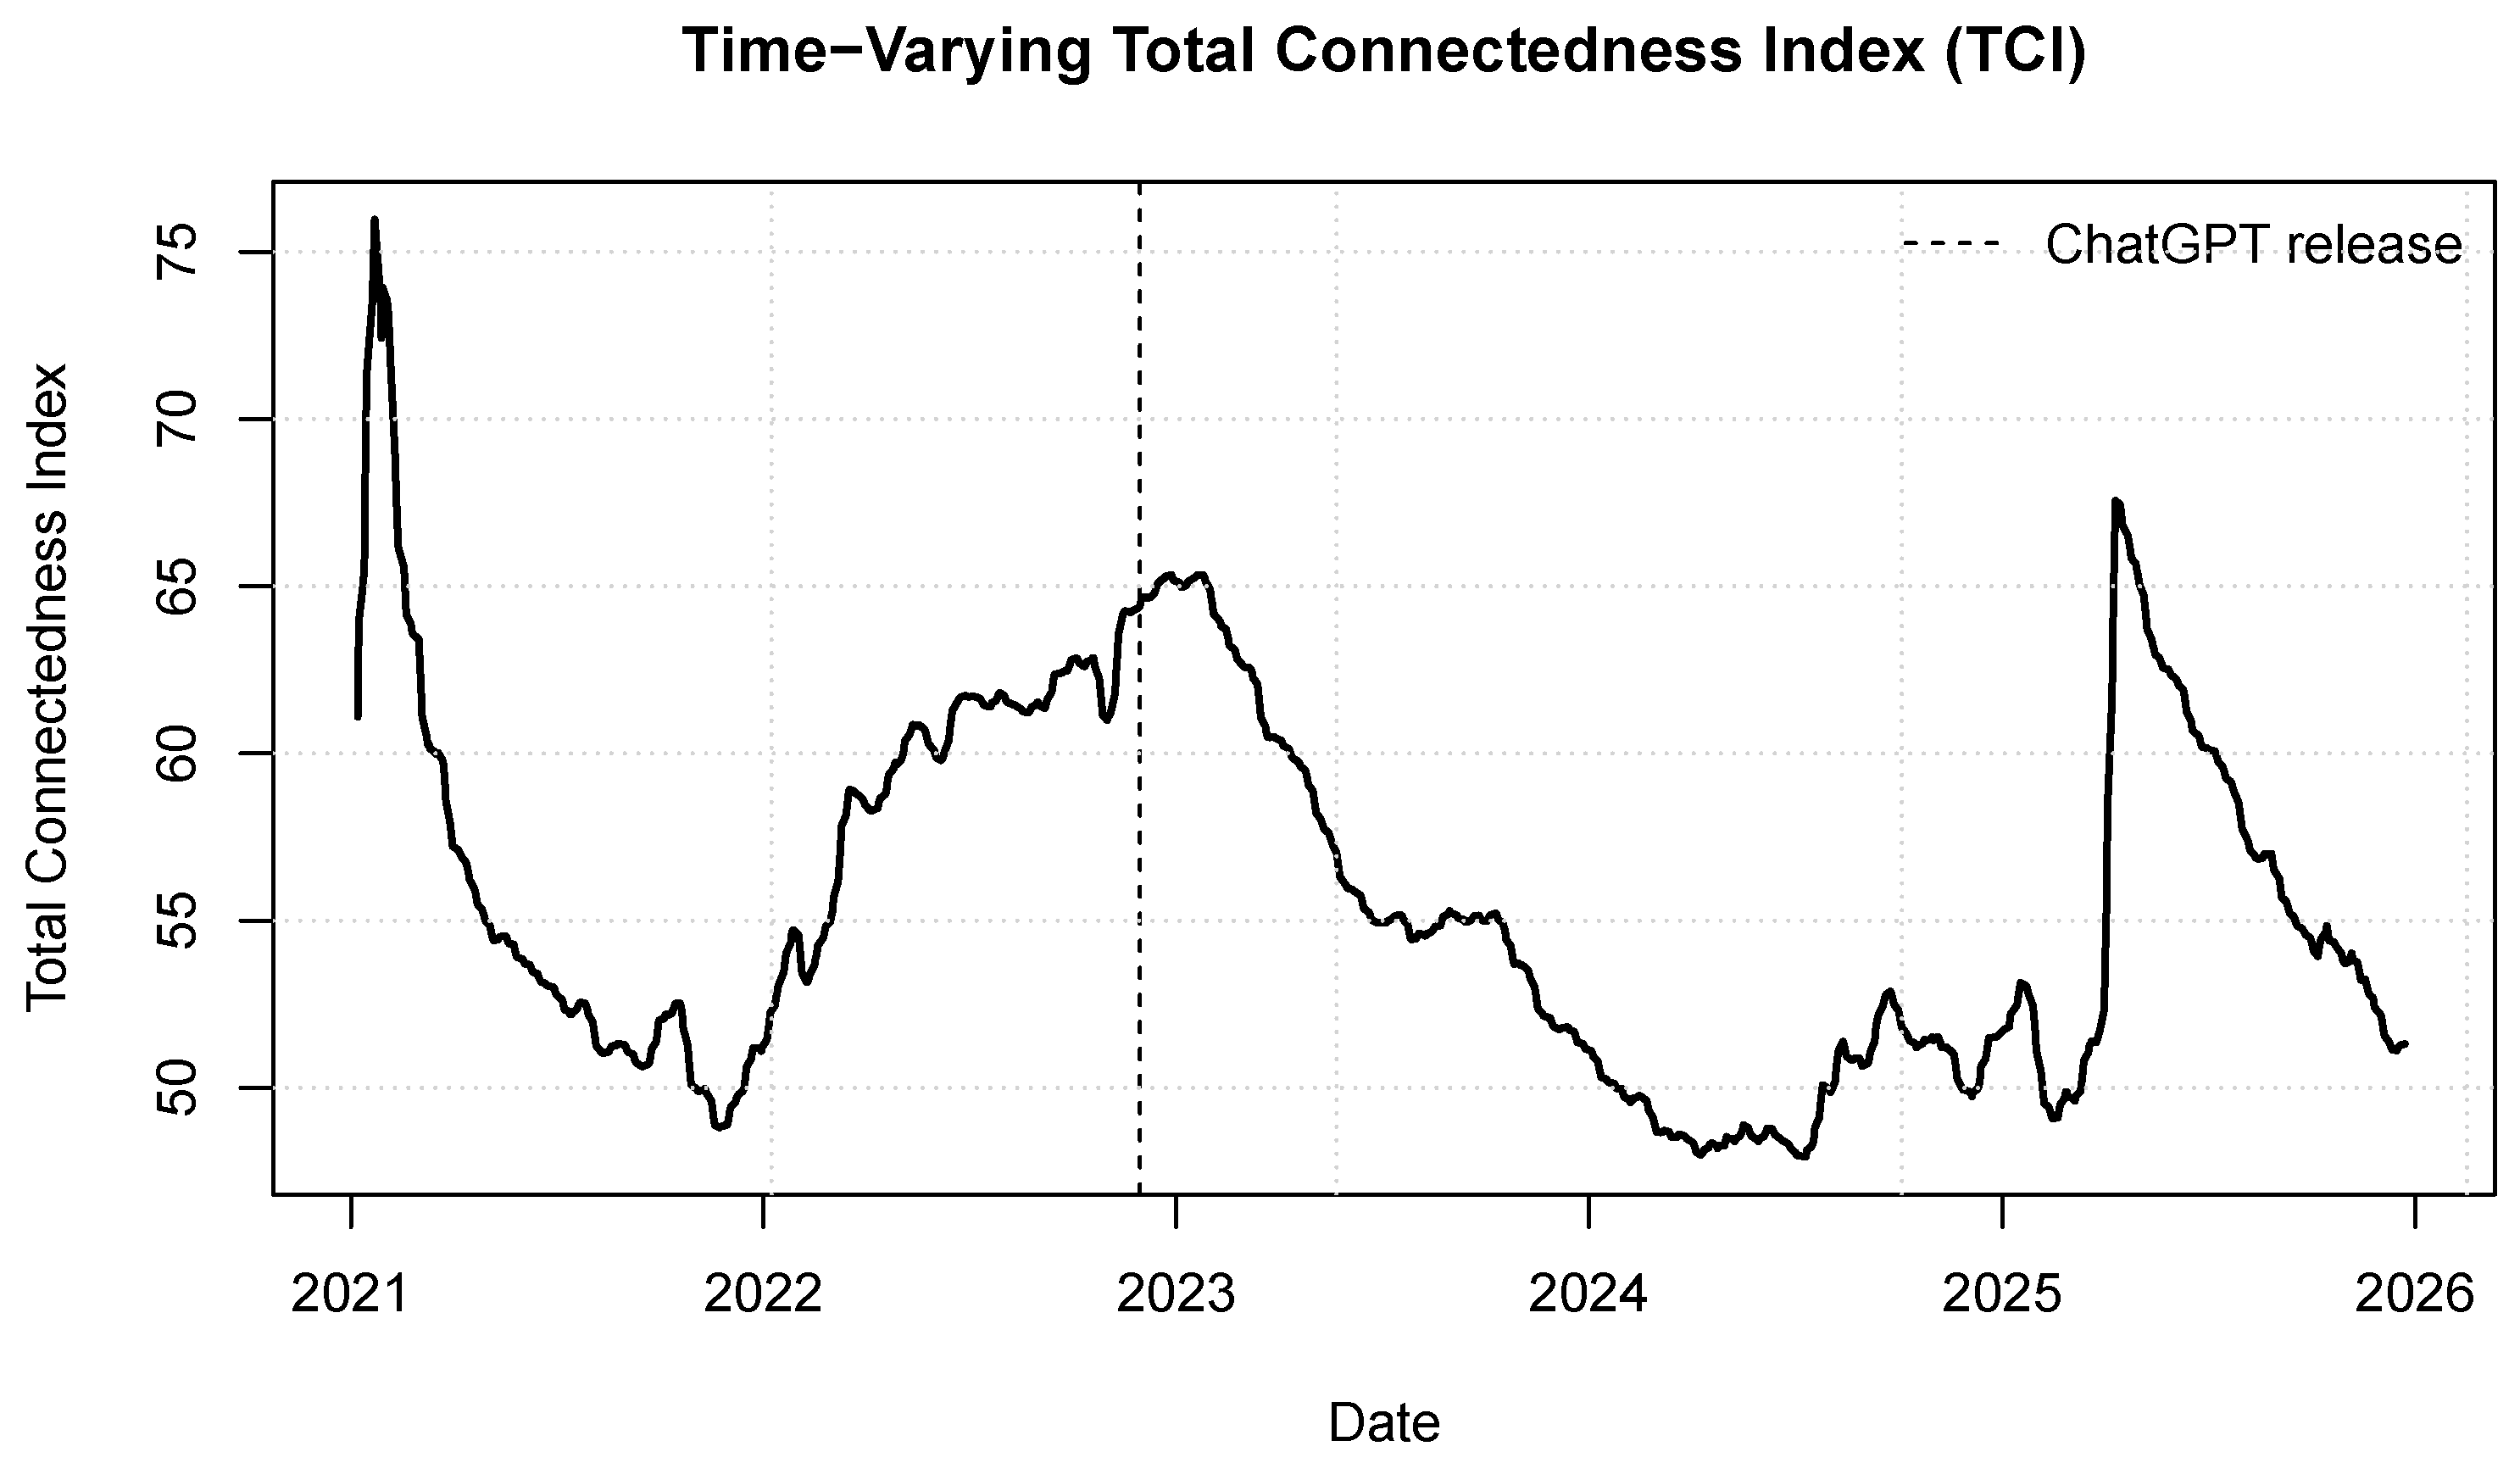
Figure 1 presents the time-varying total connectedness index. The results reveal substantial variation in financial market connectedness over time. In particular, the TCI increases around the period of major technological developments, including the release of ChatGPT in November 2022, but does not exhibit a sustained upward trend thereafter.
Instead, the connectedness appears to stabilize and slightly decline in the later part of the sample period. This pattern suggests that the initial surge in financial interconnectedness may be driven by heightened investor attention and rapid information diffusion following major technological breakthroughs. As markets gradually incorporate this information, the intensity of spillovers becomes more moderate.
These findings highlight the dynamic nature of financial connectedness and suggest that the impact of artificial intelligence on financial markets may involve a temporary amplification of spillovers followed by a phase of stabilization.
4.3. Directional Spillovers
To further understand the transmission mechanisms of financial shocks, we examine directional spillovers, which capture how much each asset transmits to and receives from other markets.
The results indicate that equity markets, particularly the S&P 500 and major AI-related firms, serve as the primary transmitters of shocks to other assets. In contrast, cryptocurrencies and traditional assets tend to receive shocks from other markets. This asymmetry suggests that financial spillovers are primarily driven by developments in equity markets, especially those associated with technological innovation.
4.4. Net Spillovers
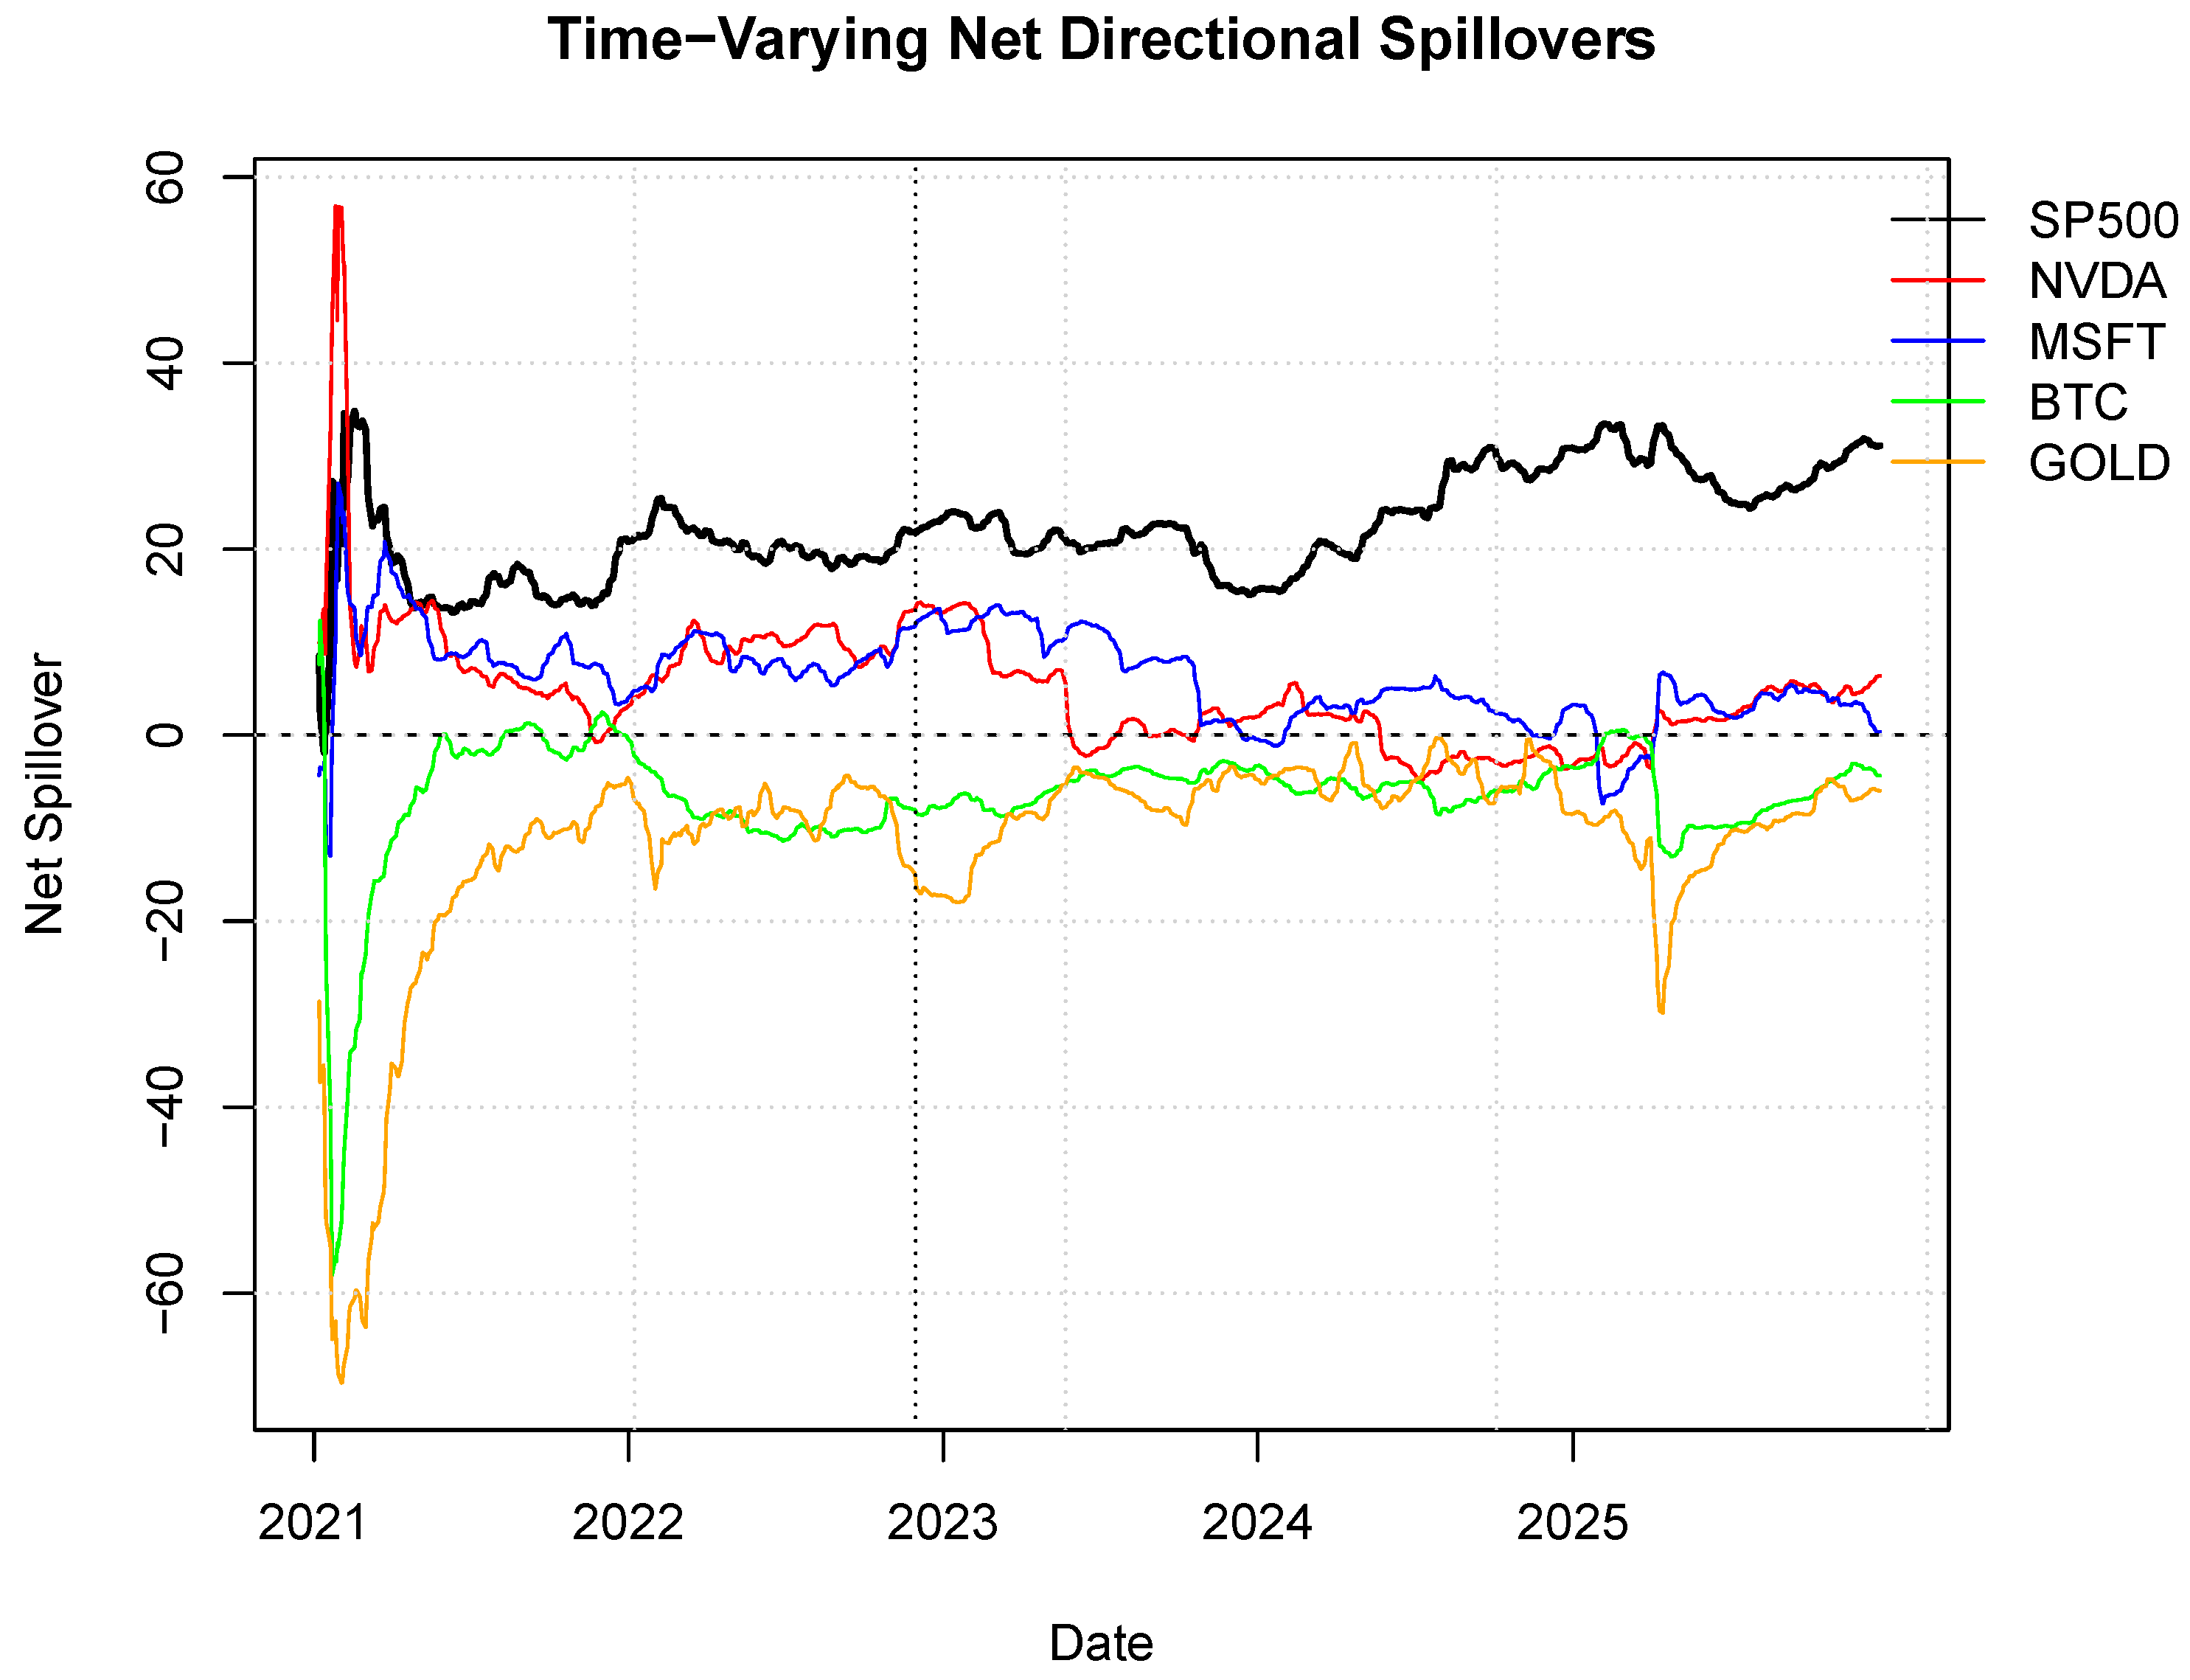
Figure 2 presents the net spillover indices, which summarize the difference between transmitted and received spillovers for each asset. The figure reports a subset of representative assets to highlight the main patterns of net spillovers across different asset classes.
The results indicate that the S&P 500 acts as the dominant transmitter of shocks over time. Among AI-related equities, Microsoft and NVIDIA tend to exhibit positive net spillovers, indicating their important role in driving financial market dynamics, although their magnitudes vary over time. In contrast, cryptocurrencies such as Bitcoin and Ethereum, as well as traditional assets including gold and oil, generally behave as net receivers of shocks.
These findings highlight the asymmetric structure of financial connectedness and underscore the role of AI-related equities as key sources of financial spillovers, while cryptocurrencies and traditional assets primarily absorb shocks from other markets.
4.5. Pre- and Post-ChatGPT Analysis
To further examine the impact of the emergence of generative artificial intelligence, we compare connectedness measures before and after the release of ChatGPT on 30 November 2022.
The results indicate that the total connectedness index decreases from 57.42% in the pre-ChatGPT period to 54.69% in the post-ChatGPT period, suggesting a modest decline in the overall level of spillovers across financial markets.
However, a closer examination of the spillover structure reveals substantial changes in the roles of individual assets. In the pre-ChatGPT period, AI-related equities such as NVIDIA (NET = 9.62), Microsoft (NET = 8.77), and Alphabet (NET = 6.43) act as net transmitters of shocks. In contrast, in the post-ChatGPT period, the transmitter role of these firms weakens considerably. For example, NVIDIA’s net spillover declines to 2.16, primarily driven by a reduction in its transmitted spillovers. Similarly, Alphabet shifts from a net transmitter to a net receiver (NET = −1.92), indicating a structural change in its role within the spillover network.
At the same time, the S&P 500 remains the dominant transmitter of shocks in both periods, with its net spillover increasing from 18.84 to 24.52. Cryptocurrencies and traditional assets such as gold and oil continue to behave as net receivers of shocks, although their dependence on other markets becomes somewhat less pronounced in the post-ChatGPT period.
These findings suggest that the emergence of generative artificial intelligence has reshaped the structure of financial connectedness rather than simply increasing the overall level of spillovers. In particular, the influence of AI-related equities as dominant transmitters appears to have weakened in the later period, suggesting a shift toward a more diversified spillover structure across global financial markets.
4.6. Robustness Checks
To assess the robustness of our findings, we conduct additional analyses focusing on alternative model specifications. The detailed results are reported in
Appendix A.
First, we examine the sensitivity of our results to the choice of lag length in the VAR model. While the baseline specification uses the lag order selected by the Schwarz Bayesian Information Criterion (SBIC), we re-estimate the connectedness measures using alternative lag lengths. As shown in
Table A1, the overall level of connectedness remains similar, and the main patterns in both total and directional connectedness are qualitatively unchanged, indicating that our findings are not driven by a particular lag specification.
Second, we investigate the robustness of our results to the choice of forecast horizon in the variance decomposition. In addition to the baseline horizon, we consider shorter and longer forecast horizons.
Table A2 shows that both the level of connectedness and the structure of spillovers remain virtually unchanged across different horizons. In particular, the dominant role of the S&P 500 and the relative positions of other assets remain stable.
Overall, these robustness checks confirm that the observed patterns are stable and not sensitive to alternative model specifications.
5. Discussion
This section provides an economic interpretation of the empirical findings and discusses their broader implications.
A key result of this study is that the emergence of generative AI is not associated with a uniform increase in financial connectedness. Instead, the evidence points to a more nuanced transformation in the structure of spillovers across markets. Consistent with the empirical results, the overall level of connectedness declines only modestly, while the roles of individual assets change substantially. In particular, AI-related equities, which initially play a prominent role as transmitters of shocks, tend to lose some of their relative importance, whereas the S&P 500 remains the dominant source of spillovers.
Several complementary mechanisms may help explain this pattern. First, the initial surge in investor attention following major AI breakthroughs, such as the release of ChatGPT, may have temporarily intensified cross-market interactions. During this phase, heightened uncertainty and rapid information diffusion could amplify spillovers across asset classes. However, as information becomes more widely incorporated into asset prices, the marginal impact of new information may decline, leading to a modest reduction in measured connectedness.
Second, the results may reflect a process of information internalization. As markets learn about the economic implications of AI technologies, expectations become more anchored, reducing the need for continuous cross-market adjustment. This could weaken the transmission of shocks across different asset classes.
Third, the observed changes in connectedness may be consistent with a gradual segmentation of financial markets. As AI-related sectors mature, they may become more differentiated from other parts of the market, resulting in a more modular structure of financial linkages.
Taken together, these mechanisms suggest that technological innovation may initially increase financial interconnectedness through attention-driven channels, but subsequently lead to a more dispersed and differentiated network structure.
From a policy perspective, these findings highlight the importance of monitoring not only the overall level of connectedness but also its directional structure. In practice, regulators could use directional spillover measures to identify key transmission channels across markets. For example, tracking spillovers from AI-related equities to broader financial markets may provide early warning signals of emerging systemic risks. In addition, network-based metrics could be integrated into existing macroprudential surveillance frameworks to assess sector-specific vulnerabilities and cross-market contagion risks.
For investors, the results imply that exposure to AI-related assets may affect portfolio risk not only directly but also indirectly through evolving network linkages. As the structure of connectedness becomes more complex, traditional diversification strategies based on stable correlations may become less effective.
At the same time, several limitations should be acknowledged. The analysis relies on a specific set of assets, and alternative selections may yield different insights. Moreover, the use of the ChatGPT release as a reference point does not fully isolate its effects from concurrent macroeconomic developments. Future research could address these limitations by incorporating additional asset classes, alternative identification strategies, or higher-frequency data.
Overall, the findings suggest that the impact of AI on financial markets is better understood as a structural transformation of interconnectedness rather than a simple increase in spillover intensity.
6. Conclusions
This paper examines how the rapid expansion of artificial intelligence has coincided with changes in the interconnectedness of global financial markets. Using a TVP-VAR connectedness framework, we analyze spillover dynamics among AI-related equities, cryptocurrencies, and traditional financial assets from January 2021 to December 2025.
The results point to a shift in the structure of financial connectedness following the rise of generative AI. Rather than observing a broad increase in spillover intensity, we find that the overall level of connectedness declines modestly after the emergence of ChatGPT. At the same time, however, the direction and composition of spillovers change in non-trivial ways.
One notable pattern is that AI-related equities, which initially act as strong net transmitters of shocks, gradually lose their dominance. In contrast, broader equity markets—proxied by the S&P 500—remain consistently central in the transmission of shocks throughout the sample period. This suggests that, despite the growing prominence of AI, traditional market structures continue to anchor the system.
Taken together, these findings indicate a move toward a more dispersed spillover structure. While this may imply a reduction in concentration risk, it also complicates the identification of key sources of systemic vulnerability.
Importantly, these results are robust to alternative model specifications, including different lag lengths and forecast horizons, suggesting that the observed patterns are not driven by specific parameter choices.
This study adds to the literature by showing that technological innovation does not necessarily amplify overall connectedness but can instead reconfigure how shocks propagate across markets. In this sense, focusing solely on aggregate measures may obscure important structural changes.
From a policy standpoint, these results highlight the need to monitor not only the intensity but also the direction of financial linkages, particularly as AI becomes more deeply embedded in economic activity.
There are several limitations to this analysis. For instance, the empirical framework does not explicitly address causal mechanisms, and the classification of AI-related assets may evolve over time. Moreover, the use of the ChatGPT release as a reference point does not fully isolate its effects from concurrent macroeconomic developments. Future work could build on this by employing alternative identification strategies or by extending the analysis to earlier episodes of technological change for comparison.