Article

Multi-Trait Analysis of Abiotic Stresses on Early Plant Growth of Wheat Cultivar


by
Alan Mario Zuffo
1,
Francisco Charles dos Santos Silva
1,
Adriana Araujo Diniz
1,
Augusto Matias de Oliveira
2,
Fábio Steiner
3,
Jorge González Aguilera
3,
Luis Morales-Aranibar
4,
João Flávio Floriano Borges Gomides
5 and
Charline Zaratin Alves
5,*
1
Department of Agronomy, State University of Maranhão (UEMA), Balsas Campus, Balsas 65800-000, MA, Brazil
2
Department of Agronomy, University of Rio Verde (UniRV), Rio Verde 75901-970, GO, Brazil
3
Department of Crop Science, State University of Mato Grosso do Sul, Cassilândia 79540-000, MS, Brazil
4
Research Group for Agro-Environmental Systems and Sustainability, National Intercultural University of Quillabamba (UNIQ), Cusco 08741, Peru
5
Department of Agronomy, Federal University of Mato Grosso do Sul, Chapadão do Sul 79560-000, MS, Brazil
*
Author to whom correspondence should be addressed.
Seeds 2026, 5(4), 34; https://doi.org/10.3390/seeds5040034
Submission received: 11 May 2026 / Revised: 15 June 2026 / Accepted: 18 June 2026 / Published: 24 June 2026

Abstract

Abiotic stresses, such as drought, salinity, and aluminum toxicity (Al3+), affect the growth and initial establishment of wheat plants, limiting crop yield in restrictive growing environments. Therefore, the early selection of tolerant genotypes adapted to multiple production environments is essential to optimize wheat production. A laboratory experiment was conducted to identify and recommend wheat cultivars that simultaneously combine adaptability and stability for initial morphological responses when subjected to stressful environmental conditions. Plants from 12 wheat cultivars were grown under non-stressful (control) and stressful conditions (drought, salinity and Al3+ stress), using a 4 × 12 factorial arrangement with four replicates. On the 28th day, the emergence rate, length, dry matter and vigor of the plants were measured. Abiotic stresses limit the initial growth and vigor of wheat plants, with drought causing the greatest limitation for plant growth and biomass accumulation, while salinity had the greatest impact on plant vigor indices. Aluminum toxicity limits root development and biomass allocation. Principal component analysis explained 67.76% of the total variability and distinguished the plant growing environments. The multi-trait index proved effective in cultivar selection, highlighting the cv. ORS Feroz due to its proximity to the ideotype and adaptability to multiple abiotic stresses.

1. Introduction

Wheat (Triticum aestivum L.) is among the major food crops worldwide and plays a key role in global food security. Therefore, the selection and development of wheat cultivars tolerant and adapted to stressful environmental conditions are important to increase crop yield by to 60%, and thus ensure food security for an estimated global population of 9.6 billion people in 2050 [1,2].
Wheat development and production have frequently been limited by abiotic stresses such as water deficit, aluminum (Al3+) toxicity, and salinity, especially when these stressors occur during the early stages of plant growth [3,4,5]. The initial establishment of plants in the field is a critical step in the agricultural production process. It determines the speed and uniformity with which plants occupy the field area, which has a direct impact on water and nutrient absorption, plant vigor, competition with weeds, and crop development and yield [6].
Abiotic stresses affect numerous vital plant mechanisms, including water and nutrient absorption, plasma membrane integrity, photosynthetic activity, root growth, gene expression, and hormonal balance [7,8]. Under drought conditions, limited water absorption causes a reduction in the plant’s water potential and stomatal closure, limiting carbon assimilation and the productive potential of wheat crop [9]. Aluminum toxicity, common in acidic soils, compromises root growth and absorption of water and nutrients, due to the inhibition of cell division and elongation caused by the toxic Al3+ ion [10]. Salinity, on the other hand, causes osmotic and ionic stress, leading to the accumulation of reactive oxygen species (ROS) and limited plant growth. These factors, whether isolated or combined, result in morphophysiological changes that directly impact the biomass production and allocation, as well as the initial development of wheat [8,11,12].
Traditionally, stress tolerance assessments have been carried out based on individual characteristics, such as shoot length, root length, dry biomass, and other morphological traits. However, plant development is complex due to the simultaneous interaction of genetic, environmental (such as water and toxic ions), and chemical factors (such as plant hormones and nutrients), resulting in multivariate plant responses [13,14]. In this context, the analysis of isolated morphophysiological characteristics can limit the integrated understanding of plant responses to abiotic stress conditions, which compromises the identification of superior genotypes. Therefore, the use of multivariate techniques is a more robust tool for integrating multiple plant traits and selecting genotypes with better performance under adverse environmental conditions [3,9].
Multivariate analysis allows the simultaneous use of morphological, physiological, and productive traits, providing greater precision in the discrimination and selection of genotypes adapted to restrictive environments [14]. Methods based on multi-trait indices allow the integration of different plant responses to abiotic stresses into a single metric, facilitating interpretation and decision-making in genetic improvement programs [11,14].
Considering the expansion of wheat cultivation into marginal and tropical environments, combined with climate change, it becomes essential to understand how abiotic stresses impact the initial growth of the crop and how the integration of multiple traits can improve the selection of tolerant genotypes. Thus, this study evaluated the impact of abiotic stresses (drought, salinity, and aluminum toxicity) on the initial growth of wheat plants, seeking to identify and recommend wheat cultivars that simultaneously combine adaptability and stability for morphological responses when exposed to stressful environmental conditions.

2. Materials and Methods

2.1. Plant Materials and Stress Treatments

Seeds of 12 commercial wheat cultivars were used in this study. These cultivars were chosen because they are commonly grown in the tropical Cerrado region of Brazil. The main agronomic characteristics of wheat cultivars are described in Table 1.
The seeds were first sterilized with 2% (w/v) sodium hypochlorite (NaOCl) solution for 8 min and then washed immediately with distilled water many times. The sterilized seeds were shade-dried at room temperature in the laboratory for 96 h and then allowed to germinate under non-stressful (control) and stressful (drought, salinity and Al3+ toxicity) conditions.
Drought and salinity stresses were induced using an osmotic solution of –0.30 MPa prepared with polyethylene glycol (PEG-6000) and sodium chloride (NaCl), respectively. The amount of PEG-6000 required to prepare the solution with an osmotic potential of –0.30 MPa was calculated using Equation (1) [15]:
ΨS = [−(1.18 × 10⁻²) × C − (1.18 × 10⁻⁴) × C2 + (2.67 ×10⁻⁴) × C × T + (8.39 × 10⁻⁷) × C2 × T]/10
where ΨS is the osmotic potential (MPa), C is the concentration (g L−1 of PEG-6000) and T is the temperature (°C). The amount of NaCl required to prepare the saline solution with an osmotic potential of –0.30 Mpa was calculated using the van’t Hoff equation [16]:
ΨS = −R × T × C × i
where R is the ideal gas constant (0.008314 Mpa mol−1 K−1), T is the absolute temperature (273.15 + °C), and C is the molar concentration of the solute (mol L−1); and i is the van’t Hoff factor, that is the number of ions released when the solute is dissolved in water [i.e., for NaCl this value is 2.0 (Na+ and Cl)].
Aluminum toxicity stress was induced using a solution containing 150 μmol L−1 Al3+ and 1000 μmol L−1 Ca2+ prepared with aluminum sulfate octadecahydrate [Al2(SO4)3·18H2O] and calcium chloride dihydrate (CaCl2·2H2O), respectively. The pH of the solution containing Al3+ was adjusted to 4.3 using a 0.5 mol L−1 HCl solution. Solutions containing between 150 and 200 μmol L−1 of Al3+ combined with 1000 μmol L−1 of Ca2+ have been effective in identifying cereal crop genotypes tolerant to Al3+ toxicity [17,18]. Distilled water with an osmotic potential of 0.00 Mpa was used as a control treatment.

2.2. Plant Growing Conditions

Four replicates of 50 seeds were sown at a depth of 2.0 cm in plastic containers (44 × 30 × 7.5 cm) filled with quartz sand with particle sizes between 0.05 and 0.8 mm. After seeding, the sand substrate was moistened with distilled water (control), PEG-6000 solution (drought stress), NaCl solution (salinity stress) or Al2(SO4)3·18H2O solution (aluminum stress) at a ratio of 70% of the substrate’s water retention capacity [19], which was equivalent to 120 mL of aqueous solution for each kilogram of quartz sand. The plants were grown under controlled laboratory conditions with artificial light supplementation with red (620–630 nm) and blue (455–475 nm) wavelengths at the ratio of 85% (red) and 15% (blue) from light-emitting diodes (LEDs) at 300 ± 60 μmol m−2 s−1 light intensity, temperature of 25.2 °C (±2.4 °C) and photoperiod of 12 h/12 h (light/darkness) cycle, for 28 days.

2.3. Measurement of Emergence, Plant Growth and Vigor

At 28 days after the beginning of the abiotic stresses, the emergence rate € of wheat seedlings was recorded. Subsequently, six plants per replicate were randomly chosen for determination of the morphological traits [plant height (PH), root length (RL), total plant length (TPL), shoot dry matter (SDM), root dry matter (RDM), total dry matter (TDM), and root-to-shoot ratio (RSR)]. The PH, RL, and TPL were measured using a ruler. The SDM, RDM, and TDM were determined using an analytical balance (±0.0001 g) after drying the plant material in a forced-air circulation oven at 85 °C for three days. RSR is the relationship between the root dry matter and the shoot dry matter of the plant.
The data of emergence rate, plant total length, and total dry matter were also used to calculate the plant vigor indexes under stressful and non-stressful conditions. The plant length vigor index (LVI) and plant weight vigor index (WVI) were calculated by the following equations proposed by Abdul-Baki and Anderson [20]:
LVI = total plant length (m) × emergence rate (%)
WVI = total plant dry weight (g) × emergence rate (%)

2.4. Experimental Design and Statistical Analysis

The experimental bioassay was arranged in a completely randomized design in a 4 × 12 factorial scheme: four stress treatments (control, drought, salinity and Al3+ toxicity) and 12 wheat cultivars, with four replicates of 50 seeds.
The basic assumptions of analysis of variance (ANOVA) were checked using the Shapiro–Wilk test to assess the normality of the residuals. The morphological response of wheat cultivars grown under non-stressful (control) and stressful (drought, salinity, and Al3+ toxicity) conditions were demonstrated using a box plot for each dependent variable. Pearson correlation analyses were performed considering the entire dataset and within each stress environment to investigate the relationship between the initial growth morphological traits of wheat plants.
Genetic parameters, including genotypic variance ( σ G 2 ) , the variance in the cultivar–stress interaction σ G A 2 ; broad-sense heritability (H2), and the ratio between the genotypic and residual coefficients of variation (CVg/CVe), were also estimated. These parameters were estimated individually for each morphological trait of wheat plants, using the respective mean squares of the statistical model in a factorial arrangement.
Principal component analysis (PCA) based on the correlation matrix with standardized data (zero mean and unit variance) was performed for each growing environment condition (control, drought, salinity, and Al3+ toxicity) using all morphological growth traits of wheat plants. A total of 48 observations (12 cultivars × 4 growing environments) were used in the PCA. Each observation corresponds to the mean value of a cultivar within a growing environment.
Additionally, the multi-trait genotype–ideotype distance index (MGIDI) was calculated to assist in the selection of wheat cultivars grown under non-stressful and stressful conditions using the methodology proposed by Olivoto and Nardino [21], as expressed in the following equation:
MGIDI i   =   i = 1 f γ ij γ j 2 0.5
where MGIDIi is the multi-trait genotype–ideotype distance index for the ith genotype; γij is the score of the ith genotype in the jth factor (i = 1, 2, …, g; j = 1, 2, …, f); g and f represent the genotypes and factor number, respectively; and γj is the jth score of the ideotype genotype. The ideotype was defined as the theoretical genotype that has the most desirable values for all morphological traits. The MGIDI value was calculated as the Euclidean distance between the factor scores of each genotype and those of the ideotype. Therefore, lower MGIDI values indicate genotypes closer to the ideotype and are the desirable genotypes for selection. All the statistical analyses were performed using R software (version 4.4.1) [22].

3. Results and Discussion

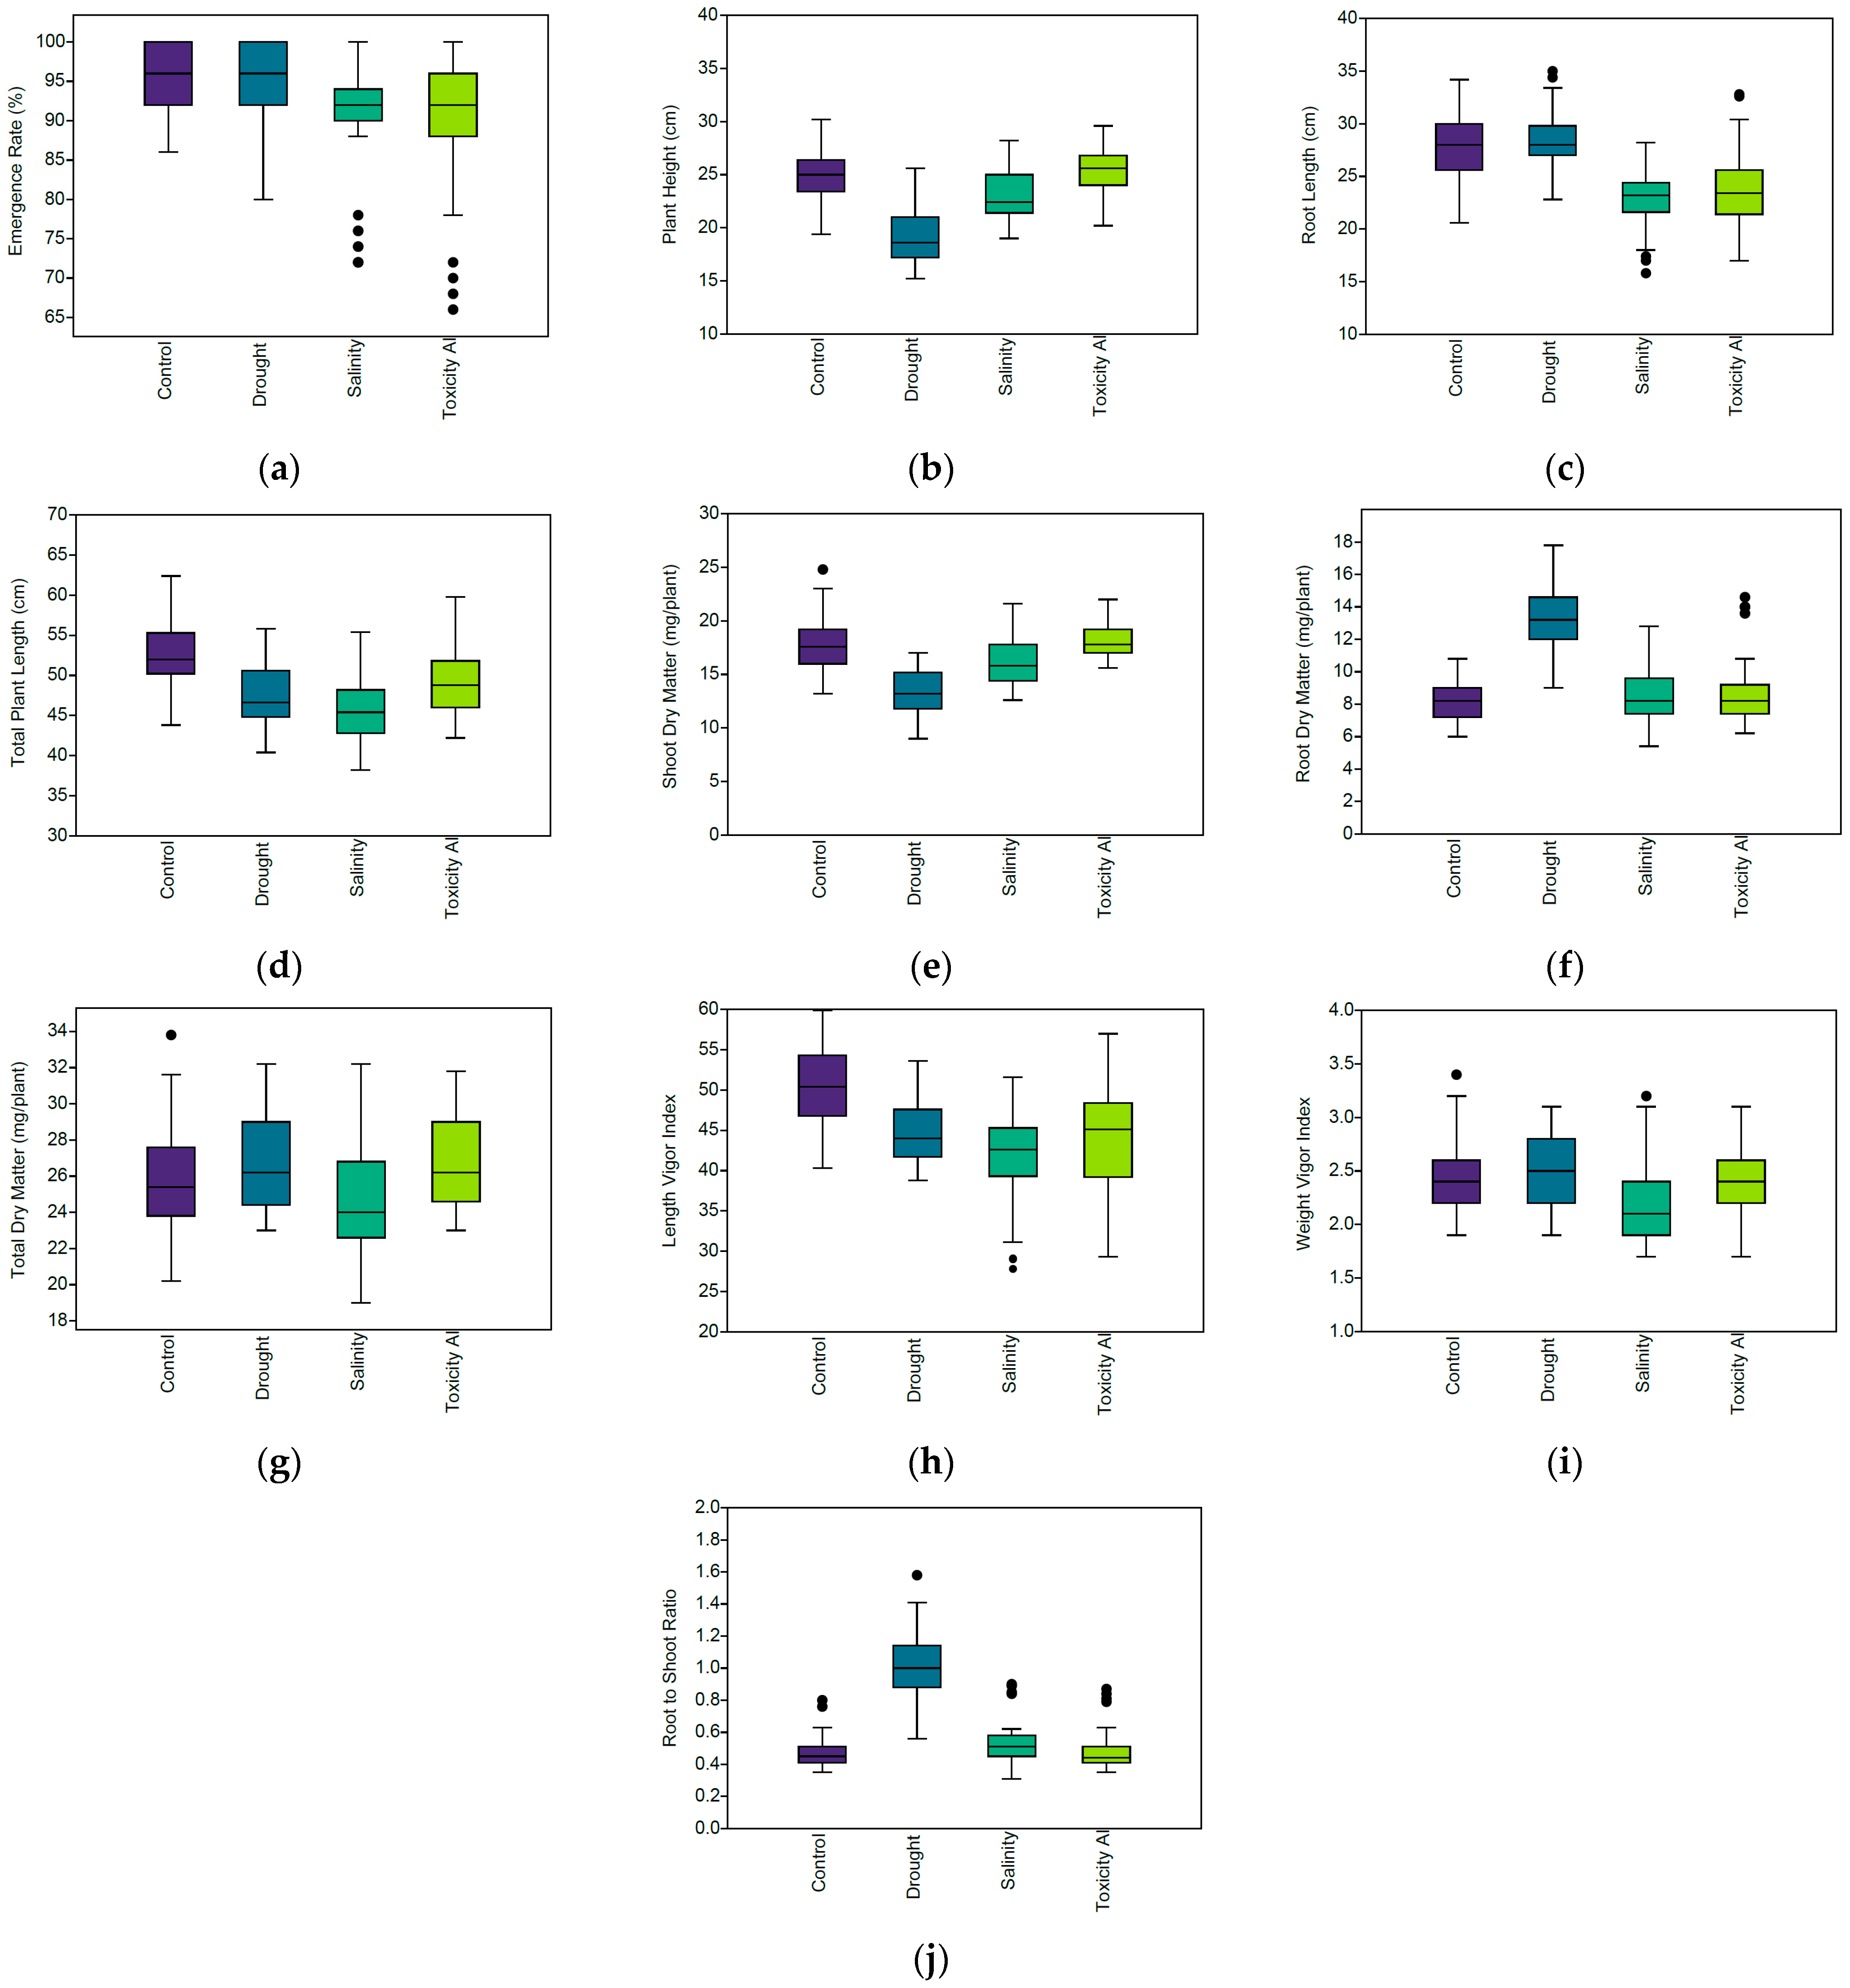
Abiotic stresses altered the morphological response of the wheat plants, with specific responses for each growing environment and morphological trait (Figure 1). In general, the median and dispersion of most of the morphological traits were greater for plants grown under stressful conditions compared to plants under control conditions, indicating greater phenotypic stability of wheat cultivars under non-stressful conditions. The emergence rate remained high under control and drought conditions, suggesting that moderate water stress has little effect on the initial radicle protrusion phase (Figure 1a). Salinity and Al3+ toxicity reduced the median and increased the occurrence of lower outliers, indicating greater sensitivity of some wheat cultivars and increased variability under osmotic and ionic stress (Figure 1a).
Studies have shown that increased salinity significantly reduces the germination rate, plant vigor index, and initial root and shoot growth in wheat genotypes [9,23,24]. These studies revealed that even under high salinity, some genotypes germinate reasonably well, whereas others exhibit a large reduction in emergence and seedling characteristics, confirming genotypic differences. Salinity impairs water absorption—resulting in osmotic stress—and causes ionic toxicity to the embryo, directly limiting seed germination and plant emergence [9,23,24].
With respect to the plant growth traits [plant height (Figure 1b), root length (Figure 1c), and total length (Figure 1d)], drought promoted the most pronounced decreases in the medians, reflecting limitations in cell expansion and tissue elongation; however, salinity had an intermediate effect (Figure 1). Al3+ toxicity also strongly affected the root system, which is consistent with the primary role of Al3+ in inhibiting root growth. Al3+ binds strongly to cell walls and the apoplast in the elongation zone, stiffening the walls and directly blocking cell expansion; secondary effects involve hormonal signaling, oxidative stress, and nutritional imbalances [10,25,26].
This response is also linked to the presence of resistance genes TaALMT1 and TaMATE1B, which, when combined, generate significant allelic variation for genotypes with resistance under acidic soil conditions [26,27,28]. Drought and salinity reduce the relative water content, water potential, and osmotic potential, impairing water and nutrient absorption and root growth [8,9,11,12]. The greater interquartile range observed in stressful environments indicates increased phenotypic divergence among wheat cultivars, suggesting exploitable genetic variability for tolerance, which could be explored in crop breeding.
The shoot dry matter (Figure 1e), root dry matter (Figure 1f) and total dry matter (Figure 1g) reinforce the pattern reported for plant growth; drought significantly compromised dry matter accumulation (Figure 1f,g), indicating metabolic restriction and lower carbon assimilation. Drought commonly reduces plant length and biomass accumulation in most wheat cultivars, especially under severe stress [29,30]. Salinity and Al3+ toxicity, on the other hand, promoted greater dispersion and the presence of outliers in general (Figure 1), indicating contrasting responses among wheat cultivars regarding the maintenance of growth under osmotic and ionic stress.
The plant length vigor index under stressful conditions was reduced compared to the control treatment, with a more pronounced effect under salinity stress (Figure 1h). Decreases in the median and greater dispersion were observed in the saline environment, indicating that initial growth associated with emergence was compromised. Drought also reduced the length vigor index, but to a lesser extent, while Al3+ toxicity resulted in intermediate values and greater variability, indicating contrasting genotypic responses in terms of the maintenance of initial vigor.
Similarly, the plant weight vigor index was negatively affected by abiotic stresses, especially under salinity stress (Figure 1i). Drought promoted a moderate reduction, while Al3+ toxicity maintained values close to those of the control, although with greater dispersion. These results indicate that saline stress more consistently compromises the initial plant vigor associated with biomass accumulation, while drought mainly impacts structural growth, and Al3+ promotes greater phenotypic instability among wheat cultivars. Together, both indices confirm that abiotic stresses reduce the initial vigor of plants, with the intensity depending on the nature of the stress factor [9].
For the root-to-shoot ratio (Figure 1j), a significant increase in the median was observed under drought conditions compared with the control treatment, indicating greater relative investment in the root system, which is a typical adaptation mechanism of plants to water deficit stress [31]. Furthermore, the greater interquartile range in this environment revealed variability in plasticity among wheat cultivars under stressful conditions (Figure 1j). In contrast, the salinity stress and Al3+ toxicity resulted in root-to-shoot ratio values that were similar or only slightly higher compared to the control treatment, suggesting that proportional root growth under osmotic and ionic stresses was limited (Figure 1j). These results indicate that while drought induces strategic allocative reprogramming, salinity and Al3+ impose more direct restrictions on root growth. A meta-analysis of 164 studies revealed that drought increased the root dry matter fraction and reduced stem, leaf, and reproductive dry matter [32]. Al3+ toxicity, on the other hand, affects root elongation, causes disordered cell structure, and restricts water and nutrient absorption [29,33].
Salinity generally reduces root growth but usually results in less than shoot growth; thus, the root-to-shoot ratio often increases under saline stress [34,35]. The effects of salinity depend on salt concentration and duration; moderate salinity may not alter root growth or may even stimulate it slightly in some species, whereas higher levels reduce primary root elongation and root surface area. Salinity acts primarily through osmotic stress and Na+/Cl toxicity, reducing water uptake, cell expansion, root hair length/density, and total root surface area [34,35,36].
Taken together, the results demonstrate that the different abiotic stresses act through distinct physiological mechanisms, resulting in differentiated patterns of performance reduction and phenotypic stability in the wheat cultivars. The greater variability observed under adverse conditions highlights the potential for selecting superior genotypes with greater resistance to multiple abiotic stresses [1,3,4,9,12,13,37,38].
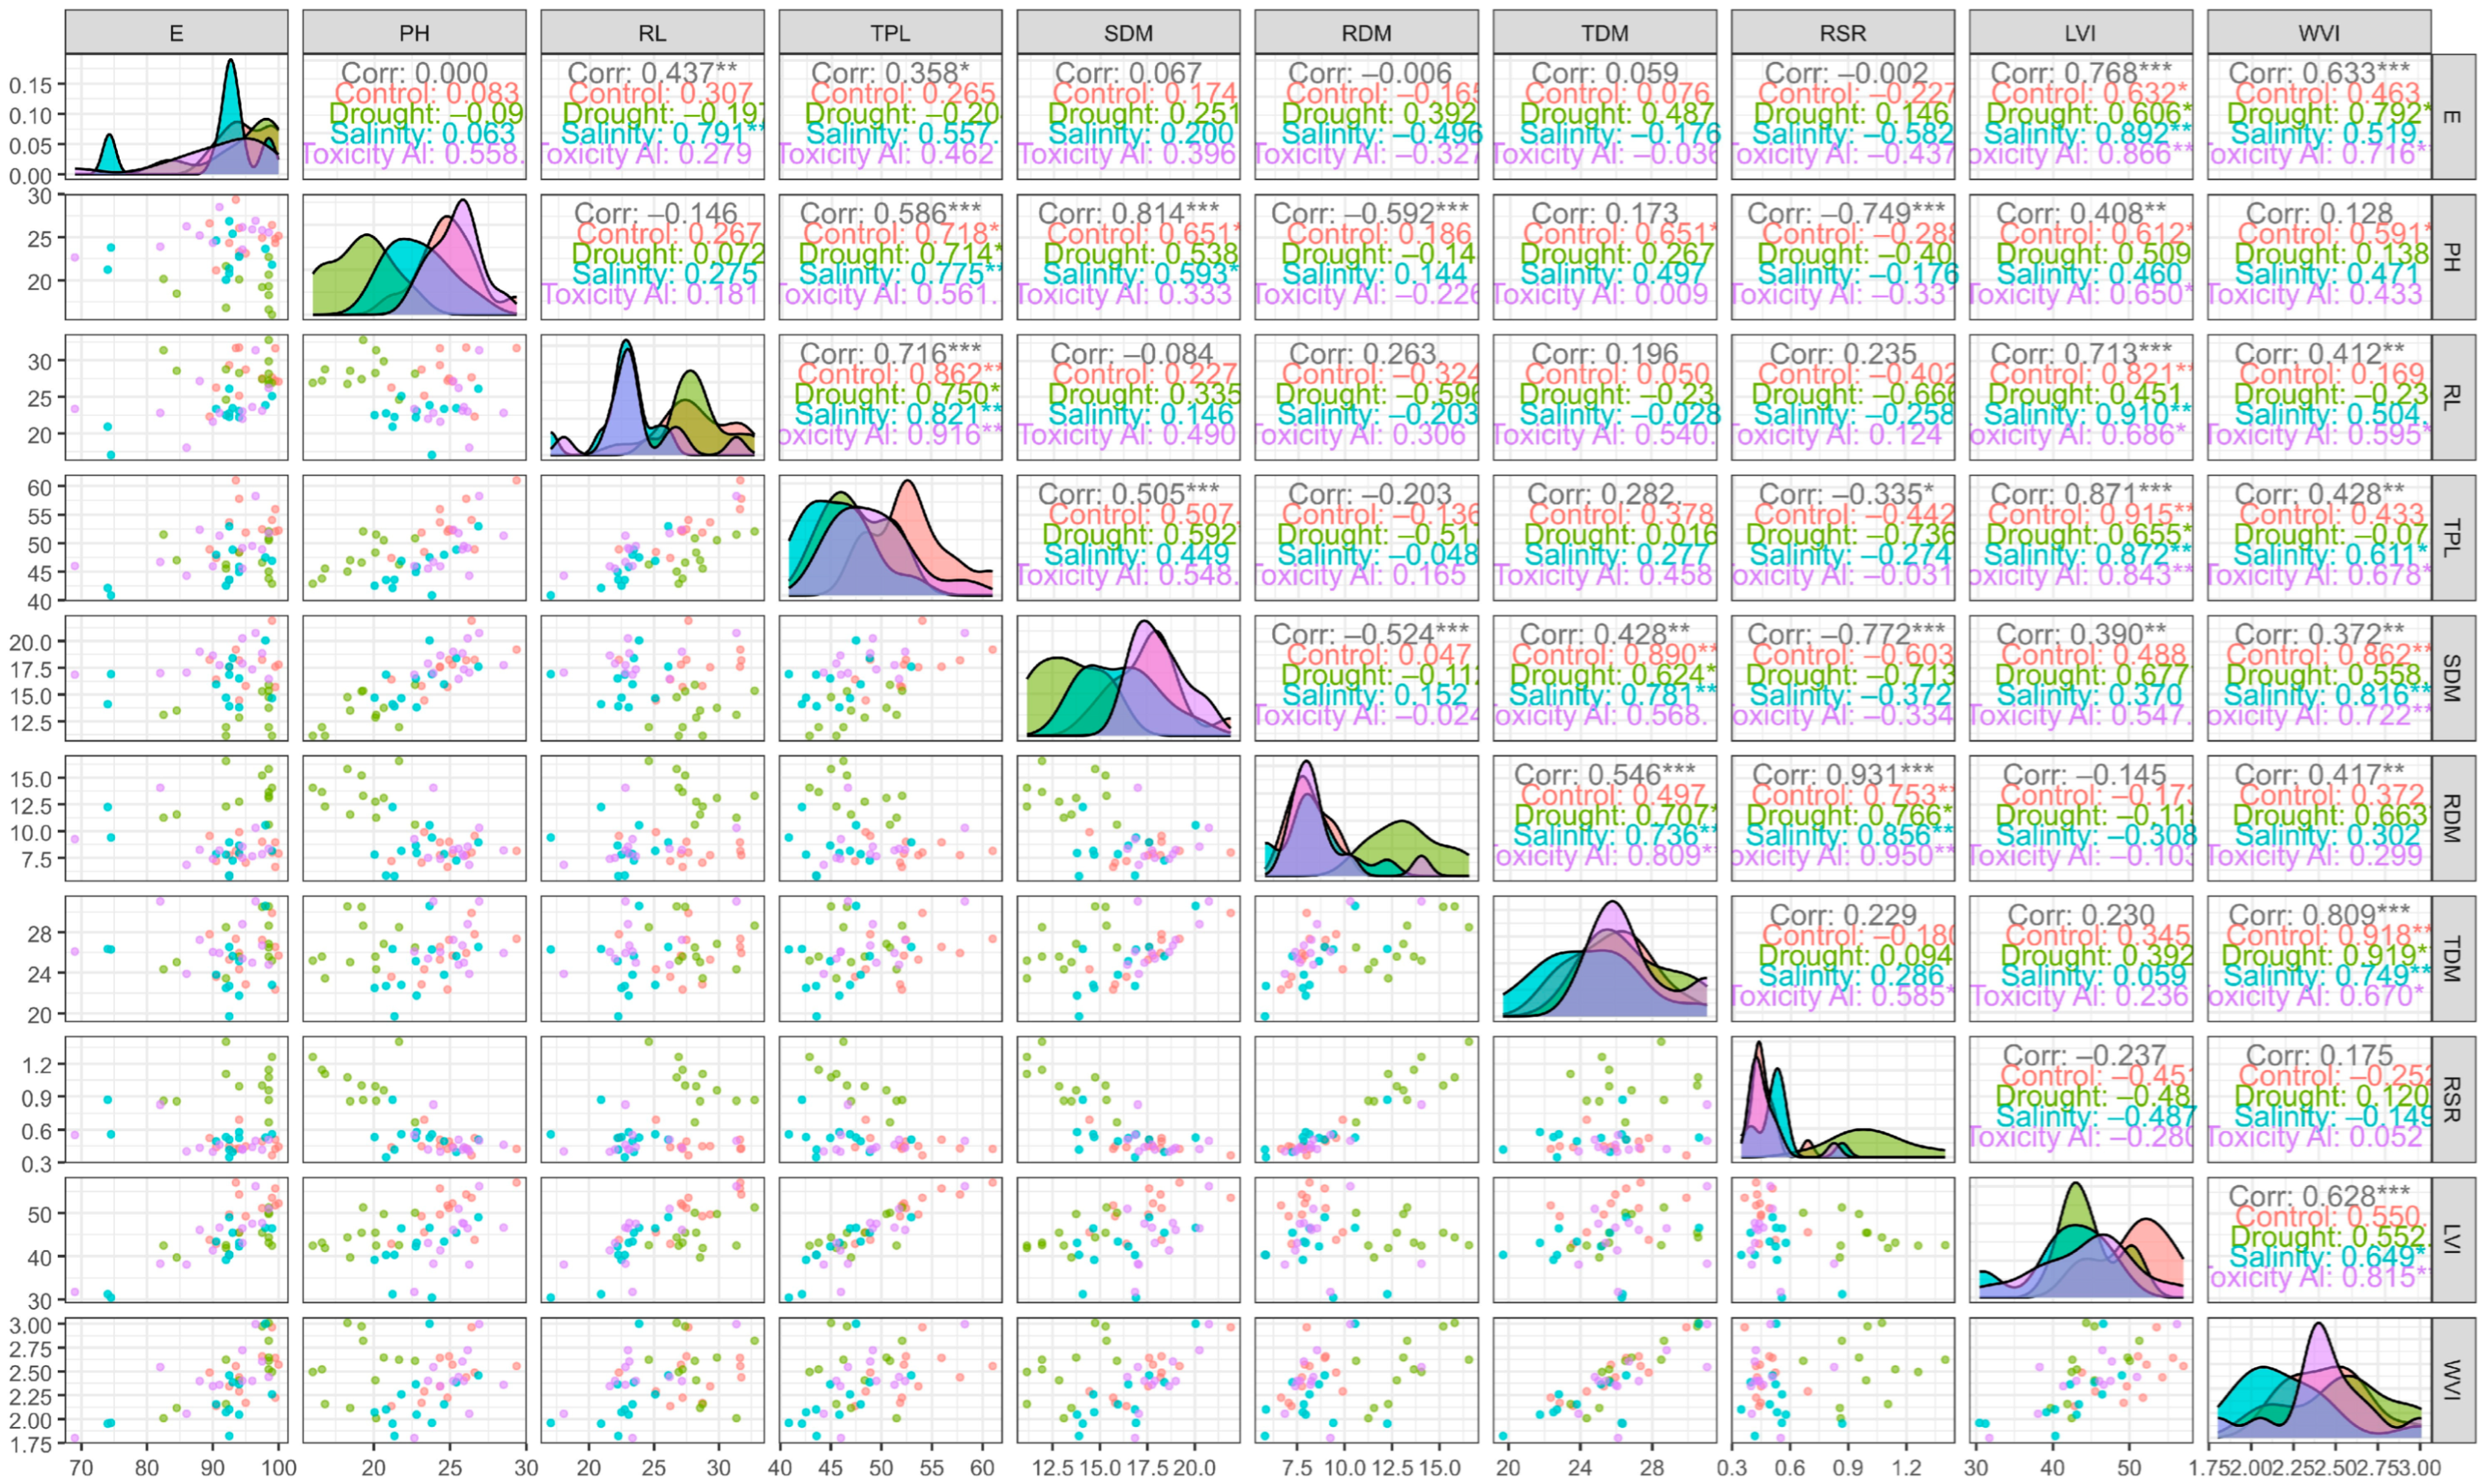
The scatter plot and correlation matrix show consistent patterns of association between morphological growth traits, with variation depending on the stress environment (Figure 2). In general, strong positive correlations were observed between morphological traits directly related to growth, especially root length (RL), total plant length (TPL), plant height (PH), and length vigor index (LVI). These associations are maintained in all the environments but are greater in magnitude under control and drought conditions, indicating greater morphological integration when stress is less limiting.
The biomass accumulation (SDM, RDM, and TDM) were also positively correlated with each other, particularly between TDM and its shoot and root fractions (Figure 2), reflecting the combined contribution of these compartments to total dry matter accumulation. The weight vigor index (WVI) is strongly correlated with the TDM and SDM, confirming its direct dependence on biomass accumulation.
The root-to-shoot ratio (RSR) shows a distinct pattern, with negative or weak correlations with growth characteristics (PH) and biomass accumulation (SDM) in some environments, especially under drought (Figure 2), suggesting that the relative increase in root allocation occurs at the expense of reduced shoot growth. This response shows that the RSR plays an important role as an indicator of adaptive adjustment and not necessarily of greater absolute performance.
The emergence rate (E) was moderately correlated with the growth and vigor traits (Figure 2), with these associations being more evident in control and under drought conditions, whereas under salinity and Al3+ toxicity conditions, the correlations became more heterogeneous, indicating greater physiological instability in these environments.
In general, under drought and salinity stress, many correlations remained positive, although with less magnitude than those in the control, suggesting that stress simultaneously limits elongation and dry matter accumulation. Under Al3+ toxicity, a more pronounced alteration is observed in the relationships involving RL and RSR (Figure 2), indicating high sensitivity of the root system to this stress and changes in the relative allocation between roots and shoots. Furthermore, LVI is strongly correlated with TPL and PH, whereas WVI is correlated mainly with TDM, SDM, and RDM, reinforcing the role of these indices as integrators of plant vigor based on length and biomass. Taken together, these results indicate that abiotic stresses modify not only the average values of the morphological traits but also the correlation structure between them, with relevant implications for the selection of more vigorous and stable genotypes in adverse environments.
On the main diagonal, the density curves show that stress environments shift and, in many cases, narrow the distributions of growth traits (Figure 2), indicating an average reduction and greater concentration of values, especially for plant height (PH), root length (RL), total length (TPL), and biomass accumulation (SDM, RDM, and TDM). Below the diagonal, the scatter plots show consistent association patterns between the traits: RL and PH are positively related to TPL; SDM and RDM contribute strongly to TDM; and the vigor indices (LVI and WVI) closely follow the variations in length and biomass, respectively (Figure 2).
The results of the analysis of variance and genetic parameters indicate that there is wide variability among wheat cultivars and that the stress environment strongly influences all the plant morphological traits (Table 2).
For E, PH, RL, TPL, SDM, TDM, RSR, LVI, and WVI, the effects of cultivar (C), stress (S), and the C × S interaction were significant, indicating that the genotypes respond differently to the environmental conditions tested. With respect to RDM, the effect of the cultivar was not significant, but there was an interaction between C and S. The estimates of broad-sense heritability (H2) were high for PH (86.82%), RL (82.27%), SDM (80.50%), TPL (75.26%), and E (69.54%), indicating that a large part of the phenotypic variation in these characteristics is of genetic origin, favoring gains with selection and additive effects of the characteristics [37]. Furthermore, CVg/CVe ratios greater than 1 for almost all the variables indicate that genetic variance is considered more influential than residual variance and that the traits are seen as promising for selection [38]. Overall, the results demonstrate that there is usable genetic variability for most traits and that the genotype × environment interaction is a key factor in the expression of vigor and initial growth of wheat under abiotic stresses, which reinforces the importance of evaluating and selecting cultivars under multiple environmental conditions.
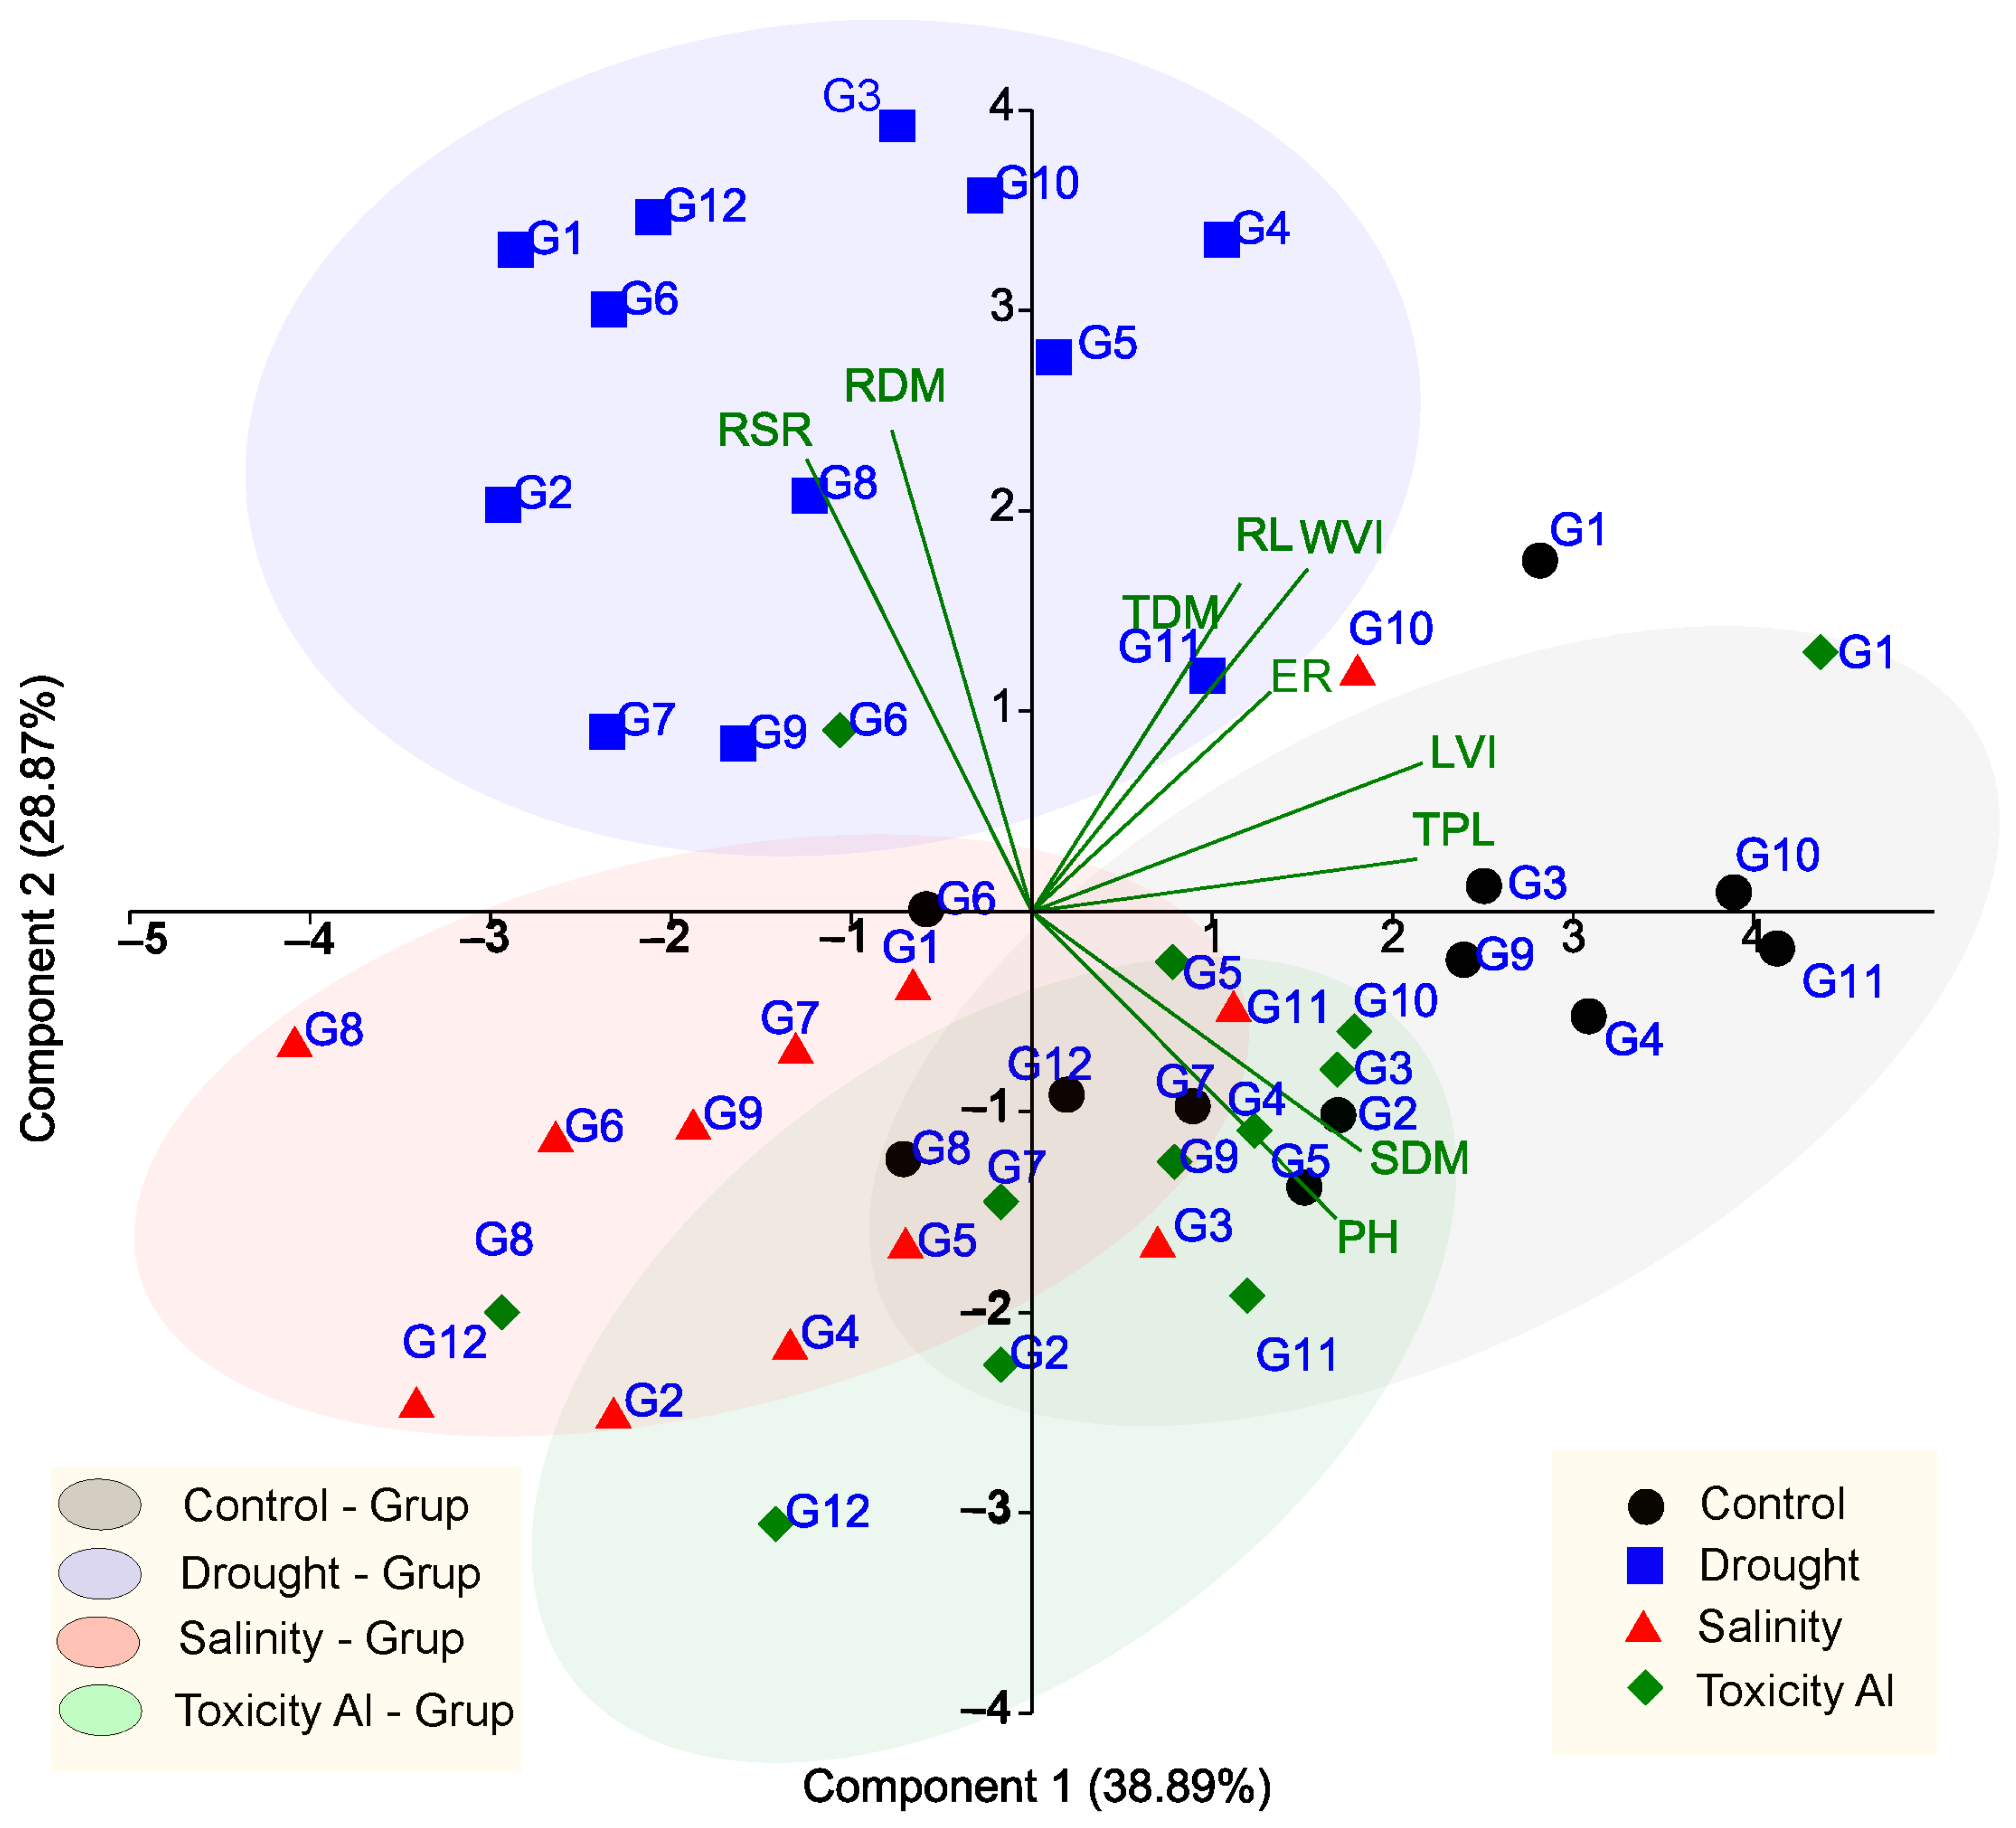
The results of the principal component analysis of the morphological traits of the 12 wheat cultivars grown under non-stressful and stressful conditions are shown in Figure 3. The first two components together explain 67.76% of the total data variation, with component 1 accounting for 38.89% and component 2 accounting for 28.87%. Component 1 is strongly associated with traits related to plant growth and biomass accumulation, such as TPL, PH, SDM, TDM, RL, LVI, and WVI, whose vectors are oriented mainly in the positive direction of this axis, indicating that cultivars positioned to the right of the graph tend to show greater vigor and overall plant performance. Component 2 is more influenced by characteristics related to biomass allocation and root architecture, especially RDM and RSR, whose vectors project in the positive direction of this axis, differentiating wheat cultivars in terms of the root-to-shoot ratio and root system development (Figure 3).
There was a clear separation of stress environments, as observed in the eclipses associated with each stress (Figure 3). The wheat cultivars grown under control conditions were concentrated mainly in the right quadrant and were associated with greater growth and vigor, reflecting superior plant performance under non-stressful conditions (Figure 3). In contrast, cultivars subjected to drought and salinity tended to cluster more to the left of the Component 1 axis, indicating a reduction in growth, dry matter accumulation, and vigor indices. The Al3+ toxicity formed a distinct cluster that is strongly associated with the RDM and RSR, suggesting that with this stress there is a greater relative emphasis on root development and changes in biomass partitioning between roots and shoots.
Furthermore, variability is observed among wheat cultivars within each plant growing environment, indicating different responses to stress. Some cultivars maintain proximity to the vectors TPL, LVI, WVI, and TDM even under adverse conditions (Figure 3), suggesting greater physiological stability and potential for selection. Taken together, the results of PCA reveal that abiotic stresses not only reduce the average performance of wheat plants but also alter the pattern of association between traits, allowing the identification of more vigorous cultivars with better adaptation to different environmental conditions.
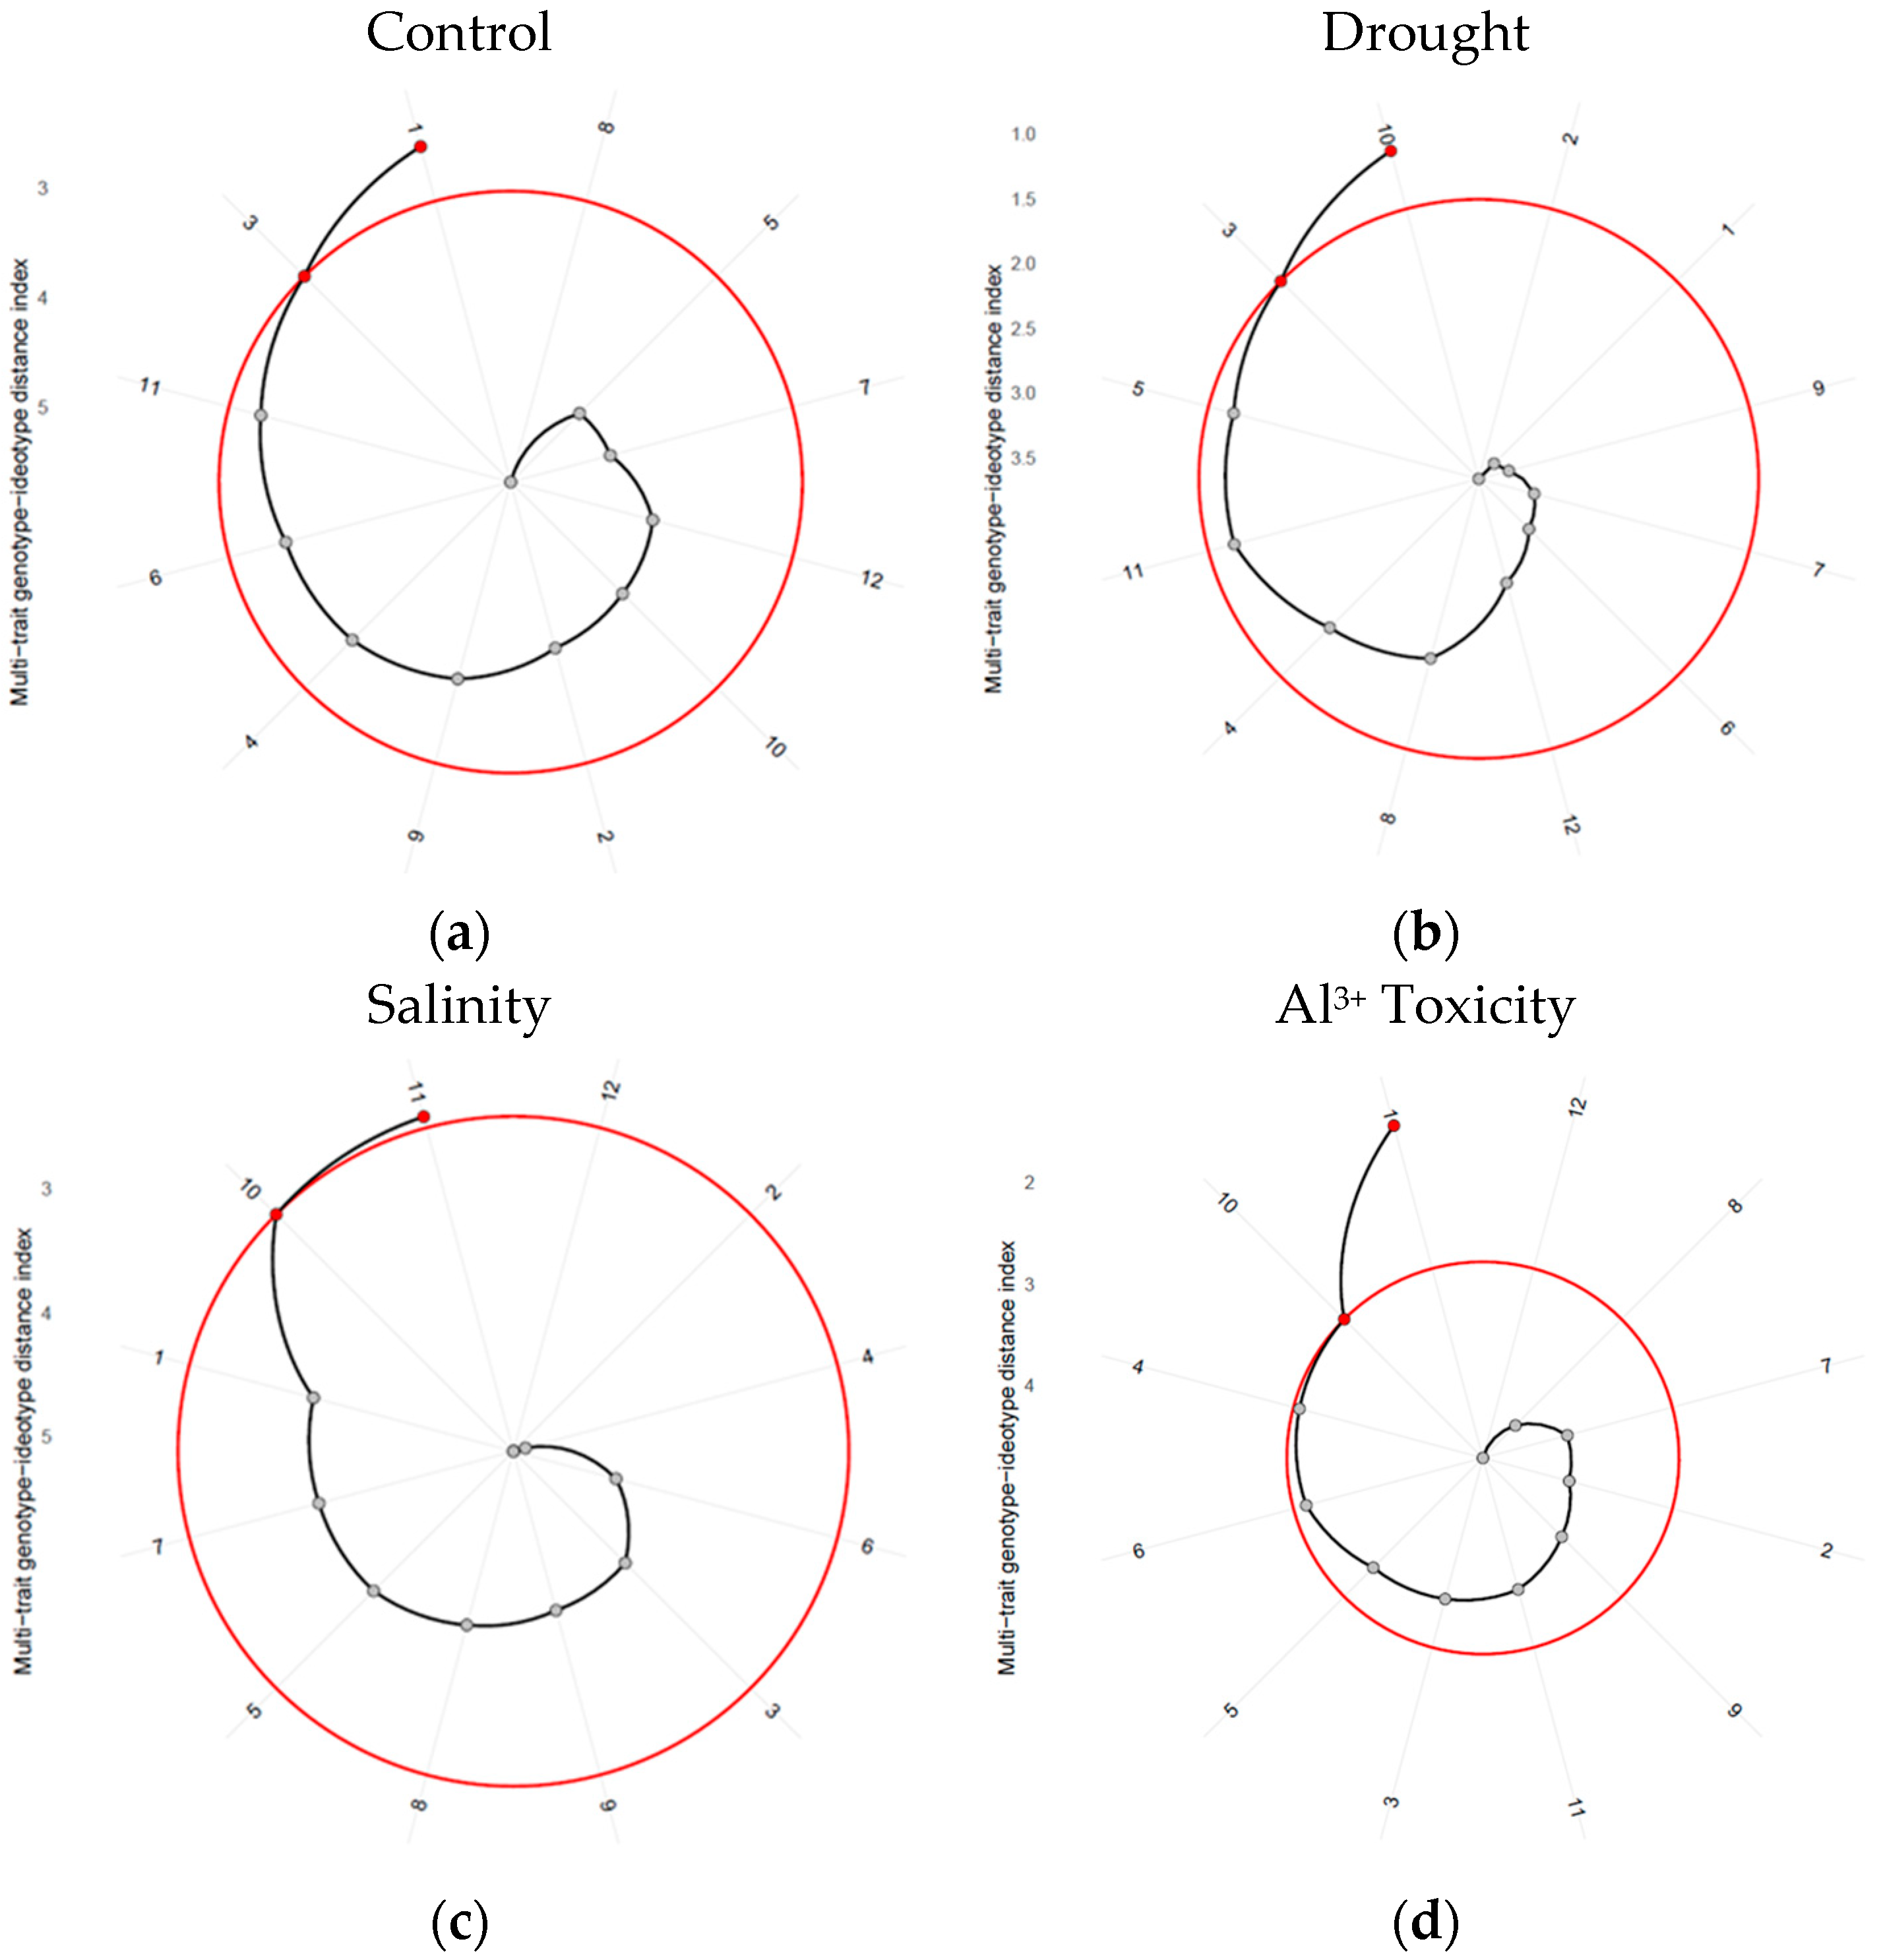
In the control environment, only cultivars 1 and 3 were positioned within the selection limit, indicating greater proximity to the ideotype (Figure 4). Under drought stress, cultivars 10 and 3 were selected because they presented a relatively small distance from the ideotype. With respect to the salinity stress, only cultivars 10 and 11 remained within the established limit and were more promising. In the environment characterized by Al3+ toxicity, only cultivars 1 and 10 presented a smaller multicharacter distance in relation to the ideotype and were considered superior for this stress condition (Figure 4).
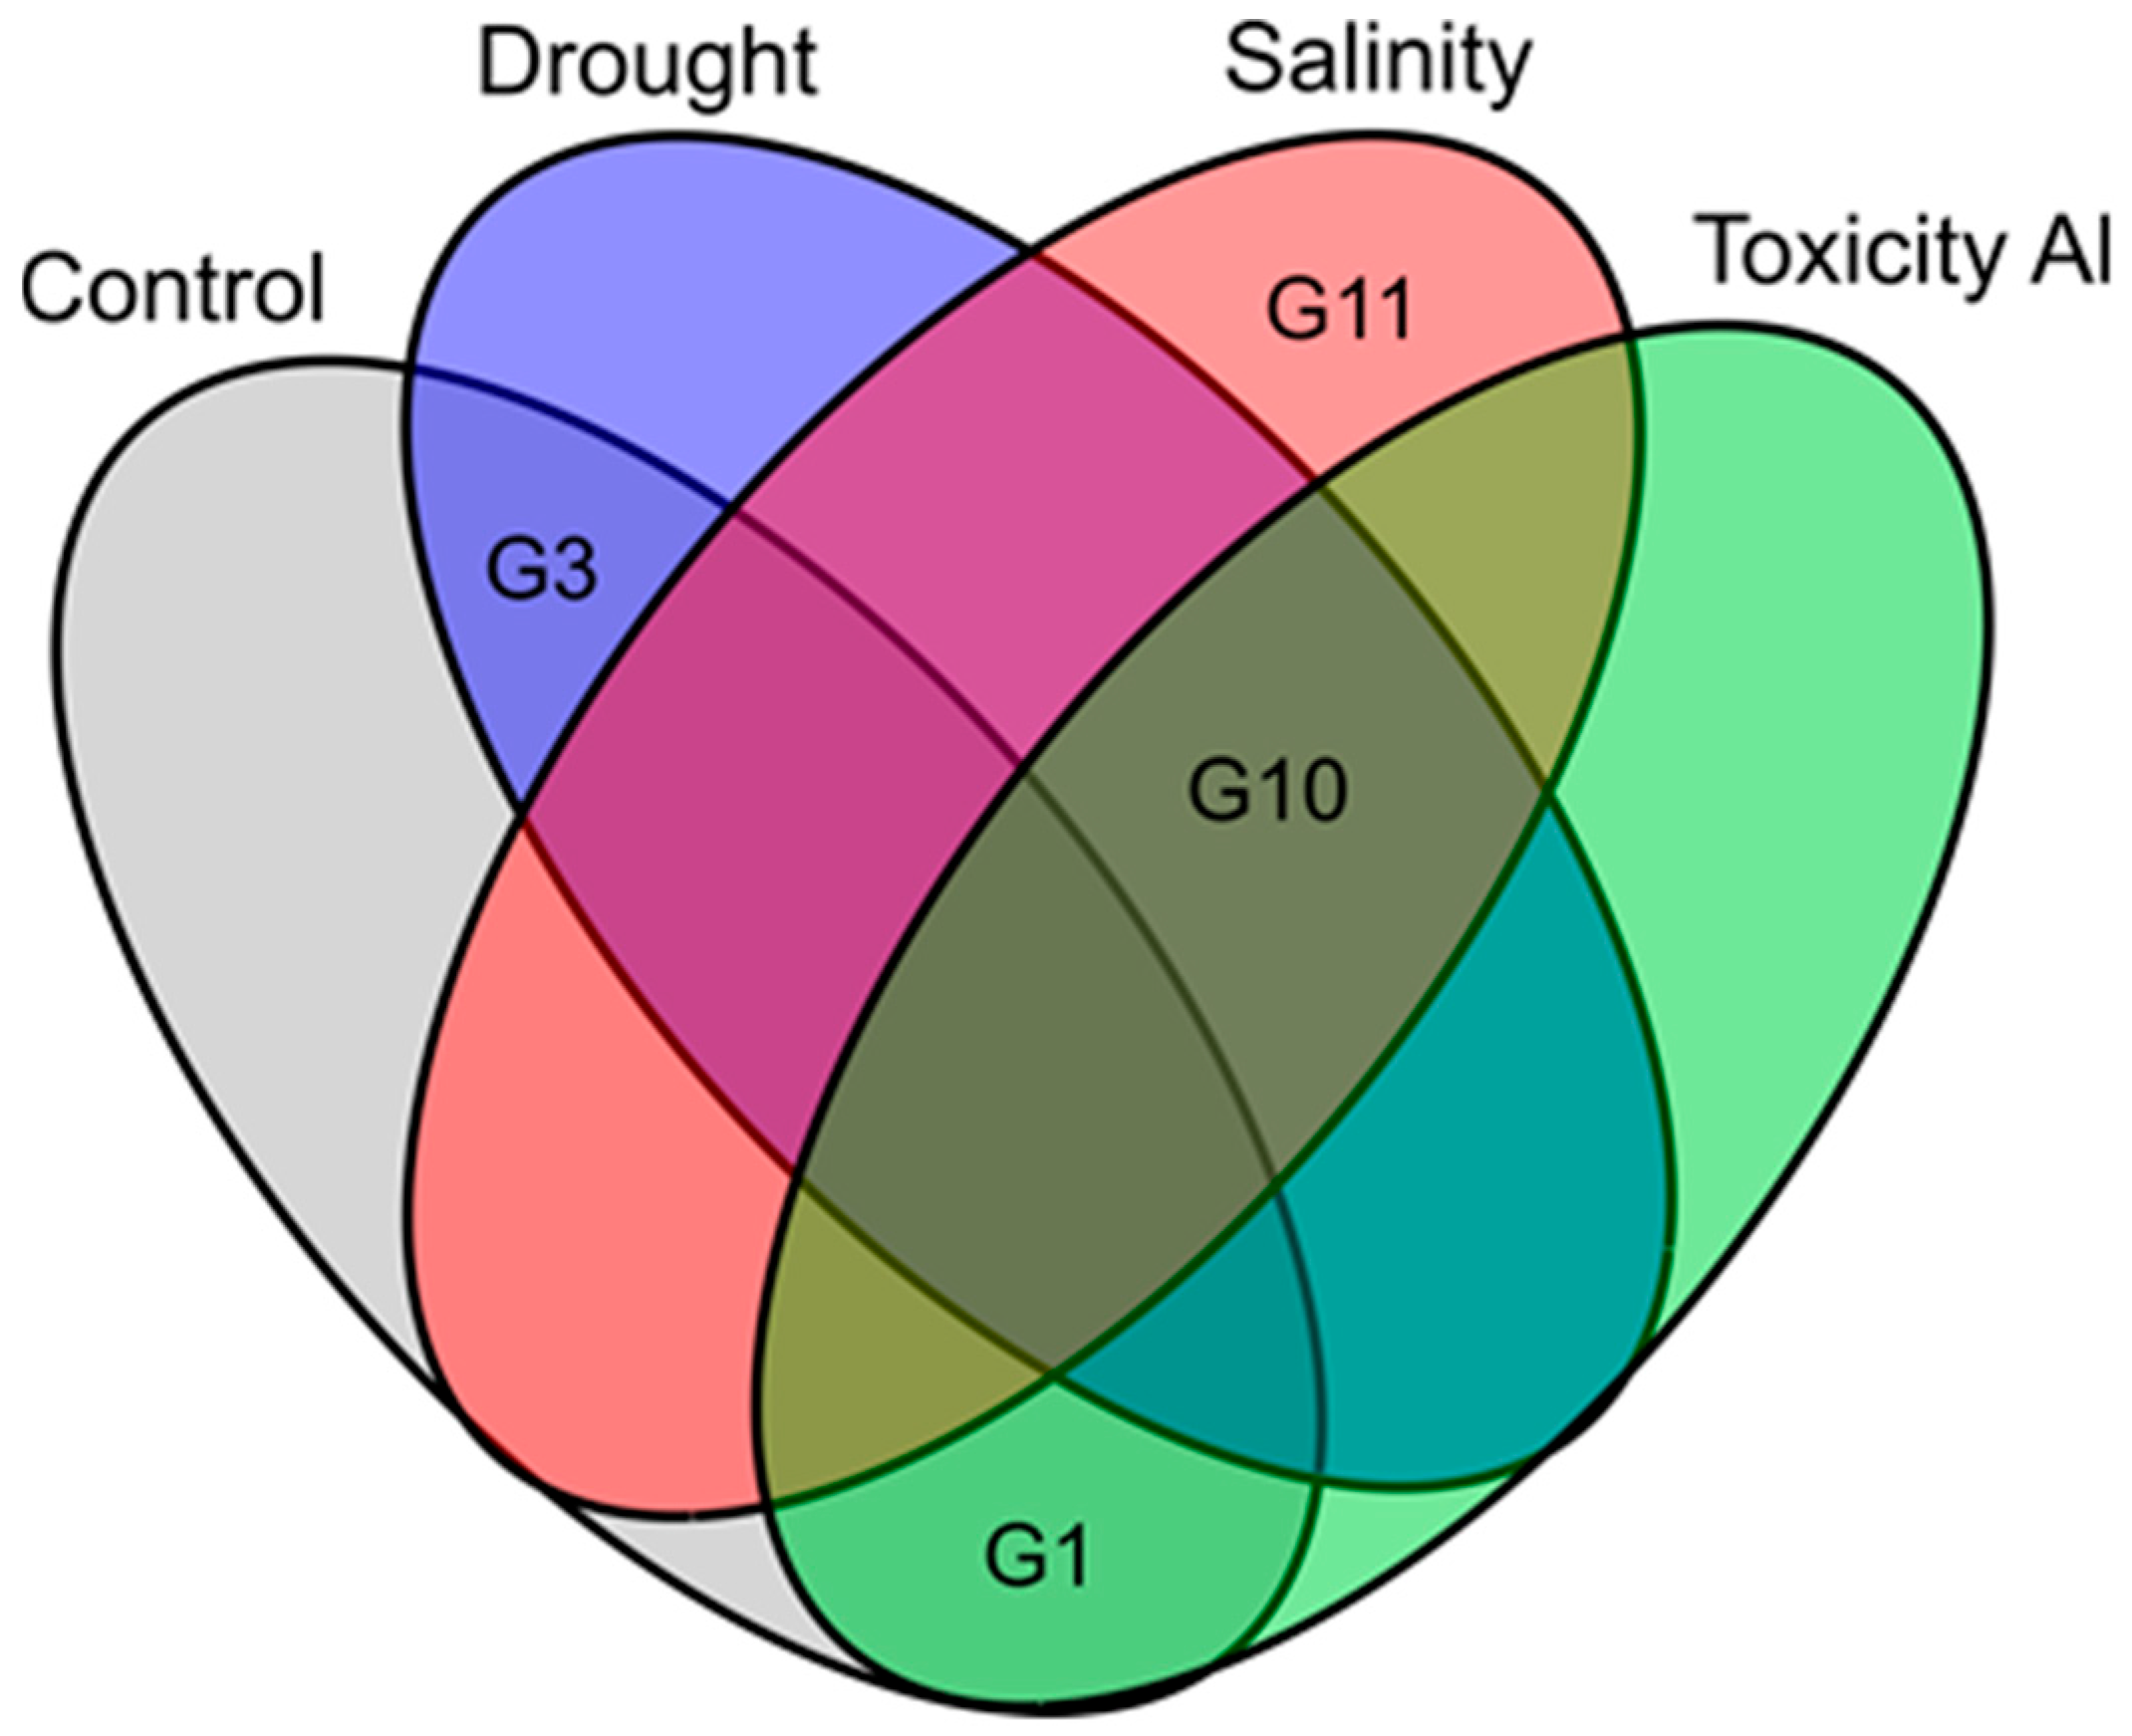
The coincidence of cultivars selected by the MGIDI in the different abiotic stresses was evaluated using a Venn diagram involving the control, drought, salinity, and Al3+ toxicity conditions (Figure 5). Only cultivar G10 was present at the intersection between three stressful environments (drought, salinity, and Al3+ toxicity), indicating broad adaptability and high multi-trait stability, with performance close to that of the ideotype under the different abiotic stresses. In contrast, the other genotypes presented more specific adaptation patterns. Cultivar G3 was coincidence only between the control and drought stress, suggesting good performance under water deficit but a limited response under salinity and Al3+ toxicity. Cultivar G11 was selected from a salinity environment (Figure 5). Salinity causes excess Na+ and K+ imbalance; tolerant cultivars maintain lower Na+ and higher K+ levels in leaves and exhibit better root and shoot growth [36,39]. In turn, cultivar G1 occurred exclusively at the intersection between the control and Al3+ toxicity, indicating that it is a promising material for acidic conditions and the presence of Al3+.
According to [30], under abiotic stress conditions, some growth metabolites, such as oxalic acid, sophorose, and turanose are increased, whereas butanoic acid, tropic acid, glycine, propionic acid, and phosphonoacetic acid decrease. In this context, the accumulation of certain amino acids, particularly proline, plays a relevant role in plant drought tolerance. Among the main organic acids of plants, succinic acid was associated with the response to mild drought stress, whereas aspartic acid increased more strongly under severe drought stress. Thus, the modulation of different metabolites in wheat plants can increase a crop’s ability to cope with water stress during the early stages of development, activating rapid and comprehensive tolerance mechanisms [29,30].
The response of wheat cultivars to abiotic stresses revealed that the expression of the genes SHN1, DREB6, NHX2, and AVP1 was strongly induced under heat, salinity, and drought stress, with these genes being associated with the response to these stresses [1]. Thus, these marker genes can be used to identify wheat cultivars that are tolerant to the multiple stresses in breeding programs [1]. Under Al3+ toxicity conditions, tolerant wheat cultivars accumulated more Al3+ in the apoplast, indicating that the accumulation of Al3+ in the apoplast is also involved in the Al3+ tolerance mechanism with the addition of organic acid exudation [33].

4. Conclusions

Abiotic stresses limit the initial growth and vigor of wheat plants, with cultivar responses depending on the nature of the stress. Drought induced the greatest limitation for plant growth and biomass accumulation, whereas salinity and aluminum toxicity had the greatest impact on vigor and root development. Multivariate analyses revealed genetic variability among wheat cultivars and allowed the identification of genotypes with greater proximity to the ideotype in each plant growing environment. The MGIDI proved efficient in multi-trait selection, highlighting the cv. ORS Feroz (cultivar 10) as the closest to the ideotype and with greater adaptability to multiple abiotic stresses.

Author Contributions

Conceptualization, A.M.Z. and F.C.d.S.S.; methodology, A.M.d.O. and F.S.; validation, J.G.A.; F.S. and A.A.D.; formal analysis, L.M.-A.; investigation, J.F.F.B.G.; resources, C.Z.A. and A.M.Z.; writing—original draft preparation, A.M.Z. and C.Z.A.; writing—review and editing, F.C.d.S.S., F.S. and J.G.A. All authors have read and agreed to the published version of the manuscript.

Funding

This study was financed in part by the Coordenação de Aperfeiçoamento de Pessoal de Nível Superior—Brasil (CAPES), Finance Code 001 and Federal University of Mato Grosso do Sul (UFMS/MEC) in Brazil.

Data Availability Statement

The original contributions presented in this study are included in the article. Further inquiries can be directed to the corresponding author.

Acknowledgments

This study was conducted with support from the Federal University of Mato Grosso do Sul (UFMS/MEC) in Brazil.

Conflicts of Interest

The authors declare no conflicts of interest.

Abbreviations

The following abbreviations are used in this manuscript:
EEmergence
PHPlant height
RLRoot length
TPLTotal plant length
SDMShoot dry matter
RDMRoot dry matter
TDMTotal plant dry matter
RSRRoot-to-shoot ratio
LVILength vigor index
WVIWeight vigor index
ANOVAAnalysis of variance
σ G 2 Genotypic variance
σ G A 2 Variance in the cultivar–stress interaction
H2Broad-sense heritability
CVg/CVeRatio between the genotypic and residual coefficients of variation
PCAPrincipal component analysis
MGIDIMulti-trait genotype–ideotype distance index

References

  1. Kumar, R.; Masthigowda, M.H.; Kaur, A.; Bhusal, N.; Pandey, A.; Kumar, S.; Mishra, C.; Singh, G.; Singh, G.P. Identification and Characterization of Multiple Abiotic Stress Tolerance Genes in Wheat. Mol. Biol. Rep. 2020, 47, 8629–8643. [Google Scholar] [CrossRef] [PubMed]
  2. OECD (Organization for Economic Co-Operation and Development); FAO (Food and Agriculture Organization of the United Nations). OECD-FAO Agricultural Outlook 2025–2034; OECD: Paris, France; FAO: Rome, Italy, 2025. [Google Scholar] [CrossRef]
  3. Ribeiro, J.P.O.; Sousa, D.J.P.; Carvalho, C.G.; Willmann, G.O.; Dias, D.C.F.S.; Nardino, M. Wheat Genotypes Selection via Multi-Trait for Abiotic Stresses. Ciênc. Rural 2024, 54, e20230280. [Google Scholar] [CrossRef]
  4. Traye, I.D.; Oli, N.M.; Zheng, H.; Wang, K.; Shi, Y.; Meng, T.; Zhu, G.; Zhou, G.; Xu, Y. Germination Dynamics and Seedling Development of Wheat Under Various Ionic Salt Stresses. Plants 2026, 15, 1671. [Google Scholar] [CrossRef] [PubMed]
  5. Alam, M.N.; Islam, Z.; Farukh, M.A.; Chan, Z.; Akhter, M.; Abedin, T.; Hossain, M. Detrimental Effects of Abiotic Stress on Wheat and its Management Techniques. Cereal Res. Commun. 2025, 53, 873–886. [Google Scholar]
  6. Reed, R.C.; Bradford, K.J.; Khanday, I. Seed Germination and Vigor: Ensuring Crop Sustainability in a Changing Climate. Heredity 2022, 128, 450–459. [Google Scholar] [CrossRef] [PubMed]
  7. Vuković, R.; Čamagajevac, I.Š.; Vuković, A.; Šunić, K.; Begović, L.; Mlinarić, S.; Sekulić, R.; Sabo, N.; Španić, V. Physiological, Biochemical and Molecular Response of Different Winter Wheat Varieties under Drought Stress at Germination and Seedling Growth Stage. Antioxidants 2022, 11, 693. [Google Scholar] [CrossRef] [PubMed]
  8. Sharma, S.; Bhatt, S.; Yadav, S.K.B.; Poudel, M. A Comprehensive Review on Drought Stress in Wheat: Causes, Mechanism and Management Practices. Arch. Agric. Environ. Sci. 2025, 10, 164–174. [Google Scholar] [CrossRef]
  9. Argentel-Martínez, L.; Peñuelas-Rubio, O.; Pérez-López, L.; Aguilera, J.G.; Steiner, F.; Zuffo, A.M.; Ratke, R.F. Assessing Salinity, Drought and High Temperature Stress in Maize (Zea mays L.) and Wheat (Triticum aestivum L.) Varieties: Theoretical Combination as Multifactorial Stress. J. Agron. Crop Sci. 2024, 210, e70001. [Google Scholar] [CrossRef]
  10. Ofoe, R.; Thomas, R.H.; Asiedu, S.K.; Wang-Pruski, G.; Fofana, B.; Abbey, L. Aluminum in Plant: Benefits, Toxicity and Tolerance Mechanisms. Front. Plant Sci. 2023, 13, e1085998. [Google Scholar] [CrossRef] [PubMed]
  11. Alsamadany, H.; Alzahrani, Y.; Shah, Z.H. Physiomorphic and Molecular-Based Evaluation of Wheat Germplasm under Drought and Heat Stress. Front. Plant Sci. 2023, 14, e1107945. [Google Scholar] [CrossRef] [PubMed]
  12. Nyaupane, S.; Poudel, M.R.; Panthi, B.; Dhakal, A.; Paudel, H.; Bhandari, R. Drought Stress Effect, Tolerance, and Management in Wheat—A Review. Cogent Food Agric. 2024, 10, e2296094. [Google Scholar] [CrossRef]
  13. Tomkins, M. Towards Modelling Emergence in Plant Systems. Quant. Plant Biol. 2023, 4, e6. [Google Scholar] [CrossRef] [PubMed]
  14. Al-Ashkar, I.; Sallam, M.; Ibrahim, A.; Ghazy, A.; Al-Suhaibani, N.; Ben Romdhane, W.; Al-Doss, A. Identification of Wheat Ideotype under Multiple Abiotic Stresses and Complex Environmental Interplays by Multivariate Analysis Techniques. Plants 2023, 12, 3540. [Google Scholar] [CrossRef] [PubMed]
  15. Michel, B.E.; Kaufmann, M.R. The Osmotic Potential of Polyethylene Glycol 6000 1. Plant Physiol. 1973, 51, 914–916. [Google Scholar] [CrossRef] [PubMed]
  16. Hillel, D. Soil and Water: Physical Principles and Processes; Academic Press: New York, NY, USA, 1971. [Google Scholar]
  17. Duart, V.M.; Caires, E.F.; Oliveira, É.C.; Matiello, R.R. Magnesium Alleviates Aluminum Toxicity in Wheat and Maize Seedlings. Technol. Agron. 2024, 4, e025. [Google Scholar] [CrossRef]
  18. Paterniani, M.E.A.G.Z.; Furlani, P.R. Aluminium Toxicity Tolerance of Maize Inbred Lines and Hybrids Evaluated in Nutrient Solution. Bragantia 2002, 61, 11–16. [Google Scholar]
  19. Ministry of Agriculture, Livestock and Supply. Rules for Seed Analysis; Ministry of Agriculture, Livestock and Supply: Brasília, Brazil, 2009.
  20. Abdul-Baki, A.A.; Anderson, J.D. Vigor Determination in Soybean Seed by Multiple Criteria. Crop Sci. 1973, 13, 630–633. [Google Scholar] [CrossRef]
  21. Olivoto, T.; Nardino, M. MGIDI: Toward an Effective Multivariate Selection in Biological Experiments. Bioinformatics 2021, 37, 1383–1389. [Google Scholar] [PubMed]
  22. R Core Team. R: A Language and Environment for Statistical Computing; R Core Team: Vienna, Austria, 2023. [Google Scholar]
  23. Dadshani, S.; Sharma, R.C.; Baum, M.; Ogbonnaya, F.C.; Léon, J.; Ballvora, A. Multi-Dimensional Evaluation of Response to Salt Stress in Wheat. PLoS ONE 2019, 14, e0222659. [Google Scholar] [CrossRef] [PubMed]
  24. Ehtaiwesh, A.; Sunoj, V.S.J.; Djanaguiraman, M.; Prasad, P.V.V. Response of Winter Wheat Genotypes to Salinity Stress under Controlled Environments. Front. Plant Sci. 2024, 15, e1396498. [Google Scholar] [CrossRef] [PubMed]
  25. Kopittke, P.M.; Moore, K.L.; Lombi, E.; Gianoncelli, A.; Ferguson, B.J.; Blamey, F.P.C.; Menzies, N.W.; Nicholson, T.M.; McKenna, B.A.; Wang, P. Identification of the Primary Lesion of Toxic Aluminum in Plant Roots. Plant Physiol. 2015, 167, 1402–1411. [Google Scholar] [CrossRef] [PubMed]
  26. Pereira, J.F.; Barichello, D.; Ferreira, J.R.; Aguilera, J.G.; Consoli, L.; Silva Júnior, J.P.; Bonow, S.; Cargnin, A. TaALMT1 and TaMATE1B Allelic Variability in a Collection of Brazilian Wheat and Its Association with Root Growth on Acidic Soil. Mol. Breed. 2015, 35, e169. [Google Scholar] [CrossRef]
  27. Aguilera, J.G.; Minozzo, J.A.D.; Barichello, D.; Fogaça, C.M.; Silva, J.P.; Consoli, L.; Pereira, J.F. Alleles of Organic Acid Transporter Genes Are Highly Correlated with Wheat Resistance to Acidic Soil in Field Conditions. Theor. Appl. Genet. 2016, 129, 1317–1331. [Google Scholar] [CrossRef] [PubMed]
  28. Hajiboland, R.; Panda, C.K.; Lastochkina, O.; Gavassi, M.A.; Habermann, G.; Pereira, J.F. Aluminum Toxicity in Plants: Present and Future. J. Plant Growth Regul. 2023, 42, 3967–3999. [Google Scholar]
  29. Pereira, J.F.; Cunha, G.R.; Moresco, E.R. Improved Drought Tolerance in Wheat is Required to Unlock the Production Potential of the Brazilian Cerrado. Crop Breed. Appl. Biotechnol. 2019, 19, 217–225. [Google Scholar] [CrossRef]
  30. Spanic, V.; Duvnjak, J.; Hefer, D.; D’Auria, J.C. Changes in Metabolites Produced in Wheat Plants Against Water-Deficit Stress. Plants 2025, 14, e10. [Google Scholar]
  31. Riyaz, I.; Zaffar, A.; Fatima, S.; Shafi, S.; Bhat, R.; Showkat, S.; Khan, T.; Wani, F.J.; Zargar, S.M.; Prasad, P.V.V. Identification of Water Deficit Stress Tolerant Genotypes of Common Bean Using Adaptive Root and Shoot Traits under Different Screening Systems. Sci. Rep. 2025, 15, e19888. [Google Scholar] [CrossRef] [PubMed]
  32. Eziz, A.; Yan, Z.; Tian, D.; Han, W.; Tang, Z.; Fang, J. Drought Effect on Plant Biomass Allocation: A Meta-Analysis. Ecol. Evol. 2017, 7, 11002–11010. [Google Scholar] [CrossRef] [PubMed]
  33. Iqbal, T. Effect of Elevated Al and pH on the Growth and Root Morphology of Al-Tolerant and Al-Sensitive Wheat Seedlings in an Acid Soil. Span. J. Soil Sci. 2014, 4, 61–77. [Google Scholar] [CrossRef]
  34. Dell’aversana, E.; Hessini, K.; Ferchichi, S.; Fusco, G.M.; Woodrow, P.; Ciarmiello, L.F.; Abdelly, C.; Carillo, P. Salinity Duration Differently Modulates Physiological Parameters and Metabolites Profile in Roots of Two Contrasting Barley Genotypes. Plants 2021, 10, 307. [Google Scholar] [CrossRef]
  35. Shelden, M.C.; Munns, R. Crop Root System Plasticity for Improved Yields in Saline Soils. Front. Plant Sci. 2023, 14, 1120583. [Google Scholar] [CrossRef] [PubMed]
  36. Robin, A.H.K.; Matthew, C.; Uddin, M.J.; Bayazid, K.N. Salinity-Induced Reduction in Root Surface Area and Changes in Major Root and Shoot Traits at the Phytomer Level in Wheat. J. Exp. Bot. 2016, 67, 3719–3729. [Google Scholar] [CrossRef] [PubMed]
  37. Aguilera, J.G.; Teodoro, P.E.; Silva-Junior, J.P.; Pereira, J.F.; Zuffo, A.M.; Consoli, L. Selection of Aluminum-Resistant Wheat Genotypes Using Multienvironment and Multivariate Indices. Agron. J. 2019, 111, 2804–2810. [Google Scholar] [CrossRef]
  38. Silva-Júnior, A.C.; Sant’Anna, I.C.; Siqueira, M.J.S.; Cruz, C.D.; Azevedo, C.F.; Nascimento, M.; Soares, P.C. Multi-Trait and Multi-Environment Bayesian Analysis to Predict the G x E Interaction in Flood-Irrigated Rice. PLoS ONE 2022, 17, e0259607. [Google Scholar] [CrossRef] [PubMed]
  39. Saddiq, M.S.; Iqbal, S.; Hafeez, M.B.; Ibrahim, A.M.H.; Raza, A.; Fatima, E.M.; Baloch, H.; Jahanzaib; Woodrow, P.; Ciarmiello, L.F. Effect of Salinity Stress on Physiological Changes in Winter and Spring Wheat. Agronomy 2021, 11, 1193. [Google Scholar] [CrossRef]
Figure 1. Boxplot of the effect of the growing environment on the emergence rate (a), plant height (b), root length (c), total plant length (d), shoot dry matter (e), root dry matter (f), total dry matter (g), length vigor index (h), weight vigor index (i), and root-to-shoot ratio (j) of 12 wheat cultivars. • is an outlier. The total number of samples (n) for each growing environment was 48.
Seeds 05 00034 g001
Figure 2. Scatter and correlation matrix between the morphological traits of wheat plants grown under non-stressful (control) and stressful (drought, salinity, and Al3+ toxicity) conditions. The density plots of the morphological traits are presented on the main diagonal; below the diagonal, the scatter plots; and above the diagonal, the Pearson correlation coefficients, which are calculated separately for each abiotic stress environment. The colors represent the different plant growing environment. Abbreviations: E: emergence rate; PH: plant height; RL: root length; TPL: total plant length; SDM: shoot dry matter; RDM: root dry matter; TDM: total dry matter; RSR: root-to-shoot ratio; LVI: length vigor index; WVI: weight vigor index. *, ** and *** indicate, respectively, a significant correlation at 5%, 1%, and 0.1% by the “t” test.
Seeds 05 00034 g002
Figure 3. Principal component analysis (PCA) of the morphological traits of 12 wheat cultivars grown under non-stressful (control) and stressful (drought, salinity, and Al3+ toxicity) conditions. Abbreviations: E: emergence rate; PH: plant height; RL: root length; TPL: total plant length; SDM: shoot dry matter; RDM: root dry matter; TDM: total dry matter; LVI: length vigor index; WVI: weight vigor index; RSR: root-to-shoot ratio.
Seeds 05 00034 g003
Figure 4. Multi-trait genotype–ideotype distance index (MGIDI) is used for the selection of wheat cultivars grown under non-stressful and stressful conditions. Plants grown in control (a), drought stress (b), salinity stress (c) and Al3+ toxicity (d) conditions. The lines connecting the wheat cultivars are a visual aid to facilitate comparison between MGIDI values and do not represent quantitative relationships between the cultivars.
Seeds 05 00034 g004
Figure 5. Venn diagram indicating the coincidence of selected wheat cultivars grown under non-stressful (control) and stressful (drought, salinity, and Al3+ toxicity) conditions, based on the multi-trait genotype–ideotype distance index (MGIDI).
Seeds 05 00034 g005
Table 1. Agronomic characteristics of the 12 Brazilian wheat cultivars used in this study.
NumberCultivar NameAgronomic Characteristics
Maturation CyclePlant SizeInitial Growth Rate
1TBIO AtonMediumMediumMedium/High
2TBIO SintoniaEarlyMediumMedium
3BRS 404Early/MediumMediumMedium
4BRS 264Super EarlyMediumMedium
5TBIO CalibreSuper EarlyLowMedium
6Biotrigo ValenteMedium/EarlyHighMedium
7TBIO DuqueEarlyMedium/LowMedium
8BIO 190038EarlyMediumMedium
9TBIO SossegoMediumMedium/HighMedium
10ORS FerozEarlyLowMedium
11TBIO ConvictoMedium/LateMedium/HighMedium/High
12TBIO TrunfoEarlyMedium/HighMedium
Table 2. F-value and genetic parameters for the emergence rate (E), plant height (PH), root length (RL), total plant length (TPL), shoot dry matter (SDM), root dry matter (RDM), total dry matter (TDM), root-to-shoot ratio (RSR), length vigor index (LVI) and weight vigor index (WVI) of 12 wheat cultivars grown under different abiotic stresses.
-----E----------PH----------RL----------TPL----------SDM-----
Cultivar (C)103.168**29.640**26.96**24.667**22.919**
Stress (S)91.163**266.368**146.115**96.852**161.999**
C × S31.422**3.907**4.779**6.103**4.470**
CV (%)2.064 5.228 6.464 4.495 7.104
p-value Shapiro-Wilk0.182ns0.368ns0.819ns0.258ns0.427ns
σ G 2 16.411 2.347 3.830 5.589 1.548
σ G A 2 25.514 0.972 2.393 5.633 1.068
H 2   ( % ) 69.543 86.818 82.274 75.259 80.495
CVg/CVe2.118 1.268 1.178 1.077 1.074
-----RDM----------TDM----------RSR----------LVI----------WVI-----
Cultivar (C)26.980ns19.040**38.430**62.778**31.262**
Stress (S)496.337**23.139**1000.408**144.436**32.082**
C × S16.482**6.586**18.227**9.687**6.227**
CV (%)7.999 6.064 9.215 4.817 6.955
p-value Shapiro–Wilk0.539ns0.340ns0.009ns0.057ns0.391ns
σ G 2 0.390 1.928 0.004 15.835 0.044
σ G A 2 2.109 3.170 0.013 9.501 0.033
H 2   ( % ) 38.912 65.413 52.572 84.569 80.081
CVg/CVe0.810 0.882 1.124 1.822 1.251
** and ns: significant at 1% probability and not significant according to the F test, respectively; n and nn: indicates, respectively, normal distribution and non-normal distribution according to the Shapiro–Wilk test at a 5% probability level; MS: mean square; CV (%): coefficient of variation; σ G 2 : genotypic variance; σ G A 2 : variance of the interaction between cultivar and stress; H 2   ( % ) : broad-sense average heritability; CVg/CVe: ratio between genotypic and residual coefficient of variation.
Disclaimer/Publisher’s Note: The statements, opinions and data contained in all publications are solely those of the individual author(s) and contributor(s) and not of MDPI and/or the editor(s). MDPI and/or the editor(s) disclaim responsibility for any injury to people or property resulting from any ideas, methods, instructions or products referred to in the content.