Article

Field Evaluation of Salt Stress and Fertilization Effects (Organic and Inorganic) on Seed Yield, Proximate Seed Composition, Seed Elemental Composition and Protein Content in Fenugreek

by
Antigolena Folina
1,*,
Aspasia Efthimiadou
2,
Panteleimon Stavropoulos
1,
Antonios Mavroeidis
1,
Ioanna Kakabouki
1,
Eleni Tsiplakou
3 and
Dimitrios Bilalis
1
1
Laboratory of Agronomy, Department of Crop Science, Agricultural University of Athens, 11855 Athens, Greece
2
Institute of Soil and Water Resources, Department of Soil Science of Athens, Hellenic Agricultural Organization DEMETER, 14123 Lykovrissi, Greece
3
Laboratory of Nutritional Physiology & Feeding, Department of Animal Science, Agricultural University of Athens, 11855 Athens, Greece
*
Author to whom correspondence should be addressed.
Submission received: 27 November 2024 / Revised: 25 January 2025 / Accepted: 6 February 2025 / Published: 10 February 2025

Abstract

:
The chemical quality of fenugreek seeds is a critical factor influencing their nutritional value, medicinal properties, and suitability for agricultural and industrial applications, making it essential to evaluate their biochemical composition and functional potential. This study evaluated the effects of salinity and different fertilization types on seed quality, early growth parameters, and key biochemical characteristics during fenugreek (Trigonella foenum-graecum L.) cultivation. A field experiment was established at the Agricultural University of Athens during the cropping period 2019–2020 (Year A) and 2020–2021 (Year B) in a split-plot design with the five main fertilization treatments Biocyclic-Vegan Humus Soil (BVH), Farmyard Manure (FM), Organic Compost (OC), Inorganic Fertilizer (IF; 11-14-14), and No Treatment Control (NTC) and two treatments: Elevated Salinity (ES) and Normal Salinity (NS). Fertilization significantly influenced various agronomic traits and seed compositions across both experimental years. The evaluation showed that organic fertilization with BVH yielded the best results among the treatments studied. The BVH × NS treatment consistently produced the highest plant height, seed protein content, seed yield, and mineral content, including nitrogen, calcium, and potassium, compared to the other treatments. ES impacted the concentrations of several elements, namely N (%), Ca (g/100 g), K (g/100 g), Fe (ppm), P (%), and Mg (g/100 g). Salinity also affected certain traits, such as Seed Total Ash and Dry Matter content, with significant interactions observed. These findings highlight the critical role of fertilization, especially organic fertilization, in improving both agronomic performance and seed nutritional quality in the studied crops, as well as in mitigating the adverse effects of salinity.

1. Introduction

Fenugreek (Trigonella foenum-graecum) is an annual herb widely cultivated for its seeds and leaves and is valued for both culinary and medicinal uses [1,2]. Native to the Mediterranean and parts of Asia, it is rich in nutrients like proteins, fiber, and essential minerals [2,3]. Fenugreek seeds are commonly used as spices and in traditional medicine, known for their health benefits, including blood sugar regulation, digestive aid, and anti-inflammatory properties [4,5,6]. Its adaptability to various climatic conditions and its role in agriculture, nutrition, and pharmaceuticals make fenugreek an important crop worldwide. Fenugreek seeds are small, about 2–3 mm long, with an irregular, slightly cuboid, or rhomboid shape. Their color ranges from yellow−brown to dark brown. The surface is smooth, but may feature slight ridges or irregularities [7].
Fenugreek (Trigonella foenum-graecum L.) seeds are highly valued components of this leguminous crop, offering a wide range of nutritional, medicinal, and agricultural benefits. Nutrient-dense, these seeds consist of 20–30% protein, 6–7% fat, and 55–60% carbohydrates, with a significant portion being dietary fiber [8,9,10]. They are rich in essential amino acids such as lysine and tryptophan, as well as vitamins including niacin, folic acid, and vitamin C, and minerals like iron, calcium, magnesium, and potassium, making them a powerhouse of nutrients [11]. Fenugreek seeds are also abundant in bioactive compounds, notably saponins, flavonoids, and alkaloids such as trigonelline and diosgenin, which are precursors for steroidal drug synthesis [12]. These phytochemicals contribute to their strong antioxidant, anti-inflammatory, and antidiabetic properties, which have been recognized in traditional medicinal systems like Ayurveda and Chinese medicine [13]. Medicinally, the seeds are acclaimed for their role in managing diabetes by lowering blood glucose levels and improving insulin sensitivity, as well as aiding digestion, supporting lactation, and addressing conditions such as high cholesterol, hormonal imbalances, and skin disorders [13]. Another important use of fenugreek is as animal feed or as a supplement in diets due to its high protein content and beneficial bioactive components [14]. From an agricultural perspective, fenugreek seeds are significant due to the plants’ nitrogen-fixing capabilities, which enhance soil fertility, making them a valuable addition to crop rotation systems [15]. The plant’s ability to thrive under drought, heat, and saline soil conditions further emphasizes its importance in agriculture, particularly in regions with marginal lands. The culinary uses of fenugreek seeds are equally notable, with their distinctive bitter-sweet flavor making them a popular spice in Indian, Middle Eastern, and North African cuisine. Often roasted to reduce bitterness, they are used in spice blends like curry powder and contribute to the flavor and nutritional quality of a variety of dishes [16]. Their multifaceted benefits make fenugreek seeds make the fenugreek plant an indispensable crop for health, agriculture, and gastronomy.
Fertilization and salinity stress significantly influence fenugreek seed performance [17,18,19]. Fertilization, especially organic methods, can enhance nutrient uptake efficiency and mitigate the effects of salinity [20]. However, high salinity levels negatively impact germination, growth, and yield by disrupting water absorption and nutrient balance [21]. Studies indicate that integrating proper fertilization strategies, such as compost or manure, helps improve fenugreek’s resilience to salinity, promoting better physiological and biochemical responses under stress conditions [15,20,22].
Studying the effects of fertilization and salinity on fenugreek can reveal their environmental impacts. By understanding how different fertilizers and soil conditions influence plant growth, it is possible to reduce negative outcomes, such as nutrient runoff and soil degradation. Additionally, this research aims to better understand the interactions between soil conditions, fertilization methods, and salinity levels, as well as their effects on fenugreek plant growth and nutritional composition. This study specifically investigates seed yield, proximate seed composition, seed elemental composition, and protein content in fenugreek, aiming to delineate the complex interactions among soil conditions, various fertilization approaches, and salinity levels, assessing their cumulative effects on the growth and nutritional profile of the plant. It identifies optimal fertilization strategies that enhance plant growth while assessing how soil salinity impacts micronutrient uptake. The researchers acknowledge existing studies on fertilization and drought tolerance in this species; however, they emphasize that their investigation is novel in its focus on biocyclic-vegan fertilization—a previously unexplored area. Additionally, this research is aligned with the principles of retroinnovation, advocating for the reintroduction of this crop as a response to the challenges posed by climate change. The selected research site offers unique environmental conditions that are ideally suited for assessing the specific impacts of innovative fertilization techniques in evolving stress scenarios. The outcomes of this study are anticipated to offer valuable insights into sustainable agricultural practices, facilitating effective fenugreek cultivation in regions with challenging soil environments. These findings could have practical applications in sustainable agricultural management, providing insights for the effective cultivation of fenugreek, especially in regions with challenging soil conditions.

2. Materials and Methods

2.1. Experimental Location and Setup

Fenugreek cultivation trials were conducted over two consecutive growing seasons at the Agronomy Laboratory of the Agricultural University of Athens, specifically within the arable crops section. The experiment spanned the 2019–2020 season (Year A) and continued into 2020–2021 (Year B), focusing on a single fenugreek genus, Trigonella foenum-graecum. This genus was selected to minimize variability and to focus on evaluating the effects of salt stress and fertilization treatments on the measured traits. This approach allows for a more controlled assessment of the environmental and management factors under investigation without the confounding influence of genetic variability. In Year A, total precipitation measured 309.00 mm; precipitation data for Year B was also recorded up to 289.50 mm. The field soil was classified as clay loam (CL), slightly alkaline, with a satisfactory soil organic matter (SOM) content of 2.37%. The site contained 29.8% calcium carbonate (CaCO3), with nitrogen (N), phosphorus (P), and potassium (K) concentrations of 101.2 mg/L, 20.2 mg/L, and 234 mg/L, respectively.
A split-plot experimental design was used, incorporating 15 large experimental units. The primary variable was fertilization, with five treatments: Biocyclic-Vegan Humus Soil (BVH), Farmyard Manure (FM), Organic Compost (OC), Inorganic Fertilizer (IF; 11-14-14), and No Treatment Control (NTC). The secondary variable was salinity, with two treatments: Elevated Salinity (ES) and Normal Salinity (NS). Within each large unit, 30 smaller plots were arranged in three randomized blocks. Sowing was performed manually at a row spacing of 30 cm, with a seeding rate of 32 kg/ha.
The fertilization treatments—BVH, FM, OC, and IF—were applied at a consistent nitrogen rate of 110 kg N/ha. BVH, a vegan alternative to animal-based fertilizers, was applied at 3.928 tons/ha, with an organic matter content of 46.3 g/100 g, nitrogen content of 2.8 g per 100 g, and a pH of 7.6. The compost, a commercial mixture, was applied at 9.166 tons ha−1, consisting of 70% compost, 15% black peat, organic materials, 10% perlite, and 5% soil, with a pH of 5.5–6.8 and nitrogen content of 1.2%. FYM, sourced from the university’s stables, was applied at 6.875 tons/ha, with a pH of 7.39, total nitrogen of 1.60%, phosphorus (Olsen) at 8.9 mg/L, and organic carbon at 4.4%. The inorganic NPK (11-14-14) was applied at a rate of 1 ton/ha. Salinity treatment began one week after sowing, with 200 kg/ha of NaCl applied to the surface of the large experimental units, while the control plots (NS) received no NaCl. High salinity conditions simulate the challenges of soil salinization in arid and semi-arid areas, providing insights into crop resilience under saline stress. The application of a salinity level of 200 kg NaCl per hectare was selected based on its alignment with salinity stress levels used in similar experimental studies and its relevance to moderately saline conditions, often reported in agricultural research. The electrical conductivity (EC) of the soil was measured, with EC values recorded at 1.46 dS/m for NS and 3.52 dS/m for ES. This level simulates the salinity levels that can be observed in soils affected by irrigation water with moderate salinity or natural soil salinization in semi-arid and arid regions. No irrigation system was used in this study. The crop was sown at the start of the winter season, relying entirely on natural rainfall to meet the water requirements. Rainfall facilitated the dissolution and incorporation of the applied NaCl into the soil. While there was a risk of surface accumulation potentially affecting some plants, this was an intentional aspect of the experimental design to observe the crop’s reaction to such conditions and assess its tolerance to salinity stress in a rain-fed system.

2.2. Harvesting

The crop was harvested from each plot when 90% of the plants were mature. Seed yield was measured on harvest day 180 Days After Sowing (DAS). Sampling was performed using a 0.25 m2 quadrat, with one quadrat collected per treatment. The samples were then transported to the lab, weighed, and processed using a Wintersteiger id 180 st4 laboratory threshing machine (Wintersteiger AG, Ried im Innkreis, Austria). The Wintersteiger id 180 st4 is designed for individual plants, bundles, and small plots and is capable of threshing a wide range of crops, from small vegetable seeds to large beans. The harvested samples did not require drying.

2.3. Measurements and Analyses

Before harvest, the measurements of Plant Height, Νο Pods per Plant, No Double Pods per Plant, Pod Length, and No Seed per Pod were noticed at 130 DAS, with an average of three plants per plot. Post-harvest, the Thousand Seed Weight (TSW; g) at 14% humidity and Seed yield (kg/ha) were determined. For the assessment of morphological variables of the plants, seed quality variables, proximate seed variables, and the measurement of organic and inorganic elements, three samples were collected from each plot, ensuring robust statistical analysis and comprehensive data collection. This approach provided a sample size of n = 3 for each plot across all treatments and conditions, facilitating a thorough evaluation of the impacts of fertilization and salinity on fenugreek growth and seed characteristics.
For forage chemical analysis, the fenugreek seed samples were crushed to pass through a 1 mm Wiley mill screen (Thomas T4274.E15 Steel Model 4 Wiley Mill; Arthur H. Thomas, Philadelphia, PA, USA) to ensure uniformity in sample preparation. The samples were assessed using a fully automated Kjeldahl analyzer (Kjeltec 8400; Foss Tecator AB, Höganas, Sweden). The ground seeds were then subjected to various analyses to determine their crude ash, dry matter, crude fat, crude fiber, and crude protein contents using methods specified in the Association of Official Agricultural Chemists (AOAC) manual. The crude protein content was calculated by multiplying the nitrogen concentration by 6.25, following the standard conversion factors provided in the AOAC guidelines (Table 1).
For the quantitative analysis of elemental content in fenugreek seeds, adherence to established ISO standards was maintained to ensure the accuracy and comparability of the results. These standardized methods serve as a reliable foundation for evaluating the elemental composition of seeds, facilitating comparisons across different treatment conditions, and contributing to advancements in agricultural science.
The seed protein yield is calculated to assess the efficiency of protein production per unit area, which is a critical factor in agricultural research, especially for crops like fenugreek that are valued for their nutritive content. This metric is expressed in kilograms of nitrogen per hectare (Kg N/ha). It is derived by multiplying the seed yield (kg/ha) by the crude protein content of the seeds (expressed as a percentage). The crude protein content is determined by analyzing the nitrogen content of the seeds, which is then converted to protein using a factor (commonly 6.25, assuming that protein is 16% nitrogen by mass). This conversion provides an estimate of the total protein produced, offering insights into the fertilization and environmental effects on protein synthesis efficiency (Table 1) [28].
HI is a measure of crop productivity and efficiency, calculated as the ratio of seed yield to the total biological yield (both expressed in kg/ha) multiplied by 100. It quantifies the percentage of total plant biomass converted into harvestable seeds. A higher harvest index indicates a more efficient allocation of biomass into seeds, making it a critical indicator for evaluating the effectiveness of different agricultural practices and environmental conditions on fenugreek yield efficiency. This metric is especially important for assessing how well a crop genotype performs in terms of seed production relative to its total growth (Table 1) [28].
The TP metric assesses the efficiency of biomass relocation within a plant from the vegetative parts to the reproductive parts during growth. It is calculated by subtracting the straw weight at harvest from the straw weight at flowering and dividing by the difference between the panicle weight at flowering and at harvest. This percentage indicates how effectively a plant redirects resources from its structural components (straw) to its reproductive components (panicles) toward the end of the growing season. A higher Translocation Percentage suggests more efficient resource use for seed production, which is vital for understanding plant responses to environmental conditions and management practices, ultimately affecting yield and crop quality [29,30].

2.4. Data Analysis

Statistical analyses were conducted using SigmaPlot 10 (Systat Software Inc., San Jose, CA, USA). A mixed model analysis of variance (ANOVA) was employed, with years and replications treated as random effects, and plant density and fertilization considered fixed effects. Significant differences among treatments were assessed using Tukey’s honestly significant difference (HSD) test. For all analyses, statistical significance was set at 5% (p ≤ 0.05).

3. Results

3.1. Agronomic Traits

In Year A, the effect of fertilization on plant height was highly significant (p ≤ 0.001). The highest plant height was observed in the BVH × NS treatment, measuring 74.00 cm, while the lowest was recorded in the NTC × ES treatment at 50.37 cm, resulting in a percentage difference of 32.14% between the two treatments (Table 2). The analysis of the percentage differences between the BVH × NS and BVH × ES treatment groups revealed a 0.45% increase in plant height for BVH × NS compared to BVH × ES. In Year B, fertilization again significantly affected plant height (p ≤ 0.001), with the BVH × NS treatment reaching a maximum height of 75.67 cm and the minimum in NTC × ES at 49.93 cm, showing a percentage difference of 34.75%. A comparison between BVH × NS and BVH × ES indicated a 1.34% increase in plant height in BVH × NS.
For the number of pods per plant in Year A, fertilization had a significant effect (p ≤ 0.01). The highest number of pods was found in both the BVH × ES and FM × ES treatments, while the NTC × ES treatment recorded the lowest, resulting in a percentage difference of 72.59%. However, there was a 2.12% decrease in the number of pods per plant for BVH × NS compared to BVH × ES. In Year B, significant effects from both fertilization (p ≤ 0.001) and salinity (p ≤ 0.05) were noted, with the BVH × ES and BVH × NS treatments both achieving the highest count of 38.83 pods per plant. The lowest number of pods, again in NTC × ES, was 23.06, yielding a percentage difference of 68.73%. The number of pods per plant remained unchanged between the BVH × ES and FM × ES treatments in Year A (Table 2).
The counting of double pods per plant in Year A revealed significant effects of both fertilization (p ≤ 0.001) and salinity (p ≤ 0.05). The BVH × ES treatment produced the highest count of double pods per plant, while the NTC × ES and NTC × NS treatments shared the lowest count, leading to a substantial percentage difference of 317.00% (Table 2). Additionally, BVH × NS exhibited a notable decrease of 12.00% in the number of double pods per plant compared to BVH × ES. In Year B, the effect of fertilization was again significant (p ≤ 0.001), with the BVH × ES treatment leading to 5.33 double pods per plant and the lowest count found in NTC × NS at just 0.67, which shows a remarkable percentage difference of 694.78%. BVH × NS experienced a 6.19% decrease in the number of double pods per plant compared to BVH × ES in Year B.
In Year A, pod length was significantly influenced by fertilization (p ≤ 0.001), with the longest pods recorded in the FM × NS treatment at 19.00 cm and the shortest in the NTC × ES at 10.00 cm, resulting in a percentage difference of 90.00%. In Year B, the effect of fertilization remained significant (p ≤ 0.001), with the longest pods recorded in the BVH × ES treatment at 25.00 cm and the shortest in NTC × ES at 15.33 cm, leading to a percentage difference of 63.28% (Table 2). BVH × NS showed a 3.87% increase in pod length compared to BVH × ES in Year A, with no change in pod length observed when comparing BVH × ES and FM × ES.
In Year A, fertilization had a highly significant effect on the number of seeds per pod (p ≤ 0.001) (Table 2). The highest seed count was observed in the FM × NS treatment, while the lowest count was recorded in the NTC × ES treatment, reflecting a percentage difference of 90.00%. In Year B, the effect of fertilization was similarly significant (p ≤ 0.001), with the highest seed count again found in the BVH × ES treatment, while NTC × ES recorded the lowest, resulting in a percentage difference of 63.04%. There was a 1.33% decrease in the number of seeds per pod for BVH × NS compared to BVH × ES in Year B.
Table 3 presents the effects of fertilization and salinity treatments on key agronomic parameters, including Plant Area Index (PAI), Seed Yield, Thousand Seed Weight (TSW), Harvest Index (HI), and Translocation percentage (TP) across two years of experimentation.
In Year A, the PAI was significantly affected by fertilization (p ≤ 0.001). The highest PAI was recorded in both the BVH × ES and BVH × NS treatments, whereas the lowest PAI was observed in the NTC × ES treatment, resulting in a percentage difference of 71.45% between these two extremes (Table 3). The percentage differences between BVH × NS and BVH × ES showed no variation because both treatments yielded the same PAI. In Year B, fertilization again significantly influenced PAI (p ≤ 0.001), with the highest value recorded in BVH × ES and the lowest in OC × NS, leading to a percentage difference of 74.01%. The comparison between BVH × NS and BVH × ES indicated a 1.64% decrease in the PAI for BVH × NS.
For seed yield in Year A, fertilization had a highly significant effect (p ≤ 0.001). The highest seed yield was observed in the BVH × NS treatment, while the lowest was recorded in the NTC × ES treatment, yielding a percentage difference of 85.96%. The comparison between BVH × NS and BVH × ES indicated a 45.41% increase in seed yield for BVH × NS compared to BVH × ES. In Year B, the seed yield also showed significant effects from fertilization (p ≤ 0.001), with the BVH × ES treatment leading at 2161.10 kg/ha and NTC × NS recording the lowest yield of 1255.10 kg/ha, resulting in a percentage difference of 72.62%. The difference between BVH × NS and BVH × ES in Year B was minimal, with a slight decrease of 0.88% in BVH × NS (Table 3).
In Year A, TSW was significantly influenced by fertilization (p ≤ 0.001). The highest TSW was found in the BVH × ES treatment at 16.41 g, while the lowest was in NTC × ES at 9.26 g, resulting in a notable percentage difference of 77.69% (Table 3). There was no difference in TSW between the BVH × NS and BVH × ES treatments. In Year B, TSW continued to be significantly affected by fertilization (p ≤ 0.001), with the highest weight recorded in the BVH × ES treatment at 18.33 g and the lowest in OC × NS at 11.63 g, yielding a percentage difference of 57.52%. The TSW for BVH × NS showed a 4.16% decrease compared to BVH × ES in Year B.
The harvest index in Year A demonstrated significant effects of fertilization (p ≤ 0.001), with the highest HI recorded in BVH × NS at 43.44% and the lowest in NTC × ES at 37.29%, reflecting a percentage difference of 16.65%. In Year B, HI also showed significant effects (p ≤ 0.001), with the highest HI of 47.64% in BVH × ES and the lowest of 40.79% in OC × NS, leading to a percentage difference of 16.77% (Table 3). The comparison between BVH × NS and BVH × ES in Year B indicated a slight decrease of 3.50% in HI for BVH × NS.
The TP index in Year A was significantly influenced by fertilization (p ≤ 0.001). The highest TP was found in the BVH × ES treatment at 51.06, while the lowest was recorded in NTC × NS at 35.10, resulting in a percentage difference of 45.61% (Table 3). There was no change in TP when comparing the BVH × NS and BVH × ES treatments. In Year B, the significant effects of fertilization continued (p ≤ 0.001), with the BVH × ES treatment again having the highest count of 49.68 and the lowest in OC × NS at 33.02, reflecting a percentage difference of 50.96%. A comparison between BVH × NS and BVH × ES in Year B showed a 5.75% decrease in TP for BVH × NS.

3.2. Mineral Content of Seed

The N content in the seed was significantly affected by the two treatments across both experimental years (Table 4). In Year A, the highest value was observed in the BVH × NS treatment (5.83%), while the lowest was recorded in NTC × ES (3.65%). There was no statistically significant difference in nitrogen content between the treatments IF × ES and IF × NS at different salinity levels. Similarly, there was no significant difference between the OC × ES and OC × EN treatments. In Year B, BVH × ES (5.7%) and FM × NS (5.75%) were not significantly different from each other (Figure 1).
The Ca content in the seed was significantly affected by the two treatments in both experimental years (Table 4). In Year A, the highest value was recorded in BVH × NS (0.20 g/100 g), which did not differ significantly from FM × NS (0.186 g/100 g), OC × NS (0.183 g/100 g), and BVH × ES (0.186 g/100 g) (Figure 1). In Year B, the maximum value was again observed for the same treatment combination, BVH × NS (0.213 g/100 g), which was not significantly different from OC × NS (0.200 g/100 g). The BVH × NS treatment was 7.7% higher than that of FM × NS (0.196 g/100 g).
The K content in the seed was significantly affected by the two treatments in both experimental years (Table 4). In Year A, the highest value was recorded in BVH × NS (1.23 g/100 g), which differed significantly from all other treatments (Figure 1). In Year B, the highest value was again observed in BVH × NS (1.23 g/100 g), which was 13.5% higher than FM × NS (1.06 g/100 g).
The Fe content in the seed was significantly affected by fertilization in the first experimental year (Table 4). In Year A, the highest value was recorded for BVH × NS (117 ppm), which was not significantly different from BVH × ES (110.33 ppm) and FM × NS (111.67 ppm). In Year B, it was noted that BVH × NS (124.00 ppm) and FM × NS (115.67 ppm) did not differ significantly from each other.
The P content in the seed was significantly affected by the two treatments in both experimental years. In Year A, the highest value was observed for BVH × NS (0.38%), which did not differ significantly from FM × NS (0.37%) and IF × NS (0.36%). In Year B, the highest value was recorded for BVH × NS (0.38%), which was not significantly different from IF × NS (0.37%) (Figure 1).
The Mg content in the seed was significantly affected by the fertilization treatment across both experimental years (Table 4). In Year A, the highest value was recorded for BVH × NS (0.127 g/100 g). All treatments differed significantly only from the control. Similar results were observed in Year B (Figure 1).

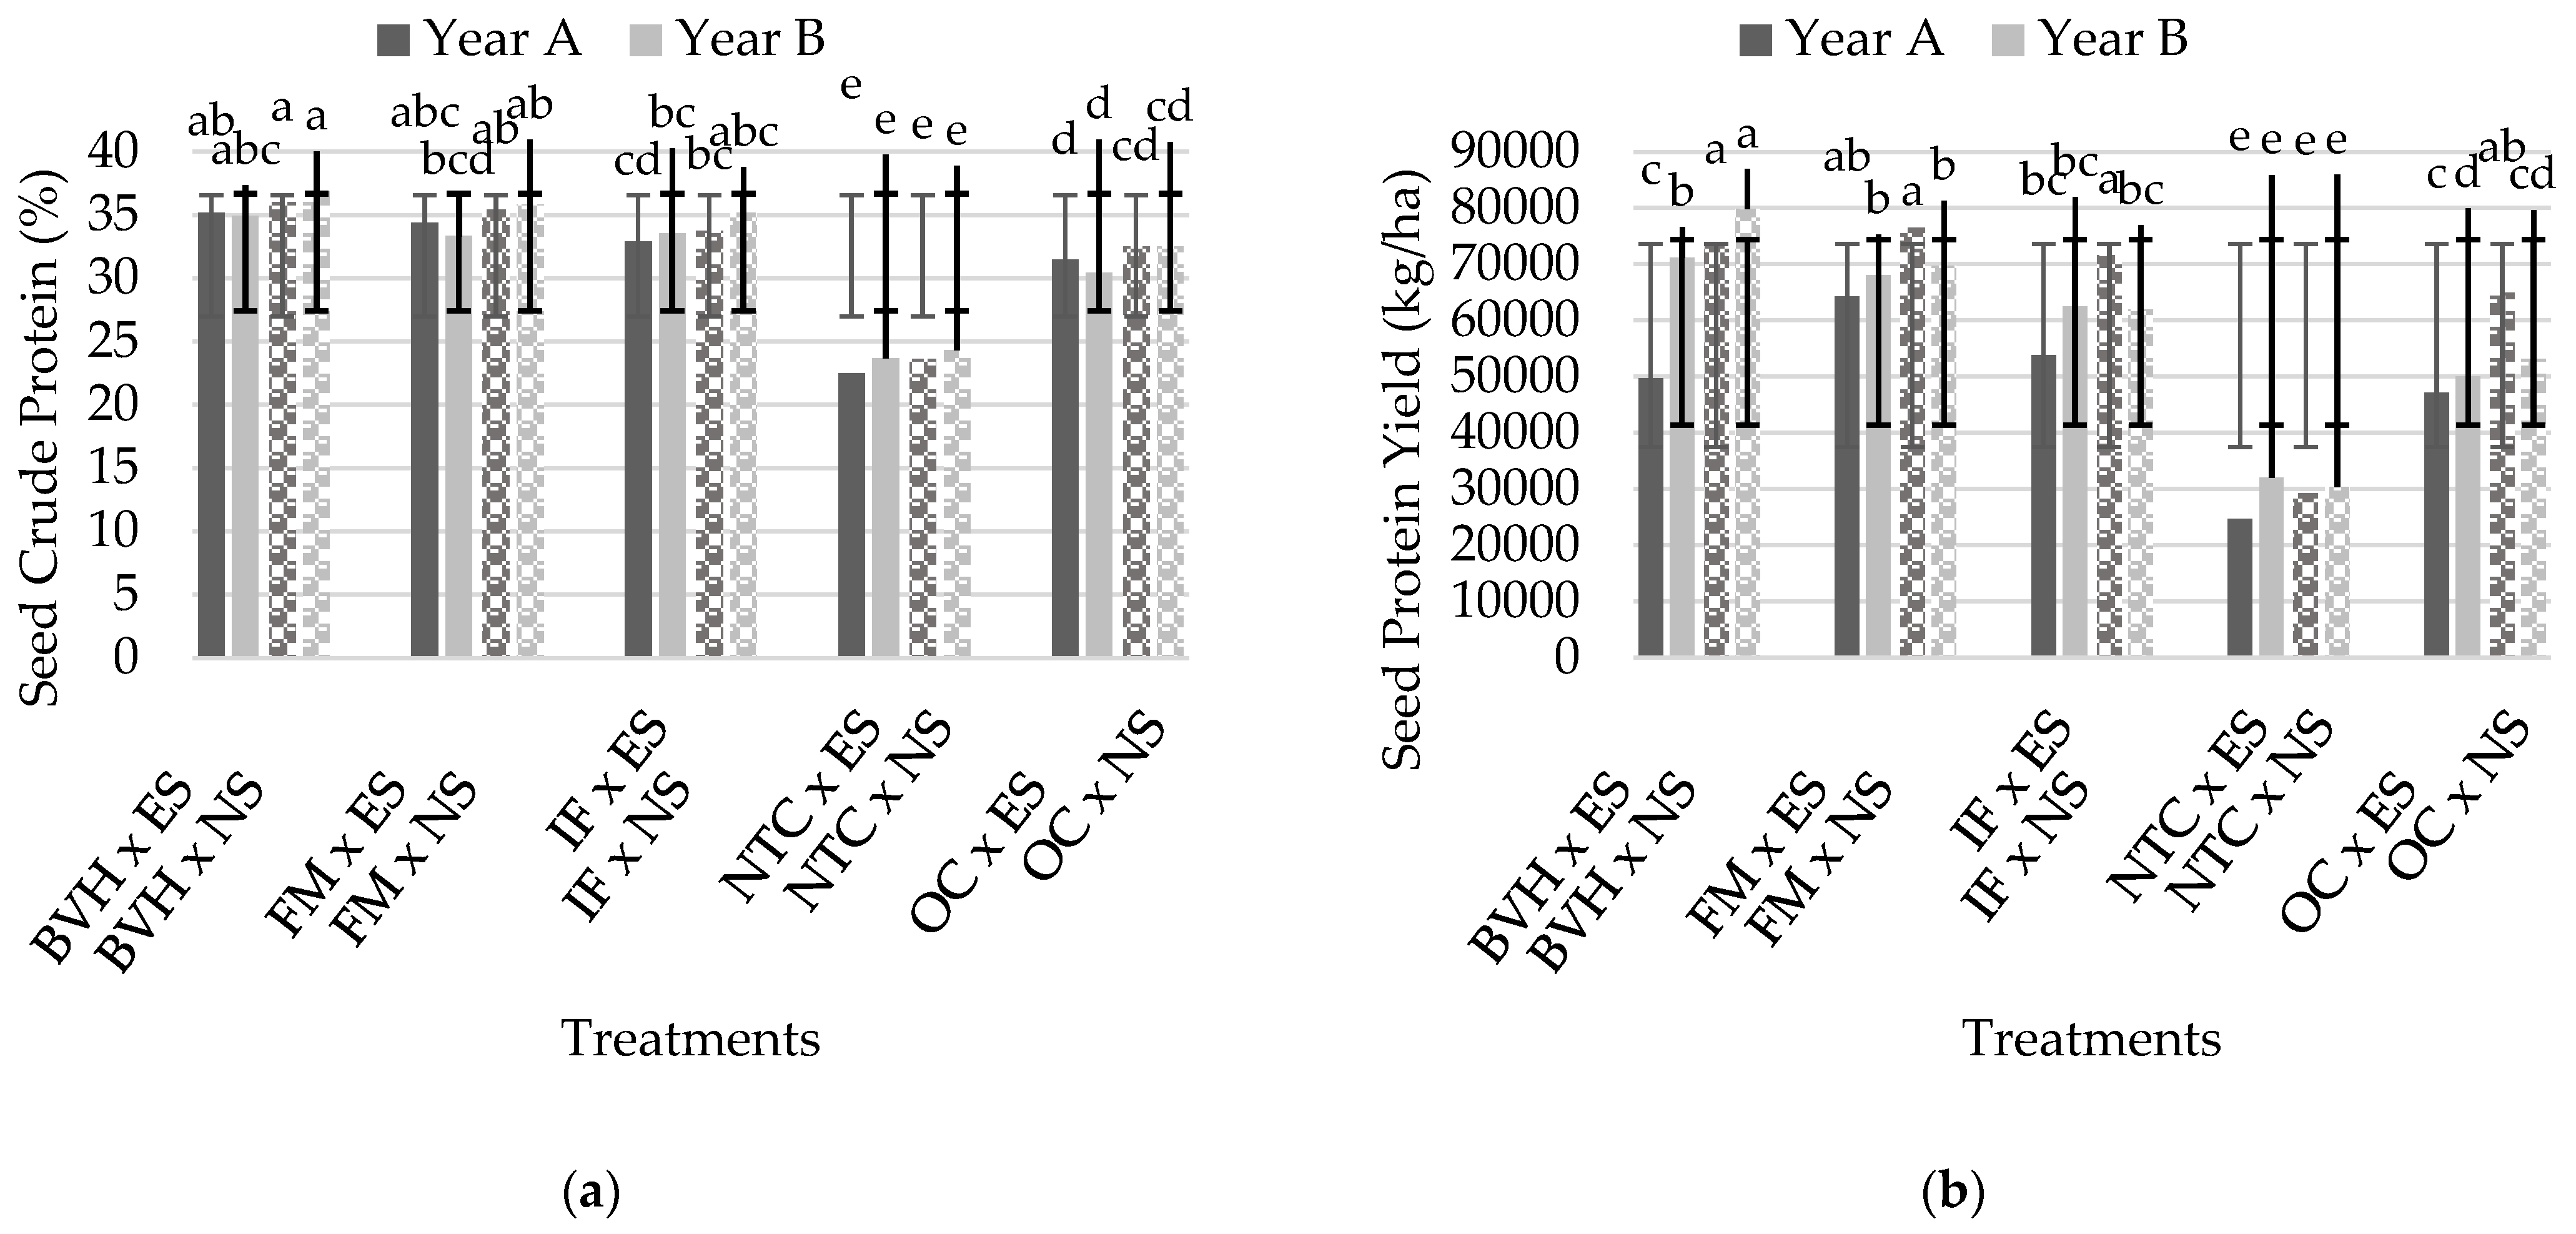
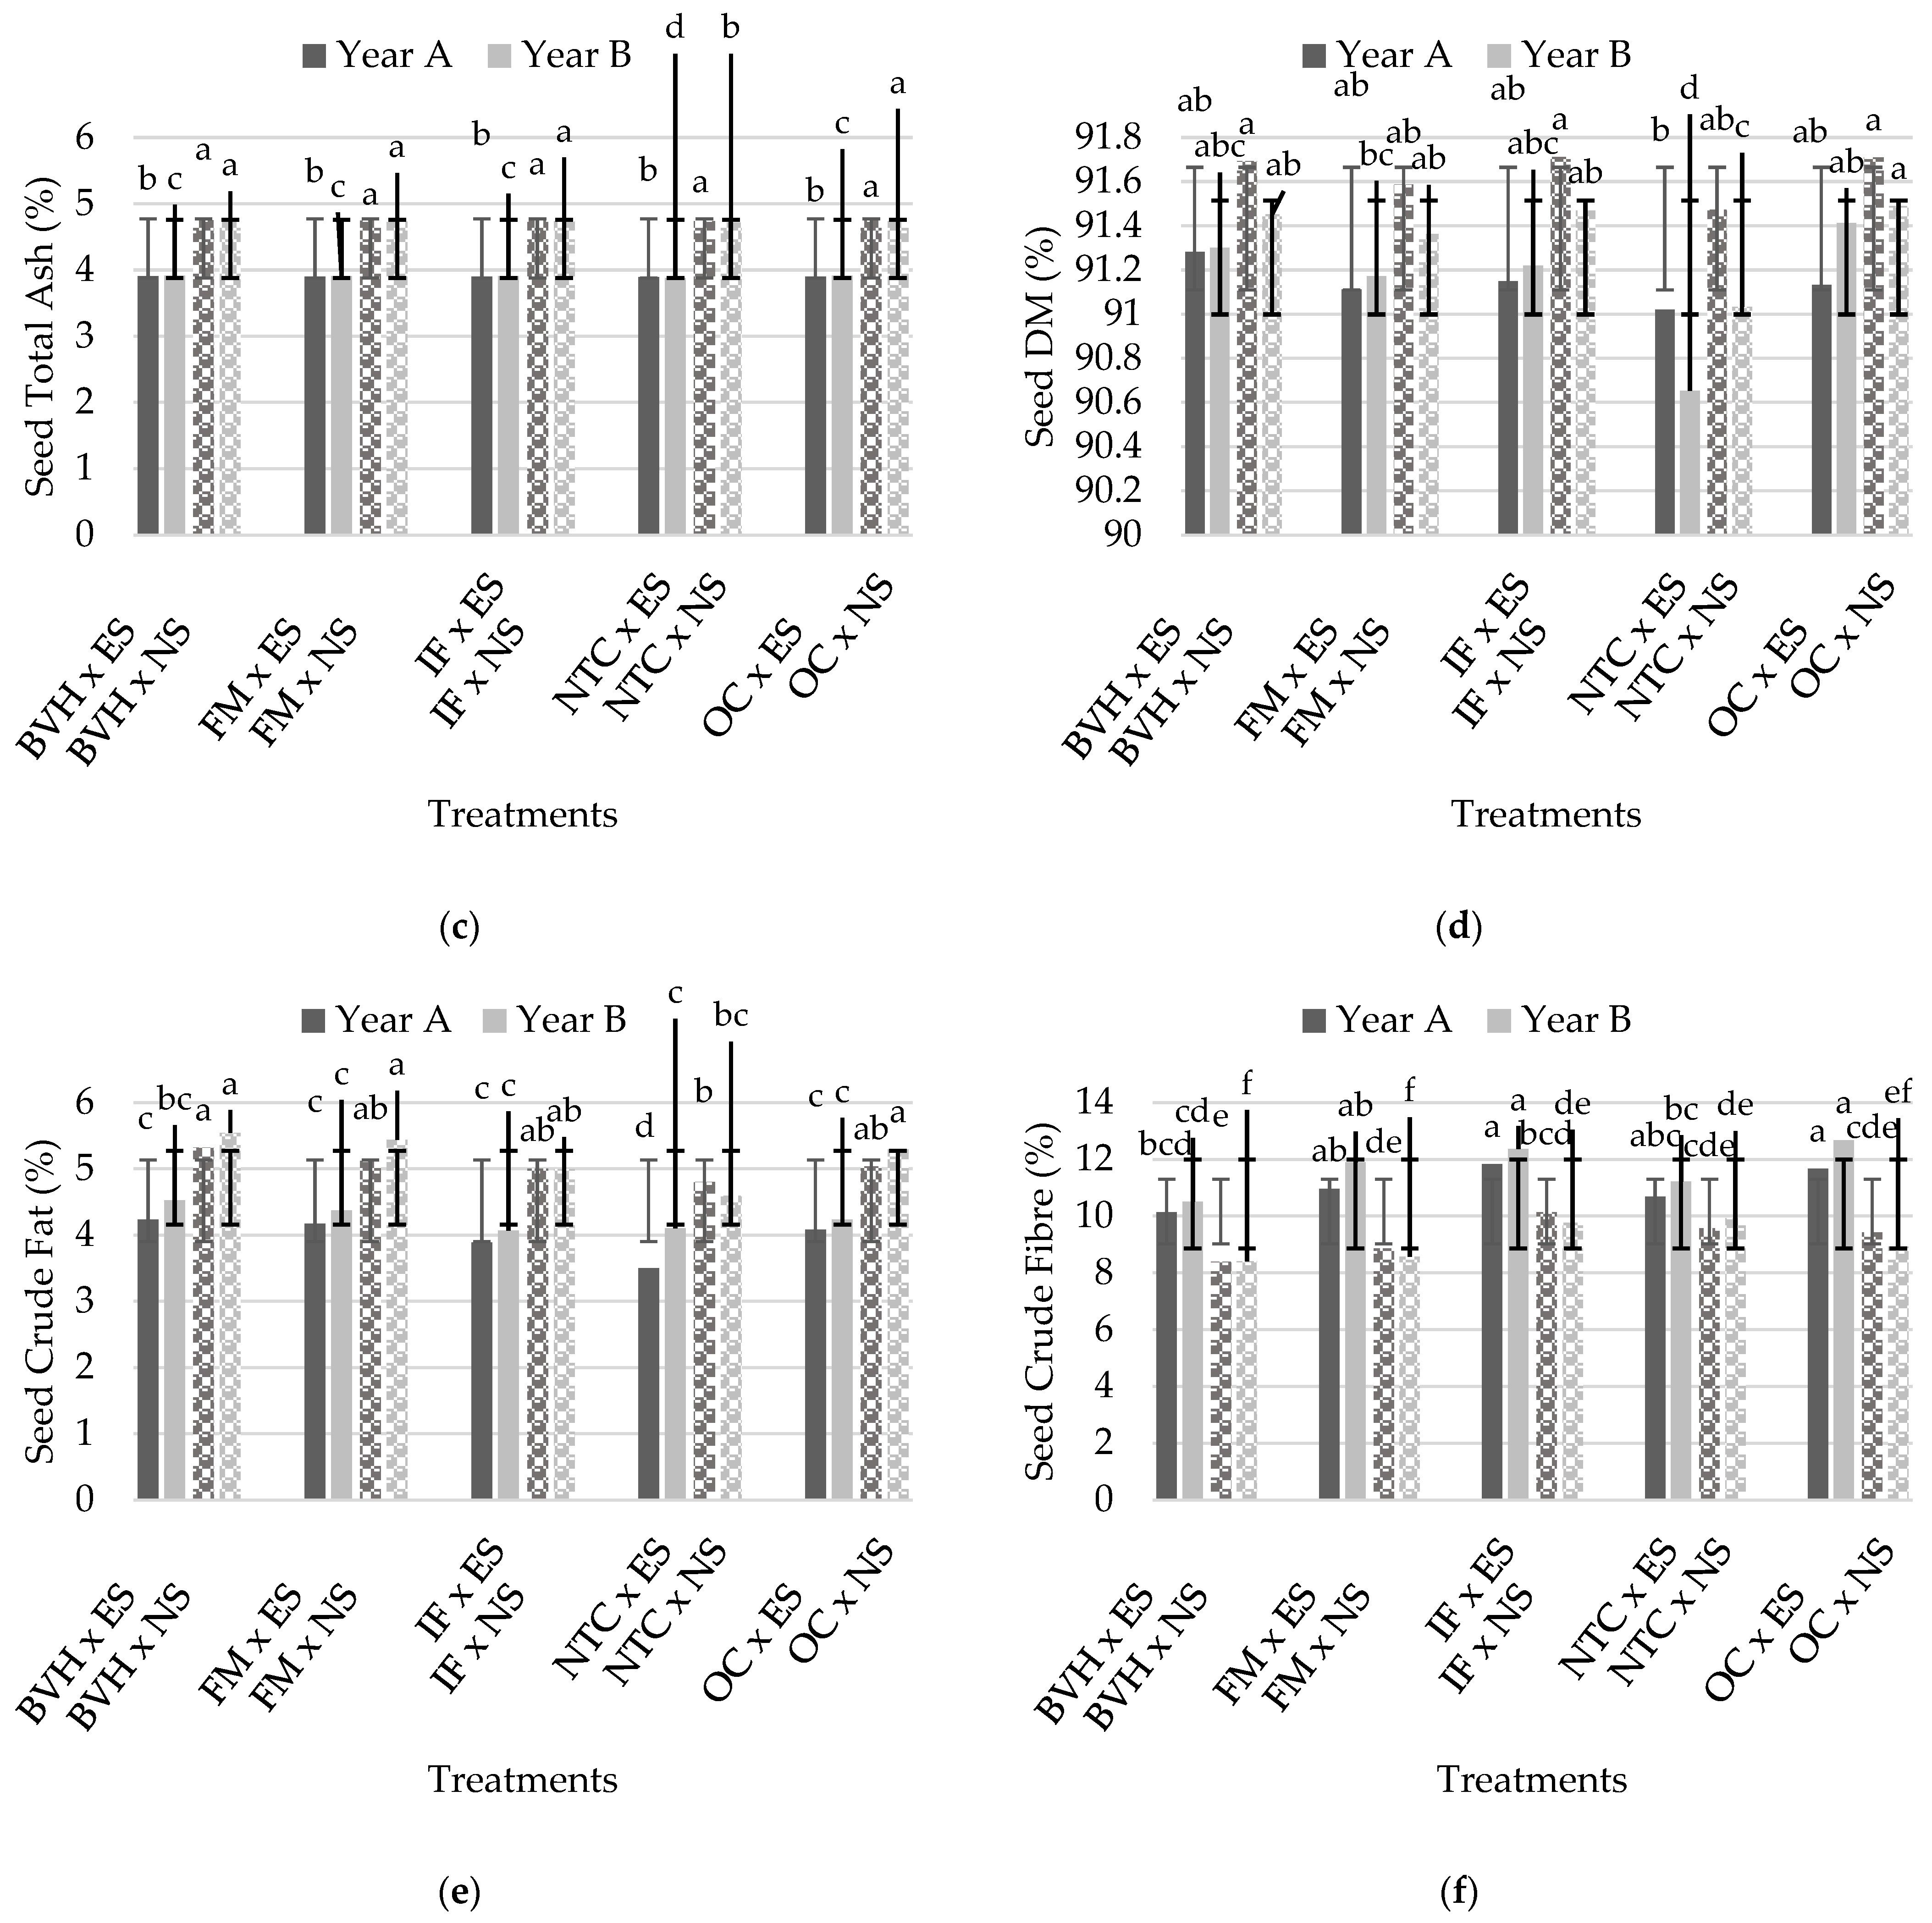
3.3. Proximate Composition of Seeds

For Seed Crude Protein (%), fertilization had a highly significant effect in both Year A (p ≤ 0.001) and Year B (p ≤ 0.001). Salinity also significantly affected Seed Crude Protein in both years, although at a lower level (Year A and Year B: p < 0.05) (Table 5). In Year A, Seed Crude Protein (%) was highest in the BVH × NS treatment (36.04%) and lowest in the NTC × ES treatment (22.50%), with significant differences observed among treatments (Figure 2). In Year B, Seed Crude Protein (%) was also highest in BVH × NS (36.88%) and lowest in NTC × ES (23.67%), consistent with Year A trends.
For Seed Protein Yield (kg/ha), fertilization showed a highly significant effect in both years. Salinity also had a significant effect in Year A (p ≤ 0.001), but there was no significant effect in Year B (Table 5). For Seed Protein Yield (kg/ha), the BVH × NS treatment yielded the highest protein output (76,558 kg/ha), while the NTC × ES treatment had the lowest yield (24,687 kg/ha) (Figure 2). Seed Protein Yield followed a similar pattern, with BVH × NS producing the highest yield (79,827 kg/ha) and NTC × ES the lowest (30,421 kg/ha).
For Seed Total Ash, salinity had a highly significant effect in both Year A (p ≤ 0.001) and Year B (p ≤ 0.001), while fertilization showed no effect in Year A but was highly significant in Year B (p ≤ 0.001) (Table 5). In Year A, Seed Total Ash (%) content was significantly higher in the BVH × NS treatment (4.7509%) compared to BVH × ES (3.9097%), with a percentage difference of 21.5%. In contrast, FM × ES (3.91%) showed a slight decrease of 0.2% in Seed Total Ash compared to BVH × ES. For Seed Dry Matter (DM, %), BVH × NS (91.693%) showed a marginal increase over BVH × ES (91.283%), with a percentage difference of 0.45%, while FM × ES (91.113%) had a slight decrease of 0.19% compared to BVH × ES. For Year B, Seed Total Ash levels remained largely consistent across treatments, with BVH × NS and other high-yield treatments showing slightly higher values (4.74%) than the lowest treatments like NTC × ES (3.88%).
For Seed Dry Matter (DM), salinity had a significant effect in both Year A (p < 0.05) and Year B (p ≤ 0.001), and fertilization significantly affected DM in Year B only (Table 5). %). Seed DM percentages varied slightly across treatments, with the highest being recorded in IF × NS (91.713%) and the lowest in NTC × ES (91.02%). The seed DM percentages again showed slight variation, with the highest in OC × NS (91.49%) and the lowest in NTC × ES (90.653%).
For Seed Crude Fat, both fertilization (Year A: p ≤ 0.001; Year B: p ≤ 0.01) and salinity (Year A: p ≤ 0.001; Year B: p ≤ 0.001) had significant effects across both years (Figure 2). Seed Crude Fat was highest in BVH × NS (5.32%) and lowest in NTC × ES (3.5033%). In Year B, in terms of Seed Crude Fat (%), BVH × NS (5.54%) was substantially higher than BVH × ES (4.52%), reflecting a 22.5% increase. In contrast, FM × ES (4.37%) showed a minor decrease of 3.3% compared to BVH × ES. Finally, for Seed Crude Fiber (%), BVH × NS (8.403%) had a lower fiber content compared to BVH × ES (10.507%), representing a decrease of 20%, while FM × ES (11.9%) displayed a fiber content 13.8% higher than BVH × ES (Figure 2).
For Seed Crude Fiber, fertilization had a slightly significant effect in Year A (p < 0.05) and a more pronounced effect in Year B (p ≤ 0.01). Salinity had a highly significant effect in both years (Table 5) (Figure 2). In Year A, Seed Crude Fiber was highest in the IF × ES (11.833%) and OC × ES (11.667%) treatments, while the lowest fiber content was observed in BVH × NS (8.4%). In Year B, Seed Crude Fiber, the highest content was observed in OC × ES (12.667%) and IF × ES (12.367%), while the lowest fiber content was in BVH × NS (8.403%). In Year B, Seed Crude Fiber (%) in BVH × NS (8.403%) remained lower than in BVH × ES (10.507%), with a percentage decrease of 20%. Conversely, FM × ES (11.9%) exhibited a substantial increase in fiber content, which was 13.8% higher than that of BVH × ES (Figure 2).

4. Discussion

The availability of essential nutrients like nitrogen, phosphorus, and potassium in the soil affects fenugreek plant growth [31]. Several studies have indicated that fenugreek plant height is influenced by fertilization [32,33,34,35,36]. Our experiment confirmed this finding, showing significant effects on plant height in both years. The plant height in the study ranged from an average of 34 cm to 75 cm. In [32], the maximum height recorded in Ankara was 42.2 cm. In Iran, the maximum height was 25 cm [36], while in India, it reached 58.3 cm (at 90 DAS) [37] and 70 cm in a separate study [38]. These variations suggest that plant height is primarily influenced by genetic factors, such as the variety of the plant.
The number of pods per plant and the number of double pods were significantly affected by both fertilization and salinity. The highest number of pods per plant was observed with organic fertilization, while the inorganic treatment resulted in only 1.06% fewer pods. Previous studies have reported a range of 23.67 to 45 pods per plant under various conditions [39,40,41,42]. Organic fertilizers improve root fertilization and enhance nitrogen fixation as well as phosphate solubilization, leading to increased pod numbers. Similar benefits of organic fertilizers on fenugreek growth have been reported in several studies [41,43,44,45].
The pod characteristics, such as pod length and number of seeds per pod, were found to be significantly influenced by fertilization, but not by salinity. In the second year of the experiment, the highest values for these traits were observed with organic fertilization, especially with BHV. The FM treatment resulted in 4.70% fewer seeds per pod when compared to BHV, while the inorganic fertilizer (IF) treatment also showed lower values. This difference can likely be attributed to the ability of organic fertilizers to stimulate the growth of beneficial soil microorganisms [46], which enhances nutrient uptake. Improved microbial activity due to organic practices might also contribute to better pod production and overall plant growth [47]. This suggests that organic fertilization not only improves the soil environment but also positively influences the biological processes that support plant development.
The seed yield of fenugreek was statistically significantly influenced only by the fertilization factor. This result is consistent with the findings of [39], where the authors reported yields ranging from 1300 to 1468 kg ha−1, with the highest yields observed in treatments with increased nitrogen levels. During the first growing season, no significant differences were observed between the fertilization treatments. However, in the second season, biocyclic fertilization resulted in the highest seed yields. In [48], the recommended nutrient dose from inorganic fertilizers led to significantly higher yields compared to organic manures, with chemical fertilizers producing a yield of 27.75 q/ha. In contrast, in the second year of the experiment, the highest seed yield was observed with BHV treatment, while the FM treatment resulted in a 5.10% reduction in seed yield compared to BHV.
A remarkable increase in seed yield was observed in [45], from 1451 kg/ha in the control treatment to 2762 kg/ha when combining inorganic fertilizers, organic matter, and the application of rhizobial bacteria. Organic matter in the soil fosters beneficial fungi and bacteria, enhancing plant defenses, nutrient assimilation, and overall productivity by improving nutrient cycling and root uptake. The integration of organic FYM with inorganic fertilizers improves soil properties and nutrient availability, enhancing plant growth, yield, and quality in Trigonella foenum-graecum. The 1000-seed weight was significantly influenced by fertilization, but not by salinity. This finding differs from previous conclusions suggesting that the 1000-seed weight is predominantly determined by genetic traits and is minimally affected by environmental variables like light, moisture, temperature, and cultivation practices [39,40,49]. Fertilization supplies essential nutrients, such as nitrogen, phosphorus, and potassium, which are crucial for seed development. Organic fertilization, coupled with the low organic matter in our soil, promoted the formation of larger, heavier seeds, ultimately increasing the 1000-seed weight.
The harvest index (HI) measures the percentage of total biomass that is converted into seed. A higher HI indicates a more efficient allocation of resources toward the reproductive parts of the plant. Our results showed an HI greater than 30, which is considered a relatively high value [50]. Similarly, previous studies have reported HI values ranging from 22.43 to 40.59 under different conditions [45]. In contrast, lower values (15.87–19.47) have been recorded under varying fertilization and irrigation conditions in Poland [51]. This discrepancy could be due to the higher rainfall in their study, which increased biomass but reduced HI. In our experiment, the HI was significantly affected only by salinity during the first growing season, with no significant effect.
The translocation percentage (TP) in fenugreek refers to the proportion of total dry matter produced by the plant that is moved from the leaves, which are the source organs, to the seed. It serves as an indicator of how effectively a plant reallocates resources, directly influencing both yield and productivity. Various factors can affect this process, with variety being a primary determinant [52]. In our experiment, we found that the TP was statistically significantly influenced solely by fertilization, while soil salinity did not have a significant effect.
The genetic composition of fenugreek affects its ability to absorb and utilize inorganic nutrients, and different varieties exhibit distinct nutrient requirements. Our study demonstrates that fertilization practices and soil salinity significantly influence seed inorganic nutrient content, highlighting their importance in optimizing crop performance.
The nitrogen content of fenugreek seeds was significantly influenced by fertilization, which is in line with previous findings [53]. Furthermore, both fertilization and soil salinity were found to affect nitrogen levels in seeds. The BHV and FM treatments resulted in a higher nitrogen content compared to IF. This could be because organic fertilizers re-lease nutrients more slowly during decomposition, thereby ensuring a continuous and gradual supply of essential minerals. This steady nutrient release leads to a more balanced nutrient uptake, whereas IF offers nutrients in a more readily available, soluble form, potentially increasing the risk of nutrient leaching.
Trace elements serve as indispensable catalysts in the biochemical reactions of living cells, playing a critical role in animal and human nutrition, particularly in crops like fenugreek [54]. Calcium is vital for plant resilience under stress, including environmental challenges such as drought and salinity, and functions as a signaling molecule to aid in adaptation and response [55]. In this study, the calcium content in fenugreek plants and seeds was significantly influenced by fertilization, with BHV treatments yielding higher calcium levels. This effect is attributed to the humic substances present in BHV fertilizers, which enhance nutrient bioavailability. These humic acids can chelate inorganic salts, increasing their solubility and uptake by plant roots, thereby optimizing nutrient efficiency [56]. Such mechanisms not only improve calcium concentration but also bolster plant health and productivity under varying growth conditions.
Potassium is fundamental for osmotic regulation in plants and for maintaining the water balance and solute concentration within cells. This process is vital for sustaining turgor pressure, ensuring structural support, and preventing wilting under stress conditions [57]. Our study revealed that the potassium content in fenugreek plants and seeds was significantly affected by fertilization, contrasting the results in [51], where the authors observed no notable impact from fertilization despite increased macronutrient levels with higher fertilizer application. Additionally, salinity significantly influenced potassium content, with salt-stressed fenugreek plants accumulating less potassium compared to unstressed plants. This aligns with the findings of [58], who documented increased inorganic osmolyte levels, including potassium, sodium, and magnesium, in fenugreek seedlings under stress conditions (p ≤ 0.05). These adaptations highlight plants’ ability to regulate osmotic balance through ion accumulation, although the extent may vary with environmental conditions and plant developmental stages. In addition, organic matter, owing to its electrostatic abilities, reduces the active concentration of strong electrolytes, and thus mitigates salinity. Such variations underscore the complex interplay between nutrient availability, stress factors, and physiological mechanisms in fenugreek cultivation.
Fe is an essential micronutrient for plants, including fenugreek, with a pivotal role in key physiological processes, such as chlorophyll synthesis, enzymatic reactions, and seed formation [59]. Its contribution to seed development directly influences plant productivity [60]. Fenugreek plants are known for their robust adaptive mechanisms to manage Fe deficiency or excess, thereby optimizing Fe uptake and utilization [61]. In our study, biological fertilizers significantly increased the Fe concentration in fenugreek compared to inorganic fertilizers (IF). This may be due to the composition of organic fertilizers, which naturally enrich the soil with vital micronutrients, including Fe, manganese, zinc, and copper [62]. These fertilizers release nutrients more gradually and sustainably, promoting better root absorption. Humic and fulvic acids, which are key constituents of organic matter, play vital roles in chelating micronutrients and facilitating root assimilation. In organic fertilizers, these acids further enhance nutrient solubility and bioavailability, ensuring the efficient uptake of essential elements such as Fe by plants [63]. This aligns with previous findings that biological fertilizers enrich soil health, ultimately boosting the mineral content of crops [64,65].
The P content of fenugreek seeds was significantly affected by fertilization, with biological fertilizers yielding higher P concentrations. This observation aligns with similar findings for other crops [66]. Nutrient availability, such as P, may have improved due to the optimal pH levels maintained by biological fertilizers, which often act as pH buffers [67]. Appropriate soil pH is crucial for the absorption of certain nutrients, and biological fertilizers enhance these conditions, ensuring better phosphorus uptake [68,69].
The Mg content of fenugreek seeds was significantly influenced by fertilization, with biological fertilizers showing the highest concentrations. Organic amendments, like biocyclic humus soil, play a vital role in improving soil structure [19,22,70]. Well-structured soils facilitate better root development and enhanced nutrient uptake. The improved root system can access a broader spectrum of minerals in the soil, explaining why plots treated with biological fertilizers displayed higher magnesium concentrations [71,72]. These findings highlight the synergistic effects of biological fertilizers on soil health and nutrient bioavailability.
Fenugreek can serve as a valuable ingredient in animal feed for livestock, such as cattle, poultry, and small ruminants, when used appropriately and in balanced amounts [73]. Its high protein content is a key factor contributing to its suitability as a feed component. Fenugreek seeds are rich in protein, comprising approximately 25–40% by weight, making them an excellent source of plant-based protein for animals [74,75,76].
Fertilization can significantly impact the protein content of fenugreek seeds due to its influence on various physiological and biochemical processes within the plant [32,77]. Our study confirmed this, observing no significant differences in protein availability between inorganic and biological fertilization methods. This suggests that nitrogen, a key factor in protein synthesis and accumulation, was sufficiently provided by both methods. In contrast, previous studies have highlighted that variations in fertilizer form and application timing can influence the nitrogen supply and overall protein yield in plants [78]. This could be attributed to the efficiency of fenugreek plants in absorbing and utilizing nutrients, along with the initial nutrient levels present in the soil. When the soil is already rich in essential nutrients, the impact of additional fertilization on protein synthesis might be minimal [79]. Furthermore, seed protein content was not adversely affected by elevated soil salinity, a significant result highlighting fenugreek’s resilience and its ability to prioritize protein synthesis under saline conditions. This adaptability makes fenugreek a valuable crop in challenging environments.
Protein yield in seeds is crucial for animal nutrition, as proteins are essential for growth and maintenance in livestock [80]. In fenugreek cultivation during the second growing season, seed protein yield was significantly influenced by both fertilization and soil salinity. These factors directly impact the plant’s physiological processes and nutrient assimilation, highlighting the importance of managing cultivation conditions to optimize the protein content in seeds for animal feed applications.
The ash content in fenugreek seeds was significantly affected by soil salinity, with a higher ash content observed under intense salinity conditions. This increase was noted in both leaves and seeds as salinity intensified. Salinity-induced nutrient uptake restrictions led to the accumulation of inorganic compounds within the plant, resulting in elevated ash content. High soil salinity creates osmotic stress, impairing the absorption of essential nutrients like calcium, magnesium, and potassium, which contribute to ash content [81]. This highlights the plant’s adaptive response to saline environments through altered nutrients. Dry matter is a vital component in evaluating and producing animal feed, as it directly correlates with nutritional density. Seeds with higher dry matter content are richer in essential nutrients, such as proteins, carbohydrates, and fats, offering enhanced value per unit weight [82]. In our study, the seed dry matter of fenugreek was significantly influenced by fertilization during the final experimental phase. Interestingly, there was no statistical difference between organic and inorganic fertilizers, but both substantially boosted the dry matter content [83]. Fertilization impacts the biochemical pathways and physiological processes that determine seed lipid content, demonstrating its importance in enhancing chemical seed quality [77]. These results affirm that effective nutrient management fosters optimal seed composition and increases the overall quality of fenugreek as a crop, underscoring its significance in agricultural productivity.

5. Conclusions

This study underscores the critical influence of fertilization practices on fenugreek growth, yield, and nutritional quality, highlighting the superiority of organic and biological fertilizers in enhancing plant height, pod production, and seed nutrient content. These practices were particularly impactful on chemical seed quality, which emerged as a key parameter of fenugreek’s agricultural and nutritional value. The 1000-seed weight, a significant measure of seed size and health, was markedly improved by organic fertilization. This effect is attributed to the gradual release of essential nutrients, such as nitrogen, phosphorus, and potassium, which ensures consistent nutrient availability during seed development. The use of organic methods likely contributed to improved soil health and nutrient dynamics, which may have enhanced the plants’ nutrient absorption capacity, resulting in larger and more nutrient-dense seeds. Nutritional quality was also evident in the elevated concentrations of protein, trace elements like iron and calcium, and essential macronutrients within the seeds under organic and biological fertilization treatments. Despite salinity challenges, fenugreek seeds maintained their protein content, showcasing the plant’s resilience and adaptability. The higher protein yield from organically treated seeds underscores their importance as valuable sources of plant-based nutrition for both livestock feed and human consumption. Moreover, the dry matter content, which correlates directly with the nutritional density of seeds, was significantly enhanced by fertilization, ensuring improved chemical seed quality. These experimental findings suggest that organic fertilization promotes plant development, enhances protein and nutritional enrichment of the seed, and mitigates salt stress. These effects may be attributed to the rich composition of organic fertilizers, which provide not only essential macronutrients but also humic and fulvic acids. These acids play a crucial role in improving soil structure, nutrient solubility, and bioavailability, thereby supporting root growth and nutrient uptake, even under saline conditions. These findings highlight that effective nutrient management strategies not only optimize fenugreek yield but also elevate the quality of seeds, solidifying their role in sustainable agriculture and nutrition.

Author Contributions

Conceptualization, A.F. and D.B.; methodology, A.F.; software, A.F.; validation, A.F. and D.B.; formal analysis, A.F. and A.E.; investigation, A.F. and A.M.; resources, A.F. and I.K.; data curation, A.F., E.T. and A.M.; writing—original draft preparation, A.F. and I.K.; writing—review and editing, A.F., A.E. and A.M.; visualization, A.F., P.S. and I.K.; supervision, A.F., I.K. and D.B.; project administration, A.F. and I.K. All authors have read and agreed to the published version of the manuscript.

Funding

This research received no external funding.

Institutional Review Board Statement

Not applicable.

Informed Consent Statement

Not applicable.

Data Availability Statement

All data supporting the reported results are provided in the tables within the text.

Conflicts of Interest

The authors declare no conflicts of interest.

References

  1. Hilles, A.R.; Mahmood, S. Historical background, origin, distribution, and economic importance of fenugreek. In Fenugreek: Biology and Applications; Springer: Singapore, 2021; pp. 3–11. [Google Scholar]
  2. Shahrajabian, M.H.; Sun, W.; Magadlela, A.; Hong, S.; Cheng, Q. Fenugreek cultivation in the middle east and other parts of the world with emphasis on historical aspects and its uses in traditional medicine and modern pharmaceutical science. In Fenugreek: Biology and Applications; Springer: Berlin/Heidelberg, Germany, 2021; pp. 13–30. [Google Scholar]
  3. Dhull, S.B.; Chandak, A.; Bamal, P.; Malik, A.; Kidwai, M.K. Fenugreek (Trigonella foenum-graecum): Nutritional, health properties and food uses. In Fenugreek: Biology and Applications; Springer: Singapore, 2021; pp. 219–246. [Google Scholar]
  4. Narapogu, V.; Swathi, C.; Polsani, M.R.; Premendran, J. Evaluation of anti-diabetic and anti-inflammatory activities of Fenugreek (Trigonella foenum-graecum) seed extracts on Albino Wistar Rats. Natl. J. Physiol. Pharm. Pharmacol. 2021, 11, 1277–1282. [Google Scholar] [CrossRef]
  5. Pal, D.; Mukherjee, S. Fenugreek (Trigonella foenum) seeds in health and nutrition. In Nuts and Seeds in Health and Disease Prevention; Elsevier: Amsterdam, The Netherlands, 2020; pp. 161–170. [Google Scholar]
  6. Salam, S.G.A.; Rashed, M.M.; Ibrahim, N.A.; Rahim, E.A.A.; Aly, T.A.; Al-Farga, A. Phytochemical screening and in-vitro biological properties of unprocessed and household processed fenugreek (Trigonella foenum-graecum Linn.) seeds and leaves. Sci. Rep. 2023, 13, 7032. [Google Scholar] [CrossRef] [PubMed]
  7. Duke, J. Handbook of Legumes of World Economic Importance; Springer Science & Business Media: Berlin/Heidelberg, Germany, 2012. [Google Scholar]
  8. Niknam, R.; Kiani, H.; Mousavi, Z.E.; Mousavi, M. Extraction, detection, and characterization of various chemical components of Trigonella foenum-graecum L.(fenugreek) known as a valuable seed in agriculture. In Fenugreek: Biology and Applications; Springer: Singapore, 2021; pp. 189–217. [Google Scholar]
  9. Rao, P.U.; Sesikeran, B.; Rao, P.S.; Naidu, A.N.; Rao, V.V.; Ramachandran, E.P. Short term nutritional and safety evaluation of fenugreek. Nutr. Res. 1996, 16, 1495–1505. [Google Scholar] [CrossRef]
  10. Faisal, Z.; Irfan, R.; Akram, N.; Manzoor, H.M.I.; Aabdi, M.A.; Anwar, M.J.; Khawar, S.; Saif, A.; Shah, Y.A.; Afzaal, M.; et al. The multifaceted potential of fenugreek seeds: From health benefits to food and nanotechnology applications. Food Sci. Nutr. 2024, 12, 2294–2310. [Google Scholar] [CrossRef]
  11. Aljuhaimi, F.; Şimşek, Ş.; Özcan, M.M.; Ghafoor, K.; Babiker, E.E. Effect of location on chemical properties, amino acid and fatty acid compositions of fenugreek (Trigonella foenum-graecum L.) seed and oils. J. Food Process. Pres. 2018, 42, e13569. [Google Scholar] [CrossRef]
  12. Srinivasa, U.M.; Naidu, M.M. Fenugreek (Trigonella foenum-graecum L.) seed: Promising source of nutraceutical. Stud. Nat. Prod. Chem. 2021, 71, 141–184. [Google Scholar]
  13. Sun, W.; Shahrajabian, M.H.; Cheng, Q. Fenugreek cultivation with emphasis on historical aspects and its uses in traditional medicine and modern pharmaceutical science. Mini Rev. Med. Chem. 2021, 21, 724–730. [Google Scholar] [CrossRef]
  14. Abdel-Wareth, A.A.; Elkhateeb, F.S.; Ismail, Z.S.; Ghazalah, A.A.; Lohakare, J. Combined effects of fenugreek seeds and probiotics on growth performance, nutrient digestibility, carcass criteria, and serum hormones in growing rabbits. Livest. Sci. 2021, 251, 104616. [Google Scholar] [CrossRef]
  15. Folina, A.; Tsementzi, K.; Stavropoulos, P.; Mavroeidis, A.; Kakabouki, I.; Bilalis, D. Impact of salinity and fertilization on soil properties, and root development in fenugreek (Trigonella foenum-graecum) cultivation. Not. Bot. Horti Agrobot. 2024, 52, 13868. [Google Scholar] [CrossRef]
  16. Narayana, P.K.; Bueno, E.; Baur, A.; Ahmed, S.; Von Wettberg, E.J. Fenugreek, a legume spice and multiuse crop adapted to a changing climate. In Developing Climate Resilient Grain and Forage Legumes; Springer: Berlin/Heidelberg, Germany, 2022; pp. 105–123. [Google Scholar]
  17. Lamsaadi, N.; Ellouzi, H.; Zorrig, W.; El Moukhtari, A.; Abdelly, C.; Savouré, A.; Debez, A.; Farissi, M. Enhancing fenugreek (Trigonella foenum-graecum L.) productivity and seed quality through silicon-based seed priming under salt-stressed conditions. Russ. J. Plant Physiol. 2024, 71, 70. [Google Scholar] [CrossRef]
  18. Fani, E. The effects of feeding by silica fertilizer on the reduction of stress caused by salinity in fenugreek plants. J. Soil Manag. Sustain. Prod. 2024, 14, 115–129. [Google Scholar]
  19. Dadresan, M.; Luthe, D.S.; Reddivari, L.; Chaichi, M.R.; Yazdani, D. Effect of salinity stress and surfactant treatment on physiological traits and nutrient absorption of fenugreek plant. Commun. Soil Sci. Plant Anal. 2015, 46, 2807–2820. [Google Scholar] [CrossRef]
  20. Folina, A.; Mavroeidis, A.; Stavropoulos, P.; Eisenbach, L.; Kakabouki, I.; Bilalis, D. Comparison of Organic and Inorganic Fertilization in Fenugreek Cultivation Using Nitrogen Indicators. Nitrogen 2024, 5, 712–731. [Google Scholar] [CrossRef]
  21. Zörb, C.; Geilfus, C.M.; Dietz, K.J. Salinity and crop yield. Plant Biol. 2019, 21, 31–38. [Google Scholar] [CrossRef]
  22. El-Ramady, H.; Abdalla, N.; Kovacs, S.; Domokos-Szabolcsy, E.; Bákonyi, N.; Fari, M.; Geilfus, C.M. Sustainable biorefinery and production of alfalfa (Medicago sativa L.): A review. Egypt. J. Bot. 2020, 60, 621–639. [Google Scholar] [CrossRef]
  23. ISO11261; Soil Quality: Determination of Total Nitrogen: Modified Kjeldahl Method. ISO: Geneva, Switzerland, 1995.
  24. ISO11260; Soil Quality: Determination of Cation Exchange Capacity and Base Saturation Method Using Barium Chloride Solution; International Organization for Standardization: Geneva, Switzerland. ISO: Geneva, Switzerland, 1994.
  25. ISO14870; Soil Quality–Extraction of Trace Elements by Buffered DTPA Solution. ISO: Geneva, Switzerland, 2001.
  26. Association of Official Agricultural Chemists. Official Methods of Analysis of the Association of Official Analytical Chemists, 17th ed.; Association of Official Analytical Chemists: Washington, DC, USA, 2000; pp. 490–510. [Google Scholar]
  27. Association of Official Analytical Chemists. Official Methods of Analysis of AOAC International, 16th ed.; AOCA: Gaithersburg, MD, USA, 1995; p. 870. [Google Scholar]
  28. Nichiporovich, A.; Stroganova, L.; Vlasova, M. Fotosinteticheskaya deyatel’nost’rasteniy v posevakh [Photosynthetic Activity of Plants in Crops]; AN SSSR: Moscow, Russia, 1961. [Google Scholar]
  29. Tian, J.; Li, S.; Xing, Z.; Cheng, S.; Guo, B.; Hu, Y.; Wei, H.; Gao, H.; Liao, P.; Wei, H.; et al. Differences in rice yield and biomass accumulation dynamics for different direct seeding methods after wheat straw return. Food Ener. Secur. 2022, 11, e425. [Google Scholar] [CrossRef]
  30. Papakosta, D.K.; Gagianas, A. Nitrogen and dry matter accumulation, remobilization, and losses for Mediterranean wheat during grain filling. J. Agron. 1991, 83, 864–870. [Google Scholar] [CrossRef]
  31. Raiyani, V.; Kathiriya, R.; Thummer, V.; Rupareliya, V. Effect of FYM and biofertilizers on growth, yield attributes and yield of fenugreek (Trigonella foenum-graecum L.). Int. J. Chem. Stud. 2018, 6, 746–748. [Google Scholar]
  32. Tunçtürk, R.; Celen, A.E.; Tunçtürk, M. The effects of nitrogen and sulphur fertilizers on the yield and quality of fenugreek (Trigonella foenum-graecum L.). Turk. J. Field Crops 2011, 16, 69–75. [Google Scholar]
  33. Tuncturk, R. Salinity exposure modifies nutrient concentrations in fenugreek (Trigonella foenum graecum L.). Afr. J. Agric. Res. 2011, 6, 3685–3690. [Google Scholar]
  34. Mehta, R.; Anwer, M.; Aishwath, O.; Meena, R. Growth, yield and quality of fenugreek (Trigonella foenum-graecum L.) as influenced by nitrogen, phosphorus and bio-fertilizers. Indian J. Hortic. 2012, 69, 94–97. [Google Scholar]
  35. Bairva, M.; Meena, S.; Mehta, R. Effect of bio-fertilizers and plant growth regulators on growth and yield of fenugreek (Trigonella foenum-graecum L.). Int. J. Environ. Clim. 2012, 2, 28–33. [Google Scholar]
  36. Chaichi, M.R.; Dadresan, M.; Hosseini, M.B.; Pourbabaie, A.; Yazdani, D.; Zandvakili, O.R. Effect of bio fertilizers on the growth, productivity and nutrient absorption of fenugreek (Trigonella foenum graecum L.). Int. J. Agric. Innov. Res. 2015, 3, 1628–1633. [Google Scholar]
  37. Mehta, R.S.; Patel, B.S.; Meena, S.S.; Meena, R.S. Influence of nitrogen, phosphorus and bio-fertilizers on growth characters and yield of fenugreek (Trigonella foenum-graecum L.). J. Spices Arom. Crops. 2010, 19, 23–28. [Google Scholar]
  38. Bhutia, K.C.; Bhutia, S.O.; Chatterjee, R.; Chattopadhyay, N. Growth, phenology and yield of fenugreek (Trigonella foenum–graecum L.) as influenced by date of sowing. Int. J Curr. Microbiol. App. Sci. 2017, 6, 1810–1817. [Google Scholar] [CrossRef]
  39. Zandi, P.; Shirani–Rad, A.H.; Daneshian, J.; Bazrkar–Khatibani, L. Agronomic and morphologic analysis of Fenugreek (Trigonella foenum-graecum L.) under nitrogen fertilizer and plant density via factor analysis. Afr. J. Agric. Res. 2011, 6, 1134–1140. [Google Scholar]
  40. Zandi, P.; Shirani-Rad, A.H.; Bazrkar-Khatibani, L. Agronomic study of fenugreek grown under different in-row spacing and nitrogen levels in a paddy field of Iran. Am.-Eurasian J. Agric. Environ. Sci. 2011, 10, 544–550. [Google Scholar]
  41. Nair, R.; Pandey, S.K.; Jyothsna, J. Growth and yield of fenugreek (Trigonella foenum graecum L.) in response to different levels of phosphorus and biofertilizer (Rhizobium and PSB) under Kymore Plateau and Satpura hill agro-climatic zone of Madhya Pradesh. Pharma Innov. J. 2021, 10, 419–422. [Google Scholar]
  42. Husain, N.; Nair, R.; Verma, B.K.; Yadav, B. Growth, Yield and Economics of Fenugreek (Trigonella foenum-graecum L.) as Influenced by Inorganic Fertilizers and Bio-inoculant (Rhizobium, PSB and KSB). Biol. Forum–Int. J. 2022, 14, 80–83. [Google Scholar]
  43. Biswas, S.; Anusuya, D. Effect of bioinoculants and organic manure (phosphocompost) on growth, yield and nutrient uptake of Trigonella foenum-graecum L. (Fenugreek). Int. J. Sci. Res. 2014, 3, 38–41. [Google Scholar]
  44. Sahu, P.K.; Naruka, I.S.; Haldar, A.; Chundawat, R.S.; Kumar, L. Studies on the effects of integrated nutrient management on fenugreek (Trigonella foenum-graecum) L. Int. J. Chem. Stud. 2020, 8, 1082–1089. [Google Scholar] [CrossRef]
  45. Sahu, P.K.; Naruka, I.S.; Haldar, A.; Chundawat, R.S.; Kumar, H. Study the effect of integrated nutrient management on vegetative growth of fenugreek (Trigonella foenum-graecum) L. J. Pharmacogn. Phytochem. 2020, 9, 1389–1394. [Google Scholar]
  46. Tian, S.; Zhu, B.; Yin, R.; Wang, M.; Jiang, Y.; Zhang, C.; Li, D.; Chen, X.; Kardol, P.; Liu, M. Organic fertilization promotes crop productivity through changes in soil aggregation. Soil Biol. Biochem. 2022, 165, 108533. [Google Scholar] [CrossRef]
  47. Israr, D.; Mustafa, G.; Khan, K.S.; Shahzad, M.; Ahmad, N.; Masood, S. Interactive effects of phosphorus and Pseudomonas putida on chickpea (Cicer arietinum L.) growth, nutrient uptake, antioxidant enzymes and organic acids exudation. Plant Physiol. Biochem. 2016, 108, 304–312. [Google Scholar] [CrossRef]
  48. Godara, A.S.; Gupta, U.S.; Singh, R.; Mehta, R.S. Effect of different combinations of organic and inorganic nutrient sources on productivity and profitability of fenugreek (Trigonella-foenium-graecum). Int. J. Environ. Clim. 2012, 2, 34–37. [Google Scholar]
  49. Seghatoleslami, M.; Ahmadi Bonakdar, K. The effect of sowing date and plant density on yield and yield components of fenugreek (Trigonella foenum gracum L.). Iran. J. Med. Aromat. Plants 2010, 26, 265–274. [Google Scholar]
  50. Hedley, C.; Ambrose, M. The effect of plant interaction on crop harvest index. In Efficiency in Plant Breeding: Proceedings of the 10th Congress of the European Association for Research on Plant Breeding, EUCARPIA, Wageningen, The Netherlands, 19–24 June 1983; Bernan Press (PA): Pudoc Wageningen, The Netherlands, 1984. [Google Scholar]
  51. Zuk-Gołaszewska, K.; Wierzbowska, J.; Bienkowski, T. Effect of potassium fertilization, Rhizobium inoculation and water deficit on the yield and quality of fenugreek seeds. J. Elem. 2015, 20, 513–524. [Google Scholar] [CrossRef]
  52. Seepaul, R.; Kumar, S.; Boote, K.J.; Small, I.M.; George, S.; Wright, D.L. Physiological analysis of growth and development of winter carinata (Brassica carinata A. Braun). GCB Bioenergy 2021, 13, 1112–1133. [Google Scholar] [CrossRef]
  53. Ahmed, M.A.; Ibrahim, O.M.; Elham, A.B. Effect of bio and mineral phosphorus fertilizer on the growth, productivity and nutritional value of fenugreek (Trigonella foenum graecum L.) in Newly Cultivated Land. Res. J. Agric. Biol. Sci. 2010, 6, 339–348. [Google Scholar]
  54. Sherif, M.; Awadallah, R.; Mohamed, A.E. Determination of trace elements of egyptian crops by neutron activation analysis. J. Radioanal. Nucl. Chem. 1979, 53, 145–153. [Google Scholar] [CrossRef]
  55. Li, Y.; Liu, Y.; Jin, L.; Peng, R. Crosstalk between Ca2+ and other regulators assists plants in responding to abiotic stress. Plants 2022, 11, 1351. [Google Scholar] [CrossRef] [PubMed]
  56. Pettit, R.E. Organic matter, humus, humate, humic acid, fulvic acid and humin. Wonderful World Humus Carbon 2006. Available online: https://www.semanticscholar.org/paper/ORGANIC-MATTER-%2C-HUMUS-%2C-HUMATE-%2C-HUMIC-ACID-%2C-ACID-Pettit/bd2e61da484c14d9325d16024360a118c4809ba1 (accessed on 26 November 2024).
  57. Wang, M.; Zheng, Q.; Shen, Q.; Guo, S. The critical role of potassium in plant stress response. Int. J. Mol. Sci. 2013, 14, 7370–7390. [Google Scholar] [CrossRef]
  58. Mickky, B.M.; Abbas, M.A.; Sameh, N.M. Morpho-physiological status of fenugreek seedlings under NaCl stress. J. King Saud Univ. Sci. 2019, 31, 1276–1282. [Google Scholar] [CrossRef]
  59. Zayneb, C.; Bassem, K.; Zeineb, K.; Grubb, C.D.; Noureddine, D.; Hafedh, M.; Amine, E. Physiological responses of fenugreek seedlings and plants treated with cadmium. Environ. Sci. Pollut. Res. 2015, 22, 10679–10689. [Google Scholar] [CrossRef]
  60. Frossard, E.; Bucher, M.; Mächler, F.; Mozafar, A.; Hurrell, R. Potential for increasing the content and bioavailability of Fe, Zn and Ca in plants for human nutrition. J. Sci. Food Agric. 2000, 80, 861–879. [Google Scholar] [CrossRef]
  61. Mnafgui, W.; Rizzo, V.; Muratore, G.; Hajlaoui, H.; De Oliveira Schinoff, B.; Mnafgui, K.; Elleuch, A.; Hussain, S. Trigonella foenum-graecum morphophysiological and phytochemical processes controlling iron uptake and translocation. Crop Pasture Sci. 2022, 73, 957–968. [Google Scholar] [CrossRef]
  62. Chen, Y. Organic matter reactions involving micronutrients in soils and their effect on plants. In Humic Substances in Terrestrial Ecosystems; Elsevier: Amsterdam, The Netherlands, 1996; pp. 507–529. [Google Scholar]
  63. Alsudays, I.M.; Alshammary, F.H.; Alabdallah, N.M.; Alatawi, A.; Alotaibi, M.M.; Alwutayd, K.M.; Alharbi, M.M.; Alghanem, S.M.; Alzuaibr, F.M.; Gharib, H.S.; et al. Applications of humic and fulvic acid under saline soil conditions to improve growth and yield in barley. BMC Plant Biol. 2024, 24, 191. [Google Scholar] [CrossRef]
  64. Das, S.K. Role of micronutrient in rice cultivation and management strategy in organic agriculture—A reappraisal. Agric. Sci. 2014, 5, 765–769. [Google Scholar] [CrossRef]
  65. Akhtar, M.; Gulab, M.; Ghazanfar, M. Assessing Soil Health and Fertility through Microbial Analysis and Nutrient Profiling Implications for Sustainable Agriculture. Innov. Res. Appl. Biol. Chem. Sci. 2023, 1, 29–42. [Google Scholar]
  66. Tabaxi, I.; Kakabouki, I.; Zisi, C.; Folina, A.; Karydogianni, S.; Kalivas, A.; Bilalis, D. Effect of organic fertilization on soil characteristics, yield and quality of Virginia Tobacco in Mediterranean area. Emir. J. Food Agric. 2020, 32, 610–616. [Google Scholar] [CrossRef]
  67. Johan, P.D.; Ahmed, O.H.; Omar, L.; Hasbullah, N.A. Phosphorus transformation in soils following co-application of charcoal and wood ash. Agronomy 2021, 11, 2010. [Google Scholar] [CrossRef]
  68. Fernández, F.G.; Hoeft, R.G. Managing soil pH and crop nutrients. Ill. Agron. Handb. 2009, 24, 91–112. [Google Scholar]
  69. Bindraban, P.S.; Dimkpa, C.O.; Pandey, R. Exploring phosphorus fertilizers and fertilization strategies for improved human and environmental health. Biol. Fertil. Soils 2020, 56, 299–317. [Google Scholar] [CrossRef]
  70. Ho, T.T.K.; Le, T.H.; Tran, C.S.; Nguyen, P.T.; Thai, V.N.; Bui, X.T. Compost to improve sustainable soil cultivation and crop productivity. Case Stud. Chem. Environ. Eng. 2022, 6, 100211. [Google Scholar] [CrossRef]
  71. Bengough, A. Root growth and function in relation to soil structure, composition, and strength. In Root Ecology; Springer: Berlin/Heidelberg, Germany, 2003; pp. 151–171. [Google Scholar]
  72. Shabala, S.; Munns, R. Salinity stress: Physiological constraints and adaptive mechanisms. In Plant Stress Physiology; CABI: Wallingford, UK, 2017; pp. 24–63. [Google Scholar]
  73. Olaiya, C.O.; Soetan, K.O. A review of the health benefits of fenugreek (Trigonella foenum-graecum L.): Nutritional, Biochemical and pharmaceutical perspectives. Am. J. Soc. Issues Humanit. 2014, 4, 3–12. [Google Scholar]
  74. Rao, P.U.; Sharma, R. An evaluation of protein quality of fenugreek seeds (Trigonella foenumgraecum) and their supplementary effects. Food Chem. 1987, 24, 1–9. [Google Scholar] [CrossRef]
  75. El Nasri, N.A.; El Tinay, A.H. Functional properties of fenugreek (Trigonella foenum graecum) protein concentrate. Food Chem. 2007, 103, 582–589. [Google Scholar] [CrossRef]
  76. Kumari, N.; Kumar, P.; Wani, S.A. Effect of extraction parameters on the isolation of fenugreek seed protein and characterization of fenugreek protein concentrate. Qual. Assur. Saf. Crops Foods 2022, 14, 1–12. [Google Scholar] [CrossRef]
  77. Wierzbowska, J.; Zuk-Golaszewska, K. The impact of nitrogen fertilization and Rhizobium inoculation on the yield and quality of Trigonella foenum-graecum L. J. Elem. 2014, 19, 1109–1118. [Google Scholar] [CrossRef]
  78. Meena, S.S.; Mehta, R.S.; Bairwa, M.; Meena, R.D. Productivity and profitability of fenugreek (Trigonella foenum-graecum L.) as influenced by bio-fertilizers and plant growth regulators. Legume Res. 2014, 37, 646–650. [Google Scholar] [CrossRef]
  79. Wang, Z.H.; Li, S.X.; Malhi, S. Effects of fertilization and other agronomic measures on nutritional quality of crops. J. Sci. Food Agric. 2008, 88, 7–23. [Google Scholar] [CrossRef]
  80. Day, L.; Cakebread, J.A.; Loveday, S.M. Food proteins from animals and plants: Differences in the nutritional and functional properties. Trends Food Sci. 2022, 119, 428–442. [Google Scholar] [CrossRef]
  81. Okon, O.G. Effect of salinity on physiological processes in plants. In Microorganisms in Saline Environments: Strategies and Functions; Springer: Cham, Switzerland, 2019; pp. 237–262. [Google Scholar]
  82. Bilalis, D.; Tabaxi, I.; Zervas, G.; Tsiplakou, E.; Travlos, I.S.; Kakabouki, I.; Tsioros, S. Chia (Salvia hispanica) fodder yield and quality as affected by sowing rates and organic fertilization. Commun. Soil Sci. Plant Anal. 2016, 47, 1764–1770. [Google Scholar] [CrossRef]
  83. Muhammed, S.R. Response of Two Fenugreek Trigonella foenum-graecum Varieties to Different Cutting Dates and Nitrogen Fertilizer for Growth and Forage Yield Traits under Rainfed Condition. J. Tikrit Univ. Agric. Sci. 2017, 17, 134–142. [Google Scholar]
Figure 1. Mean values of (a) N (%), (b) Ca (g/100 g), (c) K (g/100 g), (d) Fe (ppm), (e) P (%), and (f) Mg (g/100 g) as affected by fertilization (biocyclic-vegan humus soil (BVH)), farmyard manure (FM), organic compost (OC), inorganic fertilizer (IF), and no treatment control (NTC]) and salinity levels (elevated salinity (ES) and normal salinity (NS)). Values that share the same letter are not significantly different, as determined by Tukey’s post hoc tests. The pattern on the columns refers to the ES treatment, and the solid color refers to the CS treatment.
Seeds 04 00009 g001
Figure 2. Mean values of (a) crude protein (%), (b) protein yield (kg/ha), (c) total ash (%), (d) dry matter (%), (e) crude fat (%) and (f) crude fiber (%) as affected by fertilization (biocyclic-vegan humus soil (BVH)), farmyard manure (FM), organic compost (OC), inorganic fertilizer (IF), and no treatment control (NTC) and salinity levels (elevated salinity (ES), and normal salinity (NS)). Values that share the same letter are not significantly different, as determined by Tukey’s post hoc tests. The pattern on the columns refers to the ES treatment, and the solid color refers to the CS treatment.
Seeds 04 00009 g002aSeeds 04 00009 g002b
Table 1. Methods and equations for assessing the chemical quality of seeds.
MeasurementsMeasurement UnitAnalysis Method/EquationReference
Nitrogen (N)(%)ISO, 1995 (11,261)[23]
Calcium (Ca)(g/100 g)ISO, 1994 (11,260)[24]
Potassium (K)(g/100 g)ISO, 1994 (11,260)[24]
Iron (Fe)(ppm)ISO, 2001 (14,870)[25]
Phosphorus (P)(%)ISO, 1994 (11,263)[24]
Magnesium (Mg)(g/100 g)ISO, 1994 (11,260)[24]
Seed Crude Ash(%)924.05[26,27]
Seed DM(%)943.01[26,27]
Seed Crude Fat(%)920.39[26,27]
Seed Crude Fiber(%)978.10[26,27]
Seed Crude Protein(%)Multiplying N concentration by 6.25[26,27]
Seed Protein YieldKg N/haSeed Crude Protein (%) × Seed Yield (kg/ha)[28]
Harvest Index (HI)-(Seed yield (kg/ha)/Biological yield (kg/ha)) × 100[28]
Translocation Percentage (TP)-Straw weight at flowering—straw weight at harvest/Panicle weight at flowering—panicle weight at harvest[29,30]
Table 2. Two-way ANOVA of the fertilization (biocyclic-vegan humus soil (BVH)), farmyard manure (FM), organic compost (OC), inorganic fertilizer (IF), and no treatment control (NTC) and salinity levels (elevated salinity (ES), and normal salinity (NS)) effects on plant height (cm), number of pods per plant, number of double pods per plant, pod length, and number of seeds per pod.
TreatmentsPlant HeightΝο Pods/Plant No Double Pods/PlantPod LengthNo Seed/Pod
YEAR A
BVH × ES73.67 a32.66 a4.17 a17.33 a20.80 a
BVH × NS 74.00 a31.97 a3.67 a18.00 a21.60 a
FM × ES 73.00 a32.66 a4.00 a17.33 a20.80 a
FM × NS 72.27 a31.28 a2.33 b19.00 a22.80 a
IF × ES70.33 a32.67 a3.33 a18.00 a21.60 a
IF × NS 70.10 a31.28 a3.00 ab18.67 a22.40 a
NTC × ES50.37 c18.94 c1.00 c10.00 b12.00 b
NTC × NS51.00 c21.00 bc1.00 c11.00 b13.20 b
OC × ES 60.35 b28.54 ab3.33 a17.00 a20.40 a
OC × NS60.55 b20.31 bc3.00 ab16.67 a20.00 a
Std Dev. ±9.37±6.64±1.12±4.41±4.09
FFertilization448.53 ***8.41 **22.87 ***24.19 ***24.19 ***
FSalinity1nsns8.76 *nsns
FFertiliz×Salin4nsnsnsnsns
YEAR B
BVH × ES74.67 ab38.83 a5.33 a25.00 a30.00 a
BVH × NS75.67 a38.83 a5.00 ab24.67 a29.60 a
FM × ES70.33 bc33.34 ab4.00 abc23.00 ab27.60 ab
FM × NS71.83 abc36.09 a4.00 abc24.33 a29.20 a
IF × ES67.50 c32.66 ab3.00 cde21.67 bc26.00 bc
IF × NS67.33 c36.09 a3.67 bcd23.00 ab27.60 ab
NTC × ES49.93 e23.06 c1.00 fg15.33 d18.40 d
NTC × NS52.50 e27.17 bc0.67 g17.33 d20.80 d
OC × ES58.72 d27.17 bc2.33 def21.00 bc25.20 bc
OC × NS59.92 d35.40 a2.00 efg20.33 c2.40 c
Std Dev. ±9.09±6.53±1.64±4.11±4.93
Df
Rep2
FFertilization4135.03 ***24.13 ***16.44 ***62.67 ***62.67 ***
FSalinity1ns5.32 *nsnsns
FFertiliz×Salin4nsnsnsnsns
Error16
Total29
The F-test indicators are from the ANOVA. Different letters (a, b, c, d, e, f and g) within a column indicate significant differences according to Tukey’s test. Significance levels: * p < 0.05, ** p < 0.01, *** p < 0.001; ns: not significant (p > 0.05).
Table 3. Two-way ANOVA analysis of the effects of fertilization (biocyclic-vegan humus soil (BVH), farmyard manure (FM), organic compost (OC), inorganic fertilizer (IF), and no treatment control (NTC)) and salinity levels (elevated salinity (ES), and normal salinity (NS)) on pod area index (PAI), seed yield (kg/ha), thousand seed weight (TSW) (g), harvest index (HI), and translocation percentage (TP).
TreatmentsPAI 130Seed YieldTSWHITP
YEAR A
BVH × ES45.83 a1403.30 de16.41 a31.54 c51.06 a
BVH × NS45.83 a2040.20 a17.60 a43.44 abc49.44 ab
FM × ES 42.78 ab1866.70 abc15.53 a42.76 abc49.55 ab
FM × NS42.80 ab2160.20 a16.47 a46.54 ab47.99 abc
IF × ES37.43 b1613.40 bcd14.40 a38.37 abc50.24 a
IF × NS41.25 ab2120.20 a15.78 a47.41 ab46.55 abc
NTC × ES26.74 c1096.70 e9.26 b37.29 bc36.64 de
NTC × NS28.26 c1240.10 de10.48 b37.99 abc35.10 e
OC × ES38.19 ab1500.70 cde13.20 a41.56 abc42.13 cd
OC × NS37.43 b2000.20 ab13.61 a50.59 a42.81 bcd
Std Dev. ±7.45±445.02±2.94±8.86±6.39
F Fertilization 59.95 ***16.86 ***526.28 ***ns22.21 ***
F Salinity ns20.43 **14.18 **7.98 **ns
F Fertiliz×Salin nsnsnsnsns
YEAR B
BVH × ES 53.59 a2161.10 a18.33 a47.64 a49.68 a
BVH × NS 52.71 a2042.10 ab17.57 ab45.97 ab47.30 ab
FM × ES 49.19 ab2041.80 ab17.10 abc45.96 ab47.24 ab
FM × NS 48.66 ab1947.10 abc16.27 bcd45.85 ab45.42 ab
IF × ES46.02 ab1871.10 bcd15.90 cd45.09 ab45.11 ab
IF × NS 43.05 b1756.10 cde15.53 cd44.51 ab42.10 bc
NTC × ES43.05 b1682.70 de15.37 d43.54 ab38.57 cd
NTC × NS41.98 b1628.40 e15.00 d41.83 ab36.35 de
OC × ES 32.50 c1346.70 f12.07 e41.46 ab33.19 e
OC × NS30.75 c1255.10 f11.63 e40.79 b33.02 e
Std Dev. ±8.63±418.21±2.29±9.00±6.52
Df
Rep2
FFertilization480.28 ***29.92 ***34.63 ***ns69.44 ***
FSalinity1nsnsnsnsns
FFertiliz×Salin4nsnsnsnsns
Error16
Total29
The F-test indicators are from the ANOVA. Different letters (a, b, c, d, e and f) within a column indicate significant differences according to Tukey’s test. Significance levels: ** p < 0.01, *** p < 0.001, ns: not significant (p > 0.05).
Table 4. Analysis of variance (ANOVA) for seed elemental composition and nutrient content under different fertilization and salinity treatments across two years.
DfN Seed (%)Ca Seed (g/100 g)K Seed (g/100 g)Fe Seed (ppm)P Seed (%)Mg Seed (g/100 g)
Year A
FFertilization4175.98 ***8.47 **41.08 ***114.34 ***71.59 ***81.68 ***
FSalinity110.14 **6.4 *70.95 ***ns45.52 ***ns
FFertiliz×Salin4nsns7.95 **ns8.99 **ns
Year B
Rep2
FFertilization4175.98 ***11.31 **41.08 ***109.37 ***70.04 ***51.30 ***
FSalinity110.14 **33.8 ***70.95 ***13.82 **25.82 ***ns
FFertiliz×Salin4ns4.05 *7.95 **ns4.15 *ns
Total29
F-test ratios are from ANOVA. Significance levels: * p < 0.05; ** p < 0.01; *** p < 0.001; ns, not significant (p > 0.05).
Table 5. ANOVA results for proximate composition of seeds under different fertilization and salinity treatments across two years.
DfSeed Crude Protein (%)Seed Protein Yield (kg/ha)Seed Total AshSeed DMSeed Crude Fat Seed Crude Fiber
Year A
FFertilization483.66 ***39.40 ***nsns14.85 ***5.59 *
FSalinity16.97 *23.02 ***10,824.98 ***9.97 *159.78 ***44.68 ***
FFertiliz×Salin4nsnsnsnsnsns
Year B
Rep2
FFertilization4107.07 ***39.41 ***16.86 ***16.86 ***11.80 **10.46 **
FSalinity15.89 *ns59,495.62 ***10.20 ***34.30 ***136.39 ***
FFertiliz×Salin4nsnsnsnsns3.8 *
Total29
F-test ratios are from ANOVA. Significance levels: * p < 0.05; ** p < 0.01; *** p < 0.001; ns, not significant (p > 0.05).
Disclaimer/Publisher’s Note: The statements, opinions and data contained in all publications are solely those of the individual author(s) and contributor(s) and not of MDPI and/or the editor(s). MDPI and/or the editor(s) disclaim responsibility for any injury to people or property resulting from any ideas, methods, instructions or products referred to in the content.

