Article

QTL Identification of Hull Color for Foxtail Millet [Setaria italica (L.) P. Beauv.] Through Four Phenotype Identification Strategies in a RIL Population

1
College of Agriculture, State Key Laboratory of Crop Stress Biology in Arid Areas, Northwest A&F University, Yangling 712100, China
2
Institute of Millet Crops, Anyang Academy of Agricultural Sciences, Anyang 455000, China
*
Author to whom correspondence should be addressed.
These authors contributed equally to this work.
Seeds 2025, 4(1), 10; https://doi.org/10.3390/seeds4010010
Submission received: 27 December 2024 / Revised: 12 February 2025 / Accepted: 17 February 2025 / Published: 19 February 2025

Abstract

:
The foxtail millet exhibits a diverse range of hull colors, which are crucial indicators for assessing its nutritional and economic value. However, the molecular regulatory mechanisms that govern the hull color of foxtail millet are largely unknown at present. This gap in knowledge significantly impedes efforts to enhance the quality traits of foxtail millet. This study utilized a population of 250 F6 recombinant inbred lines (RILs) generated from a cross between two foxtail millet varieties: Yugu18 (with light yellow seeds) and Hongjiugu19 (with red seeds). Four methods, the visual grouping method (I), the visual colorimetric method (II), the Lab determination method (III), and the RGB determination method (IV), were employed to determine the hull color of each line across four environments and QTL identification were conducted subsequently. It showed that there were 10, 12, 69 and 56 QTLs were detected for hull color through four methods, and these QTLs were integrated into 4, 6, 27 and 25 unique QTLs, respectively. There were three, four, four and four major QTLs. Of which, three major QTLs (qHC1.1, qHC1.2 and qHC9.3) on chromosomes 1 and 9 could be detected by all 4 methods. qHC9.1 was detected by all four methods except for method I. There were also one, one, seven and four minor identity QTLs identified across the 4 methods. Four minor QTLs (qHC3.1, qHC3.3, qHC4.1 and qHC5.1) can be stably detected only in method III, and two minor QTLs (qHC8.2 and qHC9.2) can be stably detected only in method IV. Generally, method I is fast, efficient and cost-effective, which is suitable for the rapid detection of hull color. Method II is also low-cost; however, it can detect more QTL for hull color, making it suitable for identifying major QTL loci in large populations. Methods III and IV can map more minor QTL and are more accurate in hull color characterization. This study identified four important hull color QTL for foxtail millet, which largely align with those reported in previous research. These findings establish a foundation for characterizing hull color indices and further advancing QTL mapping for grain color.

1. Introduction

Foxtail millet [Setaria italica (L.) P. Beauv.] is an annual herb belonging to the genus Setaria of the Poaceae family, with its origin in China around 11,500 years ago [1,2]. This cereal exhibits a nutritional profile rich in vitamins, proteins, fats, carbohydrates and essential nutrients like calcium, phosphorus and iron, surpassing major crops such as rice and wheat in comprehensive nutritional performance [3,4]. Its exceptional drought resistance, adaptability to barren soil and cultivation feasibility in arid and semiarid regions make it a crucial crop for mitigating water scarcity challenges and supporting water-saving agricultural practices [5,6]. Enhancing foxtail millet production is pivotal for improving dietary diversity in drought-prone regions, alleviating agricultural water demands and bolstering economic resilience for farmers.
Hull color, a key phenotypic trait in foxtail millet, ranges from yellow, light yellow, white, and green to red, with light yellow and yellow being predominant [7,8]. The nutrient composition of foxtail millet shows considerable variation correlating with the color of the hull. He et al. [9] discovered that foxtail millet possessing cyan-colored grains contains higher levels of protein, fat and lysine, thus facilitating the indirect selection of varieties with enriched nutrient content. Significantly, brown grain varieties exhibit reduced yield loss from bird predation compared with yellow and red counterparts, suggesting their potential for minimizing crop losses [10]. Empirical studies attribute color variation in plant organs primarily to flavonoid composition [11,12,13]. Flavonoids, a major class of plant secondary metabolites, are ubiquitous across species [14]. Flavonoids play a pivotal role in enhancing plant resilience to environmental stress. For example, flavonols contribute to the absorption of UV-B radiation and the scavenging of reactive oxygen species, thereby protecting plants from oxidative damage [15]. The accumulation of anthocyanins and flavonols has been shown to improve the antioxidant capacity and drought resistance of plants [16,17]. Furthermore, flavonoids confer human health benefits, including cardiovascular and cerebrovascular disease prevention [18]. Carotenoids and flavonoids, the primary yellow pigments in de-husked grains, serve as direct quality indicators for consumers and are linked to nutritional and pharmacological benefits [19]. Therefore, the hull color of foxtail millet is a crucial indicator for assessing its nutritional quality and market value. Unraveling the genetic mechanisms of hull color variation is essential for enhancing both the nutritional quality and yield of foxtail millet [7].
Current hull color phenotyping lacks standardized methods, hindering research progress. Existing techniques include visual classification, Lab/RGB color spaces and pigment extraction [20,21,22,23]. The visual grouping method is a widely utilized, straightforward and direct approach to color classification. It has been applied in foxtail millet [24], sesame [20], sorghum [25], soybean [26] and pepper [27]. Lab color space, common in food science, quantifies color attributes in Brassica napus [28], black beans [29], cherries [30], foxtail millet [31], cucumbers [32], peppers [27] and sesame [20]. The RGB color space is often utilized in plant color measurement and image processing, and it has been extensively applied to wheat [33], peanuts [12], corn [34] and soybeans [35]. Organ color is a complex trait influenced by various metabolites, affecting its external appearance. Accurate color determination is essential for mapping and cloning genes associated with color-related traits in plants. Existing studies typically employ only one method for phenotypic determination; however, the precise comparison of corresponding color determination techniques remains unreported.
Genetic studies on hull color have identified key loci using molecular markers, including Restriction Fragment Length Polymorphism (RFLP) [36], Amplified Fragment Length Polymorphism (AFLP) [37], Single Nucleotide Polymorphism (SNP) markers [38] and Simple Sequence Repeats (SSRs) markers [39]. Wang et al. [40] mapped the gene responsible for white hull color in foxtail millet to chromosome 4 and the gene for green hull color to chromosome 6 through trisomic analysis. Subsequently, Jia et al. [41] analyzed 916 diverse foxtail millet varieties using genome-wide association studies (GWASs) and pinpointed genes linked to hull color on chromosomes 1, 6, and 9. In a later study, Wang et al. [42] employed reduced representation genome sequencing (RAD-seq) to identify a quantitative trait locus (QTL), Sihc1, located at the terminal region of chromosome 6, which explains 80.26% of the phenotypic variation in hull color. This locus corresponds with the results identified in the GWAS conducted by Jia [41]. Xie et al. [24] employed recombinant inbred lines derived from a cross between Yugu 18 and Jigu 19 to identify three QTL on chromosome 1 that influence foxtail millet hull color, pinpointing Seita.1G057300.v2.2 as the pivotal gene for this trait. Consequently, Tian et al. [38] utilized a recombinant inbred line population (F2:6) from a cross between Yugu 5 and Jigu 31 to identify a novel QTL, QHC.czas1, which governs hull color on chromosome 1. However, due to the complex genetic basis of foxtail millet hull color, its genetic mechanism remains unclear. Precise QTL mapping associated with foxtail millet hull color is pivotal for delving into the genetic mechanisms governing foxtail millet hulls.
To address the deficiency of rapid and effective analytical techniques for determining grain hull color in foxtail millet, this study utilized four distinct methods to assess hull color traits: visual grouping, visual colorimetry, Lab measurement and RGB measurement. Phenotypic assessments of grain hull color were executed on 250 families within the RYRIL recombinant inbred line population across four distinct environments over two years. Additionally, the genotypic data of each family was synthesized to conduct QTL mapping of the color metrics obtained from these methods. The results of QTL mapping were subsequently leveraged to evaluate the advantages and limitations of each method, along with their potential application scenarios. This analysis provides technical insights and establishes a theoretical foundation for enhancing the visual quality of millet varieties.

2. Materials and Methods

2.1. Plant Materials

Yugu 18 was selected as the paternal parent and the local variety Hongjiugu as the maternal parent for crossbreeding. Using the single-seed descent method from the F2 generation, a recombinant inbred line (RIL) population comprising 250 lines was developed and designated as RYRIL. Field trials utilizing the RIL population were implemented at two locations in Shaanxi Province, China: Yulin (37°56′26″ N, 109°21′46″ E) and Baoji (34°26′36″ N, 107°37′15″ E). The experiments followed a randomized complete block design (RCBD) with three replications conducted during the growing seasons (May to October) of 2020 and 2021. At the start of the field experiment, the entire field was plowed, thoroughly mixed and harrowed to ensure uniform soil conditions across all experimental plots. Each plot contained four rows, each 2 m long, with a row spacing from 0.30 to 0.40 m. All plants were cultivated following standard agronomic practices.

2.2. Phenotypic Determination Method for Hull Color

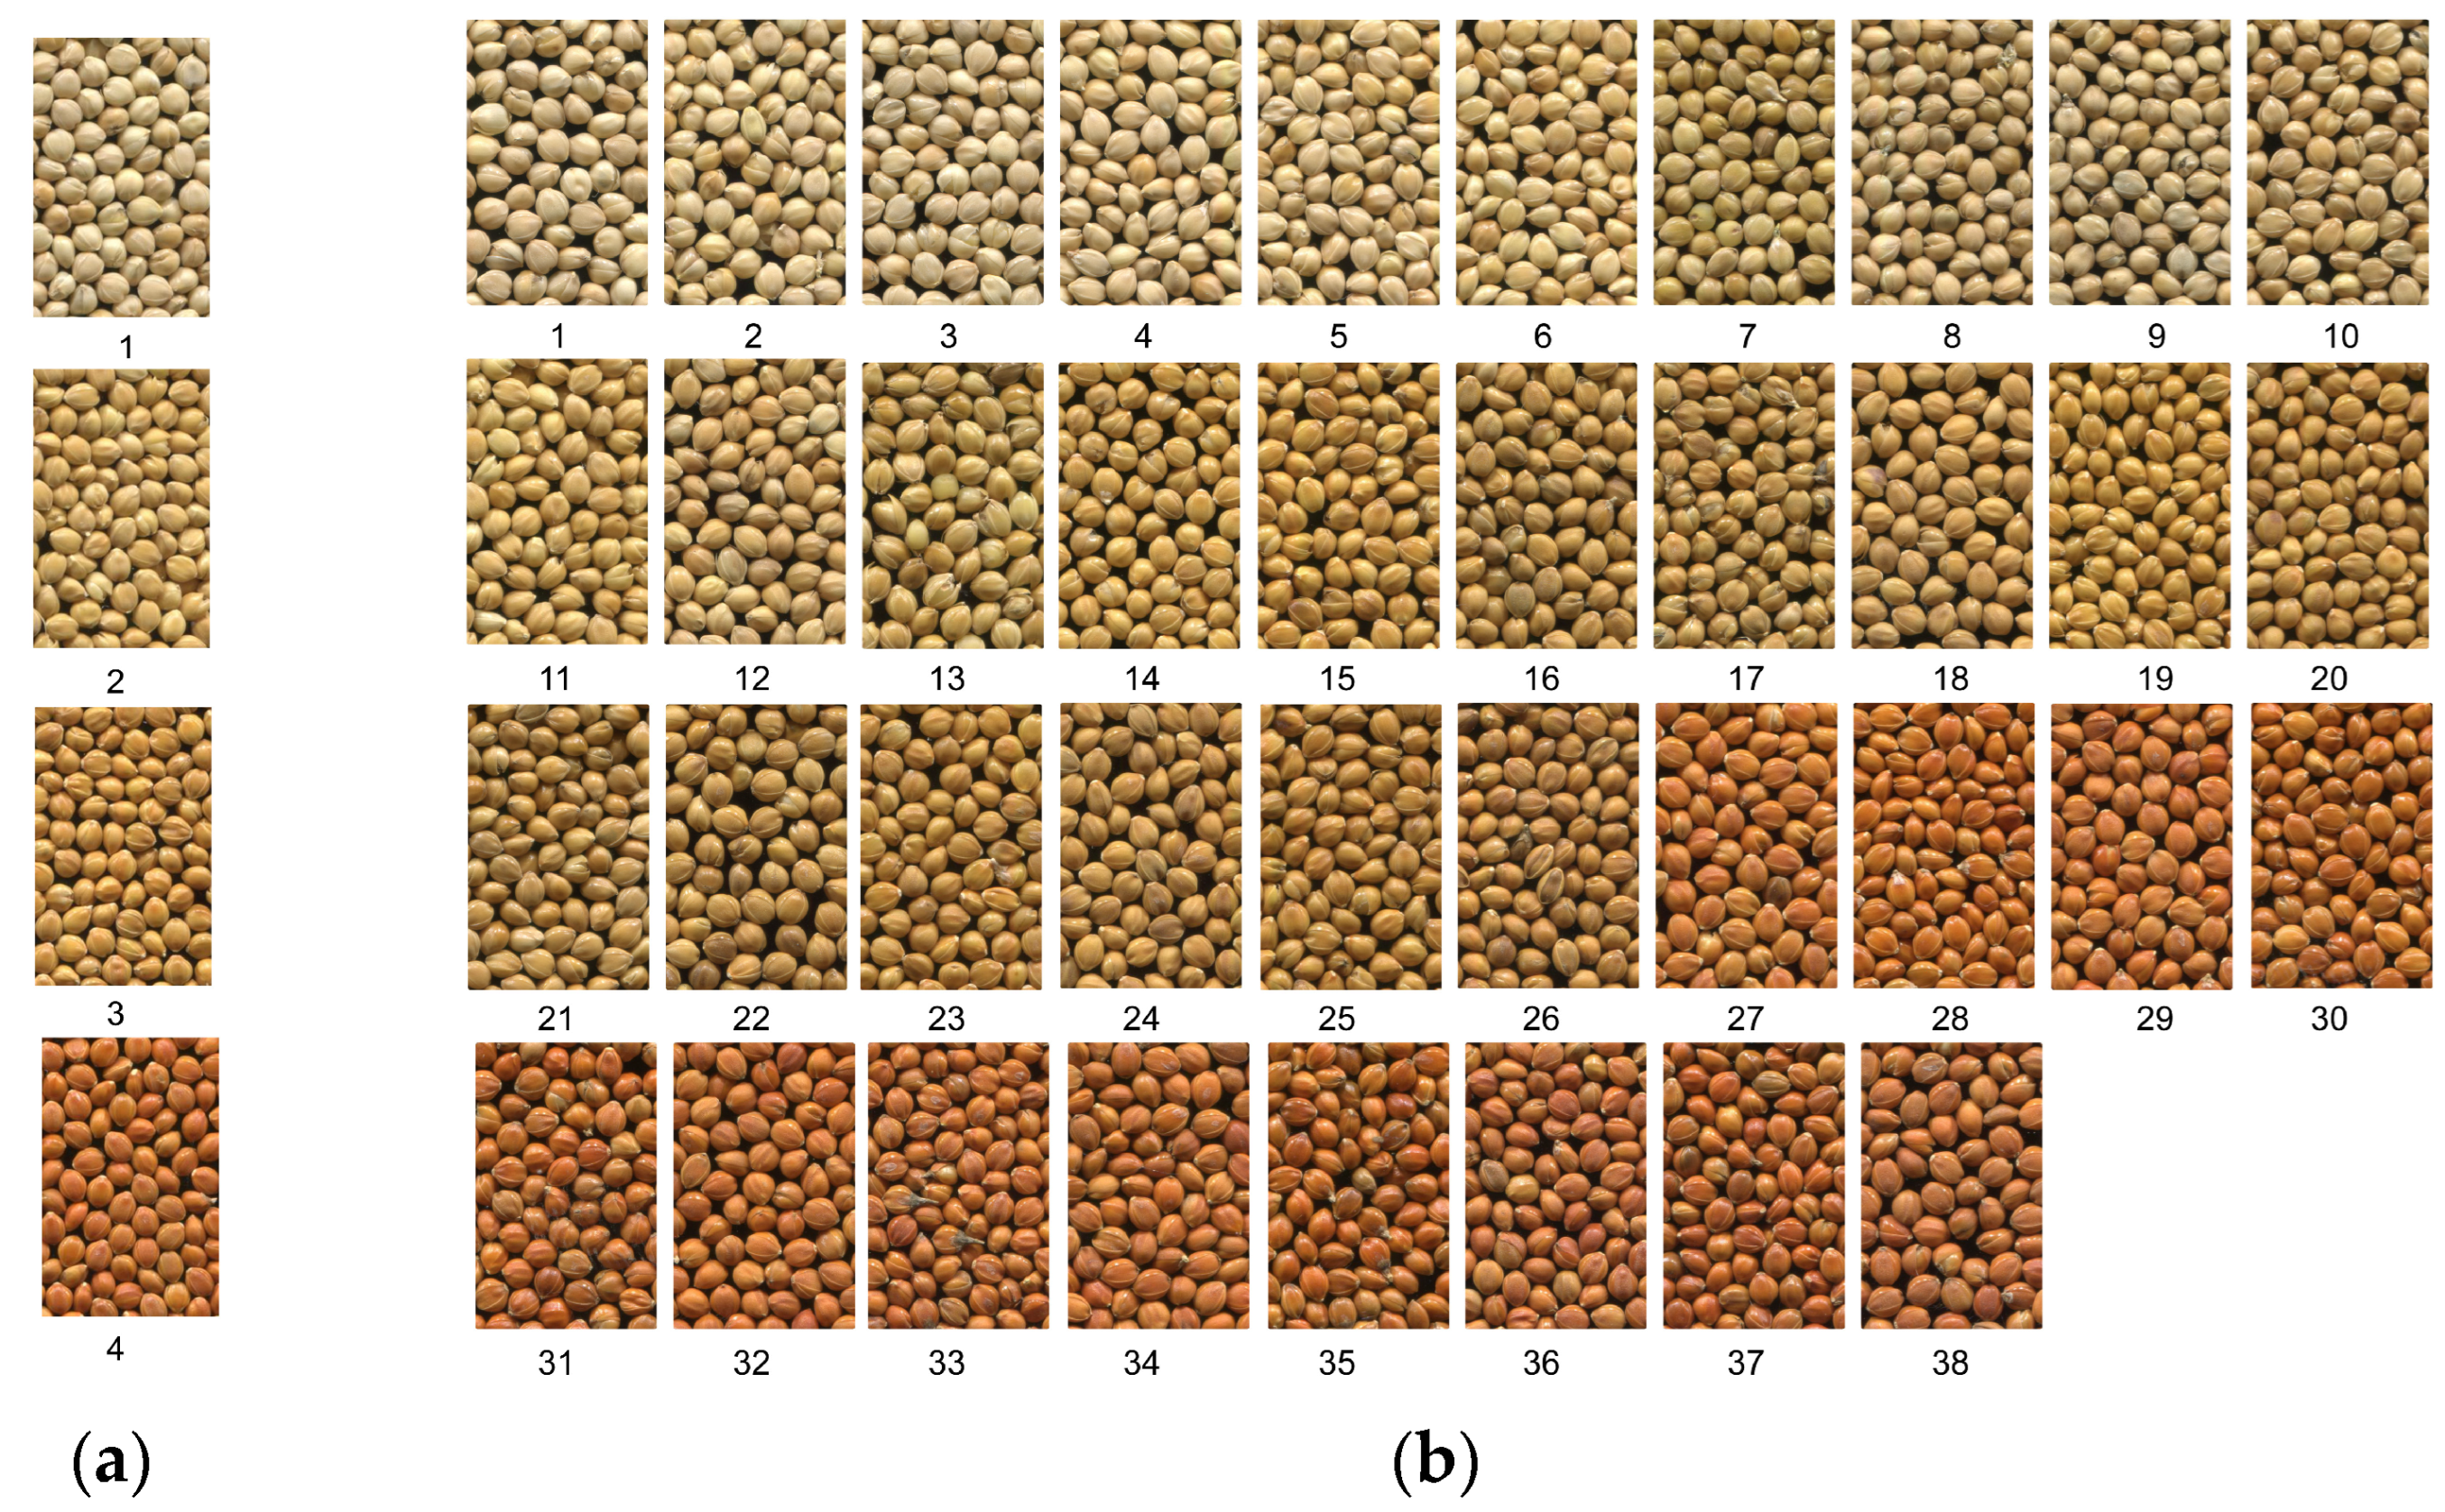
2.2.1. Method I: Visual Grouping Method

The visual grouping method relies on direct observation with the unaided eye to classify hull colors at maturity based on their pigmentation depth. Numerical values are assigned in ascending order from light to dark. The value was used for subsequent QTL mapping.

2.2.2. Method II: Visual Colorimetric Method

Within the population, foxtail millet hull color shows a continuous spectrum from light to deep shades. The precise categorization of certain variants can be challenging during direct observation. To accurately discern these subtle color variations, we implemented the visual colorimetric method. Hull color is assessed visually, with the first line’s color being categorized into Group A. Should the second line’s color align with the first, it is likewise grouped into Group A; otherwise, it is designated to Group B. After categorizing all lines, the groups are ordered by color depth and assigned values. The lightest color is assigned a value of 1, followed by 2, 3, 4 and so on, until the darkest group. The value also was used for subsequent QTL mapping.

2.2.3. Method III: Lab Determination Method

The Commission Internationale de l’Éclairage L*a*b* color space comprises three components: L* (luminance), a* (red-green value) and b* (yellow-blue value). L* values span from 0 to 100, indicating a continuum from black to white. The a* value delineates the spectrum from green to red, while the b* value indicates the spectrum from blue to yellow. Both a and b values range from +120 to −120 [29,30,32]. Additionally, the chroma (C*) value is derived from the a* and b* values using the following formula:
C*2 = a*2 + b*2

2.2.4. Method IV: RGB Determination Method

The Red-Green-Blue (RGB) color space represents colors through additive combinations of three primary components: red (R), green (G) and blue (B), each quantified on a scale from 0 to 255. This system enables the generation of 16,777,216 (2563) distinct color variants [43]. At maturity, three representative panicles were collected from each plot, threshed, and evaluated for hull color under ambient indoor light. Color measurements were obtained using a CS-820N spectrophotometer (Hangzhou Caipu Technology Co., Ltd., Hangzhou, China) under D65 illumination (10 mm diameter aperture). The instrument was calibrated using white and black standards prior to and every 15 min during data acquisition. For the Lab color determination, L*, a* and b* values were recorded, from which the chroma (C*) value was derived. For RGB parameters, spectral reflectance data were converted to R, G and B values through manufacturer-provided algorithms. To minimize spatial heterogeneity effects, triplicate measurements were taken from the upper, middle, and lower regions of each millet grain’s dorsal surface. The arithmetic mean of these replicates served as the final color metric.

2.2.5. QTL Mapping

The high-density genetic linkage map employed in this study was pre-constructed by our laboratory. It encompasses 20,748 SNP markers and 1759 InDels, with 1420 bin markers distributed across nine linkage groups. The map spans a total length of 1227.382 cm, with an average map distance of 0.879 cm [31]. QTL analysis for hull coloration was conducted across four distinct environments (20YL, 20BJ, 21YL and 21BJ) using complementary approaches. Primary QTL detection was performed with IciMapping software (v4.2) employing the inclusive composite interval mapping (ICIM) method within the biparental populations (BIP) module. A conservative logarithm of odds (LOD) threshold of 2.5 was implemented to balance detection sensitivity (α = 0.05) and type I error control. Epistatic interactions were analyzed through QTLNetwork (v2.0) using mixed-model-based composite interval mapping (MCIM) to identify additive × additive (AA) effects. QTLs that exhibited overlapping or adjacent confidence intervals across various environments were consolidated as unique QTLs. Those identified in at least two environments were deemed to be stably expressed QTLs, whereas QTLs with a contribution rate greater than 10% were designated as major QTLs [44]. Considering the extensive range of color parameters measured by both Lab and RGB methods, for comparative purposes, QTL loci linked to identical color parameters in both methods and identified in numerous environments were regarded as stable QTL loci.

2.3. Statistics Analysis

The arithmetic mean, standard deviation and coefficient of variation were computed using Microsoft Excel 2019. The RYRIL population’s distribution normality was assessed via the Shapiro–Wilk test (α = 0.05) implemented in SPSS Statistics 21.0. Parental line differences were evaluated through independent two-tailed Student’s t-tests (α = 0.01) using the same statistical package. Variance analysis of genotype (σg2), environment (σe2), genotype–environment interaction (σge2) and error (σε2) was conducted using the ANOVA module in QTL IciMapping v4.2 software [45]. Broad-sense heritability (H2) was calculated using the following formula:
H2 = σg2/(σg2 + σge2/n + σε2/nr)
where n represents the number of environments, and r represents the number of replicates per environment [46].

3. Results

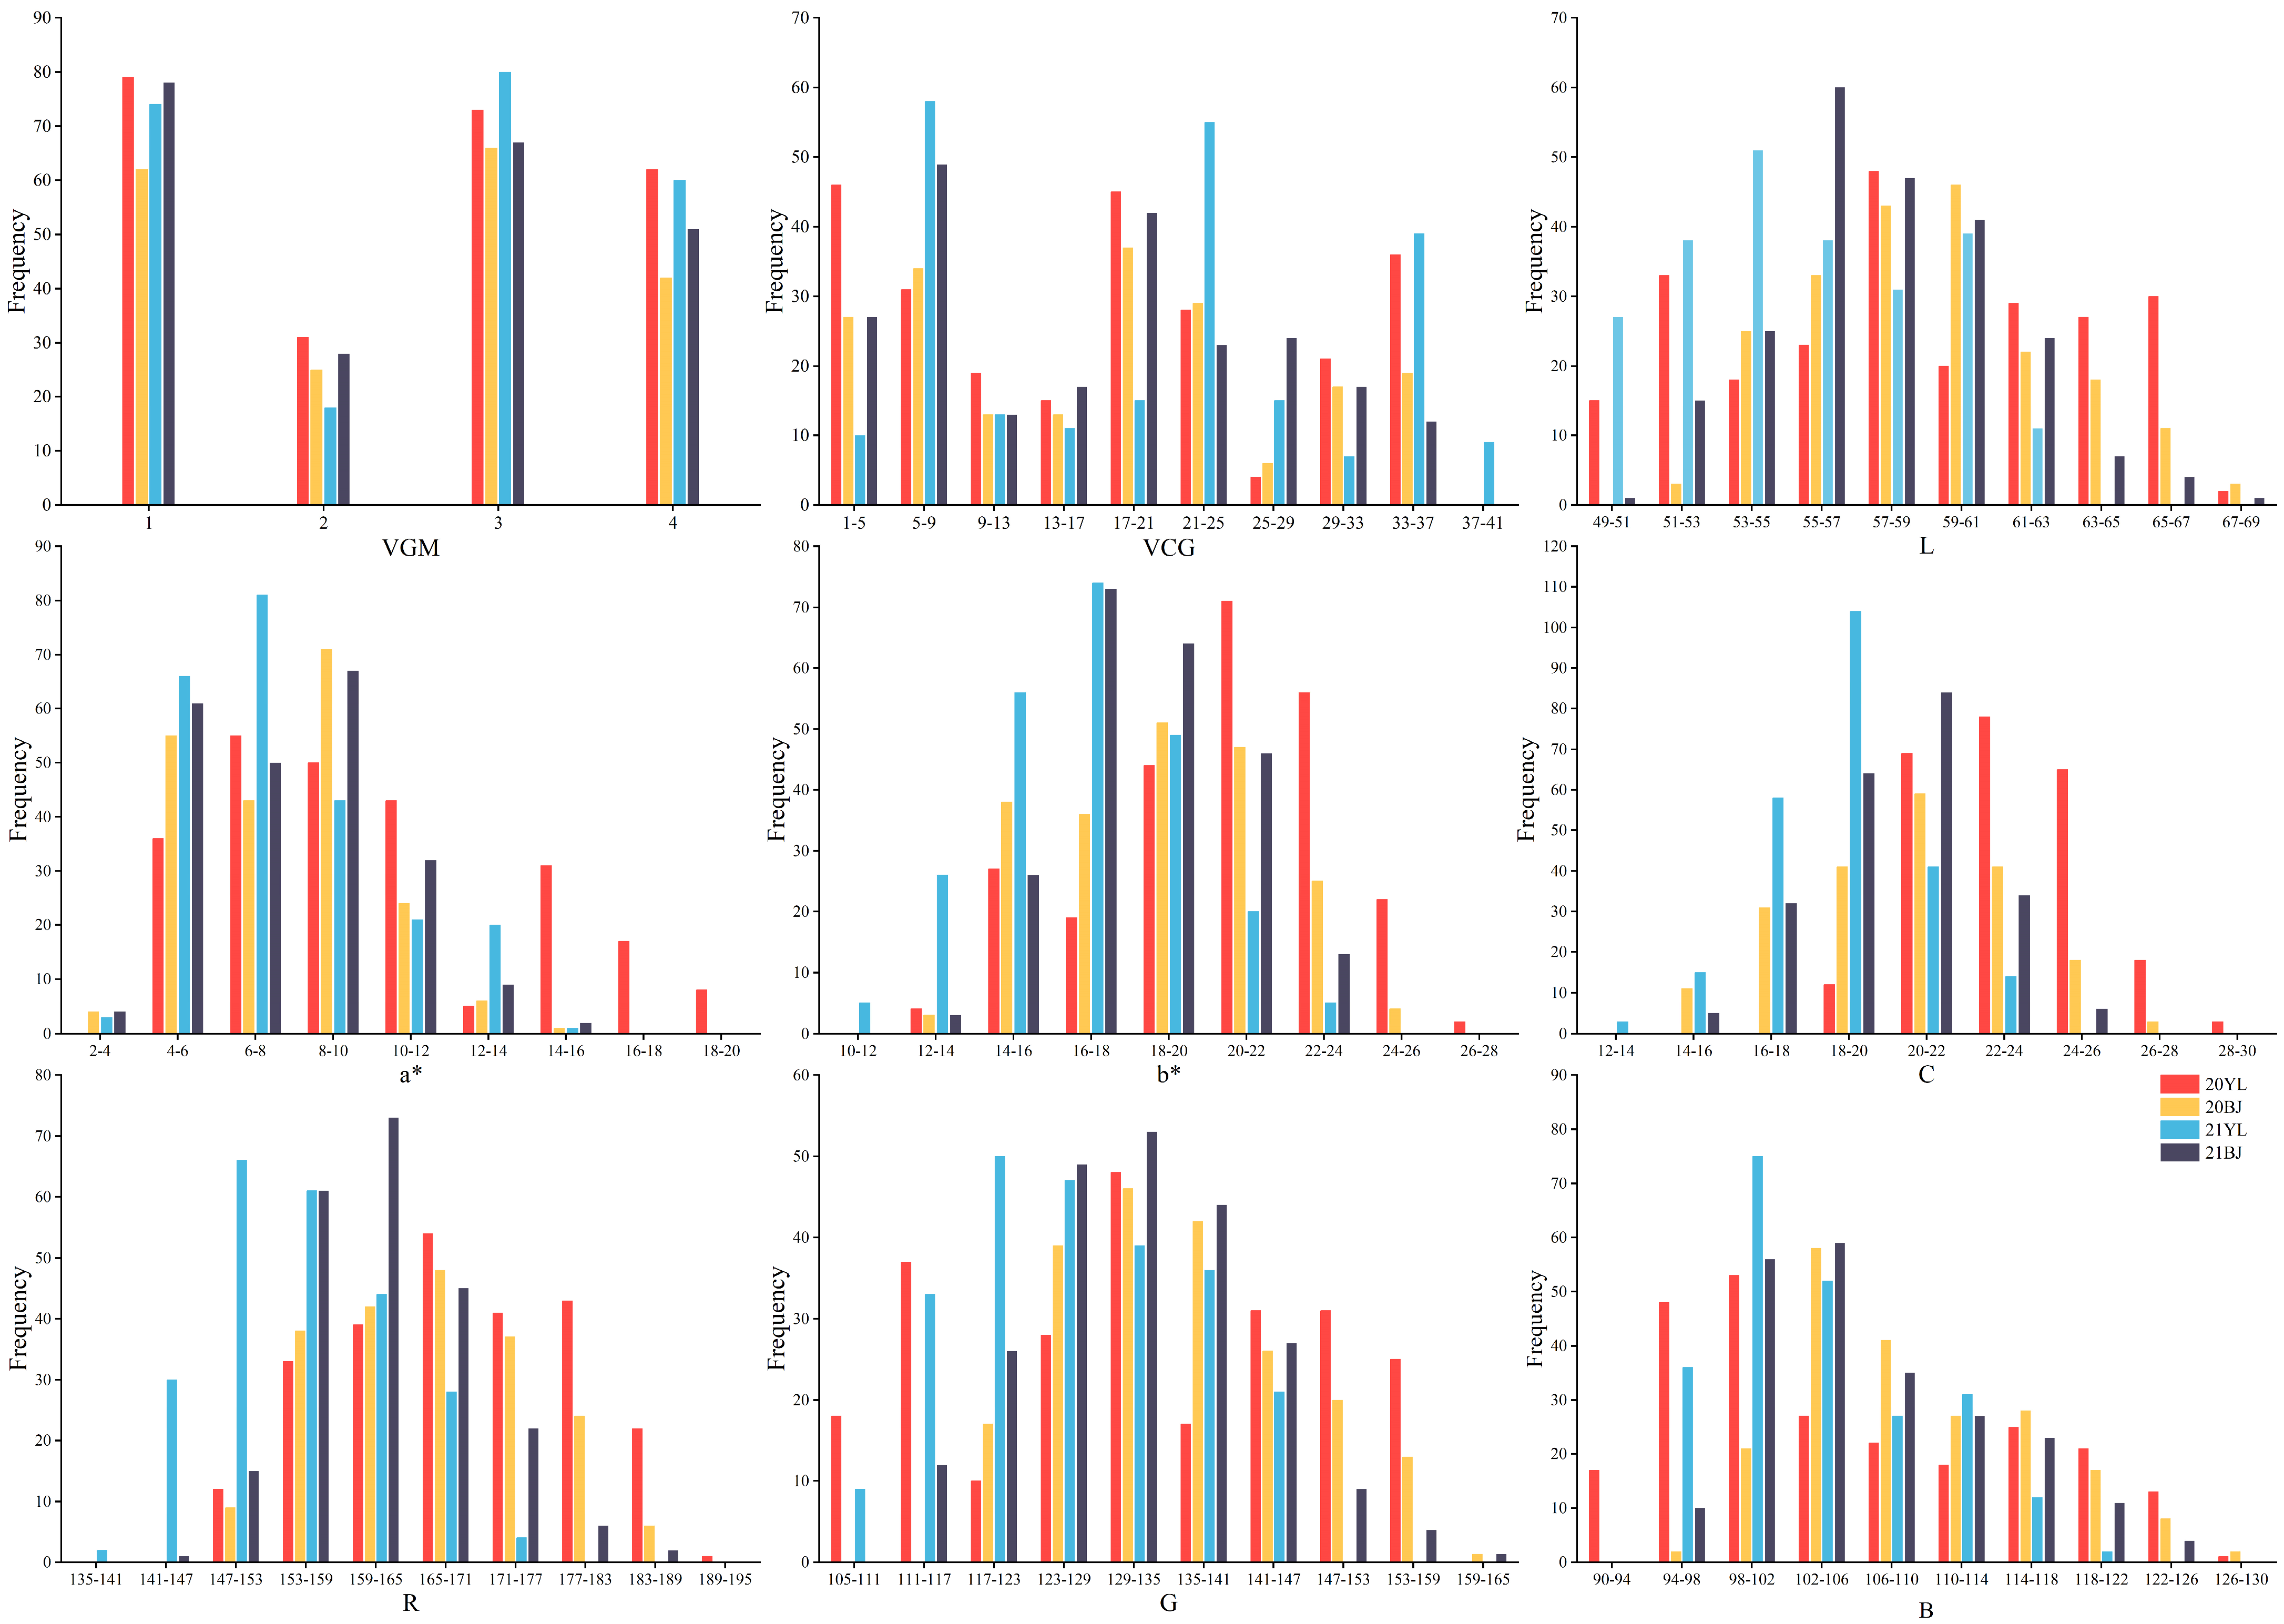
3.1. Phenotypic Variation of Hull Color in RYRIL Population by Four Methods

The visual grouping method categorized grain color into four groups, from light to dark, assigning sequential values of 1 through 4 to each: light yellow is designated as 1, yellow as 2, dark yellow as 3 and red as 4 (Figure 1a). In contrast, the visual colorimetric method sorted grain hull color into 38 groups, also from light to dark, with respective values ranging from 1 to 38 (Figure 1b). Because both methods depend on visual observation, the consistent outcomes from repeated measurements rendered t-tests and variance analysis superfluous.
The results of the independent samples t-test on the color parameters (L*, a*, b* C* R, G and B) show that there are significant differences between the two parents in the RYRIL population (p < 0.01), which provides a good genetic background for QTL analysis. In method I, the mean value of VGM is 2.47, and the coefficient of variation is 47.66%. In method II, the mean value of VCM is 18.22, with a coefficient of variation of 57.24%. Regarding method III, the mean values of the color parameters L*, a*, b* and C* are 57.73, 8.29, 18.65 and 20.64, respectively, and their corresponding coefficients of variation are 6.53%, 32.24%, 13.72% and 10.58%, respectively. In method IV, the mean values of R, G and B are 163.83, 132.25 and 106.15, respectively, and the coefficients of variation are 5.07%, 8.32% and 6.69%, respectively. (Table 1).
The phenotypes of the nine color parameters (VGM, VCM, L*, a*, b* C* R, G and B) exhibited a continuous distribution across the four environments. The absolute kurtosis values of VGM and VCM exceeded 1, showing steeper, higher-peaked and heavier-tailed distributions than the normal one. For most cases, the absolute values of both kurtosis and skewness of RGB and Lab color parameters were less than 1, indicating near-normal distributions with data fairly evenly spread around the mean and approximate symmetry (Table 1, Figure 2). In contrast, the parameter L* exhibited a multi-peak distribution in 20YL and 21YL, and the parameter a* showed a similar characteristic in 20BJ and 21BJ. An analysis of variance (ANOVA) was performed on the color parameters measured using the Lab and RGB methods. The results showed that L*, a*, b*, C*, R, G and B values were significantly influenced by genetic factors, environmental factors and their interactions (p < 0.01). The broad-sense heritability of these seven grain color parameters across combined environments ranged from 0.76 to 0.93, indicating that genetic factors are the main contributors to phenotypic variation (Table 2).

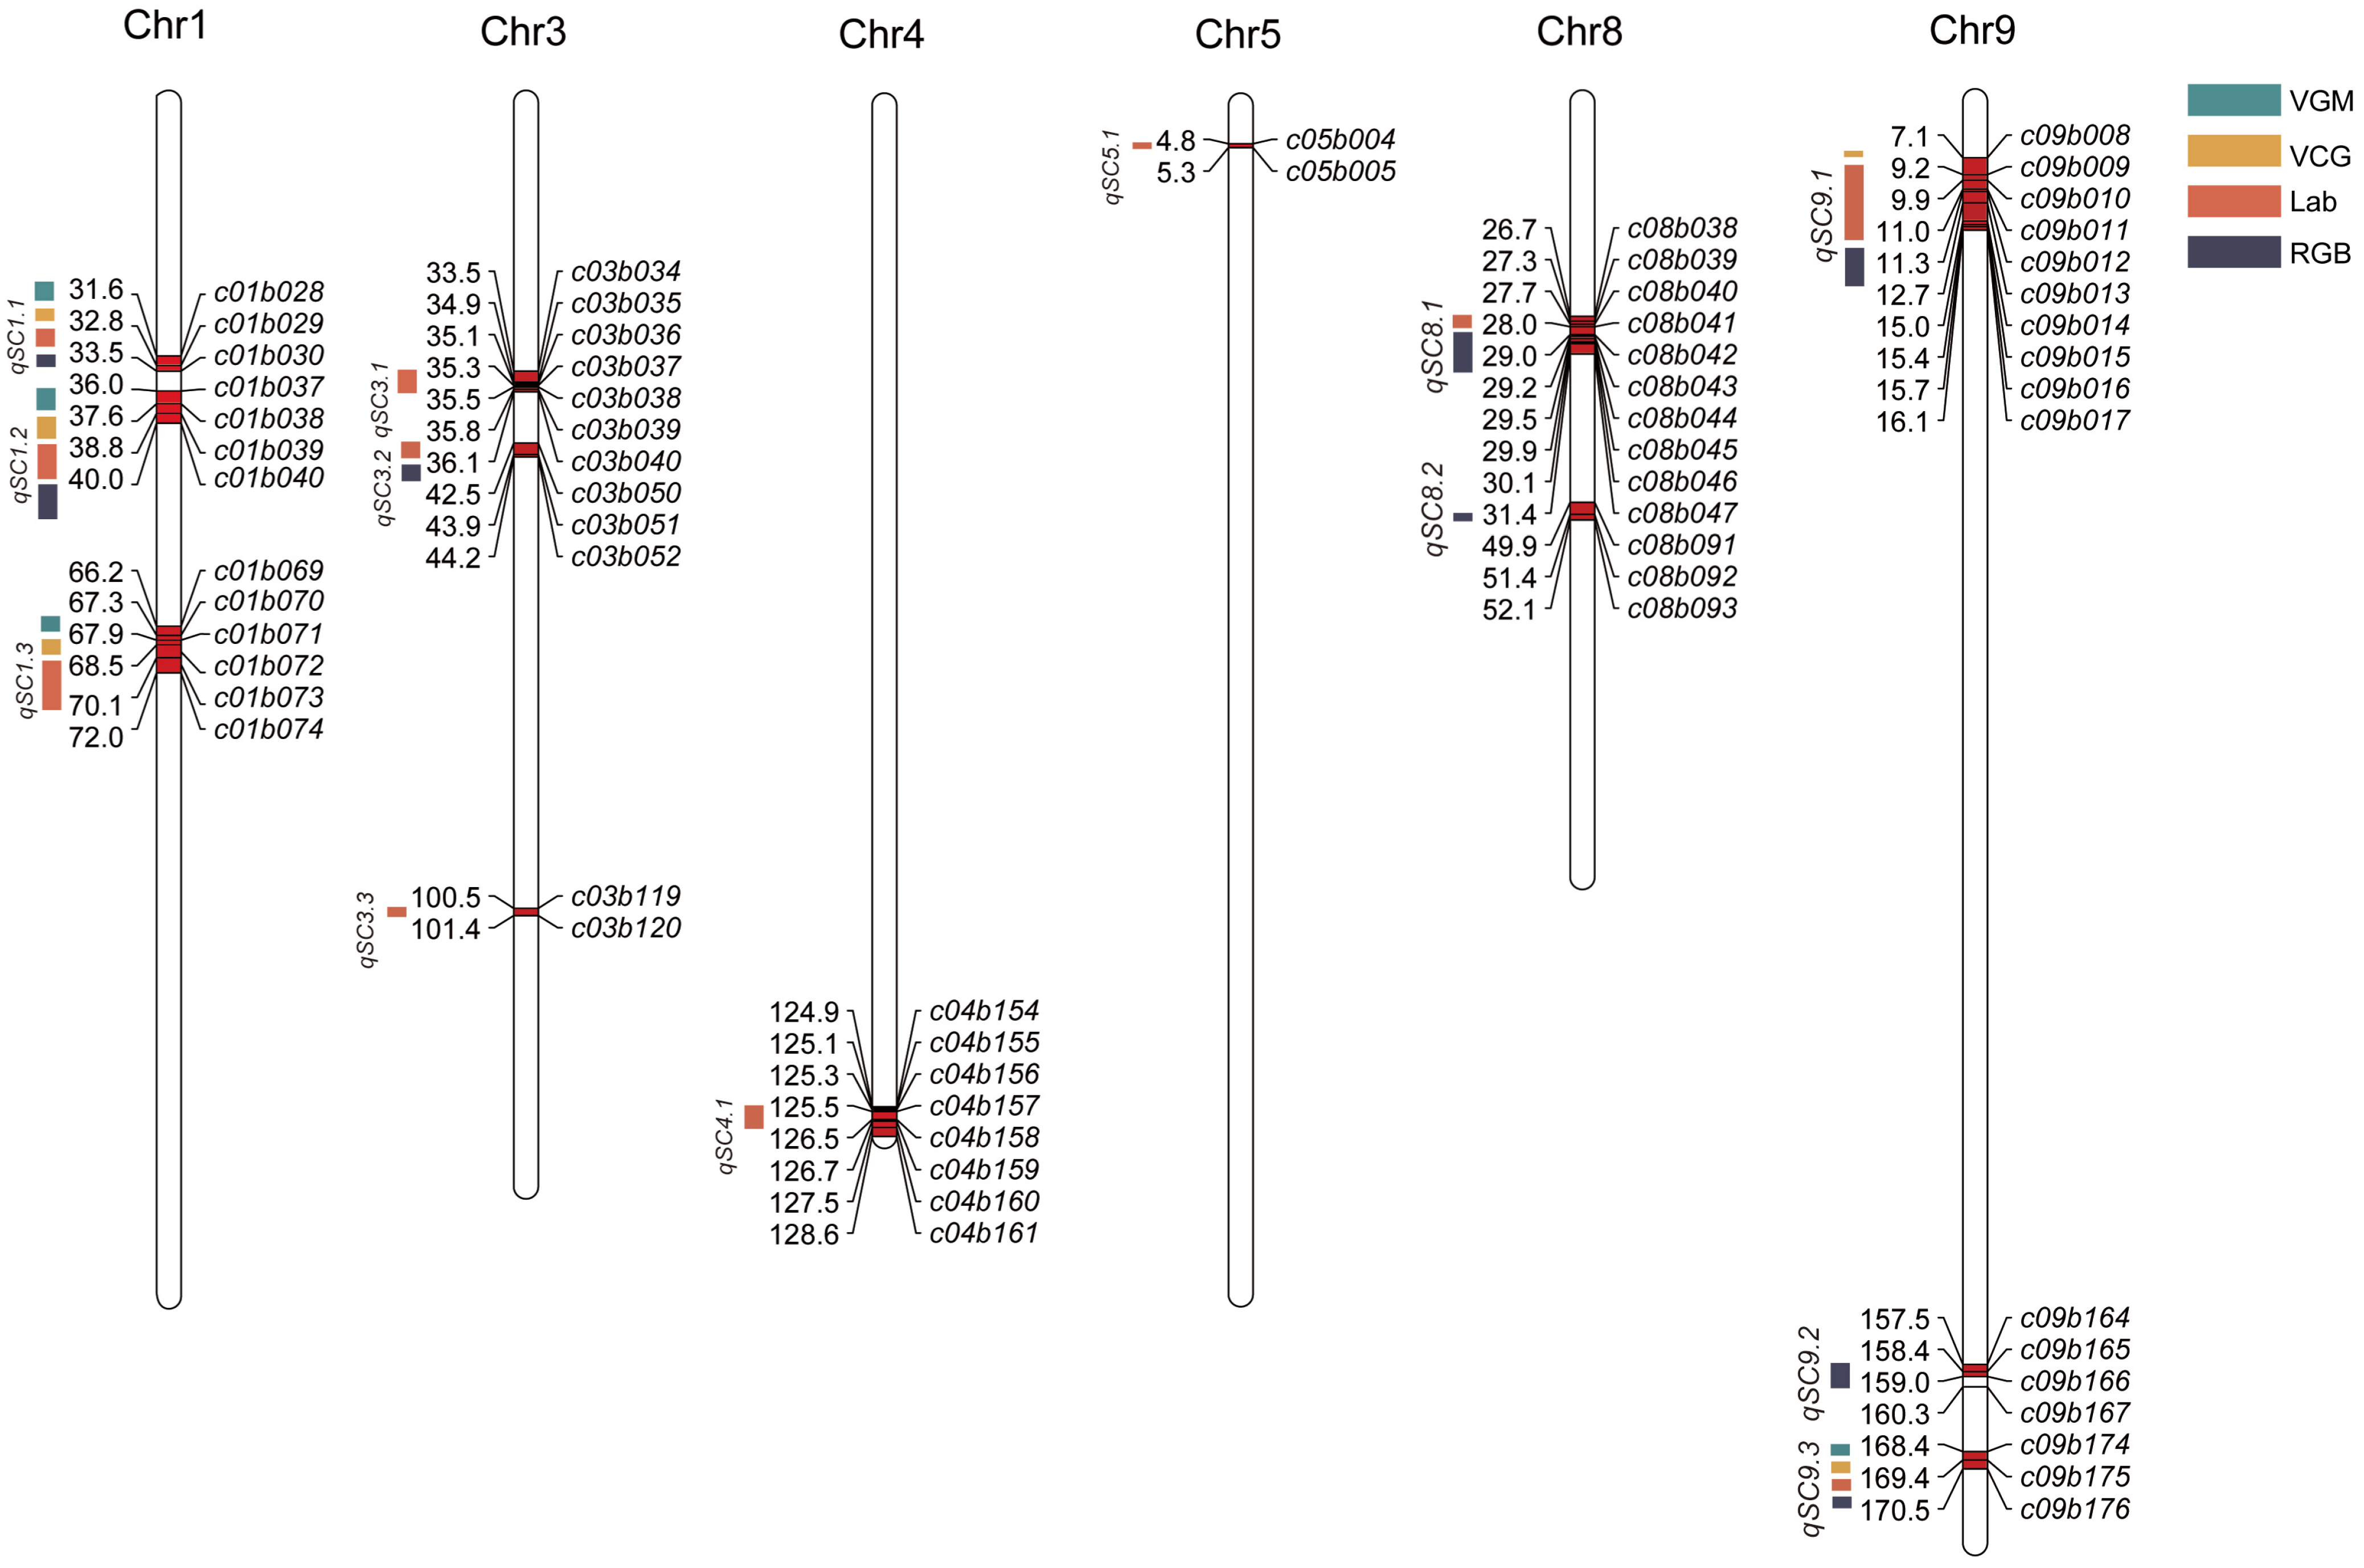
3.2. Identification of QTL Associating with Hull Color in Foxtail Millet

Method I identified 10 quantitative trait loci (QTL) in four environments (Tables S1 and S2, Figure 3). Among them, two stable major-effect QTLs, qVGM1.2 and qVGM9.1, were recognized across all environments. qVGM1.2 is located on chromosome 1 and explains between 50.14% and 69.63% of the variation; qVGM9.1 is located on chromosome 9 and has a contribution rate of 8.94% to 19.23%. The enhancing genes for both major-effect QTLs come from Hongjiugu. Additionally, two minor effect QTLs, qVGM1.1 and qVGM1.3, were identified in only one environment, with contribution rates of 8.09% and 1.37%, respectively. Their enhancing genes are derived from Hongjiugu and Yugu 18, respectively.
Method II identified 12 QTLs across four environments (Tables S1 and S2, Figure 3). Two major QTLs, qVCM1.2 and qVCM9.2, were consistently detected in all environments. qVCM1.2, positioned on chromosome 1, explains 33.23% to 60.32% of the variation, while qVCM9.2, on chromosome 9, accounts for 15.79% to 16.91%. The major QTL qVCM1.1, also on chromosome 1, was identified in a single environment, contributing 25.42%. The enhancing genes of all three major QTLs are derived from Hongjiugu. The three minor QTLs, qVCM1.3, qVCM8.1 and qVCM9.1, were detected only in one environment, with contribution rates ranging from 1.36% to 1.73%, and their enhancing genes all originated from Yugu 18.
Method III identified 69 QTLs across four environments (Tables S1 and S2, Figure 3), which were consolidated into 27 unique QTLs located on nine chromosomes. These QTLs include 5 major QTLs and 22 minor QTLs. The QTLs qLab1.1 and qLab1.2, both located on chromosome 1, were consistently detected in at least two different environments. Their contributions varied from 4.59% to 21.33% for qLab1.1 and from 8.89% to 62.84% for qLab1.2, with enhancing genes sourced from Yugu 18. Similarly, qLab9.1 and qLab9.5 were consistently detected across at least two environments on chromosome 9, with their contributions ranging from 2.05% to 16.95% and 4.43% to 28.14%, respectively. Their enhancing genes were derived from Hongjiugu and Yugu 18. Seven stable minor QTL loci, qLab1.3, qLab3.3, qLab3.4, qLab3.6, qLab4.3, qLab5.2 and qLab8.1, were detected in at least two environments. These QTLs were distributed across chromosomes 1, 3, 4, 5 and 8, with phenotypic contribution rates ranging from 1.21% to 9.36%. Other QTLs were identified in only one environment, contributing between 2.54% and 10.48%.
Method IV identified 56 QTLs across four environments (Tables S1 and S2, Figure 3), which were consolidated into 25 unique QTLs distributed over nine chromosomes. These QTLs include 4 major QTLs and 21 minor QTLs. The QTL qRGB1.2 was consistently identified in all four environments and is located on chromosome 1. It accounts for phenotypic variations between 18.07% and 62.73%, with all enhancing genes derived from Yugu 18. In contrast, the QTLs qRGB9.1 and qRGB9.3, both on chromosome 9, showed stability in at least two environments. The contributions of qRGB9.1 and qRGB9.3 varied from 1.37% to 19.67% and 4.86% to 20.69%, respectively, with enhancing genes sourced from Hongjiugu and Yugu 18. Five stable minor-effect QTLs, qRGB1.1, qRGB3.3, qRGB8.1, qRGB8.2 and qRGB9.2, were identified in at least two environments on chromosomes 1, 3, 8 and 9, with phenotypic contributions ranging from 1.20% to 8.62%. The remaining QTLs were detected in a single environment, contributing between 0.95% and 11.47% to the phenotypic variation.

3.3. QTL Analysis with Epistatic Interactions for the Foxtail Millet Hull Color Under Different Detection Methods

Four different detection methods (I, II, III and IV) identified one, two, five and four pairs of significant interactive QTLs, respectively. These 12 pairs of interactive QTLs together explained 0.03~2.53% of the phenotypic variation, with the range of their epistatic effects between -2.41 and 1.58. Among all identified interactive QTL, the major-effect QTLs with strong environmental stability, qHC1.2 (qGM1.2, qCM1.2, qa*1.2 and qG*1.2) and qHC9.3 (qGM9.1, qCM9.2, qa*9.1 and qG*9.3), showed significant interactions across all four detection methods. The QTLs qa*1.3 and qb*1.3 showed significant interactions with qa*9.2 and qb*9.4, respectively, explaining 0.42% and 0.96% of the phenotypic variation in foxtail millet hull color. Additionally, the QTL qR*1.2 interacted significantly with qR*9.3 and qR*9.4, explaining 0.51% and 0.03% of the phenotypic variation, respectively (Table 3). Notably, other stable major-effect and minor-effect QTLs under different environmental conditions were not involved in any epistatic interactions, indicating that the variation in millet hull color is primarily regulated by the additive effects of these major-effect QTLs and is less regulated by the epistatic interactions of QTLs. Apart from one pair of interacting major-effect QTLs, the other interacting QTLs were not identified during the initial QTL mapping process, suggesting that these QTLs may only play a role through interactions under specific genetic backgrounds or phenotypic contexts.

3.4. Comparison Analysis of Four Hull Color Detection Methods

Because the Lab and RGB measurement methods have numerous color parameters and map many QTLs, it is hard to affirm if QTL loci detected in a single environment relate to grain color. Therefore, this study focused exclusively on the comparative and analytical evaluation of consistent QTL loci detected by both the Lab and RGB methods. The number of QTLs detected by the four methods was 10, 12, 69 and 56. The average number of QTLs identified in a single environment was 2.5, 3, 17.25 and 14. The counts of unique QTLs were 4, 6, 27 and 25. Additionally, the number of stable QTLs was 2, 2, 11 and 8 (Table S1).
Thirteen stably expressed QTL sites, including four major and nine minor QTLs, were identified through four measurement methods (Table 3 and Table S1, Figure 3). The number of major QTLs detected by the four methods was 2, 3, 5 and 4, respectively. Among them, three major QTL loci, qHC1.1, qHC1.2 and qHC9.3, were consistently identified across all four methods. qHC1.1 was mapped to the marker interval c01b028–c01b030 (31.5–33.5 cm) on chromosome 1, with a maximum phenotypic contribution rate of 25.42%. Similarly, qHC1.2 was located within the marker interval c01b037–c01b040 (35.5–39.5 cm) on chromosome 1, showing the highest phenotypic contribution rate of 69.63%. Meanwhile, qHC9.3 was positioned in the interval c09b174–c09b176 (168.5–172.5 cm) on chromosome 9, with a peak phenotypic contribution rate of 28.14%. Additionally, qHC9.1 was detected by methods II, III and IV. It was mapped to the marker interval c09b008–c09b017 (6.5–16.5 cm) on chromosome 9, with the highest phenotypic contribution rate of 19.67%.
The number of stable minor-effect QTLs identified by the four methods was one, one, seven, and five (Table S1). Among these, qHC1.3 was detected by methods I, II and III, while qHC3.2 and qHC8.1 were consistently identified by methods III and IV. Furthermore, qHC3.1, qHC3.3, qHC4.1 and qHC5.1 were exclusively detected by method III, whereas qHC8.2 and qHC9.2 were only detected by method IV. The minor QTL locus, qVCM8.1, identified by method II, was located in an adjacent interval to qHC8.1 (Table S3). These findings suggest that QTLs identified by methods I and II are associated with hull color, and method II can detect all major QTL loci related to hull color. Methods III and IV, however, can stably identify more minor-effect QTL associated with hull color. Notably, method III identified a greater number of minor-effect loci than method IV, but neither method could stably detect all minor QTLs.

4. Discussion

4.1. Foxtail Millet Exhibits a Rich Variation in Grain Hull Color

Grain hull color constitutes an essential agronomic trait in crops, closely associated with their biochemical characteristics, antioxidant content, activity and disease resistance [47]. In foxtail millet, hull color is linked to variations in nutritional components. Hull color in foxtail millet is closely linked to nutritional quality, with studies showing that green grains are richer in protein, fat and lysine, white grains have higher protein and moderate calcium, and red grains contain significantly more selenium [1,9,48]. Thus, hull color can serve as a key indicator for selecting foxtail millet with different nutritional qualities. The RYRIL population employed in this study exhibits rich phenotypic variations in grain hull color. Among these materials, families with high levels of protein, fat, anthocyanins, and other nutrients can be further selected based on hull color for applications in food production or crop breeding.

4.2. Comparison of the Four Phenotype Characterisation Methods

The hull color of crops is a prominent phenotypic characteristic that is easily visualized. However, the diverse and complex coloration of seed grains presents challenges for accurate assessment. Previous studies primarily relied on a single method to detect seed grain color. Xie et al. [24] identified anther and hull colors using the visual grouping method. Guo et al. [49] employed the Lab method to identify the hull color of foxtail millet. Zhu et al. [20] integrated the visual grouping and Lab measurement methods to ascertain the hull color of sesame. This study employed four methods for detecting color: the visual grouping method (I), the visual colorimetric method (II), the Lab determination method (III) and the RGB determination method (Ⅳ). These methods were applied across four different environments to improve the accuracy and precision of hull color assessment and localization in the RYRIL population of foxtail millet. The number of QTLs detected by the four methods ranked from highest to lowest were as follows: III (69) > IV (56)> II (12) > I (10). Method I, which only detected two major QTLs and two minor QTLs, is recognized for its simplicity, efficiency and low cost. These qualities make it suitable for rapid phenotypic detection in large populations, though it remains vulnerable to subjective bias and environmental variability [22]. Method II detected three major QTLs and three minor QTLs, serving as a novel detection approach in this study. It enhanced the precision of distinguishing between similar hull colors by intensifying shade differentiation, thereby enabling partial quantification of plant color traits. However, both methods I and II are susceptible to variability caused by human perceptual differences. Method III identified 5 major QTLs and 22 minor QTLs. The Lab color space is a nearly uniform color space that generates colors closely resembling those perceived by the human eye [50,51]. The primary advantage of the Lab measurement method is its ability to quantitatively assess plant color, precisely measuring differences in color depth and glossiness. Method IV identified 4 major and 21 minor QTLs. The RGB color space is the most fundamental color space from which other color spaces can be derived. Its primary advantage lies in the RGB model, an international standard for quantitative color evaluation, which effectively describes seed coat color [51]. While method II is effective for detecting major QTL, it is influenced by human factors. Therefore, combining methods III and IV is recommended for accurate determination of grain hull color.

4.3. The Main Effect of QTL with a Stable Environment Is Generally Consistent with Previous Studies

In this study, we identified four major QTLs: qHC1.1, qHC1.2, qHC9.1 and qHC9.3 (S3). These QTLs are located near the positions reported in previous studies, although slight differences were observed. These discrepancies in the genomic regions of QTL across studies may result from variations in mapping populations, phenotypic observation errors, sequencing inaccuracies or differences in analytical methods. Jia et al. [39] genome-wide association analysis to identify loci associated with hull color on chromosomes 1 and 9, partially coinciding with the positions of qHC1.2 and qHC9.3. Additionally, the QTL Sihc1, which governs grain hull color and was detected by Wang et al. [40] using restriction site-associated DNA sequencing, overlaps with a gene locus at chromosome 6’s terminus, as reported by Jia et al. [39] In our study, we also identified a minor QTL, qHC6.2, controlling grain hull color on chromosome 6. Additionally, the QTL qHC.czas1 on the chromosome 1, discovered by Tian et al. [38], and the locus on chromosome 1, identified by Xie et al. [24], both of which control grain hull color, overlap with qHC1.2 identified in this study (S4). These findings suggest that candidate genes controlling hull color in foxtail millet may be located within the overlapping regions of chromosomes 1 and 9, providing a foundation for further gene cloning and functional analysis.

5. Conclusions

This study employed four distinct color detection methodologies to analyze the phenotypic characteristics of foxtail millet hulls. Genotypic data from each family were integrated to perform QTL analysis based on the phenotypic values obtained from each method. By comparing the QTL mapping results of the four methods and evaluating their unique characteristics, the practical applicability of each method was assessed. The analysis revealed that combining the Lab determination method (III) and the RGB determination method (IV) enables accurate grain color determination. QTL analysis identified four major QTLs, qHC1.1, qHC1.2, qHC9.1 and qHC9.3, which provide a basis for further cloning of functional genes in foxtail millet and for studying the genetic mechanisms underlying hull color variation.

Supplementary Materials

The following supporting information can be downloaded at: https://www.mdpi.com/article/10.3390/seeds4010010/s1, Table S1: Summary of the number of QTL associated with foxtail millet hull color detected using four distinct methods; Table S2: Summary of QTL for hull color traits detected in the YRRIL population; Table S3: Summary of major-effect QTL for hull color traits detected in the YRRIL population; Table S4: A comparison between the identified QTL and the QTL identified in previous studies.

Author Contributions

Conceptualization, Z.M. and S.C.; methodology, S.C.; software, Z.M., S.C., Y.W., Y.L. and H.H.; validation, Z.M., S.C. and H.S.; formal analysis, Z.M., Y.W. and P.Y.; investigation, S.C.; resources, Z.M. and S.C.; data curation, Z.M. and S.C.; writing—original draft preparation, Z.M.; writing—review and editing, Z.M., J.G., B.F. and P.Y.; visualization, Z.M. and P.Y.; supervision, B.F. and P.Y.; funding acquisition, P.Y. and B.F. All authors have read and agreed to the published version of the manuscript.

Funding

This study was funded by the National Program on Key Basic Research Program of China (2023YFD1202700, 2023YFD1202704), Shaanxi Province Key Research and Development Program (2023-ZDLNY-06), Fundamental Research Funds for the Central Universities of Ministry of Education of China (Grant No. Z1090323176), Ministry of Finance and Ministry of Agriculture and Rural Affairs: Technology Systems of National Modern Agricultural Industry (CARS-06-A26), Technical System of Minor Grain Crops Industry in Shaanxi Province. The funders had no involvement in the study design, data collection and analysis, decision to publish or manuscript preparation.

Data Availability Statement

All data generated or analyzed during this study are included within this manuscript and its Supplementary Materials file.

Conflicts of Interest

The authors declare no conflicts of interest.

References

  1. Lu, H.; Zhang, J.; Liu, K.; Wu, N.; Li, Y.; Zhou, K.; Ye, M.; Zhang, T.; Zhang, H.; Yang, X.; et al. Earliest domestication of common millet (Panicum miliaceum) in east asia extended to 10,000 years ago. Proc. Natl. Acad. Sci. USA 2009, 106, 7367–7372. [Google Scholar] [CrossRef] [PubMed]
  2. Yang, X.; Wan, Z.; Perry, L.; Lu, H.; Wang, Q.; Zhao, C.; Li, J.; Xie, F.; Yu, J.; Cui, T.; et al. Early millet use in northern China. Proc. Natl. Acad. Sci. USA 2012, 109, 3726–3730. [Google Scholar] [CrossRef] [PubMed]
  3. Sachdev, N.; Goomer, S.; Singh, L.R. Foxtail millet: A potential crop to meet future demand scenario for alternative sustainable protein. J. Sci. Food Agric. 2021, 101, 831–842. [Google Scholar] [CrossRef]
  4. Liang, S.Z. Arabidopsis thaliana Recombinant SERKs and Setaria italica BAK1 Involved in the Regulation of Brassinosteroid Signaling and Cell Death Pathway. Master’s Thesis, Northwest Normal University, Lanzhou, China, 2019. [Google Scholar]
  5. Gao, Y.; Yuan, Y.; Zhang, X.; Song, H.; Yang, Q.; Yang, P.; Gao, X.; Gao, J.; Feng, B. Conuping BSA-seq and RNA-seq reveal the molecular pathway and genes associated with the plant height of foxtail millet (Setaria Italica). Int. J. Mol. Sci. 2022, 23, 11824. [Google Scholar] [CrossRef]
  6. Liu, D.; Cui, Y.; He, J.; Li, S.; Li, Q.; Liang, D.; Wang, J.; Shi, X.; Wang, C.; Dong, K.; et al. Genetic diversity and classification of the cytoplasm of chinese elite foxtail millet [Setaria Italica (L.) P. Beauv.] parental lines revealed by chloroplast deoxyribonucleic acid variation. Front. Genet. 2019, 10, 1198. [Google Scholar] [CrossRef]
  7. Yang, Y.; Jia, G.; Deng, L.; Qin, L.; Chen, E.; Cong, X.; Zou, R.; Wang, H.; Zhang, H.; Liu, B.; et al. Genetic variation of yellow pigment and its components in foxtail millet (Setaria Italica (L.) P. Beauv.) from different eco-regions in China. J. Integr. Agric. 2017, 16, 2459–2469. [Google Scholar] [CrossRef]
  8. Zhang, Y.; Lu, Y.; Zhang, B.; He, L.; Liu, L.; Wang, X.; Li, H.; Han, Y. The relationship between SiLCYB gene and beige formation in the biosynthesis pathway of carotenoids in foxtail millet. Mol. Plant Breed. 2016, 14, 1341–1351. [Google Scholar]
  9. He, J.H.; Yang, T.Y.; Wu, G.Z. Evaluation on nutritive quality of local varieties for foxtail millet in Gansu Province. Plant Genet. Resour. Sci. 2002, 3, 41–44. [Google Scholar]
  10. Xia, X.Y.; Shi, Z.G.; Zhang, T.; Chen, Y.; Xiang, J.Y.; Ji, X.M.; Cheng, R.H. The research on bird-disaster degree in different grain colors of foxtail millet lines. J. Hebei Agric. Sci. 2014, 18, 4–6. [Google Scholar]
  11. Winkel-Shirley, B. Flavonoid biosynthesis a colorful model for genetics, biochemistry, cell biology, and biotechnology. Plant Physiol. 2001, 126, 485–493. [Google Scholar]
  12. Zhang, S.; Hu, X.; Miao, H.; Chu, Y.; Cui, F.; Yang, W.; Xu, S.; Guo, J.; Fu, C.; Song, X.; et al. Imaged-based phenotyping accelerated QTL mapping and QTL x environment interaction analysis of testa colour in peanut (Arachis hypogaea). Plant Breed. 2021, 140, 884–895. [Google Scholar] [CrossRef]
  13. Liu, F.; Chen, H.; Yang, L.; You, L.; Ju, J.; Yang, S.; Wang, X.; Liu, Z. QTL mapping and transcriptome analysis reveal candidate genes regulating seed color in brassica napus. Int. J. Mol. Sci. 2023, 24, 9262. [Google Scholar] [CrossRef] [PubMed]
  14. Sun, X.M. Genetic Mechanism and Gene Regulation Network of Flavonoid Pigmentation in Rice (Oryza sativa L.). Ph.D. Thesis, China Agricultural University, Beijing, China, 2017. [Google Scholar]
  15. Emiliani, J.; Grotewold, E.; Falcone Ferreyra, M.L.; Casati, P. Flavonols protect Arabidopsis plants against UV-B deleterious effects. Mol. Plant 2013, 6, 1376–1379. [Google Scholar] [CrossRef]
  16. Nakabayashi, R.; Mori, T.; Saito, K. Alternation of flavonoid accumulation under drought stress in Arabidopsis thaliana. Plant Signal. Behav. 2014, 9, e29518. [Google Scholar] [CrossRef] [PubMed]
  17. Nakabayashi, R.; Yonekura-Sakakibara, K.; Urano, K.; Suzuki, M.; Yamada, Y.; Nishizawa, T.; Matsuda, F.; Kojima, M.; Sakakibara, H.; Shinozaki, K.; et al. Enhancement of oxidative and drought tolerance in Arabidopsis by overaccumulation of antioxidant flavonoids. Plant J. 2014, 77, 367–379. [Google Scholar] [CrossRef] [PubMed]
  18. Furukawa, T.; Maekawa, M.; Oki, T.; Suda, I.; Iida, S.; Shimada, H.; Takamure, I.; Kadowaki, K. The Rc and Rd genes are involved in proanthocyanidin synthesis in rice pericarp. Plant J. 2007, 49, 91–102. [Google Scholar] [CrossRef] [PubMed]
  19. Zhang, Y.; Gao, J.; Qie, Q.; Yang, Y.; Hou, S.; Wang, X.; Li, X.; Han, Y. Comparative analysis of flavonoid metabolites in foxtail millet (Setaria italica) with different eating quality. Life 2021, 11, 578. [Google Scholar] [CrossRef] [PubMed]
  20. Zhu, X.D. High-Density Genetic Linkage Map Construction and QTL Mapping of Seed Coat Color in Sesame (Sesamum indicum L.). Masters’s Thesis, Chinese Academy of Agricultural Sciences, Beijing, China, 2016. [Google Scholar]
  21. Kuang, Q.; Yu, Y.; Attree, R.; Xu, B. A comparative study on anthocyanin, saponin, and oil profiles of black and red seed coat peanut (Arachis hypogacea) grown in China. Int. J. Food Prop. 2017, 20, 131–140. [Google Scholar] [CrossRef]
  22. Wan, L.; Li, B.; Pandey, M.K.; Wu, Y.; Lei, Y.; Yan, L.; Dai, X.; Jiang, H.; Zhang, J.; Wei, G.; et al. Transcriptome analysis of a new peanut seed coat mutant for the physiological regulatory mechanism involved in seed coat cracking and pigmentation. Front. Plant Sci. 2016, 7, 1491. [Google Scholar] [CrossRef] [PubMed]
  23. Zhang, B.; Liu, J.; Cheng, L.; Zhang, Y.; Hou, S.; Sun, Z.; Li, H.; Han, Y. Carotenoid composition and expression of biosynthetic genes in yellow and white foxtail millet [Setaria italica (L.) Beauv]. J. Cereal Sci. 2019, 85, 84–90. [Google Scholar] [CrossRef]
  24. Xie, H.; Hou, J.; Fu, N.; Wei, M.; Li, Y.; Yu, K.; Song, H.; Li, S.; Liu, J. Identification of qtl related to anther color and hull color by rad sequencing in a ril population of Setaria italica. BMC Genom. 2021, 22, 556. [Google Scholar] [CrossRef] [PubMed]
  25. Bai, C.M.; Wang, C.Y.; Wang, P.; Zhu, Z.X.; Lu, X.C. QTL analysis of tannin content and color of grain in sorghum. J. Plant Genet. Resour. 2017, 8, 860–866. [Google Scholar]
  26. Yang, Y.; Zhao, T.; Wang, F.; Liu, L.; Liu, B.; Zhang, K.; Qin, J.; Yang, C.; Qiao, Y. Identification of candidate genes for soybean seed coat-related traits using QTL mapping and GWAS. Front. Plant Sci. 2023, 14, 1190503. [Google Scholar] [CrossRef]
  27. Ding, P.P. Genetic Analysis and QTL Mapping of Peel Color in Pepper Fruit. Master’s Thesis, Anhui Agricultural University, Anhui, China, 2017. [Google Scholar]
  28. Yu, B.; Boyle, K.; Zhang, W.; Robinson, S.J.; Higgins, E.; Ehman, L.; Relf-Eckstein, J.-A.; Rakow, G.; Parkin, I.A.P.; Sharpe, A.G.; et al. Multi-trait and multi-environment QTL analysis reveals the impact of seed colour on seed composition traits in Brassica napus. Mol. Breed. 2016, 36, 111. [Google Scholar] [CrossRef]
  29. Cichy, K.A.; Fernandez, A.; Kilian, A.; Kelly, J.D.; Galeano, C.H.; Shaw, S.; Brick, M.; Hodkinson, D.; Troxtell, E. QTL analysis of canning quality and color retention in black beans (phaseolus vulgaris L.). Mol. Breed. 2014, 33, 139–154. [Google Scholar] [CrossRef]
  30. Sooriyapathirana, S.S.; Khan, A.; Sebolt, A.M.; Wang, D.; Bushakra, J.M.; Lin-Wang, K.; Allan, A.C.; Gardiner, S.E.; Chagné, D.; Iezzoni, A.F. QTL analysis and candidate gene mapping for skin and flesh color in sweet cherry fruit (Prunus avium L.). Tree Genet. Genomes 2010, 6, 821–832. [Google Scholar] [CrossRef]
  31. Guo, S.; Chai, S.; Guo, Y.; Shi, X.; Han, F.; Qu, T.; Xing, L.; Yang, Q.; Gao, J.; Gao, X.; et al. Mapping of major qtl and candidate gene analysis for hull colour in foxtail millet (Setaria italica (L.) P. Beauv.). BMC Genom. 2023, 24, 458. [Google Scholar] [CrossRef] [PubMed]
  32. Shen, D.; Fang, Z.Y.; Li, X.X.; Li, Q.H.; Cheng, J.Q.; Song, J.P.; Wang, H.P.; Qiu, Y. Inheritance of fruit flesh color in Cucumis sativus (L.). J. Plant Genet. Resour. 2011, 12, 216–222. [Google Scholar]
  33. Zapotoczny, P.; Majewska, K. A comparative analysis of colour measurements of the seed coat and endosperm of wheat kernels performed by various techniques. Int. J. Food Prop. 2010, 13, 75–89. [Google Scholar] [CrossRef]
  34. Lv, L.; Jin, L.M.; Lee, M.; Zhang, A.P.; Zhao, G.W. QTL mapping of seed color-related traits in yellow maize. Seed 2019, 38, 37–40+45. [Google Scholar]
  35. Ahmad, I.S.; Reid, J.F.; Paulsen, M.R.; Sinclair, J.B. Color classifier for symptomatic soybean seeds using image processing. Plant Dis. 1999, 83, 320–327. [Google Scholar] [CrossRef] [PubMed]
  36. Wang, Z.M.; Devos, K.M.; Liu, C.J.; Wang, R.Q.; Gale, M.D. Construction of RFLP-based maps of foxtail millet, Setaria Italica (L.) P. Beauv. Theor. Appl. Genet. 1998, 96, 31–36. [Google Scholar] [CrossRef]
  37. Yazdizadeh, M.; Fahmideh, L.; Mohammadi-Nejad, G.; Solouki, M.; Nakhoda, B. Association analysis between agronomic traits and AFLP markers in a wide germplasm of proso millet (Panicum miliaceum L.) under normal and salinity stress conditions. BMC Plant Biol. 2020, 20, 427. [Google Scholar] [CrossRef] [PubMed]
  38. Tian, B.; Zhang, L.; Hu, J.; Liu, Y.; Zhou, L.; Ping, W.; Zou, J.; Li, H. Genetic characterization of hull color using BSR-seq and genome re-sequencing approaches in foxtail millet. Front. Plant Sci. 2022, 13, 1019496. [Google Scholar] [CrossRef]
  39. Jia, X.; Zhang, Z.; Liu, Y.; Zhang, C.; Shi, Y.; Song, Y.; Wang, T.; Li, Y. Development and genetic mapping of SSR markers in foxtail millet [Setaria Italica (L.) P. Beauv.]. Theor. Appl. Genet. 2009, 118, 821–829. [Google Scholar] [CrossRef] [PubMed]
  40. Wang, R.Q.; Gao, J.H.; Guan, Z.B.; Mao, L.P. Preliminary study on chromosomal location and linkage relationship of several agronomic trait genes in foxtail millet. Acta Agron. Sin. 2007, 01, 9–14. [Google Scholar]
  41. Jia, G.; Huang, X.; Zhi, H.; Zhao, Y.; Zhao, Q.; Li, W.; Chai, Y.; Yang, L.; Liu, K.; Lu, H.; et al. A haplotype map of genomic variations and genome-wide association studies of agronomic traits in foxtail millet (Setaria italica). Nat. Genet. 2013, 45, 957–961. [Google Scholar] [CrossRef]
  42. Wang, J.; Yang, H.; Du, G.; Wang, Z.; Zou, H.; Du, X.; Li, Y.; Peng, J.; Guo, E.; Yong, J.; et al. Mapping of sihc1, which controls hull color, using a high-density genetic map based on restriction site-associated DNA sequencing in foxtail millet [Setaria italica (L.) P. Beauv.]. Mol. Breed. 2017, 37, 128. [Google Scholar] [CrossRef]
  43. Liu, G.H.; Yu, J.X.; Ren, L.J. Progress of RGB detection methods. J. Anal. Sci. 2020, 36, 591–596. [Google Scholar]
  44. Wang, C.; Chai, S.; Li, S.; Liu, D.; Han, H.; Wu, Y.; Li, Y.; Ma, Z.; Zhang, L.; Gao, X.; et al. Genetic dissection of foxtail millet bristles using combined QTL mapping and RNA-seq. Theor. Appl. Genet. 2025, 138, 33. [Google Scholar] [CrossRef] [PubMed]
  45. Meng, L.; Li, H.; Zhang, L.; Wang, J. QTL ICI mapping: Integrated software for genetic linkage map construction and quantitative trait locus mapping in biparental populations. Crop J. 2015, 3, 269–283. [Google Scholar] [CrossRef]
  46. Nyquist, W.E.; Baker, R.J. Estimation of heritability and prediction of selection response in plant populations. Crit. Rev. Plant Sci. 1991, 10, 235–322. [Google Scholar] [CrossRef]
  47. Zhang, H.; Miao, H.; Wei, L.; Li, C.; Zhao, R.; Wang, C. Genetic analysis and QTL mapping of seed coat color in Sesame (Sesamum Indicum L.). PLoS ONE 2013, 8, e63898. [Google Scholar] [CrossRef] [PubMed]
  48. Vadivoo, A.S.; Joseph, R.; Ganesan, N.M. Genetic variability and diversity for protein and calcium contents in finger millet (Eleusine coracana (L.) Gaertn) in relation to grain color. Plant Foods Hum. Nutr. 1998, 52, 353–364. [Google Scholar] [CrossRef] [PubMed]
  49. Guo, S.Q. Genetic Analysis and QTL Mapping on Agriculturally Important Traits in Foxtail Millet. Master’s Thesis, Northwest A&F University, Xianyang, China, 2022. [Google Scholar]
  50. Alam, A.; Abdullah, M.; Mishra, R.S. Colour contrast enhancement method by scaling the dc coefficients in CIE-LAB colour space. Int. J. Comput. Appl. 2014, 97, 1–6. [Google Scholar] [CrossRef]
  51. Philipp, I.; Rath, T. Improving plant discrimination in image processing by use of different color space transformations. Comput. Electron. Agric. 2002, 35, 1–15. [Google Scholar] [CrossRef]
Figure 1. Images of foxtail millet hull color observed with the unaided eye. (a) Images of millet hull color observed using the visual grouping method; (b) images of millet hull color observed using the visual colorimetric grouping method.
Seeds 04 00010 g001
Figure 2. The frequency distribution of hull color-related parameters in four environments. VGM: visual grouping method; VCG: visual colorimetric method; L, a*, b* and C: parameters of the Lab determination method; R, G and B: parameters of the RGB determination method.
Seeds 04 00010 g002
Figure 3. Distribution of major QTLs on the whole genome for foxtail millet hull color.
Seeds 04 00010 g003
Table 1. Descriptive statistical analysis of hull color in parent and RIL populations across four environments.
MethodTraitEnvironmentParentsRIL Population
Yugu 18HongjiuguMeans ± SDRangeSkewnessKurtosisVariable
Coefficient (%)
IVGM20YL1.004.002.48 ± 1.191.00–4.00−0.08−1.5247.81
20BJ1.004.002.45 ± 1.151.00–4.00−0.08−1.4646.92
21YL1.004.002.54 ± 1.191.00–4.00−0.21−1.4946.70
21BJ1.004.002.40 ± 1.181.00–4.000.01−1.5349.19
IIVCM20YL6.0032.0017.91 ± 10.931.00–37.000.20−1.2161.02
20BJ6.0032.0017.70 ± 10.041.00–37.000.20−1.0956.69
21YL6.0032.0020.27 ± 10.971.00–38.000.04−1.2954.10
21BJ6.0032.0017.01 ± 9.721.00–37.000.22−1.1357.14
IIIL*20YL62.60 **53.4758.61 ± 4.9749.46–67.21−0.04−1.168.48
20BJ64.21 **54.4659.17 ± 3.4352.93–67.570.36−0.605.79
21YL63.93 **51.0955.42 ± 3.4149.08–62.780.19−0.996.15
21BJ62.32 **52.9057.73 ± 3.2850.58–68.150.340.035.68
a*20YL6.0611.06 **10.00 ± 3.834.77–18.750.71−0.6238.30
20BJ5.497.46 **7.70 ± 2.182.73–14.440.29−0.3028.37
21YL6.6313.83 **7.65 ± 2.433.04–14.040.70−0.1531.76
21BJ5.778.79 **7.82 ± 2.392.58–14.420.34−0.5030.54
B*20YL23.44 **17.5620.42 ± 2.9212.50–27.35−0.45−0.3214.31
20BJ22.69 **12.7918.91 ± 2.7012.95–25.240.07−0.7514.30
21YL25.25 **16.2516.83 ± 2.4510.68–22.660.06−0.3414.57
21BJ22.11 *14.0518.43 ± 2.1513.65–23.730.08−0.5011.68
C*20YL24.21 **20.7723.15 ± 2.0718.28–29.540.27−0.258.94
20BJ23.35 **14.8120.54 ± 2.7014.93–26.36−0.03−0.7013.13
21YL26.11 **21.3518.71 ± 1.9312.96–23.70−0.040.3710.29
21BJ22.85 **16.5920.18 ± 2.0114.78–25.15−0.02−0.149.97
IVR20YL176.00 **155.83169.67 ± 9.87150.00–189.33−0.03−0.965.82
20BJ179.22 **150.78166.96 ± 8.65147.67–186.670.07−0.775.18
21YL181.33 **153.00155.70 ± 7.49138.00–173.670.24−0.754.81
21BJ174.00 *149.33162.98 ± 7.29146.00–188.330.470.354.47
G20YL145.89 **119.67133.38 ± 14.90106.67–158.67−0.09−1.1711.17
20BJ150.44 **124.67136.30 ± 9.71118.33–161.330.39−0.587.13
21YL149.00 **111.67126.81 ± 9.83107.00–147.000.11−0.987.75
21BJ145.56 **120.00132.54 ± 9.56111.67–161.670.27−0.157.21
B20YL109.56 **97.50105.32 ± 9.3091.00–126.330.52−0.988.83
20BJ115.11 **108.11109.24 ± 6.7696.00–128.000.54−0.506.19
21YL110.00 **94.00103.55 ± 5.8694.00–118.000.58−0.615.66
21BJ111.22 **102.00106.51 ± 6.5096.00–125.330.68−0.366.10
I: visual grouping method; II: visual colorimetric method; III: Lab determination method; IV: RGB determination method. 20YL: 2020 Yulin; 20BJ: 2020 Baoji; 21YL: 2021 Yulin; 21BJ: 2021 Baoji. * and ** mean significant differences at the 0.05 and 0.01 probability levels, respectively.
Table 2. Variance analysis of hull color parameters in foxtail millet.
TraitSourceDFSum of SquareMean SquareF-Valuep-ValueH2
L*G249.0033,194.66133.31142.71<0.0010.92
E3.005669.191889.732022.98<0.001
G × E656.007533.6711.4812.29<0.001
Error1816.001696.380.93
a*G249.0017,718.1871.16161.23<0.0010.92
E3.002806.67935.562119.79<0.001
G × E656.004008.356.1113.84<0.001
Error1816.00801.480.44
b*G249.0011,903.0147.8050.60<0.0010.83
E3.004713.881571.291663.27<0.001
G × E656.006290.059.5910.15<0.001
Error1816.001715.580.94
C*G249.007268.4529.1928.11<0.0010.76
E3.007360.862453.622362.70<0.001
G × E656.005761.248.788.46<0.001
Error1816.001885.881.04
RG249.00137,940.86553.9873.80<0.0010.87
E3.0078,684.2026,228.073494.23<0.001
G × E656.0054,585.3183.2111.09<0.001
Error1816.0013631.107.51
GG249.00290,243.591165.64162.86<0.0010.93
E3.0032,300.0810766.691504.27<0.001
G × E656.0060,297.0491.9212.84<0.001
Error1816.0012,997.917.16
BG249.00118,416.31475.5791.49<0.0010.92
E3.0011,400.343800.12731.03<0.001
G × E656.0025,628.8939.077.52<0.001
Error1816.009440.115.20
G: genotype; E: environment; G × E: interaction between genotype and environment.
Table 3. Summary of the epistatic and epistatic × environment interaction effect of QTL associated with hull color traits in the YRRIL population.
MethodsTraitsQTLiMarker IntervalQTLjMarker IntervalEpistatic Effect (AA)Epistatic × Environment Interaction Effect
AAh2/%AA-E1AA-E2AA-E3AA-E4h2/%
IHCVGMqGM1.2C01B039–C01B040qGM9.1C09B174–C09B1750.22 c2.340.000.000.000.000.03
IIHCVCMqCM1.2C01B039–C01B040qCM9.2C09B174–C09B1750.82 c2.530.000.000.000.000.03
HCVCMqCM1.4C01B042–C01B043qCM9.2C09B174–C09B1751.58 c0.570.000.000.000.000.10
IIIHCLqL*2.4C02B060–C02B061qL*3.7C03B022–C03B0230.37 c0.600.000.000.00 a0.000.03
HCaqa*1.2C01B039–C01B040qa*9.1C09B174–C09B1750.31 c2.520.36 c-0.15−0.09−0.120.67
HCaqa*1.3C01B041–C01B042qa*9.2C09B172–C09B1730.36 c0.420.000.000.00 a0.000.01
HCbqb*1.3C01B041–C01B042qb*9.4C09B175–C09B176−0.47 c0.96−0.53 c0.100.320.100.70
HCCqC*7.2C07B139–C07B140qC*9.3C09B021–C09B0220.33 c1.17−0.030.17−0.04−0.090.31
IVHCRqR*1.2C01B053–C01B054qR*9.3C09B092–C09B0931.55 c0.510.000.000.000.000.13
HCRqR*1.2C01B053–C01B054qR*9.4C09B100–C09B101−2.41 c0.030.000.000.000.000.01
HCGqG*1.2C01B039–C01B040qG*9.3C09B174–C09B1750.97 c0.68−0.760.040.550.180.29
HCGqG*2.1C02B061–C02B062qG*3.2C03B024–C03B0251.00 c0.450.000.000.000.000.09
a The significances at the probability level of 0.05; c The significances at the probability level of 0.005.
Disclaimer/Publisher’s Note: The statements, opinions and data contained in all publications are solely those of the individual author(s) and contributor(s) and not of MDPI and/or the editor(s). MDPI and/or the editor(s) disclaim responsibility for any injury to people or property resulting from any ideas, methods, instructions or products referred to in the content.

