1. Introduction
The global focus on health and wellness continues to grow, driving the need for devices that can continuously track vital signs at any time and in any situation throughout the day. Wearable devices, such as smartwatches and fitness trackers, use features such as heart rate (HR) monitoring and blood oxygenation (
) measurement to provide a comprehensive view of the overall well-being of the user [
1]. The growth of this market demands that new wearable health monitoring devices not only provide accurate and reliable data, but also offer extended battery life.
The wearable device market relies on a wide range of sensors, but the most popular is the Photoplethysmogram (PPG) sensor, which is widely used for non-invasive health monitoring applications [
2]. The quality of these measurements is highly dependent on the quality of the PPG signal acquired by the analog front-end of the sensor. Different reasons can severely degrade the quality of the PPG signal, such as high-frequency noise, malfunction of the LED, and movement-induced glitches. Therefore, algorithms are needed to assess the quality of the PPG signal in post-processing, known as Signal Quality Assessment (SQA) [
3,
4,
5].
The SQA algorithm consists of a set of decision rules that provide a comprehensive assessment of the quality of the PPG signal by identifying different types of issues that may affect the acquired data. These rules are based on the expected behavior or specific characteristics derived from statistical analysis that reflect the morphological characteristics of vital signs [
6].
This paper extends the work presented in Ref. [
7] by incorporating silicon validation results and detailing the implementation of a digital module for in-sensor PPG Signal Quality Assessment. This block uses a four-bit output to categorize different types of noise and detect PPG signal saturation. The SQA module assesses the integrity of incoming PPG data from the analog front-end, with the aim of optimizing energy consumption by reducing sensor activity. If the signal is significantly corrupted, it can be discarded, preventing inaccurate data from skewing health metrics and eliminating unnecessary data transmission without increasing energy consumption.
The SQA module is developed using High-Level Synthesis (HLS) through the Siemens Catapult program, which elevates hardware designers to a more productive level of abstraction through the use of C++ and SystemC languages, synthesizing efficient designs of the complex ASIC hardware required in today’s applications [
8]. The decision rules employed are conceptually derived from prior rule-based SQA methods [
3,
4,
5]; the contribution of this work lies in their reformulation as real-time, single-sample operations and in their realization as a deterministic RTL streaming module integrated directly within the PPG acquisition chain. The rest of the paper is organized as follows.
Section 2 provides an overview of the state-of-the-art of real-time Signal Quality Assessment algorithms and the various issues that can affect the PPG signal.
Section 3 presents the proposed real-time single-sample algorithm, its hardware implementation using High-Level Synthesis, and an overview of the system, with particular emphasis on the data acquisition chain.
Section 4 describes the experimental setup, the calibration procedure of the proposed block, the datasets used for validation, the analysis of the obtained results, and a comparison with related works from the literature.
Section 5 compares the trade-offs among the three main approaches to Signal Quality Assessment: MCU-based methods, AI-based techniques, and dedicated hardware implementations. Finally, conclusions are drawn in
Section 6.
3. Real-Time Single-Sample Signal Quality Assessment
The detection criteria used in this work are intentionally aligned, at the conceptual level, with established rule-based SQA methods: saturation and local-maximum-amplitude checks follow Ref. [
5], the threshold-crossing criterion and the expected-crossing-count expression follow Ref. [
4], and the hierarchical flag-based decision structure is consistent with Ref. [
3]. The contribution of this work is therefore not the detection rules themselves, but their reformulation and realization in hardware. Conventional rule-based methods are segment-based: they acquire a multi-second segment, buffer it, apply segment-wise filtering, and then extract features and classify the segment in software running on a microcontroller. We instead reformulate each rule as a real-time, single-sample operation with finite internal state and bounded memory, eliminating segment buffering and processor involvement. This reformulation is implemented as a deterministic streaming datapath integrated directly into the PPG acquisition chain.
Table 1 summarizes, rule by rule, how the conventional segment-based flow is mapped onto the proposed hardware-oriented streaming implementation.
3.1. Proposed Algorithm
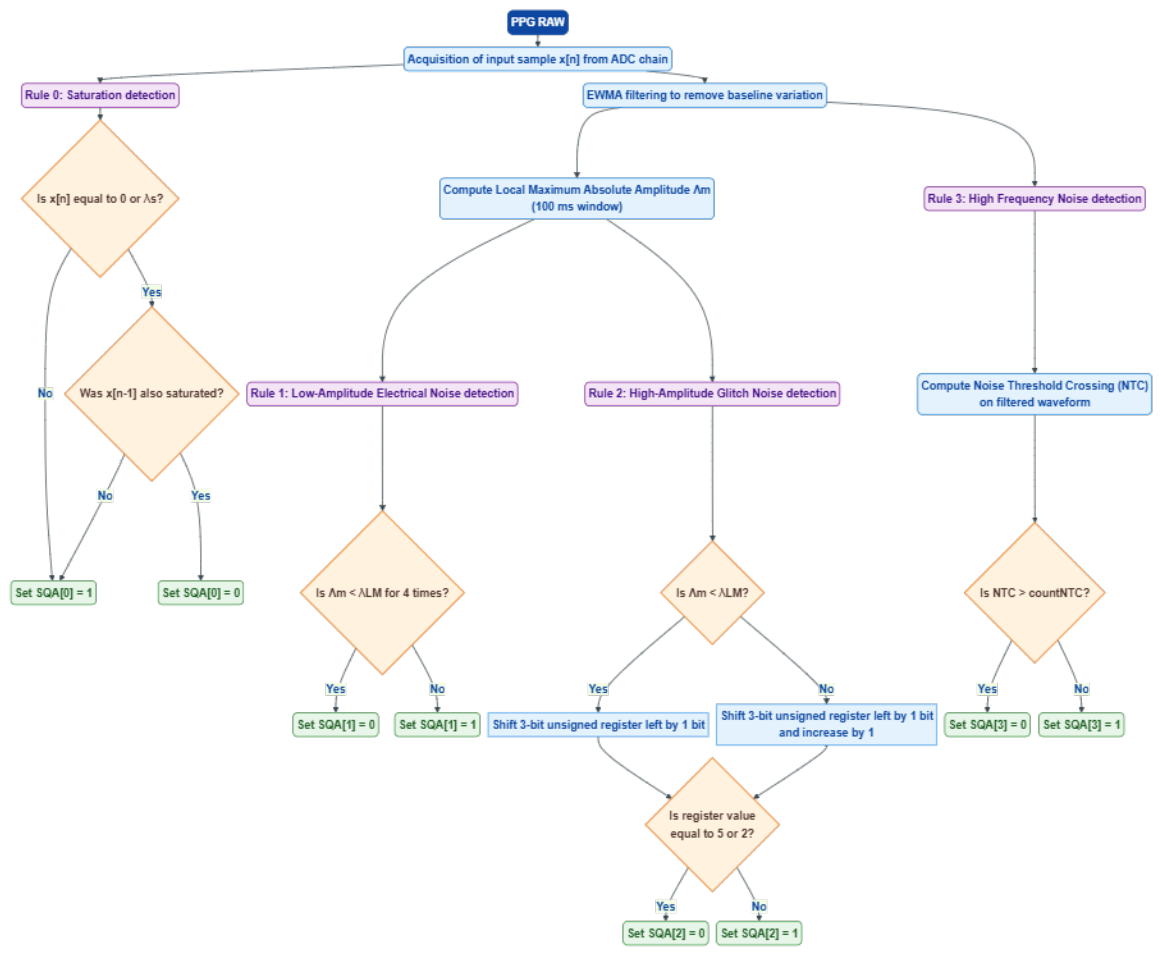
The proposed RTL SQA algorithm operates directly on real-time samples from the analog-to-digital conversion chain. The SQA module processes these samples at each measurement instance of the device; hence, the execution time of the algorithm must fit within the interval between successive measurements. Four decision rules are implemented, each of which has an output pin or “flag”. These flags are normally set to one, and when a particular rule is violated, its flag is set to zero.
The algorithm takes the recorded unsigned sample
directly from the analog-to-digital chain; however, rules 1, 2, and 3 do not use this form of data. Hence, the recorded sample
is processed to remove baseline components that slowly vary using an Exponential Weighted Moving Average (EWMA) filter. The amount of averaging at the output of the filter is controlled by the constant coefficient
, which is the weighting factor of the exponential average [
12].
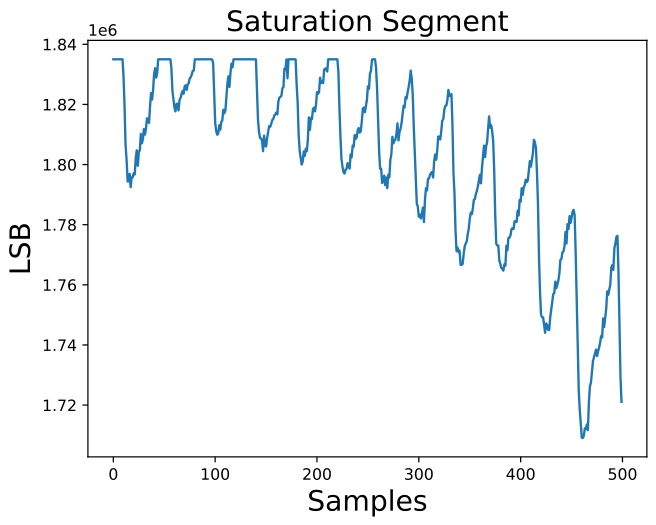
Saturation: Rule 0 detects the saturation of the input signal from the analog front-end. Saturation is detected by checking whether the input sample reaches the saturation value or zero. Each time a new sample arrives, the rule checks whether this sample is equal to the saturation value or zero and stores one or zero in a boolean register depending on whether this condition is met. If both the (i-1)th sample (stored in the register) and the current sample are equal to the saturation value or zero, the saturation flag SQA[0] is set to zero, indicating that the SQA module has detected saturation of the device input signal.
Local Maxima Absolute Amplitude: Rules 1 and 2 are based on the Local Maxima Absolute Amplitude of signal segments of 100 ms duration that do not overlap with the next signal segments. The Local Absolute Amplitude Maximum
is computed as follows:
where
is the absolute value of the sample and
L is the length of the segment, which is computed as the product of the duration of the segments (100 ms) and the sample time of the sensor.
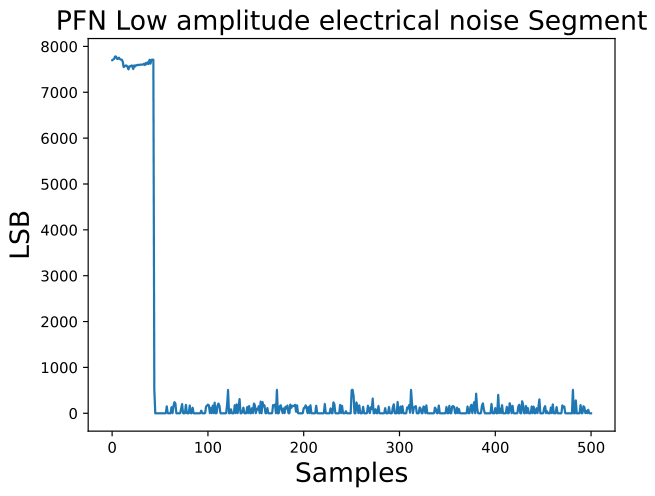
Rule 1 detects the presence of very low-amplitude segments (PFN segments), which can occur if the sensor is disconnected from the measurement site or if the analog front-end experiences a malfunction and produces only white noise. In this case, the Local Absolute Amplitude Maximum is compared with the threshold value . This threshold is strongly influenced by the behavior of the analog front-end in the above situations and is determined by experimental observation. If the Local Absolute Amplitude Maximum is four times lower than the threshold , the low-amplitude electrical noise flag SQA[1] is set to zero, indicating that the SQA module has detected the PFN.
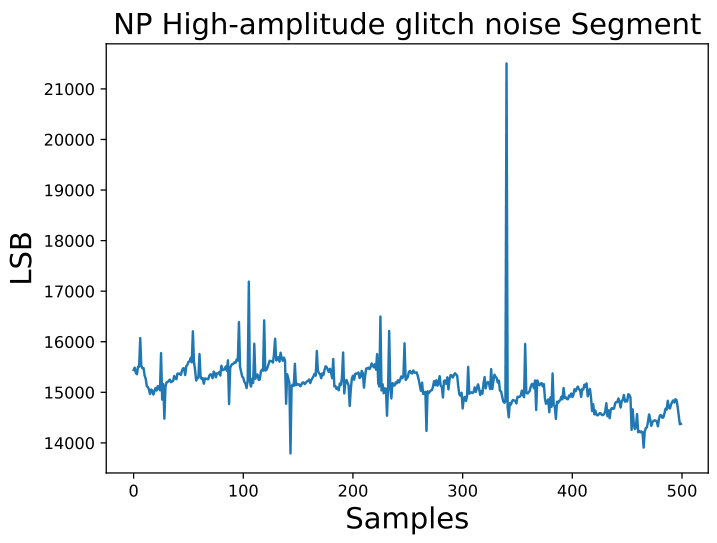
Rule 2 detects the presence of high-amplitude glitch noise segments by monitoring whether the Local Absolute Amplitude Maximum is alternately below the threshold . This is implemented using a three-bit unsigned register initialized to seven. When the Local Absolute Amplitude Maximum is lower than the threshold , the register is shifted left by one bit. Otherwise, the register is shifted left by one bit and incremented by one. If the register value becomes five or two, this indicates that the Local Absolute Amplitude Maximum is alternately below the threshold . The high-amplitude glitch noise flag SQA[2] is set to zero, indicating that the SQA module has detected the glitches in the PPG signal.
Noise Threshold Crossing: Rule 3 detects high-frequency noise segments or motion artifacts. The presence of very low-amplitude high-frequency (HF) noise often causes significant jitter around threshold crossings
, resulting in a high number of crossings, typically corresponding to the zero-crossing point. The Noise Threshold Crossing (NTC) rule calculates the maximum number of threshold crossings using the following equation:
where sign{ } returns
when sign{ }
and
otherwise. If the Noise Threshold Crossing exceeds the maximum number of threshold crossings
, which is calculated in Ref. [
4] using the following equation:
where
t is the duration of the segment in
,
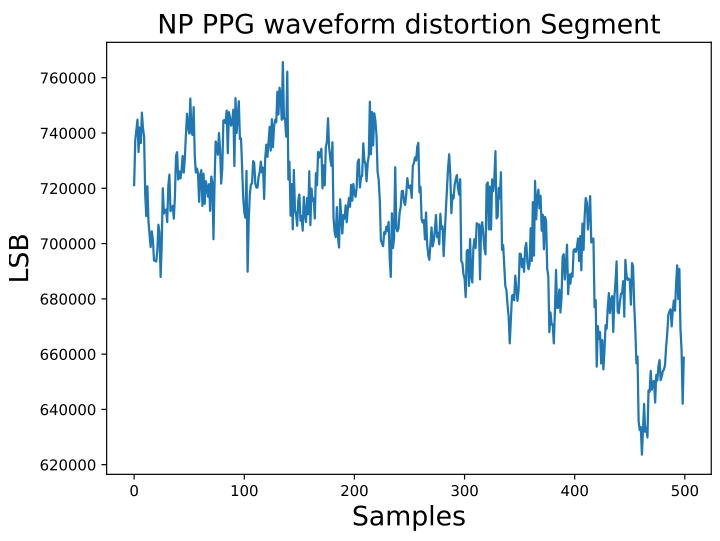
is the smallest pulse-to-pulse interval, and 4 is the maximum number of times that a single pulse can cross the threshold (two times during the systolic phase and two times during the diastolic phase). The PPG waveform distortion noise flag SQA[3] is set to zero, indicating that the SQA module has detected the Noisy Pulse (NP).
The algorithm is summarized in the flowchart shown in
Figure 5.
3.2. RTL Implementation
The RTL SQA module has been developed using High-Level Synthesis (HLS) with the Catapult tool from Siemens.
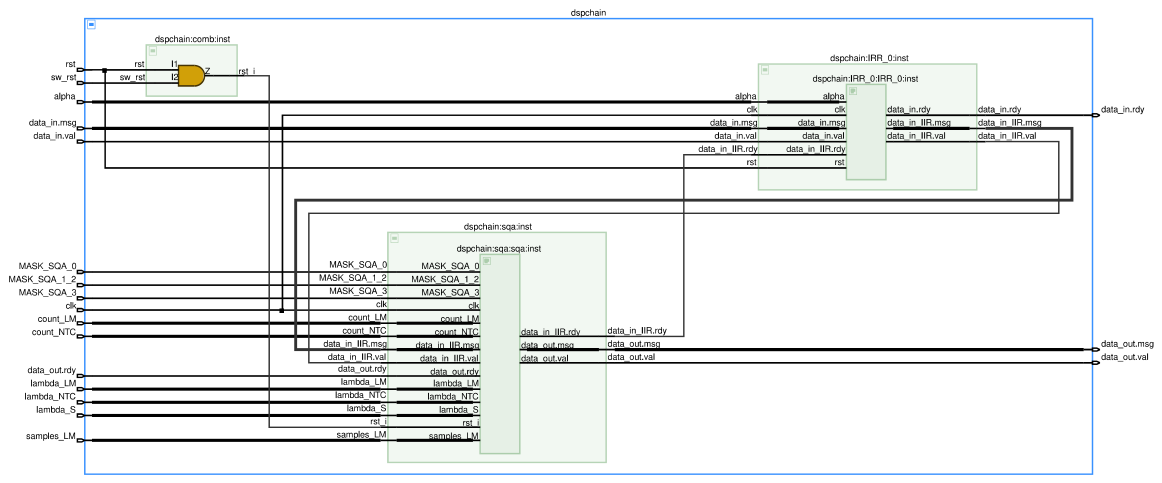
The module, as shown in
Figure 6, consists of three main blocks and takes the algorithm constants needed for the decision rules from the register map of the device, which are determined during the calibration phase. The three main blocks are described below:
Software Reset: Used to periodically reset the SQA decision rule. It consists of an AND gate combining the software reset input and the general reset, both asserted with a low logic level. The software reset must be asserted periodically because the output flag and the decision rule must be reset to evaluate the new incoming segment.
Exponential Weighted Moving Average (EWMA) IIR Filter: Implements the EWMA IIR filter, which takes the data from the analog front-end chain as input and outputs the same data without the baseline.
SQA decision rules: This block implements the rules described in
Section 3.1. It takes as input the data directly from the analog front-end chain and the filtered data. To ensure accurate evaluation of new incoming segments, the block must be reset periodically, resetting both the output flag and the decision rules. The output is a unique word in which the 21 least significant bits (LSB) contain the filtered input, while the 4 most significant bits (MSB) represent the output of each rule.
Table 2 summarizes the results obtained from the High-Level Synthesis (HLS) of the Signal Quality Assessment (SQA) module. The reported metrics provide an overview of the performance and hardware cost of the generated RTL implementation.
The SQA module has a latency of three clock cycles, which corresponds to a processing delay of ns. This delay represents the time required for an input sample to propagate through the entire processing chain and generate the corresponding output.
Timing performance is assessed using the slack metric, which quantifies the margin with respect to the target clock constraint. The achieved slack of ns indicates that the critical path delay is well below the specified clock period. This demonstrates compliance with the timing requirements and provides robustness against process, voltage, and temperature variations.
The synthesized design occupies a total silicon area of 21,544.81 , including combinational logic, sequential elements, and supporting hardware resources.
Overall, the synthesized SQA module offers a combination of low latency, a positive timing margin, and moderate area occupation, making it well-suited to real-time embedded signal processing applications.
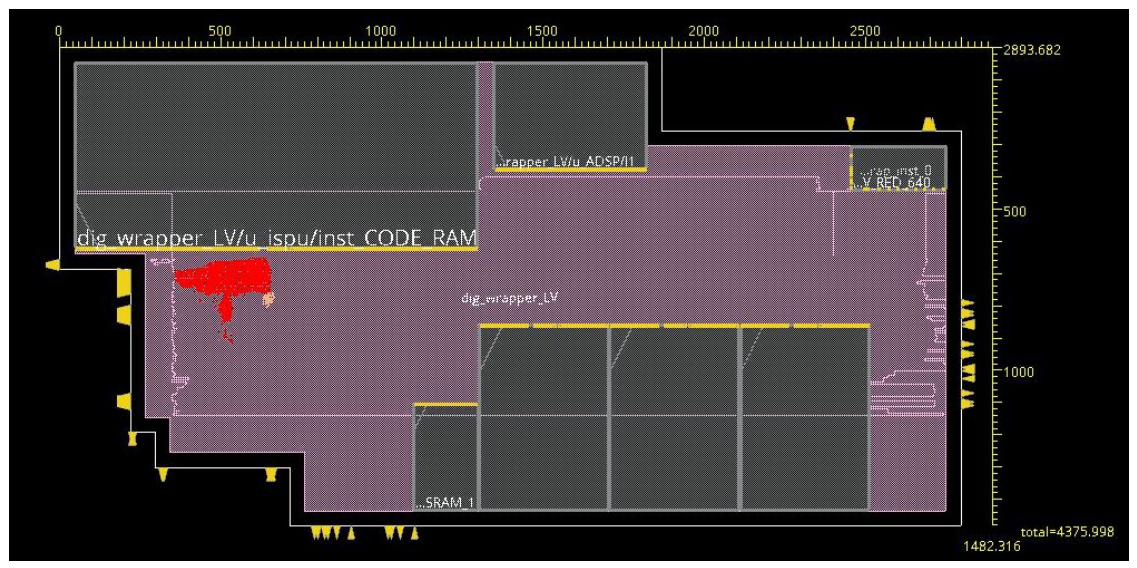
The RTL Signal Quality Assessment (SQA) module is implemented in a 130 nm standard CMOS, occupying an area of 20,964
after place and route, equivalent to
kgates. The layout is shown in
Figure 7.
3.3. System Architecture
The Signal Quality Assessment (SQA) module is integrated into the same Photoplethysmography (PPG) application-specific integrated circuit (ASIC) described in Ref. [
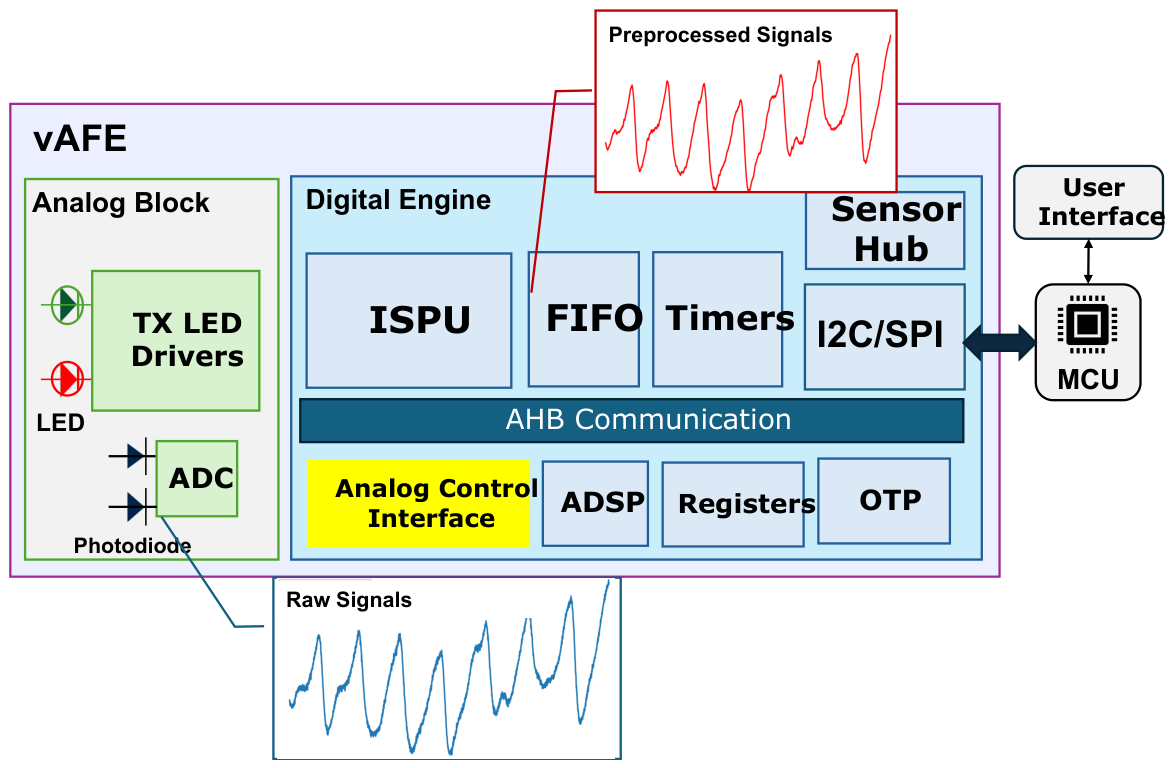
13], whose block diagram is shown in
Figure 8. The vertical analog front-end (vAFE) is an analog-digital circuit that amplifies and filters raw PPG signals, communicating with an external microcontroller via I2C or SPI protocols. Operating at
V and 32 MHz, the vAFE consists of two main blocks: an analog block and a digital engine.
The analog block includes two output LEDs with parallel transmission (TX) channels, each driven by an eight-bit configurable current, as well as two input photodiodes with parallel analog front-end processing channels and an analog-to-digital converter (ADC) capable of sampling and digitizing signals at 16 bits and 2 MHz.
The RTL-based SQA algorithm is part of the analog control interface (highlighted in yellow), which is the digital unit responsible for managing the analog domain. It coordinates the entire measurement flow, from initial configuration to data processing and transfer.
The user configures the main device parameters in this unit, including the sample frequency, the maximum number of two frames to be executed in parallel, and settings related to the RX/TX channels, TX current, input range, decimation, and frame repetitions.
The ADC data are sent to the Cascaded Integrator-Comb (CIC) filter, a digital low-pass filter that processes the ADC samples. It reduces the signal bandwidth through integration and decimation to produce data better suited for further processing.
The 24-bit filter output is then used as input for the accumulators, which store the filtered data and use it to produce the final PPG result. The block manages multiple accumulators, each of which is associated with a specific acquisition phase, such as noise sampling and PPG sampling. When the Final State Machine (FSM), which controls the analog part, activates the averaging operation, the block calculates the final result by combining the values stored in the accumulators.
The 21-bit final data are exchanged between the SQA and accumulator blocks via a valid/ready protocol. Once SQA processing is complete, the results are stored in registers of the analog control interface.
The digital section contains other sub-blocks that manage vAFE operation, including two processors (the Instruction Set Processing Unit (ISPU) and the Advanced Digital Signal Processing (ADSP) unit) for processing tasks such as filtering and management, a 24-bit First-In-First-Out (FIFO) memory for temporary data storage, a 640-bit One-Time Programmable (OTP) memory, and interface management units for the Sensor Hub and I2C/SPI protocols. Standard digital components, including registers and timers, are also present.
4. Experimental Results
4.1. Setup Environment
As shown in
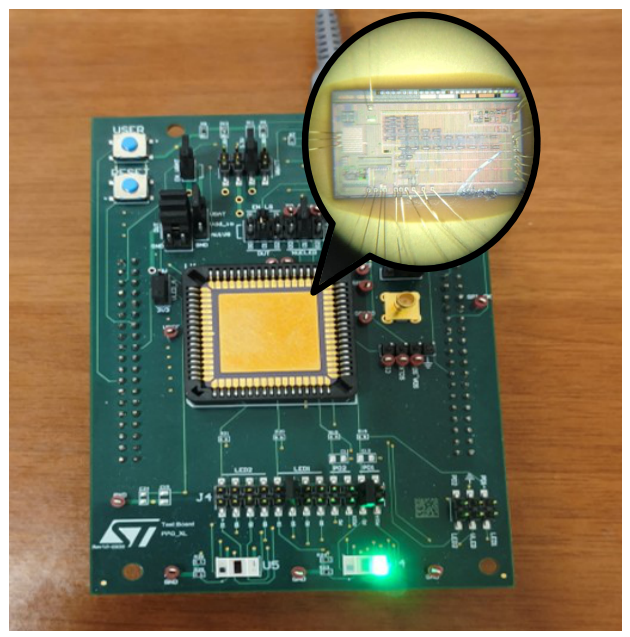
Figure 9, the ASIC is mounted on a custom-printed circuit board (PCB) that includes a low-dropout regulator (LDO), a level shifter, and a bio-monitoring sensor. The ASIC total area is equal to
mm
2, while the areas of the analog and digital sections are equal to
mm
2 and
mm
2.
The LDO, which is an LDK130 by STMicroelectronics, is used to provide the ASIC with a stable V supply voltage. The level shifter (TXS0108E by Texas Instruments, Dallas, TX, USA) translates the communication voltage levels of the external microcontroller (MCU) to a level compatible with the ASIC ( V for the high logic level).
The bio-monitoring sensor is the SFH 7072, produced by OSRAM. This is a fully integrated optical sensor designed for vital sign monitoring in wearable devices, such as smartwatches and fitness trackers. It comprises multiple emitters: two green ( nm), one red ( nm), and one infrared ( nm), along with two photodetectors: one optimized for green and red wavelengths, and the other for infrared wavelengths.
The application board is supplied with V, communication signals, and a 32 MHz clock by the STM32F072RB, a 32-bit microcontroller from STMicroelectronics based on the ARM Cortex-M0 core. The microcontroller features are as follows: 128 kB of flash memory, 16 kB of SRAM, and it operates at up to 48 MHz, which is sufficient to manage the application board.
A Python script controls the entire system and communicates with the STM32F072RB via a Universal Asynchronous Receiver–Transmitter (UART) interface. The microcontroller then translates these commands into I2C transactions to interface with the ASIC.
4.2. Signal Quality Assessment Calibration
To achieve high performance in the Signal Quality Assessment block, it is necessary to use the correct constant algorithm values, which are obtained during the calibration phase, as mentioned in
Section 3.2. The constant algorithm values obtained in this phase are:
Saturation value : The maximum value that can be represented when the analog front-end is saturated. This value is extracted from a simulation of the vAFE.
Weighting factor α: Controls the amount of averaging at the output of the EWMA filter [
12]. This value was chosen to maximize the Signal-to-Noise Ratio (SNR) at the filter’s output. SNR can be expressed using the following equation:
where
is the signal power and
is the noise power. To extract these values, the output signal from the EWMA was filtered using a low-pass filter (LPF) with a cut-off frequency of 30 Hz to remove very high-frequency noise components that are not intrinsic to the signal. The noise was then extracted from the filtered signal using a band-pass filter (BPF) set to a frequency range of 15– 30 Hz. The upper limit of this range, 30 Hz, is the cutoff frequency of the previous LPF, while the lower limit is 15 Hz because most of the frequency content of the PPG signal is below this value, as mentioned in Ref. [
2]. Therefore, the signal power
and the noise power
were extracted as follows:
where
N is the number of samples,
is the sample filtered only by the low-pass filter, and
is the sample filtered by the band-pass filter.
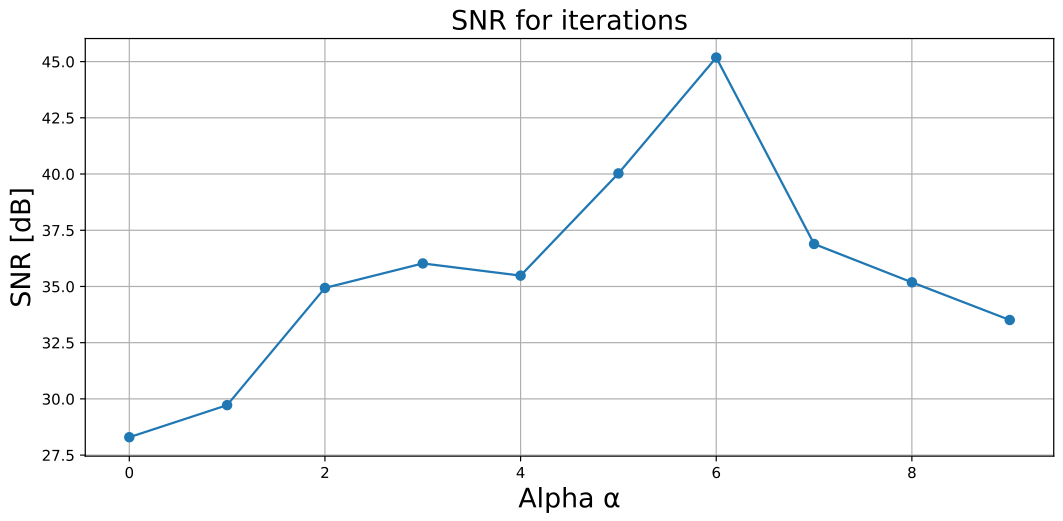
The value of the constant
was varied from 0 to 9, and the corresponding Signal-to-Noise Ratio (SNR) was evaluated using Equation (
4). The obtained results are reported in
Figure 10. From this analysis, the optimal value of
was found to be 6, corresponding to a maximum SNR of
dB.
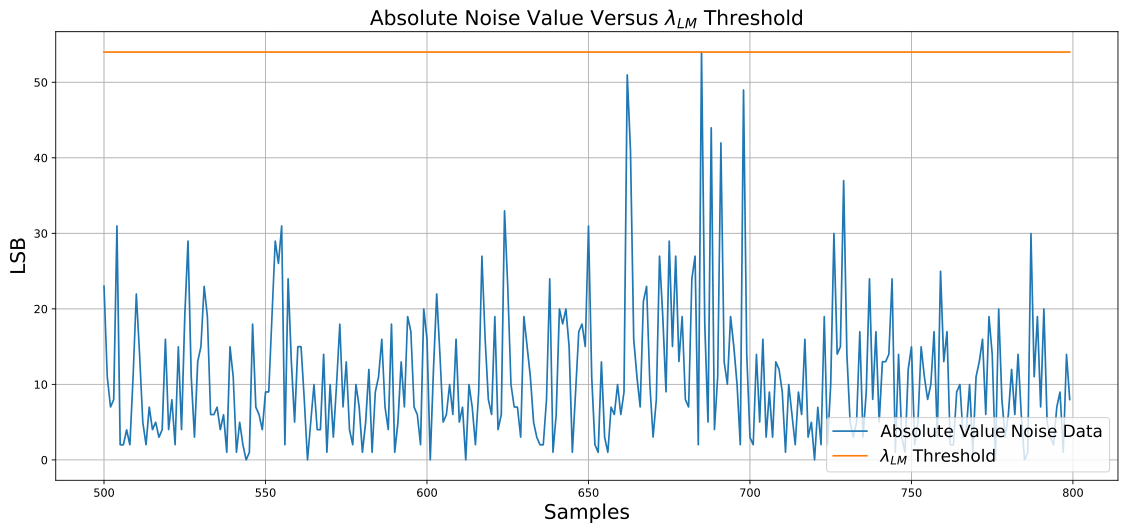
Threshold : Represents the threshold used to identify the maximum level of white noise. To determine this threshold, the board was oriented toward the table and fully exposed to reflected PPG light, with the EWMA weighting factor
set to 6, as shown in Figure 13. Under these conditions,
was defined as the maximum absolute signal value measured by the sensor and can be calculated using the following equation:
where
N is the number of samples and
is the signal sample. The threshold value
was extracted using Equation (
7) and was found to be equal to 54 LSB, as shown in
Figure 11.
Threshold crossings : Defines the reference level around which low-amplitude high-frequency (HF) noise is concentrated. As reported in Ref. [
4], such noise is generally centered around the zero-crossing point of the signal. Therefore, the threshold
was set to 0 LSB.
Threshold-crossing count : Represents the maximum number of crossings of the threshold
expected under physiological PPG signal conditions. It was calculated using Equation (
3) as the product of the ratio between the segment length (2500 ms) and the minimum pulse-to-pulse interval (
) (200 ms), and a factor of four, corresponding to the maximum number of threshold crossings that can occur within a single pulse waveform. This results in a maximum allowable count of 50 threshold crossings per segment.
4.3. Real-Time Dataset
To demonstrate the effectiveness of the proposed algorithm, a dataset was acquired from eight subjects in order to validate the four SQA flags. The PPG signal was digitized at a sampling rate of 128 Hz with a resolution of 21-bit unsigned raw data, along with four additional bits representing the SQA flags used to assess signal quality. The dataset is divided into five cases:
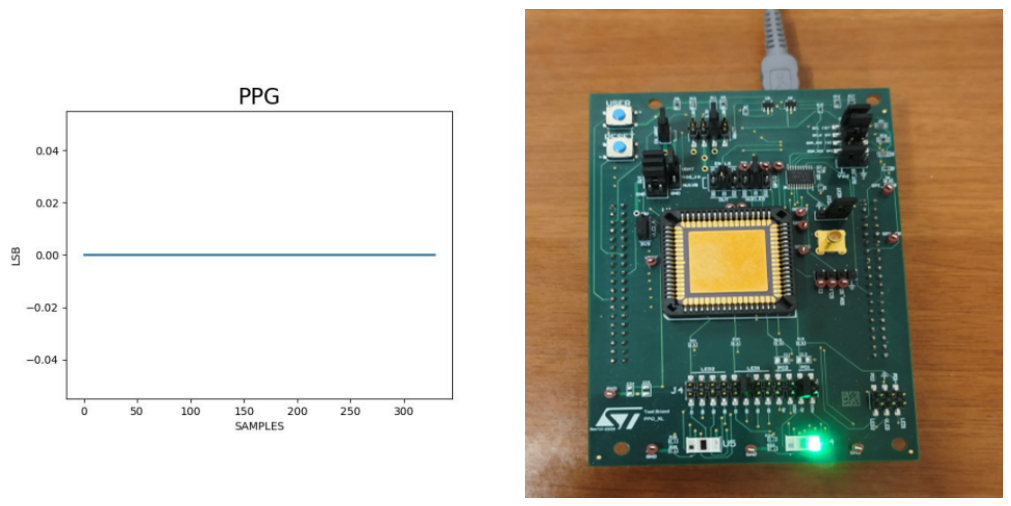
Zero saturation: The system is fully exposed to ambient light. When the ambient light level exceeds the useful PPG signal, there is zero saturation, and the vAFE forces its output to zero, as shown in
Figure 12.
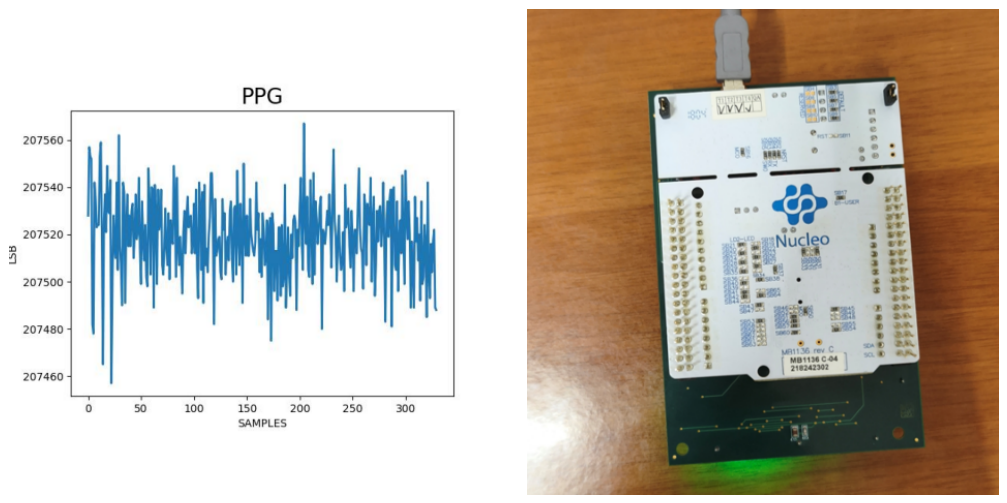
Low amplitude electrical noise: The system is oriented towards the table and is fully exposed to reflected PPG light. Under these conditions, only low-amplitude electrical noise is observed, as shown in
Figure 13.
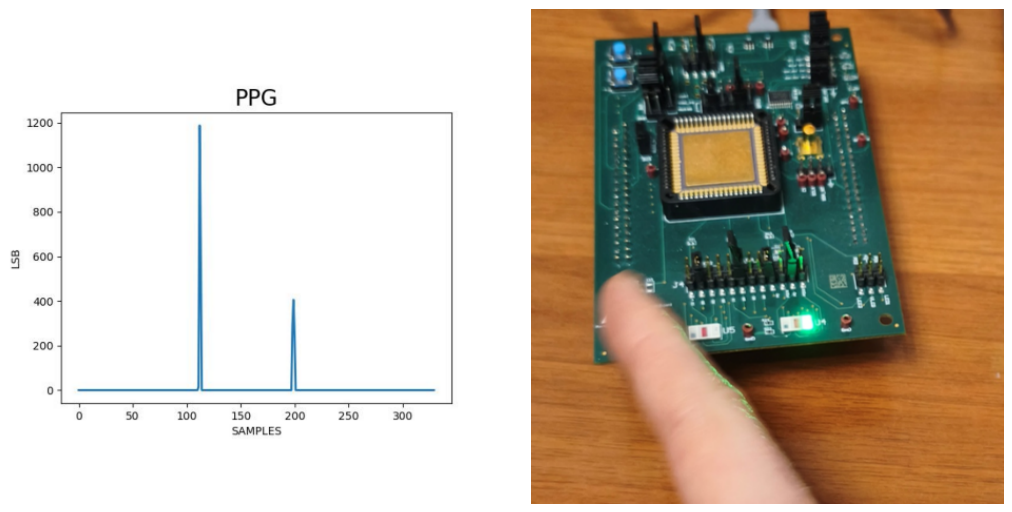
Glitch with high amplitude: The light beam is interrupted by rapid finger movement over the bio-monitoring sensor. Under these conditions, high-amplitude glitches are observed, as shown in
Figure 14.
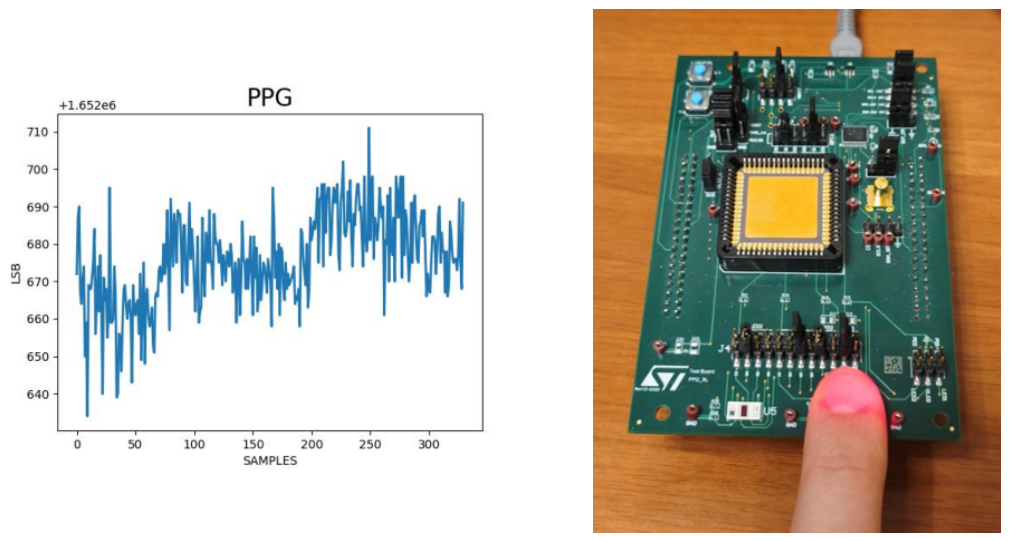
High frequency noise: The system is configured with maximum current transmission (TX) channels and a red wavelength in order to achieve deeper tissue penetration. Under these conditions, the PPG signal becomes severely distorted by high-frequency noise, as illustrated in
Figure 15.
Clean Signal: The system is properly configured to acquire high-quality PPG signals.
4.4. Dataset
This paper uses the Pulse Transit Time PPG Dataset [
14], a benchmark dataset that provides high-resolution signals from multiple sensors worn at different locations on the body, including Photoplethysmogram (PPG), inertial, pressure, and Electrocardiogram (ECG). In particular, this study focuses on the green wavelength PPG (
nm) recorded from the distal phalanx (first segment) of the left index finger, palmar side. The PPG signal in the dataset was acquired using the Maxim Integrated MAX30101 sensor (San Jose, CA, USA) connected to an ARM Cortex-M4 microcontroller running at 180 MHz. The sensor data was sampled at 500 Hz, corresponding to a 2 ms reading window.
4.5. Performance Evaluation
Performance evaluation was carried out using the Pulse Transit Time PPG Dataset and a real-time dataset acquired from the PPG sensor. The first dataset was used to emulate the combined effect of the PPG signal and ambient light. The PPG signal was obtained from the dataset [
14], while the ambient light was modeled by adding white noise to the SQA model, reflecting the dual-input structure of the digital block, which processes both signals. Different scenarios, as described in
Section 2.2, were generated by varying the gain of these two inputs.
The second dataset was evaluated over
s of real-time frames that include both the raw PPG data and the signal quality indicators produced by the SQA block. This allows us to detect the correct behavior of the decision rules, as described in
Section 4.3.
The validity of each rule was verified by applying the corresponding waveform to calculate the coefficients for the sensitivity (Se), specificity (Sp), and accuracy (OA) equations, as reported in Ref. [
3].
where TP is true positive, TN is true negative, FP is false positive, and FN is false negative. These coefficients determine how many input waveform segments are correctly recognized according to the rule.
The performance is evaluated using Equations (
8)–(
10), and is summarized in
Table 3. For the first dataset, which is extrapolated by Pulse Transit Time PPG, 1000 one-second waveform segments were analyzed (i.e., 200 segments for each rule). For the second dataset, 4000 segments of 2.5 s were considered (i.e., 500 segments for each rule), resulting in a sensitivity of 95.2%, a specificity of 88.1%, and an accuracy of 89.52%.
4.6. Energy Performance Assessment
Energy consumption was evaluated using the Pulse Transit Time PPG Dataset with a one-second waveform segment (512 Hz data sampling from the analog front-end of the device). The SQA module had an average power of W peing the PrimeTime program. This average power translates into an energy consumption of J for a one-second segment.
This result is compared in
Table 4 with the works described in
Section 2.1. The comparison shows that the efficiency of the proposed RTL SQA module is superior to that of the microcontroller-based approach by more than 27 times.
Beyond its own energy footprint, the SQA module produces a net energy benefit at the system level by gating data movement. During normal operation, when the sensor FIFO is read by the I2C master, the associated switching activity increases the energy consumption by 9%, and each transfer additionally requires the host microcontroller to be active to service the transaction. When a segment is identified as severely corrupted, the SQA module de-asserts the corresponding quality flags, thereby disabling the FIFO-read interrupt (sensor ODR) before any transfer occurs. As a result, the corrupted segment is not transmitted over the I2C link, the FIFO is overwritten by the next segment, and the host MCU is not woken up to process data that would ultimately be discarded. This mechanism is the basis of the system-level energy advantage of the proposed approach. The cost of the decision is bounded and known a priori: 5.38 µJ per one-second segment, incurred unconditionally. Against this cost, each rejected segment avoids both the 9% transfer-related switching overhead and the considerably larger energy associated with waking and engaging the host MCU, which typically dominates the per-transaction budget in wearable systems. Because the SQA decision is taken in-sensor, and per sample, this gating is applied with deterministic latency and without any processor involvement on the sensor side. The benefit, therefore, scales directly with the fraction of corrupted segments: under acquisition conditions affected by motion artifacts or poor sensor coupling, where a non-negligible share of segments is unusable, suppressing their transmission removes the corresponding I2C and host-side activity entirely, so the module’s fixed overhead is recovered many times over.
5. Comparison of Machine Learning Frameworks, MCU-Based Rule Methods and Hardware-Oriented Approaches
The most common approaches to assessing the quality of PPG signals can be broadly classified into three categories: conventional rule-based methods executed on microcontrollers; machine learning and deep learning techniques implemented on embedded computing platforms; and dedicated hardware solutions integrated directly into the sensing chain.
Conventional microcontroller (MCU)-based Signal Quality Assessment algorithms typically rely on physiological features, threshold-based decision rules, autocorrelation analysis, or statistical descriptors extracted from buffered photoplethysmography (PPG) segments. Examples include the hierarchical decision-rule framework proposed by Reddy et al. [
3] and the amplitude–autocorrelation rule-based method introduced by Vadrevu et al. [
4], which achieved classification accuracies above 90%. While these approaches are less computationally complex than machine learning and deep learning solutions, they still require segment buffering, sequential software execution, and continuous processor involvement during operation.
More recently, machine-learning and deep-learning approaches have demonstrated remarkable classification performance under challenging acquisition conditions. Tiny-PPG [
15] introduced a lightweight deep neural network optimized for edge devices, achieving real-time deployment on STM32 microcontrollers through depthwise separable convolutions, atrous spatial pyramid pooling, and model pruning. Similarly, derivative-based CNN [
16] approaches have demonstrated classification accuracies approaching 99% through extensive hyperparameter optimization and deployment on embedded platforms such as Raspberry Pi. More recently, compressed-sensing CNN [
17] frameworks have been proposed to jointly address Signal Quality Assessment and energy-efficient wireless transmission in wearable systems.
Despite these advances, both MCU-based and AI-based solutions require software execution, memory allocation, and buffering of signal segments prior to classification. AI-based approaches further require offline training procedures, parameter storage, neural-network inference engines, and intermediate feature-map memory, increasing implementation complexity and energy consumption.
In contrast, the proposed architecture was specifically designed for direct hardware implementation within the PPG acquisition chain. The proposed RTL-based solution operates as a deterministic streaming pipeline without processor intervention, model training, weight storage, neural-network inference, or external memory requirements. Signal Quality Assessment is performed directly on incoming samples through hardware-oriented decision rules optimized for ASIC deployment.
Therefore, the proposed work has a fundamentally different optimization target from both MCU- and AI-based approaches. While conventional software implementations prioritize algorithmic flexibility and AI-based methods prioritize classification accuracy, the proposed architecture prioritizes ultra-low-power operation, deterministic latency, and silicon-area efficiency. This makes the proposed solution particularly attractive for long-term, battery-powered monitoring systems where computational resources and energy budgets are extremely limited, as summarized in
Table 5.
6. Conclusions
This work introduces a highly efficient RTL-based SQA module for PPG sensors, enabling real-time, single-sample evaluation directly within the sensing hardware. By embedding Signal Quality Assessment into the acquisition chain, the proposed approach eliminates the need for external processing and enables early rejection of corrupted data.
The proposed solution achieves a sensitivity of , specificity of , and overall accuracy of , approaching state-of-the-art performance while drastically reducing computational complexity. Notably, the module operates with an energy consumption of only J per one-second segment, outperforming existing microcontroller-based approaches by orders of magnitude.
These results highlight the potential of in-sensor intelligence to significantly improve the energy efficiency and reliability of wearable systems.