Article

Evaluation of Associative Effects of In Vitro Gas Production and Fermentation Profile Caused by Variation in Ruminant Diet Constituents

by
Danielle F. Baffa
,
Tadeu S. Oliveira
*,
Alberto M. Fernandes
,
Michelle G. Camilo
,
Ismael N. Silva
,
José R. Meirelles Júnior
and
Elon S. Aniceto
Laboratory of Animal Science, Universidade Estadual do Norte Flumense—Darcy Ribeiro (UENF), Av. Alberto Lamego, 2000, Campos dos Goytacazes 28013-602, RJ, Brazil
*
Author to whom correspondence should be addressed.
Methane 2023, 2(3), 344-360; https://doi.org/10.3390/methane2030023
Submission received: 18 July 2023 / Revised: 22 August 2023 / Accepted: 25 August 2023 / Published: 12 September 2023

Abstract

:
This study aimed to investigate the associative effects caused by changes in the proportions of feed ingredients (forage-to-concentrate ratio) and the forage source in ruminant diets on in vitro gas production and fermentation parameters. The study consisted of two assays conducted in a completely randomized design with a 3 × 10 factorial arrangement consisting of three forages (pineapple crop waste silage [PS], corn silage [CS], and Tifton hay [TH]) associated with concentrate feed (C) (binary mixture) in 11 proportions, with triplicates of each combination. For the first assay, the asymptotic volume of gas did not show any difference among (p = 0.059) CS and PS (p = 0.464) and their proportions. We evaluated the associative effect among forages and their proportions and noticed there was an effect on gas production between the combination of forage and concentrate for the CS (p = 0.003) and PS (p = 0.003). In the second assay, volatile fatty acids (VFA) and ammonia nitrogen (p < 0.05) were affected by the forage source and concentrate inclusion. In conclusion, forages with a high content of soluble carbohydrates presented the lowest gas production, as well as higher concentrations of propionic acid and ammonia nitrogen. The associative effect on in vitro gas production was more pronounced in the first 12 h incubation. The different forage sources and the inclusion of concentrate change fermentation parameters.

1. Introduction

The manipulation of dietary nutrient composition is often proposed as a strategy that farmers may exploit to reduce the proportion of energy lost by animals as eructated gases (methane (CH4), carbon dioxide (CO2), nitrous oxide (N2O)) and to improve feed and energy efficiency. Methane is an end product of rumen fermentation, formed autotrophically by Methanogenic archaea from CO2 and H2 derived from the fermentation of carbon sources. Methane represents a loss of feed gross energy, and the Intergovernmental Panel on Climate Change uses 6.5 ± 1.0% as the default for dairy cows [1]. Methane is a greenhouse gas with a global warming potential 28 times greater than carbon dioxide over a 100-yr time horizon [2]. In ruminants, enteric gas production is mainly influenced by the type of feed available and their intake level [3,4]. The type of feed supplied to ruminants can have a strong effect on rumen fermentation. The amount of enteric gas produced is related to various dietary factors such as carbohydrate type, forage processing, fat addition, and ionophore addition [4,5]. In addition, gas production can be influenced by characteristics of the feed or feed proportions supplied to the animal (forage-to-concentrate ratio), e.g., nature and amount of feed, the extent of its degradation, and the amount of H2 formed [6]. However, in practice, when the animal is offered a combination with a high forage content (e.g., 80% forage), more gas (mainly CH4) after 24 h of incubation (fiber digestion) is produced per unit of digested feed compared to proportions with a high concentrate content [7]. The opposite is noticed when increasing the concentrate content of feed proportions, which can improve the digestibility of the diet. In addition, it implies an increase in the proportion of propionate among the final fermentation products [6,8]. This is because propionate is formed from a competitive pathway of H2 utilization in the rumen, which reduces the availability of substrate for methanogenesis [9,10,11]. However, these strategies do not always comply with the feeding standards used in intensive dairy farms and are usually not applied owing to the risks of negative health and economic consequences [12].
High-grain diets can cause pH drops, high concentrations of acids (i.e., lactic acid), and an increase in osmolality, exacerbating the accumulation of acid within the rumen by inhibiting volatile fatty acid (VFA) absorption [13,14]. The high rate of starch fermentation may contribute to the accumulation of lactic acid and VFA [14]. Conversely, ruminants fed high proportions of forage (e.g., 90:10 forage-to-concentrate ratio) can limit feed intake and decrease microbial protein synthesis (due to increased passage rate and consequently increased maintenance required by ruminal microorganisms) and energy efficiency by favoring CH4 production [15]. Thus, significant inclusions of concentrate feed in the diet can improve the efficiency of microbial utilization and ammonia nitrogen (NH3-N) utilization in the rumen [16].
Associative effects between forages and concentrate supplements are well documented in the literature [17,18,19,20,21]. However, in vitro techniques can provide significant information on the mechanism of digestive interactions between feeds. Moreover, testing forages alone and in combination should provide information on the ability of a plant to affect the partition of nutrients from another plant [21]. In contrast, few studies have focused on the effect of chemical variation of interactions between forage and concentrate on gas production. Measurement of in vitro dry matter digestibility can be used to assess the nutritional quality of feeds, due to its high correlation with in vivo digestibility. In pineapple crop waste silage, for example, about 65% pineapple is inedible, which includes pulp, peel, leaves, and leaves with residues, and therefore presents substantial residual biomass [22]. Pineapple crop waste silage such as waste from fresh pineapple canneries is rich in water (about 80%) and soluble carbohydrates (e.g., pectin) [23].
Thus, we hypothesized that gas production and fermentation profile can be changed because of the associative effect between different sources of forages and their interaction with concentrate in ruminant diets. Therefore, this study aimed to investigate the associative effects caused by changes in the proportions of feed ingredients (forage-to-concentrate ratio) and the chemical composition of ruminant diets on gas production and fermentation parameters.

2. Material and Methods

The experiment was conducted in the Animal Science Laboratory of the Universidade Estadual do Norte Fluminense Darcy Ribeiro (UENF)—Campos dos Goytacazes, RJ, Brazil (21°45′41″ S, 41°17′27″ W, and 10 m a.s.l.). The climate of northern Rio de Janeiro is classified as Aw, humid tropical climate, with rainy summers and dry winters according to the classification of Köppen–Geiger [24], with an annual rainfall of 1020 mm.

2.1. Experimental Design and Substrates

Pineapple crop waste silage, corn silage, and Tifton 85 hay were used as forage sources. These experimental feeds were chosen based on the variation in their chemical composition. Corn silage contains approximately 30% dry matter (DM), and was considered here as a baseline feed, silage from pineapple crop residue has close to 20% DM, and Tifton 85 hay around 80% DM. The experiment was a completely randomized design in a 3 × 10 factorial arrangement consisting of three types of forage (pineapple crop waste silage (PS), corn silage (CS), and Tifton 85 hay (TH)) associated with concentrate (C) (binary mixture) in 11 proportions, using triplicates of each combination. The adjusted proportions for each forage (fresh feed) were as follows: 100% forage + 0% concentrate; 90% forage + 10% concentrate; 80% forage + 20% concentrate; up to the combination of 0% forage + 100% concentrate. In brief, 100-CS (100% corn silage); 90CS-10C (90% corn silage + 10% concentrate); 80CS-20C (80% corn silage + 20% concentrate), and so on.
The concentrate consisted of 61.25% ground corn and 38.75% soybean meal, being the same for all proportions. Table 1 shows the chemical composition of the feedstuffs used for in vitro gas production measurements.

2.2. In Vitro Fermentation Procedure and Measurement of Gas Production (Assay 1)

Three cannulated sheep with a body weight of 45 kg (standard deviation = 3.2 kg) were housed in collective stalls with a feeder and a drinker. Before rumen fluid collection, sheep were acclimated to a diet with forages (50% TH + 50% PS) and concentrate (80:20 forage:concentrate ratio) for 14 days to meet the maintenance requirements. After this period, rumen fluid collections began, before the daytime feeding, as recommended by [25].
Rumen fluid (liquid and solid) was collected at various points of the liquid-solid interface of the rumen environment for each incubation batch. Subsequently, the rumen fluid was mixed in a blender for 30 s to homogenize the liquid and solid phases. Then, the homogenized material was filtered through four layers of gauze into 2-L Erlenmeyer flasks connected to a hose with CO2 and kept in a water bath previously heated to 39 °C. The buffer solution used was [26], composed of NaHCO3 (9.80 g/L), anhydrous Na2HPO4 (3.71 g/L), KCl (0.57 g/L), NaCl (0.47 g/L), MgSO4 heptahydrate (0.12 g/L), and CaCl2 dihydrate (0.05 g/L). Feed samples (500 mg, standard deviation = 10 mg) were air-dried and added to each amber culture flask (100 mL) together with 50 mL of the previously prepared inoculum (1:4 ratio, ruminal fluid, and buffer solution, respectively, according to [27]. The free space in the bottles was immediately saturated with CO2, the bottles were sealed and placed in the water bath at 39 °C. In vitro incubations were conducted in two consecutive runs, each involving triplicates of samples.
The time profiles of cumulative gas production were obtained using a non-automated device. A 0 to 8 psi manometer (0.05 increments) was attached to a three-way plastic valve. One of the ways was connected to a silicone tube (i.d. 5 mm; 1.5 m in length) with a 20-gauge needle attached to the loose extremity of the tube. The second way was attached to the manometer by a small piece of the silicone tube (i.d. 5 mm; 0.3 m in length) and plastic clamps. The third way was connected by another silicone tube (i.d. 5 mm; 1.3 m in length) to the top of a graduated 25 mL pipette (0.1 mL increments), which had its conical end connected to the stem of a separating funnel (1000 mL) by the same type of silicone tube (i.d. 5 mm; 0.4 m in length). The funnel and pipette were attached to a metal support stand in a vertical and static position. The connecting system was filled with resazurin solution (0.1 g/L) to the zero mark of the pipette, i.e., allowed for atmospheric pressure equilibration. The system was filled with caution in order to avoid the formation of air bubbles. The gas pressure held in the airspace of the fermentation flask was read in the manometer by inserting the 20-gauge needle of the loose extremity through the butyl rubber stopper of the crimp-sealed flask, and the gas volume produced was read after changing the position of the three-way valve to allow the top-down displacement of the liquid inside the pipette. The objective of the loose extremity was to read the pressure and volume without removing the bottle from the water bath. However, every day, bottles were quickly removed from the incubation period to be slightly shaken in the early morning and early evening to mix contents [28]. Pressure and volume were measured at times 0; 1; 2; 3; 4; 6; 8; 10; 12; 16; 20; 24; 30; 36; 48; 72; and 96 h hours after adding the ruminal inoculum. Pressure and cumulative volume of the fermentation gases were obtained by adding the readings corrected for the milestone in the subsequent times to the zero time.

2.3. Fermentation Parameters (Assay 2)

The pH and concentration of ammonia nitrogen (NH3-N) were measured 24 h after incubation of samples in triplicates, in two consecutive runs. The content of each flask was filtered through a triple layer of gauze into Falcon tubes, and pH was measured with a digital potentiometer (MPA-210, Tecnopon, Piracicaba, Brazil). After measuring pH, an aliquot was taken from each tube. The aliquot (10 mL) was used to determine NH3-N concentration, with 1.0 mL of H2SO4 solution (500 mL/L) added to each tube, and they were refrigerated (4 °C) for further analysis. The concentration of NH3-N of the ruminal medium was determined by distillation with potassium hydroxide (2.0 N) without acid digestion, according to [29].
A second aliquot was taken only at the 24-h time point in order to determine the concentrations of volatile fatty acids (VFA). A solution of metaphosphoric acid 25% (w/v) was added to the aliquot and frozen at −18 °C for further analysis. VFA were determined using High-Performance Liquid Chromatography (HPLC; YL9100 HPLC system (Young Lin)), equipped with a Rezex RCM—Monosaccharide Ca2+ (8%) column and dimension of 300 × 7.8 mm. Ultra-pure water was used as a mobile phase with a 0.7 mL/min flow, the column temperature was 60 °C, and a refractive index detector was used. Previously, a calibration curve was performed with a linearity interval of the analyzed compounds between 0.5 and 1 g/L for butyric and acetic acids, and from 1 to 2 g/L for propionic acid.

2.4. Chemical Composition

Samples were analyzed for DM (AOAC 967.03; [30]), crude fat (CF; AOAC 2003.06; [31]), and ash (AOAC 942.05; [30]). The crude protein content (CP; N × 6.25) was determined by digesting the samples (0.25 g) in 100 mL tubes, using aluminum digestion blocks (according to the guidelines described in methods AOAC 984.13 and AOAC 2001.11) containing 5 mL H2SO4 and 1 g of a mixture with a 56:1 ratio of Na2SO4 and Cu2SO4·5H2O, including the recovery of N using NH4H2PO4 and lysine-HCl (AOAC 2019; [32]). The neutral detergent fiber content was analyzed using sodium sulfite and two additions of a standardized heat-stable amylase solution, excluding the ash, following method AOAC 2002.04 (aNDFom) [33]. The non-fiber carbohydrate (NFC) content was estimated as follows: N F C   g / k g = 1000 C P C F A s h N D F . Acid detergent fiber (ADF) expressed including residual ash and lignin (sa) were analyzed as described by [34].

2.5. Models and Calculations

Four models were used to estimate the cumulative gas production profiles, as shown below:
μ V t = A × 1 e x p ( k t )
μ V t = A × 1 e x p ( c t ) / ( 1 + K × e x p ( c t ) )
μ V t = A × K K e x p c t / ( k 1 )
μ V t = A × t c / ( t c + K c )
Equations (1)–(4) represent the monomolecular [35], logistic [36], Gompertz [36], and generalized Michaelis-Menten [37] models, respectively. In the above equations, A (mL/g DM) is the asymptotic volume of gas produced; k is the rate (1/h) of degradation of the single pool; c is a constant that determines the sharpness of the curve; K is the time (h) in which half of the substrate is degraded; and t is the incubation time.
According to [38], although the curvature is determined by parameters K and c, parameter c is what determines the position of the inflection point. If c 1 , the profile has no inflection point ( t 0 ) . However, if the c value is > 1 , the profile becomes sigmoidal as the slope increases.
The gas production rate was estimated by the first derivative of the model that best fits the data (Michaelis–Menten (Equation (4))), as described in Equation (5):
d y d t = A × ( t ( c 1 ) × c ) / ( t c + K c A × t c × t c 1 × c ) / ( t c + K c ) 2      
The associative effects between forages and proportions on gas production were evaluated using percentage differences between the observed and calculated values, as shown in the following equation:
D i f f e r e n c e % = [ O b s e r v e d v a l u e C a l c u l a t e d v a l u e C a l c u l a t e d v a l u e ] × 100

2.6. Statistical Analysis
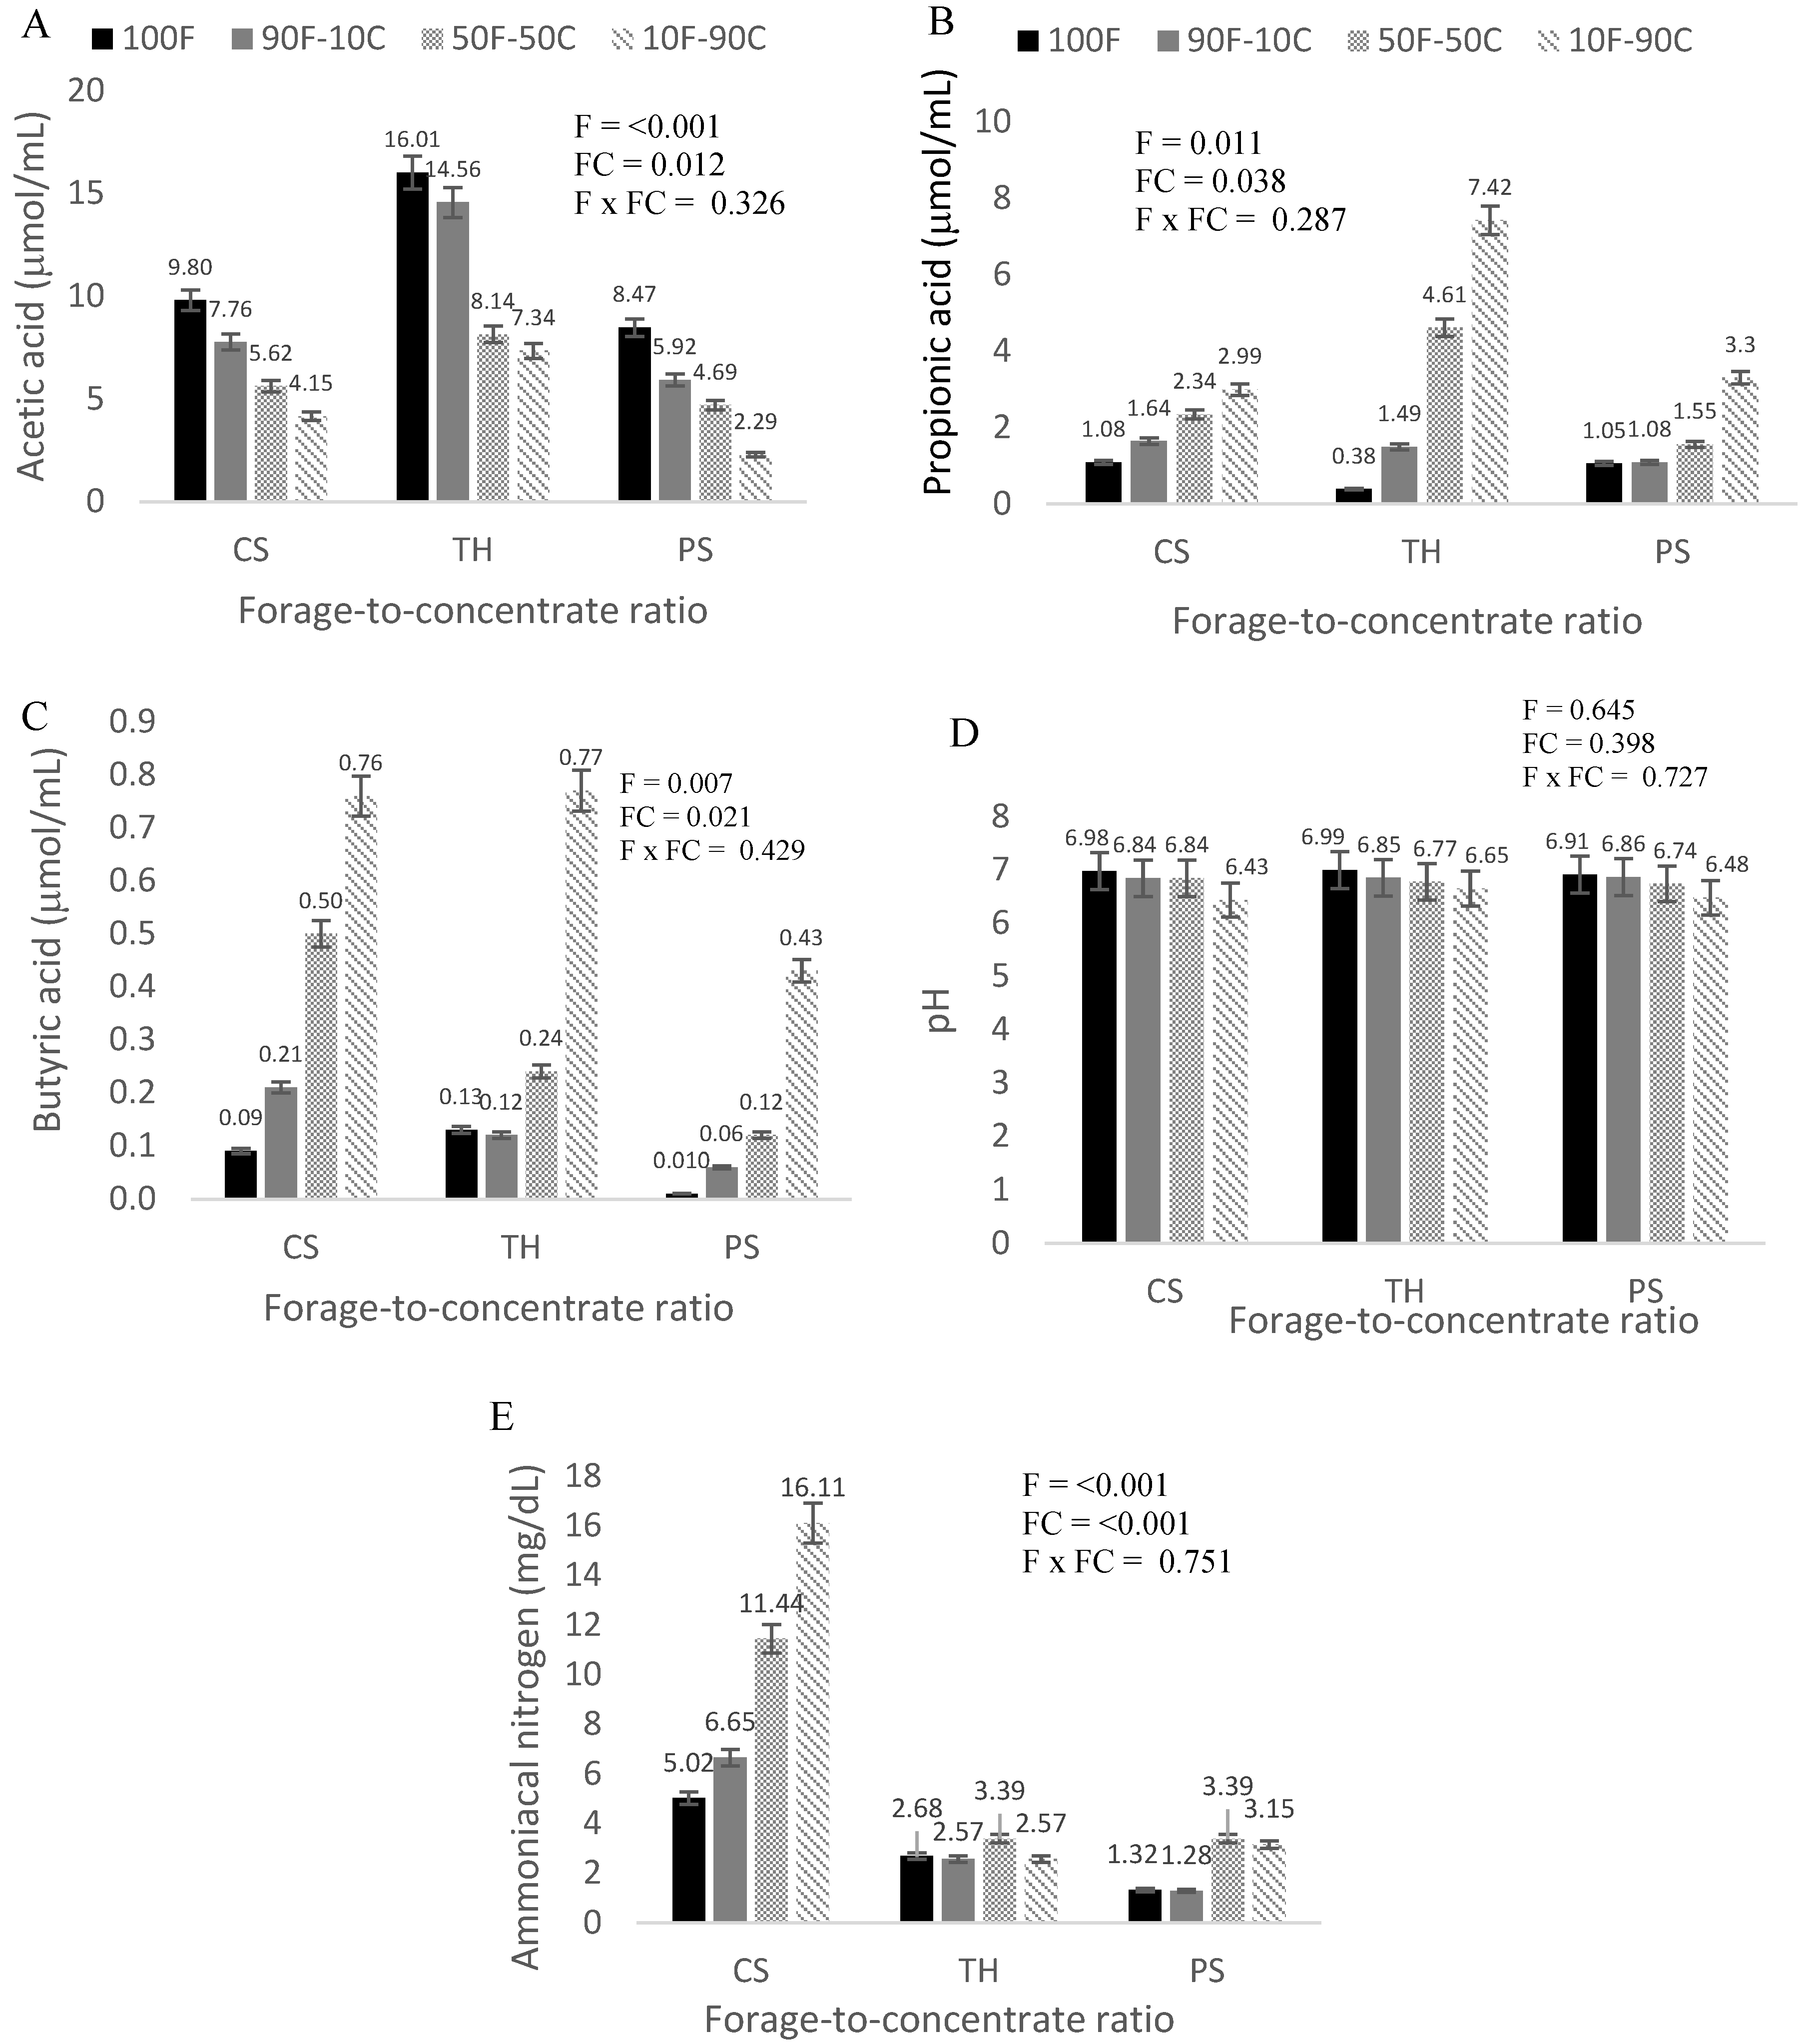
Data were subjected to exploratory analyses to eliminate outliers and the analysis of variance (linearity, homocessance, and error normality). The gas production parameters were estimated using the nlme function of the nlme package in R software (R Foundation for Statistical Computing, Vienna, Austria). Homogeneous residual variance and continuous autoregressive variance were tested to measure the correlation between repeated measures over time in each bottle (corCar1), as described by [39], using the nlme package of R. The covariance structure and models were chosen using the corrected Akaike criterion ( A I C c ) [40,41].
Data were compared by Tukey’s test, adopting a significance level of 0.05, using the nlme package in R software. Means were accompanied by the confidence interval (95% CI) and presented as follows: y ± ( U r L r ) / 2 , where y is the predicted response; and U r and L r represent the upper and lower thresholds, respectively, as predicted in the 95% confidence interval.
Pearson’s correlation coefficient was used to measure the degree of the linear relationship between gas production kinetic parameters and chemical composition by applying the PROC CORR procedure of SAS (SAS University Edition, SAS Institute Inc., Cary, NC, USA).
The following statistical model was used: Yijk = µ +αi + βj + (αβij) + rk + eijk, where Yijk is the value observed for the variable under study, referring to replicate k of the combination between level i of factor α and the level j of factor β; µ is the average of all experimental units for the variable under study; αi is the effect of forage i (i = 1, 2, 3); βj is the effect of concentrate j (j = 0, 1, 2, ... 10); rk is random run effects; (αβij) is the effect of the interaction between the factors; and eijk is the error associated with observation Yijk.
A tendency was considered when 0.10 > p > 0.05.

3. Results

There were no interactions (p > 0.05) between the different forages on the gas production kinetic parameters.
Crude protein was positively correlated (0.35; p = 0.050) with the asymptotic volume of gas produced (A) and negatively correlated (−0.42; p = 0.019) with the time in which half of the substrate is degraded (K). Neutral detergent fiber (−0.51; p = 0.003), ADF (−0.52; p = 0.003) and lignin (−0.53; p = 0.002) were negatively correlated with parameter A; however, parameter K showed a positive correlation with aNDFom (0.48; p = 0.006), ADF (0.45; p = 0.011), and lignin (0.42; p = 0.020). Non-fiber carbohydrates showed an opposite behavior, positively correlating with parameter A, and negatively with parameter K (0.70, p < 0.001; −0.57, p = 0.008, respectively).
The model that showed the best fit of the data was the generalized Michaelis–Menten model (Equation (4)) with continuous autoregressive variance (Table 2). For parameter A, there was no difference (p = 0.059) between CS (100%) and its proportions; however, there was a trend, as also occurred for the concentrate and its ingredients (p = 0.089). There was also no difference in the PS (p = 0.464) for parameter A. In contrast, for TH, there was a significant effect (p < 0.001). The TH (100%) produced the largest volume (p < 0.001) of gas, at 31.95% (30.69/45.10 × 100), more than the 10TH-90C combination (Table 3). Parameter c differed in all forages and proportions, as well as in the concentrate and its ingredients (Table 3). Parameter c was less than 1 in all forages without a combination (100%) or combined with 10% concentrate, except for CS (90CS-10C), where c was 1.0 (Table 3). Parameter K differed in all forages and their proportions as well as in the concentrate and its ingredients (Table 3). This parameter exhibited the same behavior as parameter c, i.e., in forages without a combination (100%) or combined with 10% concentrate, it took longer for half of the substrate to be degraded (Table 3). Among the ingredients, ground corn took about 33.7% longer than soybean meal for half of its substrate to be degraded (Table 3).
There was a difference in gas production at 24 h (V24) for CS and TH and their proportions (p < 0.001). On average, CS produced 17.53% more gas than TH. In the PS and its proportions, this variable did not differ (p = 0.133), which was also observed for the concentrate and its ingredients (p = 0.075). TH alone (100%) and up to the combination of 80TH-20C did not differ in terms of V24. In CS, however, differences only occurred in proportions with over 50% concentrate (50CS-50C). Gas production at 48 h (V48) followed the same trend as V24. The fractional rate of gas production at half-life (µ0.5) differed (p < 0.05) between the forages and their proportions. As the concentrate levels in the proportions were increased, µ0.5 decreased, regardless of the forage source (Table 4).
Regarding VFA, pH, and NH3-N, no interaction effect was observed between forage sources and concentrate ratios (p > 0.05) (Figure 1). The HAc showed a higher concentration in Tifton hay (p < 0.0001) than in silages of corn and pineapple crop waste. In contrast, HPr (p = 0.011) and HBu (p = 0.007) had higher concentrations in Tifton hay than in corn silage and pineapple crop waste silage (Figure 1). The inclusion of concentrate decreased the HAc in the forage sources. However, this behavior was contrary for HPr and HBu, with increasing inclusion of concentrate (Figure 1A–C). The pH was not affected by the forage sources (p = 0.398) nor by the inclusion of concentrate (p = 0.645) (Figure 1D). However, the NH3-N was affected by forage sources (p < 0.001) and/or by the inclusion of concentrate (p < 0.001) (Figure 1E).
As for the associative effect on gas production between the forages and their proportions, there was an effect of the combination between forage and concentrate for the silages of corn (p = 0.003) and pineapple crop waste (p = 0.003). However, no effect was detected for TH (p = 0.659). Negative and positive associative effects were found in silages of corn and pineapple crop waste and their proportions, with 10CS-90C and 10PS-90C, respectively, showing a positive associative effect on gas production (Table 4). The direction of the associative effects—negative or positive—changed throughout the incubation time (Figure 2).

4. Discussion

In the present study, the cumulative gas production profiles varied according to the different forages and their proportions (Figure 1). This fact can be explained by the different chemical compositions of the incubated substrates and the carbohydrate fraction contents of each forage [42]. According to [43], in the initial phase of incubation, ruminal microorganisms hydrate, attach to, and colonize the substrate. These phenomena are related to the fermentation of soluble carbohydrates, a rapidly fermentable fraction of the substrate (where CA1 are volatile fatty acids; CA2 is lactic acid; CA3 are other organic acids; CA4 are sugars; CB1 is starch; and CB2 is soluble fiber (pectin)), as described by [44]. Then, to the potentially degradable fraction, represented by neutral detergent fiber (CB3), and, finally, the phase in which cumulative gas production decreases up to zero (asymptotic phase).
Among the forages, 100-TH showed the highest asymptotic cumulative gas production (Table 3), due to its greater potentially degradable fraction (aNDFom) content. This can be demonstrated by the amount of lignin in the fiber organic matter (LIG/aNDFom), which was 4.80% lower than in CS and 29.60% lower than in PS (Table 1). Phenolic compounds interfere with the digestion of carbohydrates through fixation mechanisms. The p-coumaric acid can be complexed with cellulose, inhibiting its degradation, and some studies show that p-coumaric acid can also interfere with bacterial growth [45,46]. However, CS had an asymptotic cumulative gas production (Table 3) intermediate to those of TH and PS, which was mainly due to the amount of NFC in the substrate (Table 1).
Asymptotic gas production in PS was lower than in the other forages (Table 3). There was possibly a greater use of substrates for microbial synthesis in this silage since this feedstuff is rich in pectin and its fermentation contributes to the formation of acetate, which translates into greater enteric gas production (CH4, mainly). The production of acetate (Figure 1A), which predominates in the fermentation of fiber carbohydrates, results in a net release of H2, favoring methanogenesis. Efficient removal of H2 is of paramount importance to increase the fermentation rate, eliminating the inhibitory effect of H2 on the microbial degradation of carbohydrates [6,47].
The cumulative volume of gas produced (mL/g DM) was greatest in the proportions with 90% concentrate (Figure 3B,D). This may be due to two factors. One is the higher crude protein content in these proportions, as the greater availability of crude protein in the diet allows for greater microbial activity as it is not a limiting factor. For [48,49], crude protein below 70 g/kg may restrict microbial activity due to the lack of nitrogen. The second factor that possibly contributed to the increasing cumulative gas volume in these proportions was the lower levels of undegradable fiber fraction (CC, unavailable aNDFom) and consequent greater availability of fermentable carbohydrates in the rumen. However, [18] mentioned that the effect of aNDFom fermentation becomes less important as its levels in proportions decrease due to the increase in NFC, resulting in the formation of propionate in the rumen [9,10,11]. This leads to a change in the cumulative gas production profile, with a greater rate of degradation that causes a fermentation peak (Figure 3B,D). The 50PS-50C combination produced more gas than the 90PS-10C and 10PS-90C proportions (Figure 1F). In this case, in addition to maximizing microbial synthesis, the amount of soluble carbohydrates in 50PS-50C made carbohydrates available for fermentation. On the other hand, the lower gas production in the 90PS-10C and 10PS-90C proportions was likely affected by the chemical composition of these substrates (lignin in 90PS-10C [50.02 g/kg], and NFC in 10PS-90C [562.27 g/kg]) (Table 1). Another fact that may explain the lower gas production in the combination with 90% concentrate (Figure 3F) was the greater production of propionate from the fermentation of starch, which resulted in less gas generated due to the absence of CO2 production [11]. Propionate is formed from a competitive pathway of H2 utilization in the rumen, since both pathways are electron accepting. In propionate formation, pyruvate is reduced to propionate in one of two multi-step pathways (succinate and/or acrylate), while in H2 formation, protons (H+) are reduced to H2. Therefore, increases in propionate formation are strongly associated with decreases in CH4 production [6,9,11,50].
Gas production rates peaked in the first hours of incubation, with the greatest values occurring in TH (above 2.0 mL/h). Nonetheless, this forage exhibited the lowest final rate (Figure 1C), unlike CS, whose initial gas production was less than 2 mL/h and turned into a final rate of 0.6 mL/h (Figure 3A). According to [51], this is because starch increases lag time, which suggests that the starch present in grains of CS does not reduce the digestibility of fiber, but reduces the fermentation rate, as illustrated in Figure 3A. As shown in Figure 3B,D,F, the gas production rates of the proportions involving 50% concentrate were greater than with 10% and 90% concentrate, except for the proportions with Tifton hay, in which the highest rate was observed with 90% concentrate. In this case, the addition of soluble carbohydrates (starch, mainly) provided more energy for the rumen microorganisms. In silages of corn and pineapple crop waste, on the other hand, this was probably due to the greater content of starch (CB1) and pectin (CB2), respectively.
Parameter c increased (p < 0.05) with the inclusion of concentrate in the proportions of all forages (Table 3). For [52], a non-sigmoidal shape indicates that the rate of gas production is continuously decreasing, whereas a sigmoidal shape denotes that the gas production rate first grows, then reaches its peak and declines thereafter, which may suggest a greater microbial activity during the early stages of incubation.
Gas production values at 24 h are commonly related to the metabolizable energy of the feed or feed proportions [53,54]. By analyzing the cumulative gas production at 24 h of the forages (100%), CS produced 37.45% (10.99/17.57 × 100) more gas than TH and 26.41% (12.93/17.57 × 100) more than PS (Table 4). For [19], this is due to the starch content present in grains of CS, which would probably reach maximum fermentation in the first hours of incubation, since the cell wall constituents (cellulose and hemicellulose) have a slower degradation. As can be seen in Table 4, increasing concentrate contents in the proportions induced an increase in gas production at 24 h. Despite not statistically significant, this behavior was observed for CS and TH, indicating that the inclusion of a soluble-carbohydrate source can improve fiber digestion. However, the reduction in gas volume in 24 h may have been due to the increased formation of propionate resulting from the great starch content of this material. The same response in gas volume seen at 24 h occurred at the incubation time of 48 h (Table 4).
The µ0.5 represents the time microorganisms take to utilize half of the substrate. In the present study, the increasing concentrate levels in the proportions (Table 4) induced a reduction in this variable due to the increased amount of nutrients available for microbial synthesis, and, consequently, larger gas volumes at 24 h and 48 h (Table 4). In the early stages of incubation, µ0.5 is likely to increase because the microbial population needs to multiply and colonize the substrate to form a “biofilm” [55,56]. The same behavior is observed for parameter K (time in which half of the substrate is degraded [h], Table 3). TH had a very high K value (117.54), with a µ0.5 rate of 41.88 mL/g DM/h, due to the greater aNDFom content (CB3 fraction) (Lanza et al. 2007).
For [57,58], VFA concentration in the rumen is affected by the forage source, and this is observed in the present study (Figure 1A–C). The VFA concentration varied between forage sources, e.g., when analyzing forages without the inclusion of concentrate (100-CS, 100-TH, and 100-PS), acetic acid showed a higher concentration in Tifton hay than in the silages. The propionic acid was higher in silages than in Tifton hay (Figure 1B). The availability of carbohydrates can explain this result. Tifton hay contains a high amount of potentially degradable fraction, represented by neutral detergent fiber (CB3). In comparison, silages have a high proportion of soluble carbohydrate fraction (CB1 [starch] and CB2 [pectin], respectively). However, high proportions of forage increased the concentration of acetic acid due to the high NDF digestibility (Figure 1A). The propionic acid concentration increased as concentrate inclusion increased, and acetic acid decreased (Figure 1B). According to [59], VFA directly affects ruminal pH. However, when evaluating the pH (Figure 1D), we did not observe any value below 6.4 because of the buffering capacity of sodium bicarbonate in the buffer solution, as reported by [60]. Regarding N-NH3, the inclusion of concentrate increased (p < 0.001) N-NH3 concentration in corn silage (Figure 1E), and the 10CS:90C ratio had a sharp increase. The addition of readily available carbohydrates (starch) in corn silage can produce varying effects on ruminal fermentation. The inclusion of starch sources in a diet can increase DM digestibility. However, it can negatively affect ruminal fermentation, such as a decrease in the total VFA concentration and an increase in the N-NH3 concentration [61], which was also observed in our study. The N-NH3 concentration is inversely related to carbohydrate availability [62,63]. However, for [63], fiber carbohydrate fermenting bacteria exclusively use ammonia as a nitrogen source (N). So, the increased growth of these bacteria may have contributed to the decrease in ammonia concentration in the silage of pineapple crop waste and Tifton hay (Figure 1E).
Studies on associative effects were based on the assumption that feeds behave similarly when evaluated alone or mixed [19,64,65]. Associative effects may be positive or negative and are known as effects of supplementation, which can be greater or lesser than expected from the content of individual feedstuffs [19]. In our study, we observed a negative associative effect (p = 0.003) in CS (100%) and CS with up to 30% concentrate (Table 4). This finding was likely due to the change in microbial activity (directly related to losses in fermentation efficiency), which affected the rate of gas production (Figure 1B) and caused µ0.5 to increase (Table 4); this was also described by [65]. For [17,66], amylolytic and cellulolytic bacteria compete for essential nutrients, especially nitrogen, and when there is an increase in the supply of starch in the rumen, amylolytic bacteria are favored over cellulolytic bacteria, as starch is fermented much more quickly than fibers. However, positive associative effects were identified in proportions with over 40% concentrate, as shown in Table 4. The inclusion of concentrates can improve the ruminal environment for cellulose degradation, especially when protein or a limiting nutrient is supplemented. Another aspect to be taken into account, as it may have benefits for rumen function, is the synchronization of the release and proportional balance between energy and nitrogen present in the rumen. If nitrogen utilization is deficient, there may be a reduction in carbohydrate digestibility, and if carbohydrate is insufficient, part of the degraded protein is lost as ammonia. In this way, the synchronization of nitrogen and energy release may become an important factor for the optimization of rumen function. These associative effects (p = 0.003) were present in the PS (Table 4), whereas in TH, these effects were non-significant (p = 0.659).
As also observed by [19], the associative effects (negative and positive) on gas production were more pronounced in the first 12 h of incubation and declined as incubation time increased (Figure 2). According to [19], in vitro measurements may be subject to some influences, e.g., starch, which can be fermented (almost in its entirety) in the first hours of incubation. However, in vivo, starch never disappears completely in the rumen, and its fermentation may have a relatively constant negative effect on the fermentation of the aNDFom content. After 24 h of incubation, the associative effects had a marked reduction in silages of corn and pineapple crop waste unlike in Tifton hay, which may be an indication of delayed fiber digestion.

5. Conclusions

In forages with low dry matter contents and great levels of soluble carbohydrates (starch (fractions CB1) and pectin (CB2)), i.e., silages of corn and pineapple crop waste, respectively, the concentration of acetic acid is reduced, and of propionic acid is increased, and consequently, gas production is lower. Nevertheless, gas production was the greatest for forage with high dry matter and potentially degradable fraction (aNDFom [fraction CB3]) contents, i.e., Tifton hay. The inclusion of concentrate did not affect gas production in corn and pineapple crop waste silages.
The associative effect on in vitro gas production was more pronounced in the first 12 h of incubation, but the extent of this effect varies according to the soluble carbohydrate content of the forage of the diet.

Author Contributions

Conceptualization: A.M.F., D.F.B. and T.S.O. Data curation: A.M.F., D.F.B. and T.S.O. Formal analysis: T.S.O. Investigation: D.F.B. and T.S.O. Methodology: D.F.B., M.G.C., I.N.S. and J.R.M.J. Project administration: T.S.O. Resources: T.S.O. Supervision: T.S.O. Writing-original draft: D.F.B. and T.S.O. Writing-review & editing: E.S.A., D.F.B. and T.S.O. All authors have read and agreed to the published version of the manuscript.

Funding

This research was supported by Fundação Carlos Chagas Filho de Amparo à Pesquisa do Estado do Rio de Janeiro—FAPERJ (RJ, Brazil), grant numbers E-26/010.100974/2018 and E-26/010.002458/2019 and Conselho Nacional de Desenvolvimento Científico e Tecnológico (CNPq).

Institutional Review Board Statement

The experiment was conducted following the approval of the Ethics Committee on Animal Use of the Universidade Estadual do Norte Fluminense–Darcy Ribeiro (no. 419/2017 protocol).

Informed Consent Statement

Not applicable.

Data Availability Statement

The data that support the findings of this study are available from the corresponding author upon reasonable request.

Conflicts of Interest

No potential conflict of interest were reported by the authors.

References

  1. Intergovernmental Panel on Climate Change (IPCC). Agriculture, forestry and other land use: Emissions from livestock and manure management. IPCC Guidel. Natl. Greenh. Gas Invent. 2006, 4, 10.1–10.87. [Google Scholar]
  2. Intergovernmental Panel on Climate Change (IPCC). The physical science basis. In Working Group I Contribution to the Fifth Assessment Report of the Intergovernmental Panel on Climate Change; Stocker, T.F., Qin, D., Plattner, G.K., Tignor, M.M.B., Allen, S.K., Boschung, J., Nauls, A., Xia, Y., Bex, V., Midgley, P.M., Eds.; Cambridge University Press: Cambridge, UK, 2013. [Google Scholar]
  3. Moss, A.R.; Jouany, J.P.; Newbold, J. Methane production by ruminantes: Its contribuiton to global warming. Ann. Zootech. 2000, 49, 231–253. [Google Scholar] [CrossRef]
  4. Knapp, J.R.; Laur, G.L.; Vadas, P.A.; Weiss, W.P.; Tricarico, J.M. Invited review: Enteric methane in dairy cattle production: Quantifying the opportunities and impact of reducing emissions. J. Dairy Sci. 2014, 97, 3231–3261. [Google Scholar] [CrossRef]
  5. Na, Y.; Li, D.H.; Choi, Y.; Kim, K.H.; Lee, S.R. Effects of feeding level on nutrient digestibility and enteric methane production in growing goats (Capra hircus hircus) and Sika deer (Cervus nippon hortulorum). Asian-Australas. J. Anim. Sci. 2018, 31, 1238–1243. [Google Scholar] [CrossRef] [PubMed]
  6. Janssen, P.H. Influence of hydrogen on rumen methane formation and fermentation balances through microbial growth kinetics and fermentation thermodynamics. Anim. Feed. Sci. Technol. 2010, 160, 1–22. [Google Scholar] [CrossRef]
  7. Jiao, H.P.; Dale, A.J.; Carson, A.F.; Murray, S.; Gordon, A.W.; Ferris, C.P. Effect of concentrate feed level on methane emissions from grazing dairy cows. J. Dairy Sci. 2014, 97, 7043–7053. [Google Scholar] [CrossRef]
  8. Schulman, M.D.; Valentino, D. Factors Influencing Rumen Fermentation: Effect of Hydrogen on Formation of Propionate. J. Dairy Sci. 1975, 59, 1444–1451. [Google Scholar] [CrossRef]
  9. Van Soest, P.J. Nutritional Ecology of the Ruminant, 2nd ed.; Cornell University Press: Ithaca, NY, USA, 1994; pp. 334–336. [Google Scholar] [CrossRef]
  10. Conrad, R. Contribution of hydrogen to methane production and control of hydrogen concentrations in methanogenic soils and sediments. FEMS Microbiol. Ecol. 1999, 28, 193–202. [Google Scholar] [CrossRef]
  11. Patra, A.K.; Park, T.; Kim, M.; Yu, Z. Rumen methanogens and mitigation of methane emission by anti-methanogenic compounds and substances. J. Anim. Sci. Biotechnol. 2017, 8, 13. [Google Scholar] [CrossRef]
  12. Kumar, S.; Choudhury, P.K.; Carro, M.D.; Griffith, G.W.; Dagar, S.S.; Puniya, M.; Calabro, S.; Ravella, S.R.; Dhewa, T.; Upadhyay, R.C.; et al. New aspects and strategies for methane mitigation from ruminants. Appl. Microbiol. Biotechnol. 2014, 98, 31–44. [Google Scholar] [CrossRef]
  13. DeVries, T.J.; Schwaiger, T.; Beauchemin, K.A.; Penner, G.B. Impact of severity of ruminal acidosis on feed-sorting behaviour of beef cattle. Anim. Prod. Sci. 2014, 54, 1238–1242. [Google Scholar] [CrossRef]
  14. Nagaraja, T.G.; Titgemeyer, E.C. Ruminal acidosis in beef cattle: The current microbiological and nutritional outlook. J. Dairy Sci. 2007, 90, E17–E38. [Google Scholar] [CrossRef] [PubMed]
  15. Yang, W.; Beauchemin, K. Physically Effective Fiber: Method of Determination and Effects on Chewing, Ruminal Acidosis, and Digestion by Dairy Cows. J. Dairy Sci. 2006, 89, 2618–2633. [Google Scholar] [CrossRef] [PubMed]
  16. Russell, J.; Sniffen, C.; Van Soest, P. Effect of Carbohydrate Limitation on Degradation and Utilization of Casein by Mixed Rumen Bacteria. J. Dairy Sci. 1983, 66, 763–775. [Google Scholar] [CrossRef] [PubMed]
  17. Dixon, R.M.; Stockdale, C.R. Associative effects between forages and grains: Consequences for feed utilisation. Aust. J. Agric. Res. 1999, 50, 757–774. [Google Scholar] [CrossRef]
  18. Getachew, G.; Robinson, P.; DePeters, E.; Taylor, S. Relationships between chemical composition, dry matter degradation and in vitro gas production of several ruminant feeds. Anim. Feed. Sci. Technol. 2004, 111, 57–71. [Google Scholar] [CrossRef]
  19. Robinson, P.; Getachew, G.; Cone, J. Evaluation of the extent of associative effects of two groups of four feeds using an in vitro gas production procedure. Anim. Feed. Sci. Technol. 2009, 150, 9–17. [Google Scholar] [CrossRef]
  20. Zhang, J.; Shi, H.; Wang, Y.; Li, S.; Cao, Z.; Ji, S.; He, Y.; Zhang, H. Effect of Dietary Forage to Concentrate Ratios on Dynamic Profile Changes and Interactions of Ruminal Microbiota and Metabolites in Holstein Heifers. Front. Microbiol. 2017, 8, 2206. [Google Scholar] [CrossRef]
  21. Sun, L.; Lee, M.; Jeon, S.; Seo, S. Evaluation of the Associative Effects of Rice Straw with Timothy Hay and Corn Grain Using an In Vitro Ruminal Gas Production Technique. Animals 2020, 10, 325. [Google Scholar] [CrossRef]
  22. Upadhyay, A.; Lama, J.P.; Tawata, S. Utilization of Pineapple Waste: A Review. J. Food Sci. Technol. Nepal 2010, 6, 10–18. [Google Scholar] [CrossRef]
  23. Ososanya, T.O.; Adewumi, M.K.; Jinadu, K.B. Impact of pineapple waste silage on intake, digestibility and fermentation patterns of West African Dwarf sheep. Afr. J. Biotechnol. 2014, 13, 2575–2581. [Google Scholar]
  24. Alvares, C.A.; Stape, J.L.; Sentelhas, P.C.; Moraes, G.J.L.; Sparovek, G. Köppen’s climate classification map for Brazil. Meteorol. Zeitsch 2013, 22, 711–728. [Google Scholar] [CrossRef] [PubMed]
  25. Yáñez-Ruiz, D.; Bannink, A.; Dijkstra, J.; Kebreab, E.; Morgavi, D.; O’kiely, P.; Reynolds, C.; Schwarm, A.; Shingfield, K.; Yu, Z.; et al. Design, implementation and interpretation of in vitro batch culture experiments to assess enteric methane mitigation in ruminants—A review. Anim. Feed. Sci. Technol. 2016, 216, 1–18. [Google Scholar] [CrossRef]
  26. McDougall, E.I. The composition and output of sheep’s saliva. Biochem. J. 1948, 43, 99–109. [Google Scholar] [CrossRef] [PubMed]
  27. Goering, H.K.; Van Soest, P.J. Forage fiber analysis (Apparatus Reagents, Procedures and Some Applications). In Agricultural Handbook No. 379; United States Department of Agriculture: Washington, DC, USA, 1970. [Google Scholar]
  28. Abreu, M.L.C.; Vieira, R.A.M.; Rocha, N.S.; Araujo, R.P.; Glória, L.S.; Fernandes, A.M.; de Lacerda, P.D.; Júnior, A.G. Clitoria ternatea L. as a Potential High Quality Forage Legume. Asian-Australas. J. Anim. Sci. 2014, 27, 169–178. [Google Scholar] [CrossRef] [PubMed]
  29. Fenner, H. Method for Determining Total Volatile Bases in Rumen Fluid by Steam Distillation. J. Dairy Sci. 1965, 48, 249–251. [Google Scholar] [CrossRef]
  30. Association of Official Analytical Chemistry (AOAC). Official Methods of Analysis, 21st ed.; Association of Official Analytical Chemistry: Gaithersburg, MD, USA, 2019. [Google Scholar]
  31. Thiex, N.J.; Anderson, S.; Gildemeister, B.; Adcock, W.; Boedigheimer, J.; Bogren, E.; Coffin, R.; Conway, K.; DeBaker, A.; Frankenius, E.; et al. Crude Fat, Hexanes Extraction, in Feed, Cereal Grain, and Forage (Randall/Soxtec/Submersion Method): Collaborative Study. J. AOAC Int. 2003, 86, 899–908. [Google Scholar] [CrossRef]
  32. Thiex, N.J.; Manson, H.; Anderson, S.; Persson, J.A. Determinantion of crude protein in animal feed, forage, grain, and oilseeds by using block digestion with a copper catalyst and steam distrillation into boric acid: Collaborative study. J. AOAC Int. 2002, 85, 309–317. [Google Scholar] [CrossRef]
  33. Mertens, D.R. Gravimetric determination of amylase-treated neutral detergent fiber in feeds with refluxing in beakers or crucibles: Collaborative study. J. AOAC Int. 2002, 85, 1217–1240. [Google Scholar]
  34. Silva, D.J.; Queiroz, A.C. Análise de Alimentos: Métodos Químicos e Biológicos, 3rd ed.; Editora UFV: Viçosa, Brazil, 2006. [Google Scholar]
  35. Brody, S. Bioenergetics and growth. In With Special Reference to the Efficiency Complex in Domestic Animals; Reinhold Publishing Co.: New York, NY, USA, 1945. [Google Scholar]
  36. López, S.; France, J.; Dhanoa, M.S.; Mould, F.; Dijkstra, J. Comparison of mathematical models to describe disappearance curves obtained using the polyester bag technique for incubating feeds in the rumen. J. Anim. Sci. 1999, 77, 1875–1888. [Google Scholar] [CrossRef]
  37. López, S.; France, J.; Gerrits, W.J.J.; Dhanoa, M.S.; Humphries, D.J.; Dijkstra, J. A generalized Michaelis-Menten equation for the analysis of growth. J. Anim. Sci. 2000, 78, 1816–1828. [Google Scholar] [CrossRef] [PubMed]
  38. Groot, J.C.; Cone, J.W.; Williams, B.A.; Debersaques, F.M.; Lantinga, E.A. Multiphasic analysis of gas production kinetics for in vitro fermentation of ruminant feeds. Anim. Feed. Sci. Technol. 1996, 64, 77–89. [Google Scholar] [CrossRef]
  39. Pinheiro, J.C.; Bates, D.M. Mixed-Effects Models in S and S-PLUS; Springer-Verlag Inc.: New York, NY, USA, 2000. [Google Scholar]
  40. Sugiura, N. Further Analysis of the Data by Akaike’s Information Criterion and the Finite Corrections. Commun. Stat. Theory Method 1978, 7, 13–26. [Google Scholar] [CrossRef]
  41. Burnham, K.P.; Anderson, D.R. Multimodel Inference: Understanding AIC and BIC in Model Selection. Sociol. Methods Res. 2004, 33, 261–304. [Google Scholar] [CrossRef]
  42. Gemeda, B.S.; Hassen, A. Methane production of two roughage and total mixed ration as influenced by cellulase and xylanase enzyme addition. Sci. Agricola 2015, 72, 11–19. [Google Scholar] [CrossRef]
  43. Wang, Y.; McAllister, T.A. Rumen Microbes, Enzymes and Feed Digestion—A Review. Asian-Australas. J. Anim. Sci. 2002, 15, 1659–1676. [Google Scholar] [CrossRef]
  44. Lanzas, C.; Sniffen, C.; Seo, S.; Tedeschi, L.; Fox, D. A revised CNCPS feed carbohydrate fractionation scheme for formulating rations for ruminants. Anim. Feed. Sci. Technol. 2007, 136, 167–190. [Google Scholar] [CrossRef]
  45. Hartley, R.D.; Akin, D.E. Effect of forage cell wall phenolic acids and derivatives on rumen microflora. J. Sci. Food Agric. 1989, 49, 405–411. [Google Scholar] [CrossRef]
  46. Martinez-Gonzalez, A.I.; Díaz-Sánchez, Á.G.; De La Rosa, L.A.; Vargas-Requena, C.L.; Bustos-Jaimes, I.; Alvarez-Parrilla, A.E. Polyphenolic Compounds and Digestive Enzymes: In Vitro Non-Covalent Interactions. Molecules 2017, 22, 669. [Google Scholar] [CrossRef]
  47. McAllister, T.A.; Newbold, C.J. Redirecting rumen fermentation to reduce methanogenesis. Aust. J. Exp. Agric. 2008, 48, 7–13. [Google Scholar] [CrossRef]
  48. Bach, A.; Calsamiglia, S.; Stern, M.D. Nitrogen Metabolism in the Rumen. J. Dairy Sci. 2005, 88, E9–E21. [Google Scholar] [CrossRef] [PubMed]
  49. Oliveira, T.S.; Lana, R.P.; Pereira, J.C.; Guimarães, G.; Faleiro Neto, J.A. Growth rate of mixed ruminal bacteria as a function of energetic substrate concentration in bath culture. Pesq. Agropec. Trop. 2011, 41, 39–43. [Google Scholar] [CrossRef]
  50. Ungerfeld, E.M. Shifts in metabolic hydrogen sinks in the methanogenesis-inhibited ruminal fermentation: A meta-analysis. Front. Microbiol. 2015, 6, 37. [Google Scholar] [CrossRef]
  51. Mertens, D.; Loften, J. The Effect of Starch on Forage Fiber Digestion Kinetics In Vitro. J. Dairy Sci. 1980, 63, 1437–1446. [Google Scholar] [CrossRef] [PubMed]
  52. Wang, M.; Tang, S.; Tan, Z. Modeling in vitro gas production kinetics: Derivation of Logistic–Exponential (LE) equations and comparison of models. Anim. Feed. Sci. Technol. 2011, 165, 137–150. [Google Scholar] [CrossRef]
  53. Menke, K.H.; Steingass, H. Estimation of the energetic feed value obtained from chemical analysis and in vitro gas production using rumen fluid. Anim. Res. Dev. 1988, 28, 7–55. [Google Scholar]
  54. Maccarana, L.; Cattani, M.; Tagliapietra, F.; Bailoni, L.; Schiavon, S. Influence of main dietary chemical constituents on the in vitro gas and methane production in diets for dairy cows. J. Anim. Sci. Biotechnol. 2016, 7, 54. [Google Scholar] [CrossRef]
  55. McAllister, T.A.; Bae, H.D.; Jones, G.A.; Cheng, K.-J. Microbial attachment and feed digestion in the rumen. J. Anim. Sci. 1994, 72, 3004–3018. [Google Scholar] [CrossRef]
  56. Leng, R.A. Unravelling methanogenesis in ruminants, horses and kangaroos: The links between gut anatomy, microbial biofilms and host immunity. Anim. Prod. Sci. 2018, 58, 1175. [Google Scholar] [CrossRef]
  57. Alstrup, L.; Søegaard, K.; Weisbjerg, M. Effects of maturity and harvest season of grass-clover silage and of forage-to-concentrate ratio on milk production of dairy cows. J. Dairy Sci. 2016, 99, 328–340. [Google Scholar] [CrossRef]
  58. Bharanidharan, R.; Arokiyaraj, S.; Kim, E.B.; Lee, C.H.; Woo, Y.W.; Na, Y.; Kim, D.; Kim, K.H. Ruminal methane emissions, metabolic, and microbial profile of Holstein steers fed forage and concentrate, separately or as a total mixed ration. PLoS ONE 2018, 13, e0202446. [Google Scholar] [CrossRef] [PubMed]
  59. Penner, G.; Taniguchi, M.; Guan, L.; Beauchemin, K.; Oba, M. Effect of dietary forage to concentrate ratio on volatile fatty acid absorption and the expression of genes related to volatile fatty acid absorption and metabolism in ruminal tissue. J. Dairy Sci. 2009, 92, 2767–2781. [Google Scholar] [CrossRef] [PubMed]
  60. Kohn, R.A.; Dunlap, T.F. Calculation of the buffering capacity of bicarbonate in the rumen and in vitro. J. Anim. Sci. 1998, 76, 1702–1709. [Google Scholar] [CrossRef]
  61. Heldt, J.S.; Cochran, R.C.; Stokka, G.L.; Farmer, C.G.; Mathis, C.P.; Titgemeyer, E.C.; Nagaraja, T.G. Effects of different supplemental sugars and starch fed in combination with degradable intake protein on low-quality forage use by beef steers. J. Anim. Sci. 1999, 77, 2793–2802. [Google Scholar] [CrossRef]
  62. Heldt, J.S.; Cochran, R.C.; Mathis, C.P.; Woods, B.C.; Olson, K.C.; Titgemeyer, E.C.; Nagaraja, T.G.; Vanzant, E.S.; Johnson, D.E. Effects of level and source of carbohydrate and level of degradable intake protein on intake and digestion of low-quality tallgrass-prairie hay by beef steers. J. Anim. Sci. 1999, 77, 2846–2854. [Google Scholar] [CrossRef] [PubMed]
  63. Russell, J.B.; O’Connor, J.D.; Fox, D.G.; Van Soest, P.J.; Sniffen, C.J. A net carbohydrate and protein system for evaluating cattle diets: I. Ruminal fermentation. J. Anim. Sci. 1992, 70, 3551–3561. [Google Scholar] [CrossRef]
  64. National Research Council (NRC). Nutrient Requirements of Dairy Cattle, 7th ed.; National Academic Press: Washington, DC, USA, 2001.
  65. Sandoval-Castro, C.; Capetillo-Leal, C.; Cetina-Góngora, R.; Ramirez-Avilés, L. A mixture simplex design to study associative effects with an in vitro gas production technique. Anim. Feed. Sci. Technol. 2002, 101, 191–200. [Google Scholar] [CrossRef]
  66. Firkins, J. Invited Review: Advances in rumen efficiency. Appl. Anim. Sci. 2021, 37, 388–403. [Google Scholar] [CrossRef]
Figure 1. Volatile fatty acids, pH, and ammonia nitrogen of corn silage, Tifton hay, and pineapple crop waste silage incubated as single forage and in combinations with concentrate. 100F = 100% forage; 90F-10C = 90% forage and 10% concentrate; 50F:50C = 50% forage and 50% concentrate; and 10F-90C 10% forage and 90% concentrate. Panel (A) Acetic acid; (B) Propionic acid; (C) Butyric acid; (D) pH; (E) Ammoniacal nitrogen.
Methane 02 00023 g001
Figure 2. Associative effects of corn silage (A), Tifton hay (B), and pineapple crop waste silage (C) incubated as single forages and in combinations with concentrate. The associative effects between forages and proportions on gas production were evaluated using percentage differences between the observed and calculated values D i f f e r e n c e % = [ O b s e r v e d v a l u e C a l c u l a t e d v a l u e C a l c u l a t e d v a l u e ] × 100 .
Methane 02 00023 g002
Figure 3. Profiles of cumulative gas production and gas production rates of corn silage, Tifton hay, and pineapple crop waste silage incubated as single forages and in combinations with concentrate. Panel (A) corresponds to 100% corn silage (▲) and 100% concentrate (■) and predicted (solid and dashed lines); (B) corresponds to 10:90 (■); corresponds to 50:50 (●), and 90:10 corn silage: concentrate (▲) and predicted (solid and dashed lines); (C) corresponds to 100% Tifton hay (▲) and 100% concentrate (■) and predicted (solid and dashed lines); (D) corresponds to 10:90 (■); corresponds to 50:50 (●), and 90:10 Tifton hay: concentrate (▲) and predicted (solid and dashed lines); (E) corresponds to 100% pineapple crop waste silage (▲) and 100% concentrate (■) and predicted (solid and dashed lines); (F) corresponds to 10:90 (■); corresponds to 50:50 (●), and 90:10 pineapple crop waste silage: concentrate (▲) and predicted (solid and dashed lines).
Methane 02 00023 g003
Table 1. Chemical composition of the forages and their combinations used in the study.
SubstrateDMAshCPCFNDFADFLIGNFCLIG/NDF
Corn silage (CS)
100-CS301.744.8179.1814.76411.59250.2128.93449.667.029
90CS-10C365.3944.7795.2233.41378.64230.0926.46447.966.987
80CS-20C429.0842.33107.1521.72360.57223.3325.35468.247.03
70CS-30C492.7735.45123.0439.33317.69196.9722.91484.487.213
60CS-40C556.4539.22146.9528.83279.84175.7621.86505.157.813
50CS-50C620.1435.22160.3623.41255.36156.818.82525.657.37
40CS-60C683.8335.86191.6132.09210.23138.4915.41530.217.328
30CS-70C747.5137.19189.1824.17187.96120.1717.56561.499.341
20CS-80C811.232.42226.0831.76154.7796.7416.61554.9710.729
10CS-90C874.8933.99222.6828.32106.8666.776.44608.146.027
SEM57.8471.33815.7672.09630.44618.21.96415.7280.407
Tifton hay (TH)
100-TH867.466.5948.0115.09777.85417.5552.0592.456.691
90TH-10C874.5262.6655.4413.41730.69379.650.72137.796.941
80TH-20C881.6357.6885.6315.43634.96334.1541.38206.36.517
70TH-30C888.7557.48102.7723.94555.13300.2437.58260.686.77
60TH- 40C895.8755.67137.6422.38504.33248.9630.74279.986.096
50TH-50C902.9950.42166.1315.79431.9235.729.1335.766.737
40TH-60C910.1140.41177.514.13354.68202.9324413.276.767
30TH-70C917.2240.78195.5924.45266.55171.4920.42472.627.659
20TH-80C924.3437.16202.1528.88231.16130.5414.33500.656.199
10TH-90C931.4636.59224.2725.59155.9286.168.35557.635.354
SEM6.4653.319191.70864.02232.2754.40347.3330.181
Pineapple silage (PS) 1
100-PS191.4562.6389.0145.65595.13381.0156.56207.579.505
90PS-10C266.1756.07105.233.05502.25334.1150.02303.439.959
80PS-20C340.8850.4211247471.17310.6443.68319.49.27
70PS-30C415.5947.19123.7749.13411.53290.0441.72368.3810.138
60PS-40C490.345.7161.2243.71345.93248.5738.57403.4411.149
50PS-50C565.0143.11163.5632.29355.23213.0626.72405.817.522
40PS-60C639.7343.42177.1835.06283.7180.6121.63460.647.624
30PS-70C714.4440.79200.234.62229.59138.9921.18494.799.225
20PS-80C789.1538.42214.3333.4190.34109.7914.2523.517.461
10PS-90C863.8637.75227.3529143.6481.929.37562.276.524
SEM67.8612.37414.4922.17843.43630.2444.77732.8480.442
100-Concentrate (C)938.5831.71242.3430.8295.0150.375.3600.115.67
Soybean meal869.0466.38485.6418.86122.5147.425.86306.624.78
Ground corn856.311.0184.9331.5477.324.128.16795.2310.562
SEM20.87713.18895.1673.35610.7396.7770.716115.9411.468
1 Pineapple crop waste silage; SEM = standard error of the mean; DM = Dry matter; CP = Crude protein; CF = Crude fat; NDF = Neutral detergent fiber; ADF = Acid detergent fiber; LIG = Lignin; NFC = Non-fiber carbohydrates; and LIG/NDF = Amount of lignin in the fiber organic matter, all expressed as g/kg, except for DM expressed as g/kg as-fed.
Table 2. Likelihood of the models fitted to gas production kinetic parameters.
ModelAICcΔrWrERr
Brody, Hom. var.403.43191.612.4 × 10−424.1 × 1041
Brody, corCar1218.776.960.0332.4
Gompertz, Hom. var.478.36266.551.3 × 10−587.6 × 1057
Gompertz, corCar1268.9357.123.8 × 10−132.5 × 10¹²
Logistic, Hom. var.300.1388.326.4 × 10−201.5 × 10¹⁹
Logistic, corCar1223.3511.533.0 × 10−03318.9
Michaelis-Menten, Hom. var.372.13160.321.5 × 10−356.5 × 1034
Michaelis-Menten, corCar1211.820.00.971.0
Hom. var. = homogeneous residual variances; corCar1 = Autoregressive variance; AICc = corrected Akaike information criterion of model r; Δr = difference between AICc and the minimum AICc in the set of all models tested; Wr = likelihood probability of model r; ERr = evidence ratio against model r.
Table 3. Confidence intervals (95% CI) for gas production kinetic parameters of corn silage, Tifton hay, and pineapple crop waste silage incubated as single forage and combined with concentrate.
SubstrateALowerUppercLowerUpperKLowerUpper
Corn silage (CS)
100-CS32.8129.0136.610.95 j0.871.0320.67 a17.2224.12
90CS-10C25.1721.5928.751.00 i0.911.1016.15 b13.4318.87
80CS-20C31.0927.5734.621.07 h0.991.1515.18 c13.3617.00
70CS-30C28.4925.0131.971.13 f1.041.2214.75 d13.0216.49
60CS-40C30.8527.3734.331.10 g1.021.1813.67 e12.1515.19
50CS-50C30.5427.1033.971.17 e1.091.2512.72 f11.4613.97
40CS-60C30.1726.7433.591.18 d1.091.2612.29 g11.0913.50
30CS-70C30.8027.4034.201.24 c1.161.3312.00 gh10.9513.05
20CS-80C31.5728.1734.961.28 b1.191.3712.09 g11.1113.08
10CS-90C30.8627.4934.231.40 a1.301.4911.74 h10.8912.59
p-value0.059 <0.001 <0.001
Tifton hay (TH)
100-TH45.10 a31.1259.070.71 j0.610.81117.54 a22.59212.49
90TH-10C30.24 bc25.4635.020.85 i0.750.9534.73 b23.5845.87
80TH-20C25.23 d21.5428.931.01 g0.901.1219.91 d16.1823.65
70TH-30C27.36 bcd23.6431.091.00 h0.901.1020.35 c16.7124.00
60TH-40C25.98 cd22.4429.521.05 d0.961.1515.49 f13.1917.79
50TH-50C26.17 bcd22.5829.761.04 f0.941.1416.97 e14.2919.65
40TH-60C28.82 bcd25.3132.341.05 e0.971.1414.22 g12.3616.07
30TH-70C30.09 bc26.6333.551.13 c1.051.2213.40 h11.9614.84
20TH-80C30.44 bc26.9933.891.14 b1.061.2313.31 i11.9214.69
10TH-90C30.69 b27.2834.101.24 a1.161.3312.61 j11.5013.72
p-value<0.001 <0.001 <0.001
Pineapple silage (PS) 1
100-PS24.5920.7528.430.94 j0.841.0521.52 a16.5426.49
90PS-10C26.1422.4029.880.96 i0.861.0619.38 b15.5323.23
80PS-20C27.1223.4830.751.00 h0.911.1017.68 c14.7220.64
70PS-30C27.2623.7130.801.05 g0.961.1515.77 d13.5118.04
60PS-40C24.7521.2628.231.06 f0.961.1513.19 ef11.2715.12
50PS-50C27.9224.4631.381.12 d1.031.2113.42 e11.8414.99
40PS-60C29.0925.6332.541.12 e1.031.2012.99 f11.5314.46
30PS-70C28.5925.1931.991.22 c1.131.3111.61 g10.4912.73
20PS-80C29.5126.1232.911.24 b1.151.3311.62 g10.5612.67
10PS-90C20.4517.1023.801.31 a1.201.4210.71 h9.6211.79
p-value0.464 <0.001 <0.001
100-Concentrate (C)28.9225.5532.301.35 a1.251.4411.94 b10.9712.92
Soybean meal24.9721.5528.391.09 c1.001.1810.17 c8.8611.49
Ground corn31.0427.6434.431.41 b1.301.5115.34 a14.2016.48
p-value0.089 <0.001 <0.001
1 Pineapple crop waste silage; A : asymptotic volume of gas produced (mL/g incubated DM), c : constant that determines the curve sharpness, K : time in which half of the substrate is degraded (h), PS: Pineapple crop waste silage. Means followed by different letters are significantly different at p < 0.05.
Table 4. Gas production kinetics of corn silage, Tifton hay, and pineapple crop waste silage incubated as single forage and in combinations with concentrate.
SubstrateV24V48µ0.5 (/h)AF (%)
Corn silage (CS)
100-CS17.57 ± 0.83 bc9.83 ± 2.47 bc9.83 ± 2.47 a−0.7 ± 0.37 b
90CS-10C15.05 ± 1.35 c8.09 ± 2.13 c8.09 ± 2.13 c−2.17 ± 1.42 b
80CS-20C19.29 ± 1.52 abc8.13 ± 1.60 abc8.13 ± 1.60 bc−0.25 ± 0.45 b
70CS-30C18.06 ± 1.63 abc8.32 ± 1.66 abc8.32 ± 1.66 b−1.76 ± 0.22 b
60CS-40C20.04 ± 1.72 abc7.51 ± 1.39 abc7.51 ± 1.39 e0.23 ± 0.55 b
50CS-50C20.69 ± 1.91 ab7.44 ± 1.27 ab7.44 ± 1.27 e1.58 ± 1.03 b
40CS-60C20.73 ± 1.97 ab7.23 ± 1.23 ab7.23 ± 1.23 f1.84 ± 1.18 ab
30CS-70C21.65 ± 2.07 ab7.46 ± 1.17 ab7.46 ± 1.17 e3.29 ± 3.15 ab
20CS-80C22.29 ± 2.1 a7.74 ± 1.15 a7.74 ± 1.15 d5.11 ± 8.33 ab
10CS-90C22.56 ± 2.25 a8.21 ± 1.15 a8.21 ± 1.15 bc9.89 ± 1.35 a
p-value<0.001<0.001<0.0010.003
Tifton hay (TH)
100-TH10.99 ± 3.63 f15.59 ± 2.75 d41.88 ± 39.67 a0.17 ± 3.75
90TH-10C12.75 ± 0.27 ef17.20 ± 0.91 cd14.83 ± 6.48 b1.24 ± 0.89
80TH-20C13.8 ± 0.96 def17.89 ± 2.12 cd10.07 ± 2.96 c2.79 ± 2.14
70TH-30C14.81 ± 0.91 de19.21 ± 2.07 bc10.18 ± 2.83 c1.99 ± 0.76
60TH-40C15.94 ± 1.46 cd19.93 ± 2.49 bc8.16 ± 1.97 e2.17 ± 1.22
50TH-50C15.42 ± 1.29 cd19.54 ± 2.37 bc8.81 ± 2.23 d2.31 ± 2.13
40TH-60C18.28 ± 1.60 bc22.55 ± 2.58 ab7.47 ± 1.58 g0.67 ± 0.31
30TH-70C19.83 ± 1.79 ab24.35 ± 2.73 a7.59 ± 1.38 g2.23 ± 1.73
20TH-80C20.17 ± 1.81 ab24.74 ± 2.75 a7.61 ± 1.38 g2.15 ± 1.02
10TH-90C21.18 ± 2.0 a25.8 ± 2.89 a7.84 ± 1.25 f4.84 ± 2.15
p-value<0.001<0.001<0.0010.659
Pineapple silage (PS) 1
100-PS12.93 ± 0.7516.74 ± 1.9010.16 ± 3.50 a0.44 ± 0.91 b
90PS-10C14.41 ± 0.9618.42 ± 2.089.30 ± 2.80 b0.31 ± 20.55 b
80PS-20C15.62 ± 1.1719.83 ± 2.268.86 ± 2.32 c0.77 ± 1.19 b
70PS-30C17.8 ± 1.7121.71 ± 2.698.30 ± 1.92 d9.54 ± 4.81 b
60PS-40C16.16 ± 1.7319.72 ± 2.656.97 ± 1.65 h1.47 ± 0.56 b
50PS-50C18.37 ± 1.7822.54 ± 2.727.54 ± 1.49 e1.88 ± 1.03 b
40PS-60C19.35 ± 1.8223.61 ± 2.747.27 ± 1.38 f2.08 ± 1.17 b
30PS-70C20.25 ± 2.1024.19 ± 2.937.08 ± 1.21 gh3.54 ± 2.28 b
20PS-80C20.99 ± 2.1225.19 ± 2.957.22 ± 1.17 fg3.96 ± 2.33 b
10PS-90C15.17 ± 2.3117.93 ± 3.017.00 ± 1.30 h57.29 ± 20.97 a
p-value0.1330.279<0.0010.003
100-concentrate (C)20.8 ± 2.1825.07 ± 3.018.04 ± 1.24 b
Soybean meal17.93 ± 2.1321.08 ± 2.885.54 ± 1.17 c
Ground corn20.24 ± 1.8025.84 ± 2.8810.78 ± 1.57 a
p-value0.0750.073<0.001
1 Pineapple crop waste silage; V24 and V48: gas production at 24 and 48 h, respectively (mL/g incubated DM); µ0.5: fractional rate of gas production at half-life ( c / 2 K )   expressed in (/h); AF: associative effects (%). Means followed by different letters are significantly different at p < 0.05.
Disclaimer/Publisher’s Note: The statements, opinions and data contained in all publications are solely those of the individual author(s) and contributor(s) and not of MDPI and/or the editor(s). MDPI and/or the editor(s) disclaim responsibility for any injury to people or property resulting from any ideas, methods, instructions or products referred to in the content.

