Article

The Role of Plant-Forward Eating in Modulating the Association of Micronutrients with Blood Pressure and Body Composition


1
Department of Sport Science, German University of Health & Sport (DHGS), 85737 Ismaning, Germany
2
Division of Sport, Physical Activity and Health, University of Education Upper Austria, Kaplanhofstraße 40, 4020 Linz, Austria
3
Department of Sport Science, University of Innsbruck, 6020 Innsbruck, Austria
4
Biogena, Strubergasse 24, 5020 Salzburg, Austria
5
Department of Pediatric Oncology and Hematology, Otto-Heubner Centre for Paediatric and Adolescent Medicine (OHC), Charité—Universitätsmedizin Berlin, Augustenburger Platz 1, 13353 Berlin, Germany
6
Charité Competence Center for Traditional and Integrative Medicine (CCCTIM), Charité—Universitätsmedizin Berlin, Augustenburger Platz 1, 13353 Berlin, Germany
7
Department of Secondary Education, University College of Teacher Education Tyrol, Pastorstraße 7, 6010 Innsbruck, Austria
*
Author to whom correspondence should be addressed.
Dietetics 2026, 5(2), 28; https://doi.org/10.3390/dietetics5020028
Submission received: 29 January 2026 / Revised: 28 March 2026 / Accepted: 29 April 2026 / Published: 2 May 2026

Abstract

Micronutrient status is strongly influenced by dietary patterns; however, the extent to which plant-forward dietary patterns versus omnivorous diets shape micronutrient profiles and their associations with blood pressure, body composition, and cardiovascular health remains unclear. This cross-sectional study aimed to comprehensively assess associations between blood micronutrient profiles, blood pressure, and body composition in adults, with analyses stratified by dietary patterns to compare omnivorous and plant-forward dieters. Secondary cross-sectional analyses were conducted using data from an exploratory study of 488 Austrian adults (median age: 38 y [IQR 21]; 48% female, 52% male). Participants were classified as omnivores (n = 260) or plant-forward dieters (including 194 flexitarians, 25 vegetarians, and 9 vegans; n = 228). Blood pressure and anthropometric measurements were obtained alongside fasting venous blood sample analysis to quantify a comprehensive panel of micronutrient, hematological, lipid, and inflammatory biomarkers. Micronutrient concentrations were standardized (scaled −1 to +1, truncated ±3) and evaluated for deficiency or excess according to sex-specific reference ranges. Linear regression was used to analyze the association of micronutrients with BMI, including age and sex as covariates. Vitamin D showed the highest micronutrient deficiency, observed in 96% of omnivores and 93% of plant-forward dieters. Across both dietary subgroups, multiple micronutrients, together with age and sex, were significant correlates of body weight, body mass index, and blood pressure (p < 0.05). Significant differences between omnivores and plant-forward dieters were observed for blood pressure, lipid, hematological, and inflammatory markers, with participants adhering to plant-forward dietary habits exhibiting lower blood pressure and more favorable lipid profiles (p < 0.05). The findings highlight the potential of diet-type-specific strategies for personalized cardiometabolic risk management.

1. Introduction

According to the World Health Organization, non-communicable diseases (NCDs), including cardiovascular, metabolic, oncologic, musculoskeletal, and mental health disorders, remain leading causes of global morbidity and premature mortality [1]. It has been well-established that lifestyle-related factors, particularly dietary patterns, play a pivotal role in shaping the onset, progression, and management of these conditions [1,2]. Among NCDs, cardiovascular disease (CVD) stands out as the most prevalent and pressing public health challenge worldwide [3,4]. In Austria, for instance, CVD remains the leading cause of death, accounting for 34% of all fatalities in 2023 [5]. Its burden is driven by modifiable behaviors such as poor diet, physical inactivity, tobacco use, and alcohol consumption, alongside metabolic mediators including dyslipidemia, diabetes, hypertension, and obesity [6,7]. These findings highlight the urgent need for preventive strategies at the population level, complemented by tailored secondary prevention approaches, to effectively reduce the impact of CVD and related NCDs.
Over recent decades, dietary patterns and related dietary risks have emerged as a central determinant of health outcomes, with growing interest in plant-based diets such as vegan (no consumption of any foods from animal origin) and vegetarian diets (includes milk and dairy, eggs, fish/shellfish and seafood, but no consumption of meat and processed meat) [8,9,10,11,12], as well as flexitarian dietary approaches, i.e., dietary patterns which are generally based on a vegetarian-type pattern, with a focus on reducing the consumption of meat and processed meat, fish/shellfish and seafood [10,13,14,15,16,17,18,19,20]. More specifically, the definition of flexitarian is summarized as eating at minimum one food item of animal origin (e.g., meat/processed meat inclusive fish, dairy, eggs) at least once a month, but less than once in a week [20]. Accordingly, the socio-culturally and colloquially accepted term “plant-forward” is used here as an umbrella category encompassing flexitarians, vegetarians, and vegans, since these diets share are associated with improved health, which is the main reason for consumers adopting more plant-oriented and sustainable dietary patterns and or at least ranked among the top 3 motives [10,11,12,20,21,22]. This inclusive approach allows for the investigation of a continuum of eating behaviors emphasizing plant foods, thereby reflecting real-world dietary behaviors among individuals seeking to optimize their eating habits while maintaining flexibility across dietary patterns, without limiting themselves to a specific, clearly defined diet type. Although these subgroups differ substantially in specific nutrient exposures, they share a common emphasis on plant-derived foods and reduced intakes from animal protein and fat, providing a rationale for their combined analysis while acknowledging potential intra-group variability. Compared to traditional omnivorous diets, it consequently refers to a dietary pattern centered on and thus rich in vegetables, fruits, legumes, whole grains, nuts, and seeds, while also including eggs, milk/dairy, with rather a limited intake of meat, processed meat, fish/shellfish and seafood with occasional consumption.
The plant-forward dietary approaches have been associated with favorable health outcomes, including lower blood pressure (BP), improved lipid profiles, and healthier body composition [23,24,25]. Particularly, vegan and vegetarian diets often provide higher intakes of fiber, antioxidants, and phytochemicals, while reducing saturated fat and cholesterol exposure, thereby supporting cardiovascular and metabolic health [24,26]. However, at the population level, the exclusion or reduction in animal-derived foods may also influence the availability and bioavailability of specific micronutrients [27,28], potentially altering circulating levels of vitamins and minerals relevant to cardiovascular and metabolic regulation. Comparative evaluation of plant-based and omnivorous dietary patterns represents a critical step toward identifying nutritional profiles that support optimal cardiovascular and metabolic health while minimizing the risk of micronutrient inadequacy [10,22,29,30].
Micronutrients (vitamins and trace minerals) are vital for a wide range of biological processes that underpin metabolic regulation, genomic stability, endocrine signaling, antioxidant capacity, immune competence, and neuronal function [31,32]. Measurement of circulating micronutrient concentrations is commonly used in clinical and research settings as an indicator of nutritional status and as a tool for identifying chronic disease risk [32,33]. Deviations from optimal micronutrient levels, particularly deficiencies, have been linked to numerous adverse health outcomes [32,34]. Reduced concentrations of minerals such as magnesium, zinc, calcium, selenium, and potassium have been associated with elevated cardiovascular risk [35,36,37], while inadequate vitamin D status has been shown to be associated with obesity and metabolic dysregulation [38,39], both of which are established contributors to cardiometabolic disease. Beyond micronutrients, additional blood-derived markers, including lipid parameters, provide critical insight into cardiovascular risk and mortality [40]. In parallel, BP represents a key physiological marker reflecting vascular function and hemodynamic regulation, with sustained elevations strongly associated with cardiovascular morbidity and mortality [41]. Body composition, including body weight (BW) and body mass index (BMI), further constitutes a fundamental determinant of health, influencing metabolic efficiency, inflammatory status, insulin sensitivity, and cardiovascular function [42,43]. Accordingly, an integrated evaluation of micronutrient status, lipid profiles, BP, and body composition provides a more comprehensive understanding of cardiometabolic health, facilitates earlier identification of physiological dysregulation, and supports the development of targeted strategies aimed at reducing long-term disease burden and all-cause mortality [44,45].
Despite growing interest in this area, existing research remains fragmented, with most studies addressing isolated micronutrients [45,46,47,48,49], dietary intake patterns [50,51,52], or supplementation [53,54,55,56] rather than examining multiple biomarkers simultaneously. Moreover, limited studies have examined how comprehensive micronutrient profiles relate to cardiometabolic outcomes [50,51], or how these associations differ across dietary patterns such as omnivorous versus plant-based diets [27,57]. Hence, data examining dietary patterns as a potential influencing factor remain scarce, thereby limiting insight into how dietary patterns, particularly plant-forward eating habits, influence the associations between micronutrient profiles and cardiometabolic risk indicators. The present study aimed to provide a comprehensive assessment of health-related biomarkers relevant to cardiovascular and metabolic function, emphasizing the interrelationships among blood micronutrient concentrations, BP, and body composition. Analyses were stratified by dietary patterns to capture potential differences in how plant-forward versus omnivorous dietary patterns modulate these associations. It was hypothesized that the strength and direction of these relationships vary across dietary subgroups, reflecting underlying biological and metabolic differences. Specifically, it was hypothesized that omnivores would exhibit higher circulating concentrations of vitamin B12, iron, and zinc, whereas plant-forward dieters would have comparable or higher levels of calcium, vitamin D, magnesium, and potassium. Consequently, it was further hypothesized that these micronutrient differences would relate to more favorable BP and body composition outcomes among plant-forward dieters. Understanding these variations may inform more targeted and individualized dietary recommendations for cardiometabolic health.

2. Methods

2.1. Research Design

The present study is based on a secondary analyses of anonymized data derived from an exploratory investigation with a cross-sectional structure. The original study was of exploratory nature and conducted in 2021, with adult participants voluntarily answering a web-based survey on health-related and psychosocial factors based on self-report. The project was registered in the International Standard Randomized Controlled Trial Number repository under the identifier ISRCTN12444421. Data collection was carried out using a structured web-based survey developed on the Medistat GmbH digital infrastructure (Krummwisch, Germany). Access to the questionnaire was available during the period from March to April 2021. The current evaluation, performed between April 2023 and December 2025, retrospectively examines the anonymized dataset with the aim of hypothesis development. All study procedures adhered to established ethical norms, principles of responsible research execution, and internationally recognized standards, including Good Clinical Practice and the Declaration of Helsinki.

2.2. Participant Recruitment

Recruitment targeted adults residing in Austria who were at least 20 years of age and who were approached through licensed general practitioners during routine clinical encounters. Prior to participation, individuals received detailed information regarding the objectives, procedures, and scope of the assessment, including assurances that all records would be processed in a fully de-identified manner and handled in accordance with applicable data protection legislation. Participation required written consent, and individuals retained the unrestricted right to discontinue involvement without justification.
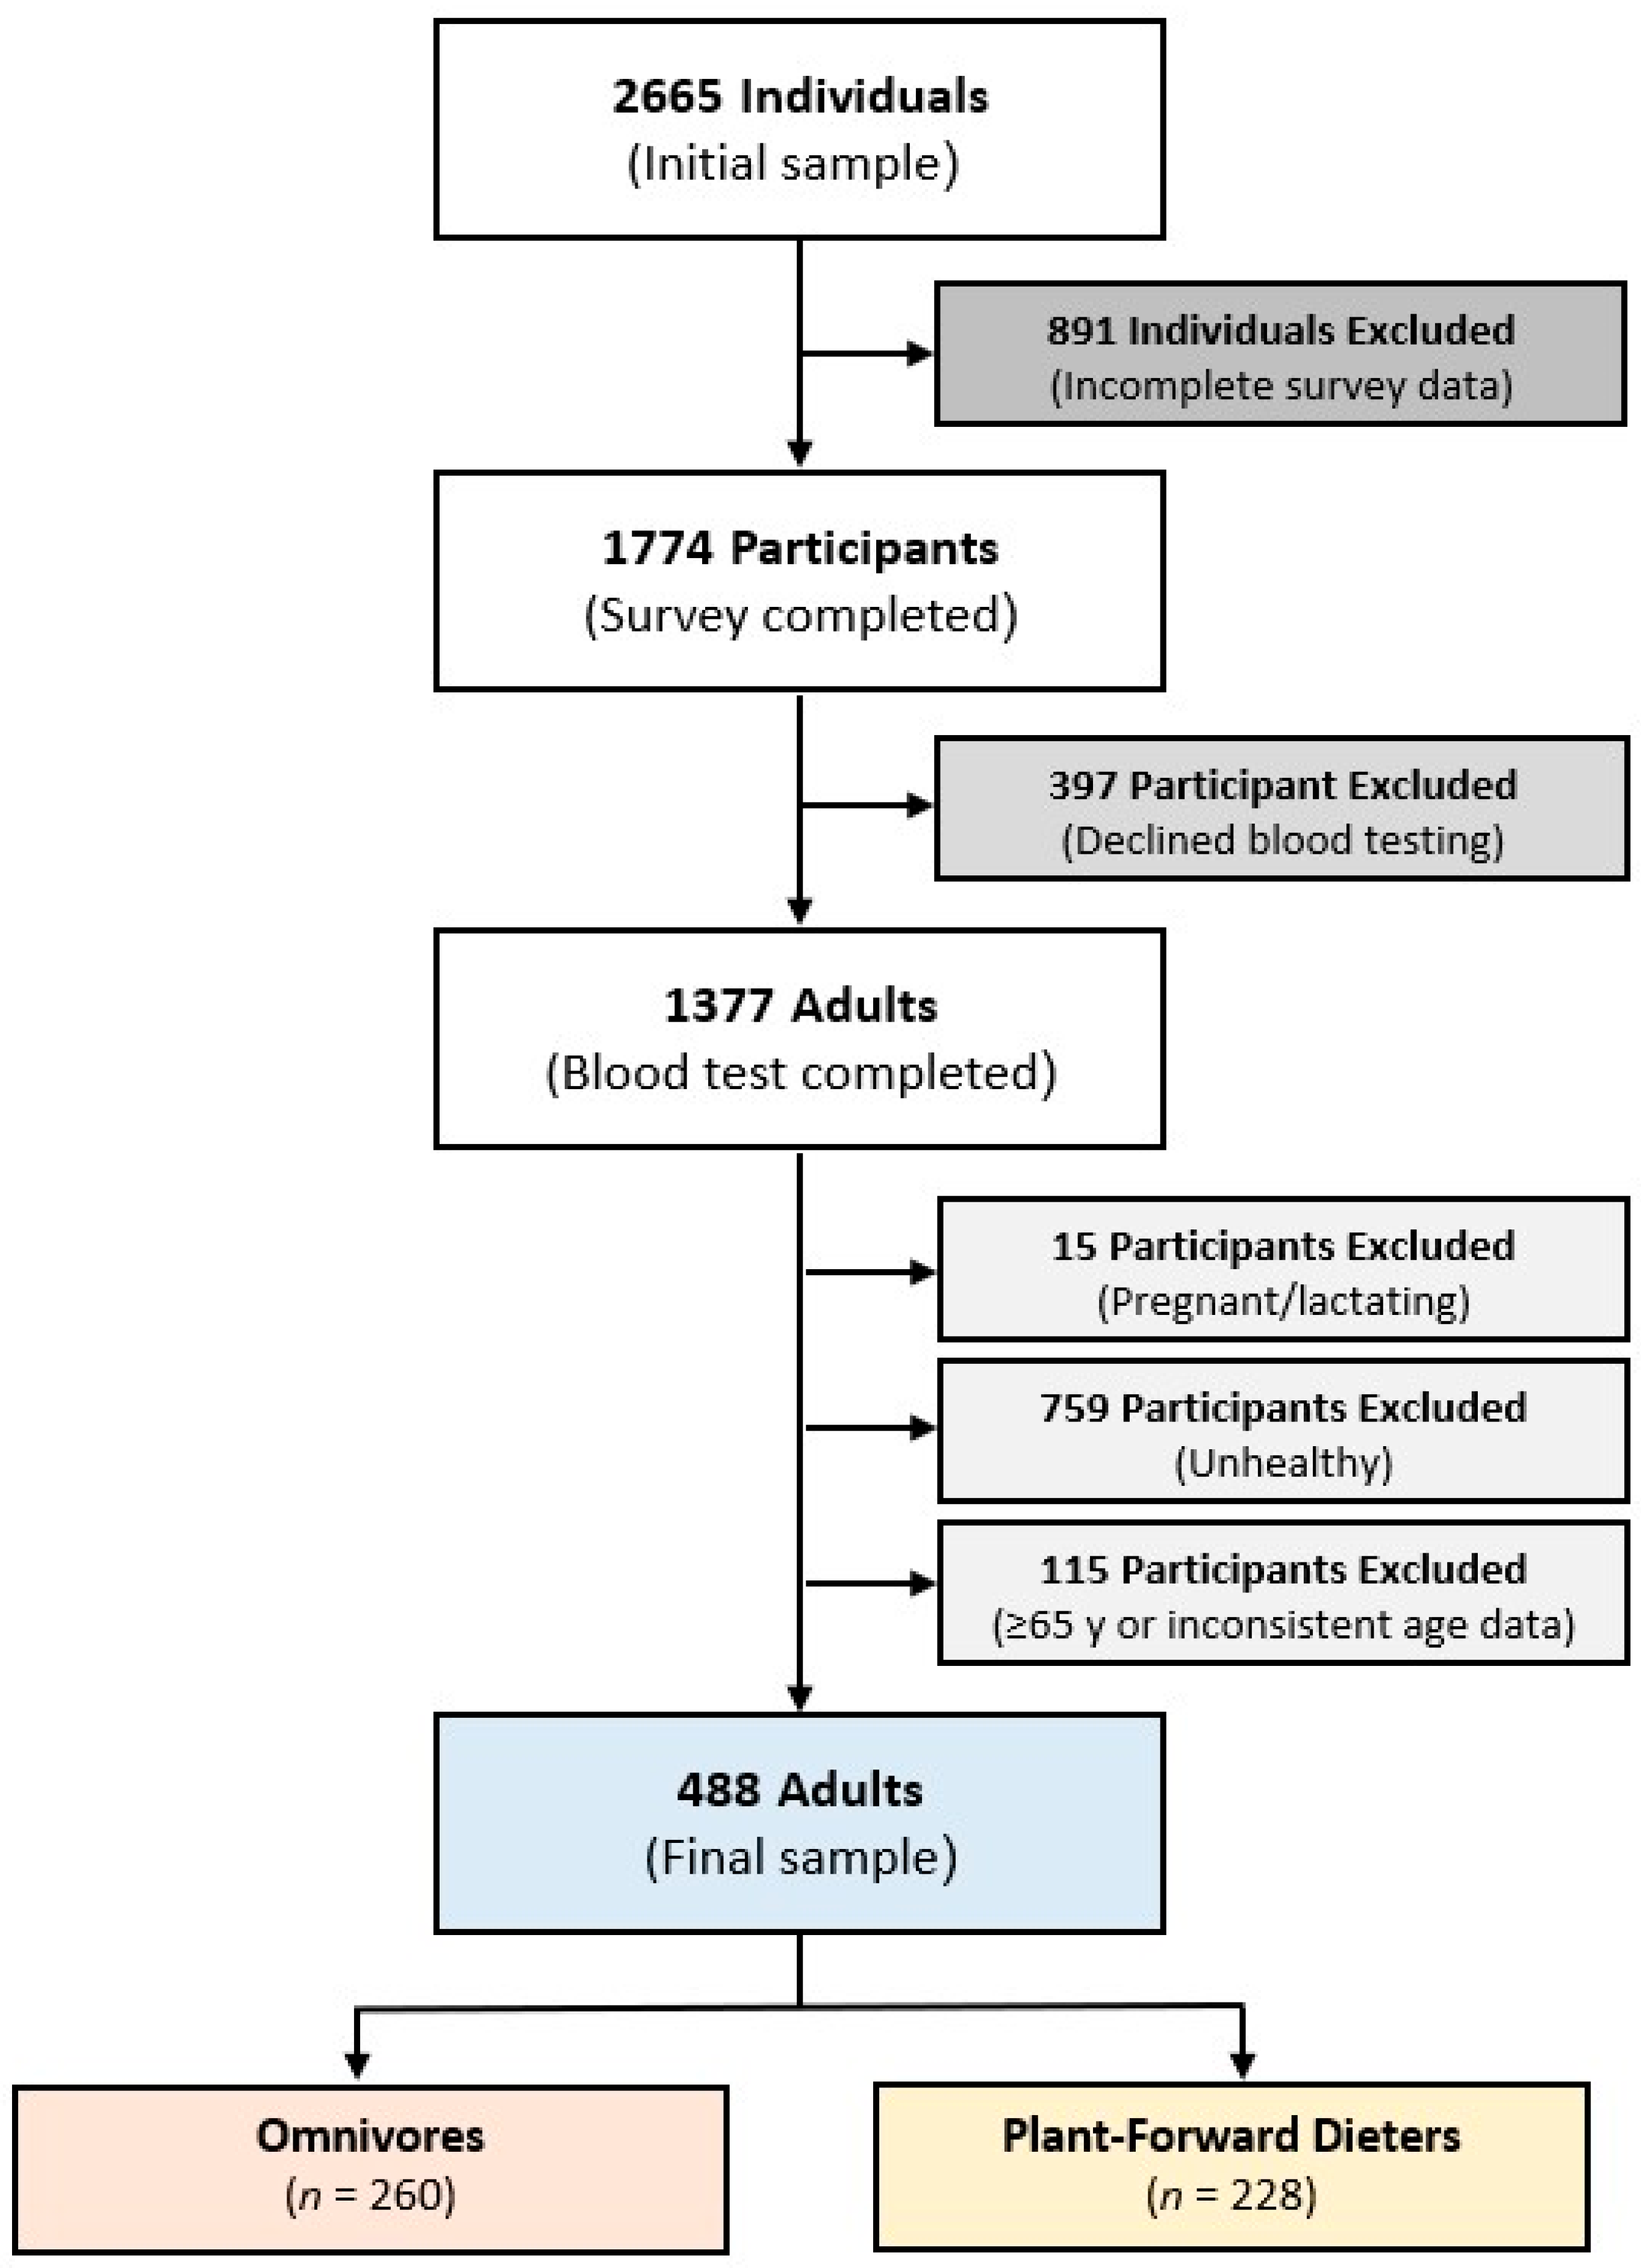
In total, 2665 individuals opened the study link, of whom 1774 completed all mandatory survey components. The instrument captured demographic variables, indicators of socioeconomic position, and information related to health status and lifestyle behaviors. Respondents who finalized the survey were subsequently eligible to arrange a clinical visit for venous blood collection, which was used to assess micronutrient status and cardiovascular-related laboratory parameters. These clinical assessments took place in April 2021. Among the 1417 participants who booked an appointment for biospecimen collection, 1377 attended the visit and contributed blood samples. An overview of participant flow is presented in Figure 1.

2.3. Inclusion/Exclusion Criteria

Eligibility for the present analysis was restricted to healthy adults living in Austria who were between 20 and 65 years of age. For the purpose of this study, “healthy” was operationally defined as the absence of self-reported chronic or severe medical conditions and the absence of medication use indicated for such health issues at the time of assessment. Hence, medications not related to severe or chronic medical conditions (e.g., occasional over-the-counter analgesics, hormonal contraceptives, or short-term treatments for minor conditions) were not considered exclusionary and were permitted within the final analytical sample. Accordingly, individuals were considered suitable only if they reported an absence of major medical conditions and were not undergoing treatment for serious diseases. Participants were excluded if they were pregnant or breastfeeding at the time of assessment, if they reported a history of clinically relevant disorders (including, but not limited to, metabolic, cardiovascular, oncological, respiratory, hepatic, musculoskeletal, psychiatric, or chronic pain conditions) or if they indicated current or prior COVID-19 illness. Additional exclusion criteria comprised the use of prescription or non-prescription medications related to severe health conditions, failure to provide valid informed consent, age outside the predefined range, or insufficient completion of the study questionnaire, including missing responses to core variables required for analysis.

2.4. Survey Variables and Categorization

Information on participants’ demographics, lifestyle, and health characteristics was collected. Reported variables included age, sex, marital status, educational attainment, pregnancy or breastfeeding status, federal state of residence in Austria, dietary patterns, alcohol use, smoking behavior, physical activity (PA) frequency, and predominant work posture (sitting, standing, or moving). Anthropometric measurements of BW and height were used to calculate BMI (kg/m2). BMI was subsequently classified according to the World Health Organization criteria for adults [58]: underweight (<18.5 kg/m2), normal weight (18.5–24.9 kg/m2), overweight (25–29.9 kg/m2), and obese (≥30 kg/m2). To explore potential differences associated with dietary patterns, participants were assigned into two groups: (1) Omnivores (n = 260), defined as individuals who regularly consume both animal- and plant-based foods; and (2) plant-forward dieters (n = 228: subsuming 194 flexitarians, 25 vegetarians, and 9 vegans), defined as individuals who limit or avoid animal products to a more flexible eating with varying degrees, ranging from occasional consumption of animal products (flexitarians) to complete exclusion of meat (vegetarians) or all animal-derived products (vegans) [10,11,12,13,14,15,16,17,18,19]. Even though these dietary patterns differ in the consumption of various foods and due to the smallest common criterium is the nuanced continuum in magnitude of non-daily but only occasional and rare consumption to no intake at all from meat/processed meat and other animal products, they share similarities regarding intakes of fiber, saturated fat and plant-derived bioactive compounds [10,11,12,13,14,15,16,17,18,19,20,22]. Dietary subgroup assignment was based on participants’ self-reported current dietary adherence (vegan, vegetarian, flexitarian, or omnivorous for at least 6 months to ensure consistency), with each option accompanied by a clear explanation and several supplementary questions about specific food intake to ensure accurate classification.

2.5. Blood Collection and Laboratory Procedures

Venous blood specimens were obtained following a minimum 12 h fasting period to reduce metabolic variability. Collections were performed in the morning within a defined time window to limit diurnal influences. Each sample was divided into two fractions: one fraction was analyzed as whole blood for assessment of micronutrient concentrations and complete blood counts (CBC), while the other was processed to isolate serum for measurement of biochemical markers, including total cholesterol, triglycerides, low-density and high-density lipoproteins (LDL, HDL), coenzyme Q10, C-reactive protein, homocysteine, lipoprotein(A), and the omega-3 fatty acids docosahexaenoic acid (DHA) and eicosapentaenoic acid (EPA). Serum separation was achieved via centrifugation at room temperature for three minutes at 3000 rpm, after which the serum was transferred into cryovials and dispatched to the laboratory. All analyses were conducted in accordance with rigorous biochemical standards and standardized operating procedures [59]. Micronutrient measurements within the reference interval were scaled from −1 (lower bound) to +1 (upper bound), and extreme outliers beyond ±3 were truncated to ±3. This rescaling approach was chosen to facilitate comparability across micronutrients with different units and ranges, while retaining the relative position of each value within the reference interval. Unlike z-score standardization, which centers values around the mean, this method maintains a consistent interpretation of minimum and maximum reference values across nutrients, making the results more interpretable in the context of clinical reference ranges. BP was recorded by trained personnel immediately prior to sample collection to ensure accurate baseline measurements. Samples were appropriately stored at −80 °C and analyzed in batches within 48 h to maintain data reliability and minimize potential degradation.
Concentrations of selected micronutrients, including iron, potassium, calcium, magnesium, copper, zinc, selenium, manganese, molybdenum, and vitamins B6, B9, B12, and D, were determined using whole-blood samples [59,60,61,62,63,64]. Analysis at the cellular level provides enhanced interpretive value compared with serum alone, as many minerals and trace elements are predominantly contained within blood cells and participate in intracellular biochemical processes [59,65,66,67]. Blood cells, largely derived from metabolically active bone marrow, offer a reliable representation of the metabolic status of these micronutrients, whereas serum measurements may not accurately reflect cellular concentrations [59,60,68,69]. Quantitative assessment was performed using standardized laboratory techniques appropriate for each analyte. Trace elements such as iron, zinc, selenium, magnesium, copper, manganese, and molybdenum were measured using inductively coupled plasma mass spectrometry (ICP-MS), whereas calcium and potassium were determined with ion-selective electrode (ISE) methods. Vitamins B6, B9, B12, and D were analyzed using high-performance liquid chromatography (HPLC) with ultraviolet detection. To account for inherent variability due to differing units of measurement and sex-specific reference intervals, all micronutrient values were normalized according to established female and male reference ranges [59]. All analyses were performed in an ISO-certified clinical diagnostic laboratory using validated commercial assays and calibrated analytical platforms.
BP levels were defined based on thresholds for early-stage hypertension [70]: normal (<130/<80 mmHg), elevated systolic (≥130/<80 mmHg), elevated diastolic (<130/≥80 mmHg), and both elevated (≥130/≥80 mmHg). The LDL-to-HDL ratio, referred to as the LDL-HDL Index, was computed by dividing the measured LDL concentration by the HDL concentration [71]. The Omega-3 Index was determined by quantifying the combined content of EPA and DHA in erythrocytes, expressed as a percentage of total identified fatty acids [72]. This index is widely regarded as a reliable biomarker for assessing cardiovascular risk, with evidence suggesting that erythrocyte-based measurement of EPA and DHA provides a more accurate evaluation than alternative approaches, in accordance with current recommendations from international health authorities [73].

2.6. Data Analysis

All data processing and statistical analyses were performed using R software (version 4.1.1). Previous findings [74] reported a correlation between magnesium status and BMI with an effect size of r = 0.206 (f = 0.21). Power analysis for ANOVA indicated that a sample size of 488 participants with an effect size of f = 0.20 would achieve approximately 94% power, ensuring sufficient sensitivity to detect robust differences.
Descriptive statistics included means and standard deviations (SD) for normally distributed variables, as well as medians and interquartile ranges (IQR) for non-parametric data. Categorical variables were analyzed using Pearson’s Chi-squared tests (χ2) to evaluate associations between dietary subgroups and factors such as sex, age, BMI category, PA, regional residence, educational level, primary work posture, supplement and medication use, smoking, alcohol consumption, and BP levels. Continuous variables were examined using Wilcoxon rank-based tests (F statistics) to assess differences between dietary subgroups for height, BW, BMI, BP, and blood biomarkers, including absolute and standardized micronutrient levels. Micronutrient concentrations were categorized as lower than, within, or above sex-specific reference ranges established for German-speaking adults [59], and differences between dietary subgroups were tested using χ2 analyses.
Linear regression analyses (95%-CI: 95% confidence intervals) were conducted to explore the influence of micronutrient status, sex (reference: female), and age (reference: >50 years) on BW, BMI, and BP, stratified by the two dietary subgroups. All regression models included age and sex as a priori covariates based on the initial literature review, which is conceptually distinct from the standardization of micronutrient values used only for descriptive subgroup comparisons. Three sets of models were applied: (1) including micronutrients identified from the literature as potentially relevant, selected a priori based on biological plausibility (hypothesis-driven model); (2) incorporating all measured micronutrients; and (3) including only those micronutrients that were significant or near-significant in the first two models, with primary emphasis on variables identified in Model 1 and confirmed in Model 2, resulting in a final parsimonious model (Model 3) to reduce overfitting while retaining theoretically justified associations. Although multicollinearity was not formally assessed, the selection and use of biologically distinct micronutrients likely minimized its impact. Statistical significance was defined as p < 0.05, and the Benjamini and Hochberg procedure [75] was used with the level of false discovery rate (FDR) defined as q = 0.10, i.e., the FDR- adjusted q < 0.10 was considered significant.

3. Results

The analytical sample comprised 488 participants and was divided into two dietary subgroups: 260 omnivores (median age: 38 years [IQR 19]) and 228 participants following a plant-forward dietary pattern (median age: 38 years [IQR 22]). Within the plant-forward dietary subgroup, 85.1% were eating flexitarian, 11.0% vegetarian and 3.9% vegan. The prevalence of excess BW was significantly differed across the dietary subgroup, with overweight or obesity observed in 45% of omnivores, compared with 21% among plant-forward dieters (p < 0.05). Consistent with this finding, statistically significant differences between dietary subgroups were detected for BW, height, BMI, sex, PA levels, and Austrian region (p < 0.05). In contrast, no differences were observed between the study groups for age, educational level, dominant work posture, use of supplements or medications, smoking behavior, or alcohol consumption (p > 0.05). A detailed overview of sociodemographic and lifestyle characteristics stratified by dietary subgroup is provided in Table 1.
Normal BP values were documented in 47% of omnivorous participants, compared to 59% in those following a plant-forward eating approach. Correspondingly, both systolic and diastolic BP differed significantly between dietary strata, with lower mean levels observed in plant-forward dieters (p < 0.05). Beyond BP, dietary pattern-related differences were identified for several hematological and biochemical markers, including erythrocytes, hematocrit, hemoglobin, ferritin and the ferritin index, cholesterol, LDL, LDL-HDL index, C-reactive protein, and coenzyme Q10 (all p < 0.05). A comprehensive summary of blood biomarker distributions stratified by dietary subgroup is shown in Table 2.
Comparisons of circulating micronutrient concentrations across dietary subgroups revealed statistically significant differences in the unadjusted levels of vitamin B12, potassium, magnesium, zinc, and iron (p < 0.05), exhibiting higher concentrations among omnivorous participants. In addition, plant-forward group showed significantly different unadjusted values of vitamin B12, potassium, magnesium and copper (p < 0.05, q < 0.10). In contrast, no differences were detected between dietary subgroups for vitamin B6, B9, and D, calcium, copper, selenium, manganese, and molybdenum (p ≥ 0.05). After standardizing micronutrient values to sex-specific reference ranges, vitamin B12, potassium and magnesium remained significantly different between dietary subgroups (p < 0.05, q < 0.10), and while copper emerged as significantly different following standardization, zinc and iron no longer showed significant dietary pattern-specific differences. Vitamin D, calcium and selenium, however, exhibiting lower standardized values among omnivores. Absolute and standardized micronutrient concentrations stratified by dietary patterns are summarized in Table 3.
In the analysis of micronutrient status, classified as deficient (<norm), adequate (normal), or excessive (>norm), statistically significant differences between dietary subgroups were identified for potassium and vitamin B12 (p < 0.05). Across all assessed micronutrients, vitamin D demonstrated the greatest burden of deficiency in both dietary categories, affecting 96% of omnivores and 93% of participants adhering to plant-based diets. Excluding vitamin D, the proportion of participants exhibiting inadequate micronutrient levels ranged from 0% to 26% in the omnivorous group and from 1% to 20% among participants following a plant-forward dietary pattern. A detailed distribution of micronutrient status by dietary category is presented in Table 4.
Linear regression analyses were performed to investigate associations between blood micronutrient concentrations and biological sex and age in relation to BP, both in the overall study population and within dietary subgroups. The modeling strategy employed comprising three sequential models: an initial model including micronutrients identified a priori from the literature, a second model incorporating the full set of assessed micronutrients, and a final reduced model retaining only variables that demonstrated statistical relevance in the preceding analyses. Within the whole sample of healthy adults, the first model identified iron, copper, sex, and age as significant determinants of BP (p < 0.05). When the full micronutrient panel was evaluated, copper additionally emerged as significant contributor (p < 0.05). In the reduced model, iron, sex, age, and copper remained independently associated with BP, with iron, age, and copper showing a positive relationship, whereas sex was inversely associated with BP (being female was significantly associated with lower BP compared with males) (p < 0.05). Dietary pattern-specific analyses revealed distinct association profiles. Among omnivorous participants, sex, selenium, and zinc retained statistical significance in the final model (p < 0.05). In contrast, within the plant-forward dietary subgroup, iron, sex, and age were identified as being associated with BP (p < 0.05), with iron and age showing a positive relationship, whereas sex was inversely associated with BP (being female was significantly associated with lower BP compared with males). Regression results for BP from the final regression model are summarized in Table 5, while comprehensive results from all modeling steps are available in the Supplementary Material (Table S1).
In the initial model for BW, sex, age, vitamin B9, and vitamin D emerged as statistically significant contributors (p < 0.05), a pattern that persisted when the full set of micronutrients was included. The reduced model retaining only relevant associated variables confirmed that all four variables independently explained variation in BW, with positive associations observed for age, and inverse relationships identified for sex (being females was significantly associated with lower BW compared with males), vitamin B9, and vitamin D (p < 0.05). Diet-stratified analyses showed comparable results among omnivores, with the final model indicating consistent associations with the four previously noted variables along with vitamin B6 (p < 0.05). In contrast, within the plant-forward dieters, sex, molybdenum, and calcium were significantly associated with BW, exhibiting a negative association (p < 0.05). Regression results for BW from the final regression model are summarized in Table 6, while comprehensive results from all modeling steps are available in the Supplementary Material (Table S2).
In the initial model for BMI, magnesium, vitamin D, age, and sex emerged as significant determinants (p < 0.05), and these relationships remained stable when the complete micronutrient panel was incorporated. In the final reduced model, all four variables retained statistical significance, with age and magnesium demonstrating a direct association with BMI, whereas vitamin D and sex were inversely associated with BMI (being females was significantly associated with lower BMI compared with males) (p < 0.05). Among omnivores, the final model identified magnesium, age, sex, vitamin D, and vitamin B6 as significant contributors to BMI variation (p < 0.05). In contrast, for plant-forward dieters, only vitamin D, age, and calcium were associated with BMI. Regression results for BMI from the final regression model are summarized in Table 7, while comprehensive results from all modeling steps are available in the Supplementary Material (Table S3).

4. Discussion

The objective of this study was to examine how dietary patterns are associated with blood micronutrient profiles, BP, and body composition, with the aim of informing more precise, dietary pattern-specific strategies for cardiometabolic risk reduction. The primary outcomes of this study were as follows: (a) micronutrients including iron, selenium, zinc, copper, magnesium, molybdenum, potassium, calcium, and vitamins B6, B9, and D, together with sex and age, were found to be significant correlates of BW, BMI, and BP in both omnivorous and plant-forward dietary subgroups; (b) significant differences between dietary subgroups were observed for BP, as well as in multiple hematological, lipid, and inflammatory biomarkers; (c) significant dietary group differences were observed in circulating micronutrient concentrations, with significantly higher absolute levels of vitamin B12, potassium, magnesium, zinc, and iron in omnivores, with sex-standardized analyses showing similar patterns for vitamin B12, potassium, magnesium, and copper; (d) significant differences between dietary subgroups in micronutrient status categories (deficient, adequate, excessive) were observed for vitamin B12 and potassium.
The plant-forward dietary subgroup exhibited a greater frequency of normal BP and lower systolic and diastolic means. Consistent with this finding, results from a meta-analysis [76] suggest that plant-forward diets are associated with lower systolic and diastolic BP compared with omnivorous diets, likely due to higher intakes of potassium, magnesium, and dietary fiber, coupled with lower sodium and saturated fat intake. The reduced BP in plant-forward dieters in the present study may be associated with differences in nutrient intake and lower systemic inflammation as indicated by reduced CRP levels in this group. However, the higher mean BMI observed in omnivores in the present study may have partially contributed to the observed BP differences, given the well-established association between increased adiposity and elevated BP [77]. This interpretation is further supported by the higher prevalence of overweight and obesity observed among omnivores (45%) compared to the plant-forward group (21%), which may have contributed to the less favorable cardiometabolic profile in this subgroup. Beyond BP, significant dietary differences were observed in several hematological and biochemical markers, suggesting associations between dietary pattern and cardiovascular health markers. Lower LDL cholesterol and LDL-HDL ratios among plant-forward dieters are consistent with previous research showing that vegan and vegetarian diets improve lipid profiles and reduce atherogenic risk [24]. The higher BMI observed in omnivores may have also contributed to the observed less favorable lipid parameters. Similarly, elevated erythrocytes, hemoglobin, and ferritin in omnivores reflect higher dietary heme iron intake, whereas lower ferritin levels in plant-forward participants may indicate reduced iron stores but are not necessarily indicative of clinically significant deficiency, as hemoglobin and hematocrit remained within normal/healthy ranges. These findings are consistent with previous research [78,79,80] reporting that while plant-based diets may lower iron stores, hematological function is generally preserved in well-planned plant-based diets. Overall, these results support the notion that dietary patterns are associated with BP and cardiometabolic biomarkers through complex interactions between micronutrient status, lipid metabolism, and inflammatory markers. However, given the high prevalence of supplement use in the study population (77%), it is plausible that supplemental intake contributed to circulating micronutrient levels and related biomarkers, potentially attenuating dietary group-specific associations with BP and cardiometabolic outcomes.
The present study showed that the plant-forward dietary subgroup had significantly lower standardized levels of vitamin B12, potassium, magnesium and copper (p < 0.05, q < 0.10), and higher levels of vitamin B9 (p = 0.050, q = 0.108) and vitamin D (p = 0.065, q = 0.120), with no significant between-group differences in the remaining assessed micronutrients. These findings are consistent with established literature indicating that certain micronutrients, particularly vitamin B12, are more abundant in animal-derived foods, which explains the elevated levels in omnivores [10,81]. However, research on the micronutrient status of plant-based vs. omnivorous dieters showed comparable status of Vitamin B12, with no differences observed in Vitamins B12, D, and iron, and also no deficiencies in Vitamins A, B1, B6, B9, C, and E, nor in iron, magnesium, phosphorus, and copper [22,29,82,83,84]. At the same time, however, undersupply or deficiency was reported for calcium, zinc, iodine, and Vitamin B12, and further micronutrient concerns include iron, choline and Vitamin D [11,12,22,29,82,83,84].
Consistent with these findings, analysis of micronutrient status in the present study revealed significant dietary differences for 4 out of 13 (30.8%) micronutrients analyzed (Table 3). However, since the plant-forward category included flexitarians, vegetarians, and vegans (dietary patterns that differ substantially in their degree of animal-product restriction from once in a month to never) [10,11,19,20,22] some attenuation of dietary pattern-specific micronutrient differences is usually expected due to substantial differences in their degree of animal-product restriction. This heterogeneity likely contributed to only a subset of micronutrients showing significant between-group differences. Even though this grouping was necessary to ensure adequate statistical power, combining these distinct dietary patterns into one category may still attenuate contrasts and yield conservative estimates of true dietary pattern-specific micronutrient effects. However, while lower yet norm micronutrient levels resulting from everyday habitual dietary intake does not necessarily equal with a status considered clinically deficient, except for both Vitamin B9 (for which a surplus supply is indicated) and Vitamin D (indication of a poor supply), in the present study 11 or 13 (84.6%) values standardized by sex were within reference interval regardless of dietary pattern (Table 3). In addition, approximately 8 in 10 of the total sample were found to have a normal micronutrient status, with Vitamin B12 and potassium found significantly lower (higher prevalences of deficiency) in plant-forward dieters (Table 4).
Vitamin B12 is a micronutrient involved in energy metabolism, hematopoiesis, and neurological function, obtained primarily from animal-derived foods, with deficiency being a well-documented concern in vegetarian and vegan populations, highlighting the need for dietary planning or supplementation [85]. Importantly, vitamin B12 inadequacy is not exclusive to plant-based diets and may arise across all eating patterns when dietary quality is suboptimal [22,27,29,30]. Given the inclusion of flexitarians within the plant-forward category, it is likely that vitamin B12 status and other micronutrient profiles varied within this group depending on the extent of animal-product restriction. Vegans may be particularly at risk for insufficient Vitamin B12 supply without adequate supplementation due to the shortened and more direct food chain, whereas vegetarians and flexitarians may achieve adequate levels through milk/dairy products, eggs, or occasional meat intake comparable to omnivores. This is because the supplementation of vitamin B12 in life-stock is a sound recommendation, thus standard practice (i.e., by default via feed, water, vaccine) for production and health purposes of animal products [86,87,88,89,90]. Accordingly, this intra-group variability should be considered when interpreting the aggregated plant-forward results. The higher potassium deficiency observed among omnivores may reflect dietary patterns that include lower intakes of fruits, vegetables, legumes, and whole grains, which are major dietary sources of potassium, as plant foods are naturally rich in this mineral [10]. This aligns with previous studies demonstrating that plant-based diets are associated with higher potassium intakes and improved potassium status [91,92]. Vitamin D emerged as the micronutrient with the highest prevalence of deficiency in both dietary subgroups, affecting over 90% of participants. This finding highlights the global concern regarding widespread insufficient supply of vitamin D, which, in the present sample, may be influenced by limited sun exposure, latitude, seasonal variation, and dietary intake [93]. Cut-off values used to classify vitamin D deficiency or insufficiency differ substantially across the literature. Some investigations define sufficiency within a range of 50–125 nmol/L, whereas others apply a narrower interval of 75–125 nmol/L as the reference standard [94,95,96]. In the present study, normal vitamin D status was defined as 100–150 nmol/L, in accordance with established reference values for German-speaking populations [59]. The use of this comparatively higher threshold may partially account for the notably elevated prevalence of vitamin D deficiency observed in this population. In addition, data in this study were obtained during March–April, and seasonal effects may have influenced the high prevalence of vitamin D deficiency. The similarity in vitamin D deficiency across dietary subgroups, however, suggests that dietary pattern alone may not be sufficient to ensure adequate vitamin D status, highlighting the potential role of fortification or supplementation, as well as regular sun exposure (e.g., 15–20 min/day to arms and legs) as an effective, cost-free, non-dietary strategy [97,98]. More broadly, the uniformly high prevalence across both dietary subgroups suggests that vitamin D deficiency in this group represents a population-wide issue rather than a diet-type specific phenomenon. Furthermore, there was only a minimal association between dietary pattern and vitamin D status. From a public health perspective, the near-universal prevalence observed in the target population highlights the need for systematic prevention strategies (such as population-level food fortification policies, targeted supplementation recommendations, and public health initiatives promoting safe sun exposure) to mitigate long-term risks related to bone health, immune function, and cardiometabolic outcomes.
In the present study, after standardizing micronutrient concentrations to sex-specific reference ranges, most differences persisted, except for zinc, which lost statistical significance, and copper, which gained significance. This suggests that while absolute concentrations differ, relative adequacy within physiological ranges may mitigate the functional impact of these variations. Previous studies have similarly reported that, although plant-based diets may provide lower levels of zinc, overall zinc status often remains sufficient if dietary diversity and absorption factors (e.g., phytate content) are considered [99]. The observed increase in copper significance post-standardization may reflect sex-related differences in copper metabolism and homeostasis, as well as variation in dietary copper sources [100], or the influence of oral contraceptive use, which has been shown to increase serum copper levels [101]. Overall, these findings highlight that dietary patterns are associated with circulating micronutrient profiles, particularly nutrients primarily derived from animal products; nevertheless, many micronutrients are maintained within reference ranges across dietary subgroups. It should also be considered that heterogeneity within dietary subgroups may influence the magnitude of observed micronutrient differences, resulting in conservative estimates when these diets are combined into a single category.
Exploratory regression analyses identified sex- and age-adjusted associations between specific micronutrients and BP, revealing distinct patterns across dietary subgroups. In the combined population, iron and copper were positively associated with BP, while being female was associated with lower BP and being over 50 years of age with higher BP. These findings align with previous literature highlighting the complex role of micronutrients in vascular function and BP regulation [102]. Elevated iron stores have been associated with increased oxidative stress, endothelial dysfunction, and higher BP [103,104,105,106]. Similarly, copper plays a dual role in cardiovascular physiology; while essential for enzymatic antioxidant defense, elevated copper levels have been linked to hypertension in some epidemiologic studies, potentially via pro-oxidant effects [107,108]. Dietary pattern-specific analyses revealed nuanced differences. Among omnivores, selenium and zinc were found as independent variables associated with BP. Selenium is a cofactor for antioxidant enzymes such as glutathione peroxidase, and abnormal selenium status has been associated with altered cardiovascular risk [109]. Zinc is critical for vascular function and nitric oxide signaling and has also been associated with BP modulation [110,111]. In plant-forward dieters, iron, sex, and age remained the primary associated variables, with iron and age being positively associated with BP. The absence of selenium and zinc effects in this group may reflect lower intake variability or more uniform micronutrient profiles among plant-forward dietary patterns, potentially due to reliance on plant sources with different bioavailability compared to omnivorous diets. The observed direct association between being male and BP is consistent with established epidemiological data showing that premenopausal women generally have lower BP than men, likely due to protective effects of estrogen on vascular tone and endothelial function [112,113]. Age remained a positive correlator across all models, reflecting the well-documented increase in BP with advancing age due to arterial stiffening, endothelial dysfunction, and cumulative exposure to metabolic risk factors [70,114,115,116]. Importantly, the effect estimates for individual micronutrients were small relative to established determinants such as age and sex. This indicates that micronutrients likely exert modulatory rather than primary effects on BP regulation. While biologically plausible, these associations should not be interpreted as independent therapeutic targets without consideration of overall dietary pattern and lifestyle context. Overall, these findings demonstrate that the contribution of micronutrients to BP regulation is modulated by dietary pattern, sex, and age, highlighting the importance of considering dietary pattern and individual characteristics when assessing micronutrient influences on cardiometabolic risk.
Regarding body composition, across the total sample, age showed a positive association with both BW and BMI, reflecting the well-established trend of weight gain and changes in body composition with advancing age, likely driven by reductions in basal metabolic rate, PA, and alterations in fat distribution [116,117,118]. Being female was associated with a lower BW and BMI, which is consistent with available epidemiological data, potentially due to differences in lean mass, hormonal influences, and fat distribution patterns [119,120]. Evidence suggests that adults with overweight or obesity are more likely to experience micronutrient deficiencies than individuals of the same age and sex who fall within a normal-weight range [121,122,123,124]. These deficiencies are likely influenced primarily by dietary patterns characterized by high energy density but low micronutrient quality, as well as lifestyle-related factors that jointly affect both BW and micronutrient status. In the present study, the regression coefficients indicate modest contributions of individual micronutrients to BW and BMI variance. This suggests that the observed micronutrient associations likely represent secondary or interacting factors rather than direct causal determinants of adiposity. Although previous research has explored how specific vitamins or minerals relate to body composition [125,126,127,128], there are limited investigations performing integrated assessment of how multiple micronutrients are collectively associated with variations in BW and BMI [129,130]. In the present study, vitamin B9 and vitamin D emerged as variables inversely associated with BW in the total sample, suggesting potential mechanistic links between these micronutrients and adiposity. Importantly, these associations should be interpreted in the context of overall energy balance, with caloric intake and diet quality representing the primary determinants of BW. Vitamin B9 plays a role in one-carbon metabolism and methylation pathways, which have been implicated in energy metabolism, fat accumulation, and insulin sensitivity [131]. However, B9 intake largely reflects consumption of plant-based foods such as leafy green vegetables and legumes [132], which are characteristic of healthy dietary patterns typically not associated with increased body weight. Vitamin D deficiency has been consistently associated with increased adiposity and higher BMI, possibly due to effects on adipocyte differentiation, insulin secretion, and inflammatory pathways [133,134]. Additionally, greater fat mass in individuals with higher BMI may sequester vitamin D in adipose tissue, thereby indirectly reducing circulating serum levels [135].
The consistency of these associations in omnivorous participants, along with the added influence of vitamin B6, indicates that B-vitamin status may have dietary pattern-specific relevance for body composition regulation. It should be noted that vitamin B6 is mainly obtained from animal-based foods, which in some populations may be consumed as part of dietary patterns that are not consistently associated with optimal BW outcomes [136,137]. In plant-forward participants, calcium and molybdenum were inversely associated with BW, while vitamin D remained inversely linked with BMI. Given that vitamin D is necessary for calcium absorption, the observed inverse association between calcium intake and BW is likely, at least in part, a downstream consequence of the vitamin D–BMI relationship. Adequate calcium intake has been proposed to influence body fat regulation through modulation of fat oxidation, lipolysis, and energy balance [138,139]. Magnesium was positively associated with BMI in the total sample and omnivorous participants, suggesting that a higher intake of foods in general also leads to a better supply of magnesium. Magnesium is particularly important in obesity, because it plays a role in glucose metabolism, insulin signaling, and muscle function, which can influence lean mass and overall body composition [140,141]. Overall, the present findings suggest that both demographic factors and micronutrient status interact with interindividual variability in BW and BMI. The observed dietary pattern-dependent differences further emphasize the relevance of considering dietary patterns when evaluating nutrient-body composition interactions. These results support targeted nutritional strategies, including adequate intake of vitamin B9, vitamin D, calcium, and magnesium, to support healthy BW and body composition, particularly in populations adhering to plant-based diets [142]. However, the distinction between statistical detectability and clinical magnitude should also be considered. While several associations were statistically significant and biologically coherent, their clinical impact at the individual level may be limited. Potential multicollinearity among micronutrients may have increased standard errors; however, given the consistency and directionality of observed associations, this is unlikely to have materially affected the interpretation of the results, and estimates may therefore be considered conservative. In addition, regression goodness-of-fit indices (as presented in Supplementary Tables S1–S3: McFadden’s and Nagelkerke’s R2) indicated modest explanatory power, suggesting that the models capture only part of the variability in BP, BW, and BMI and that other unmeasured factors likely contribute to these health-related parameters. Longitudinal and interventional studies are required to determine whether these micronutrient-related differences translate into clinically meaningful changes in cardiometabolic outcomes.
This study includes several limitations that should be considered when interpreting the results. As a cross-sectional investigation, the findings are restricted to identifying associations and cannot be used to infer causal relationships. Given the open recruitment approach and absence of random sampling, participants were recruited on a voluntary, non-randomized basis, primarily among individuals willing to complete an online survey. This may have introduced pre-selection and sampling bias toward more health-conscious or motivated respondents, thereby limiting the generalizability of the findings to broader populations. While 1377 adults completed blood sampling, the final analytic sample included only 488 participants. Even though this strict application of eligibility criteria strengthened internal validity by minimizing disease-related confounding, it may limit external validity and generalizability to clinically diverse populations. Additionally, the study population consists of Austrian adults, and results may not be directly transferable to populations with different dietary practices, cultural norms, or environmental exposures; however, insights may still be relevant for regions with comparable dietary patterns and socio-cultural contexts, such as the D-A-CH region (D/Germany-A/Austria-CH/Switzerland). Flexitarians, vegetarians, and vegans were pooled into the plant-forward dietary subgroup for analysis. While this approach was necessary to maintain statistical power, it may have diluted diet-type specific differences in micronutrient intake and should be considered when interpreting the findings. In addition, while general information on supplement use and dietary habits was collected, detailed assessments of food intake, nutrient bioavailability, or adherence to dietary patterns were not performed, potentially limiting the ability to account for these factors. Furthermore, adjustments for potential confounding variables, including socioeconomic status, PA, and overall health status, were limited. These factors were considered conceptually, but not formally adjusted for in the analyses, and should be taken into account when interpreting the associations observed.
Despite these limitations, the study offers several strengths. By examining multiple health and nutritional parameters across individuals following omnivorous and plant-forward eating habits, this study contributes to a more nuanced understanding of dietary pattern-related differences in adult health. The focus on dietary pattern-specific analyses aligns with principles of personalized nutrition; however, given the cross-sectional design, the present findings should be interpreted as exploratory and hypothesis-generating rather than evidence for personalized dietary optimization strategies. The study’s relatively large sample size (N = 488) enhances statistical robustness, allowing for more reliable identification of associations between dietary patterns, micronutrient status, and cardiometabolic markers. These findings provide novel insights into the potential influence of dietary habits on micronutrient adequacy, blood lipid profiles, and body composition. They may inform future dietary recommendations and public health strategies tailored to individuals with different eating patterns. Further longitudinal research is warranted to evaluate the long-term effects of dietary choices on health outcomes and to clarify potential causal relationships.

5. Conclusions

The present study provides novel information on the association between micronutrients, body composition, and cardiovascular risk factors in adults eating plant-forward or omnivorous diets. Participants adhering to plant-forward dietary patterns exhibited lower BP, favorable lipid profiles, and distinct micronutrient patterns compared to omnivores, which may be indicative of potential cardiometabolic advantages associated with plant-forward dietary patterns. Regression analyses revealed that micronutrients such as iron, copper, selenium, zinc, calcium, magnesium, vitamin B9, vitamin B12, and vitamin D, along with demographic factors including age and sex, are significant correlates of BP, BW, and BMI, with differential patterns observed across dietary subgroups. Vitamin D deficiency emerged as a pervasive concern across all participants, highlighting a universal need for strategies to improve vitamin D status regardless of dietary pattern. This finding confirms that vitamin D insufficiency is widespread across all dietary patterns. Meanwhile, inadequate levels of nutrients predominantly assumed to be derived from animal sources, particularly Vitamin B12 and potassium, were more commonly observed among plant-forward dieters. This emphasizes the importance of monitoring and potentially supplementing such nutrients in populations adhering to plant-forward dietary patterns.
Overall, this study highlights the complex interplay between dietary patterns, micronutrient status, and key health indicators, providing novel insights into nutrient-mediated determinants of BP and BW. While the present study contributes to the evidence base, the findings should be interpreted as associative and hypothesis-generating. The results support the implementation of nutritional guidance, the monitoring of critical micronutrients, and consideration of demographic factors in strategies aimed at preventing hypertension and obesity-related complications. Future research should prioritize well-designed longitudinal and intervention studies to clarify the long-term health effects of dietary patterns, while also elucidating the mechanistic pathways through which dietary habits shape cardiometabolic and nutritional status. Such work is essential for generating robust, evidence-based dietary recommendations that account for diverse populations and varying dietary practices.

Supplementary Materials

The following supporting information can be downloaded at: https://www.mdpi.com/article/10.3390/dietetics5020028/s1. Table S1. Regression analysis of micronutrients associations with BP, stratified by dietary pattern. Table S2. Regression analysis of micronutrients associations with BW, stratified by dietary pattern. Table S3. Regression analysis of micronutrients associations with BMI, stratified by dietary pattern.

Author Contributions

Conceptualization: M.M., M.S., M.K. and K.W. Methodology: M.M. and K.W.; Formal analysis: M.M. and K.W.; investigation: M.M., M.S., S.M. and M.K.; resources: M.K.; original draft preparation: M.M. and K.W.; writing—review and editing: M.M., S.M., C.D. and G.R. Supervision: C.D. and K.W. All authors have read and agreed to the published version of the manuscript.

Funding

This research (GHRDA—Good Health Retrospective Data Analysis) was funded by Biogena GmbH & Co. KG, Strubergasse 24, 5020 Salzburg, Austria. The funder was not involved in study design, data collection, analysis, interpretation, manuscript preparation, or the decision to publish. The study was carried out at the Department of Sport Science, Fürstenweg 185, University of Innsbruck, 6020 Innsbruck, Austria (project ID: P6210-045-011).

Institutional Review Board Statement

Research procedures adhered to Good Clinical Practice and complied with scientific, ethical, and academic standards, including the Declaration of Helsinki. Owing to the retrospective nature of the study, further ethical approval was not appliable. The template for review by an Austrian ethics committee was not legally required, specifically due to § 30 of the Salzburg Hospital Act (“Salzburger Krankenanstaltengesetz”) (cf. Salzburg study center/Prüfzentrum Salzburg), originally in German—“Die verpflichtende Befassung sieht § 30 nur im Fall der Anwendung neuer medizinischer Methoden und nicht-interventioneller Studien vor. In allen anderen Fällen ist die Befassung der Ethikkommission lediglich freiwillig.”—and translated into English—“Mandatory involvement is required by § 30 only in the case of the use of new medical methods and non-interventional studies. In all other cases, involvement of the ethics committee is merely voluntary.” Therefore, no additional ethical approval (institutional review or ethics board) was required. Detailed study information is available in the ISRCTN (International Standard Randomised Controlled Trial Number) Registry: ISRCTN12444421; 21 July 2025 (https://www.isrctn.com/ISRCTN12444421; accessed on 8 January 2026).

Informed Consent Statement

Informed consent was obtained from all participants prior to their inclusion in the study.

Data Availability Statement

Data availability is restricted by data protection and security regulations.

Acknowledgments

This study was conducted as contractual research (Biogena GmbH & Co. KG) at the Department of Sport Science, University of Innsbruck, 6020 Innsbruck, Austria (project ID: P6210-045-011; PI: KW; deputy PI: GR; scientific research staff: MM). We acknowledge the following authors as grant recipients or for other professional engagements and affirm that the listed bodies had no involvement in the present research. There is no impact from any agency on drafting and writing, presentation, critical review, commenting and editing, or publication of the present manuscript. Clemens Drenowatz holds an editorial board position with AIMS Public Health, Frontiers in Sports and Active Living and Nutrients. Markus Schauer, CEO and founder of VerticalMed Tyrol, served on Biogena’s executive board (2020–2023). Susanne Maier is CEO and founder of VerticalMed Tyrol (https://verticalmedtyrol.com/en/about_en/; accessed on 8 January 2026). She was a clinical trial manager at Montavit (https://montavit.com/en; accessed on 8 January 2026) from 2020 to 2022. Michael Kohlberger is employed at Biogena GmbH & Co. KG as a knowledge management expert and member of the science department. With a background in human biology, he provided expertise on micronutrient–supplement–health interactions for this study. Katharina Wirnitzer is also the PI of several other studies: both the Austria nationwide school study (https://www.science2.school/en/; accessed on 8 January 2026; TWF—Tiroler Wissenschaftsförderung ID: UNI-0404/2413) and the Austria nationwide college and university study (https://uni.science2.school/en/; accessed on 8 January 2026; TWF—Tiroler Wissenschaftsförderung ID: F.30976/6-2021), which are supported by the Austrian Federal Ministry of Education, Science, and Research (BMBWF), all Austrian Federal Education Authorities, as well as the Austrian Students’ Union (ÖH). The NURMI Study, the largest study running in Europe (https://www.nurmi-study.com/en; accessed on 8 January 2026), however, received no external funding. In addition, she is a scientific member of the Advisory Board of the Platform for the Promotion of Traditional, Complementary and Integrative Care (TCIC), Prague, Czech Republic.

Conflicts of Interest

Author Michael Kohlberger was employed by the company Biogena. He paticipated in conceptualization and investigation of the study. The role of the company was to provide funding. The remaining authors declare that the research was conducted in the adsence of any commercial or financial relationships that could be construed as a potential conflict of interest.

References

  1. World Health Organization (WHO). Non-Communicable Diseases (NCDs). Available online: https://www.who.int/news-room/fact-sheets/detail/noncommunicable-diseases (accessed on 24 December 2025).
  2. Hajat, C.; Stein, E. The global burden of multiple chronic conditions: A narrative review. Prev. Med. Rep. 2018, 12, 284–293. [Google Scholar] [CrossRef] [PubMed]
  3. World Health Organization (WHO). Cardiovascular Diseases (CVDs). Available online: https://www.who.int/news-room/fact-sheets/detail/cardiovascular-diseases-(cvds) (accessed on 24 December 2025).
  4. Di Cesare, M.; Perel, P.; Taylor, S.; Kabudula, C.; Bixby, H.; Gaziano, T.A.; McGhie, D.V.; Mwangi, J.; Pervan, B.; Narula, J.; et al. The Heart of the World. Glob. Heart 2024, 19, 11. [Google Scholar] [CrossRef] [PubMed]
  5. Statistics Austria. Cardiovascular Diseases and Cancer Remain the Most Common Causes of Death in 2023 (Press Release No. 13 366-132/24). Statistics Austria: Vienna, Austria. 2024. Available online: https://www.statistik.at/fileadmin/announcement/2024/06/20240626Todesursachen2023EN.pdf (accessed on 27 January 2026).
  6. Centers for Disease Control and Prevention (CDC). Heart Disease Risk Factors. 2024. Available online: https://www.cdc.gov/heart-disease/risk-factors/ (accessed on 24 December 2025).
  7. DynaMed. Cardiovascular Disease Major Risk Factors; EBSCO Information Services: Ipswich, MA, USA, 2025; Available online: https://www.dynamed.com/condition/cardiovascular-disease-major-risk-factors (accessed on 24 December 2025).
  8. Clem, J.; Barthel, B. A look at plant-based diets. Mo. Med. 2021, 118, 233–238. [Google Scholar] [PubMed]
  9. Raptou, E.; Tsiami, A.; Negro, G.; Ghuriani, V.; Baweja, P.; Smaoui, S.; Varzakas, T. Gen Z’s willingness to adopt plant-based diets: Empirical evidence from Greece, India, and the UK. Foods 2024, 13, 2076. [Google Scholar] [CrossRef]
  10. Melina, V.; Craig, W.; Levin, S. Position of the Academy of Nutrition and Dietetics: Vegetarian diets. J. Acad. Nutr. Diet. 2016, 116, 1970–1980. [Google Scholar] [CrossRef]
  11. Raj, S.; Guest, N.S.; Landry, M.J.; Mangels, A.R.; Pawlak, R.; Rozga, M. Vegetarian dietary patterns for adults: A position of the Academy of Nutrition and Dietetics. J. Acad. Nutr. Diet. 2025, 125, 831–846.e2. [Google Scholar] [CrossRef]
  12. WHO. Plant-Based Diets and Their Impact on Health, Sustainability and the Environment: A Review of the Evidence; WHO European Office for the Prevention and Control of Noncommunicable Diseases: Copenhagen, Denmark, 2021; Document Number: WHO/EURO:2021-4007-43766-61591; Available online: https://www.who.int/europe/publications/i/item/WHO-EURO-2021-4007-43766-61591 (accessed on 27 January 2026).
  13. Hamilton, I.; Kennard, H.; McGushin, A.; Höglund-Isaksson, L.; Kiesewetter, G.; Lott, M.; Milner, J.; Purohit, P.; Rafaj, P.; Sharma, R.; et al. The public health implications of the Paris Agreement: A modelling study. Lancet Planet. Health 2021, 5, e74–e83. [Google Scholar] [CrossRef]
  14. Kent, G.; Kehoe, L.; Flynn, A.; Walton, J. Plant-based diets: A review of definitions and nutritional role in the adult diet. Proc. Nutr. Soc. 2022, 81, 62–74. [Google Scholar] [CrossRef]
  15. Wozniak, H.; Larpin, C.; de Mestral, C.; Guessous, I.; Reny, J.-L.; Stringhini, S. Vegetarian, pescatarian and flexitarian diets: Sociodemographic determinants and association with cardiovascular risk factors in a Swiss urban population. Br. J. Nutr. 2020, 124, 844–852. [Google Scholar] [CrossRef]
  16. Malek, L.; Umberger, W.J. How flexible are flexitarians? Examining diversity in dietary patterns, motivations and future intentions. Clean. Responsib. Consum. 2021, 3, 100038. [Google Scholar] [CrossRef]
  17. Hargreaves, S.M.; Rosenfeld, D.L.; Moreira, A.V.B.; Zandonadi, R.P. Plant-based and vegetarian diets: An overview and definition of these dietary patterns. Eur. J. Nutr. 2023, 62, 1109–1121. [Google Scholar] [CrossRef] [PubMed]
  18. Derbyshire, E.J. Flexitarian diets and health: A review of the evidence-based literature. Front. Nutr. 2017, 3, 55. [Google Scholar] [CrossRef] [PubMed]
  19. Storz, M.A. What makes a plant-based diet? A review of current concepts and proposal for a standardized plant-based dietary intervention checklist. Eur. J. Clin. Nutr. 2022, 76, 789–800. [Google Scholar] [CrossRef]
  20. Hess, J.M.; Robinson, K.; Scheett, A.J. Vegetarianísh—How “Flexitarian” Eating Patterns Are Defined and Their Role in Global Food-Based Dietary Guidance. Nutrients 2025, 17, 2369. [Google Scholar] [CrossRef]
  21. Jaeger, S.R.; Andersen, G.B.H.; Prescott, J. Omnivores, Flexitarians, Vegetarians, and Vegans Attach Different Importance to Eleven Motives for Daily Food Choice Decisions: Findings from 5111 UK Adults. Foods 2026, 15, 617. [Google Scholar] [CrossRef]
  22. Leitzmann, C.; Keller, M. Vegetarische und Vegane Ernährung, 4th ed.; Vollständig überarbeitete und Erweiterte Auflage; UTB, Bd 1868; Verlag Eugen Ulmer: Stuttgart, Germany, 2020. (In German) [Google Scholar]
  23. Tomé-Carneiro, J.; Visioli, F. Plant-based diets reduce blood pressure: A systematic review of recent evidence. Curr. Hypertens. Rep. 2023, 25, 127–150. [Google Scholar] [CrossRef]
  24. Koch, C.A.; Kjeldsen, E.W.; Frikke-Schmidt, R. Vegetarian or vegan diets and blood lipids: A meta-analysis of randomized trials. Eur. Heart J. 2023, 44, 2609–2622. [Google Scholar] [CrossRef]
  25. Najjar, R.S.; Feresin, R.G. Plant-based diets in the reduction of body fat: Physiological effects and biochemical insights. Nutrients 2019, 11, 2712. [Google Scholar] [CrossRef]
  26. Kahleova, H.; Levin, S.; Barnard, N. Cardio-metabolic benefits of plant-based diets. Nutrients 2017, 9, 848. [Google Scholar] [CrossRef] [PubMed]
  27. Neufingerl, N.; Eilander, A. Nutrient intake and status in adults consuming plant-based diets compared to meat-eaters: A systematic review. Nutrients 2021, 14, 29. [Google Scholar] [CrossRef]
  28. Bath, S.C. Plant-based diets for sustainability and health—But are we ignoring vital micronutrients? Proc. Nutr. Soc. 2025, 84, 216–224. [Google Scholar] [CrossRef]
  29. Leitzmann, C. Veganimus Grundlagen, Vorteile, Risiken München; Verlag C H Beck: Munich, Germany, 2018. [Google Scholar]
  30. Leitzmann, C. Vegetarian diets: What are the advantages? Forum Nutr. 2005, 57, 147–156. [Google Scholar]
  31. Shenkin, A. Micronutrients in health and disease. Postgrad. Med. J. 2006, 82, 559–567. [Google Scholar] [CrossRef]
  32. Black, R.E. Global distribution and disease burden related to micronutrient deficiencies. Nestlé Nutr. Inst. Workshop Ser. 2014, 78, 21–28. [Google Scholar]
  33. Hooper, L.; Ashton, K.; Harvey, L.J.; Decsi, T.; Fairweather-Tait, S.J. Assessing potential biomarkers of micronutrient status by using a systematic review methodology: Methods. Am. J. Clin. Nutr. 2009, 89, 1953S–1959S. [Google Scholar] [CrossRef]
  34. Richards, J.D.; Cori, H.; Rahn, M.; Finn, K.; Bárcena, J.; Kanellopoulos, A.K.; Péter, S.; Spooren, A. Micronutrient bioavailability: Concepts, influencing factors, and strategies for improvement. Front. Nutr. 2025, 12, 1646750. [Google Scholar] [CrossRef] [PubMed]
  35. Narayanam, H.; Chinni, S.V.; Samuggam, S. The impact of micronutrients—Calcium, vitamin D, selenium, zinc—In cardiovascular health: A mini review. Front. Physiol. 2021, 12, 742425. [Google Scholar] [CrossRef]
  36. Houston, M.C.; Harper, K.J. Potassium, magnesium, and calcium: Their role in both the cause and treatment of hypertension. J. Clin. Hypertens. 2008, 10, 3–11. [Google Scholar] [CrossRef] [PubMed]
  37. Rehman, S.; Jianglin, Z. Micronutrient deficiencies and cardiac health. Front. Nutr. 2022, 9, 1010737. [Google Scholar] [CrossRef]
  38. Wimalawansa, S.J. Associations of vitamin D with insulin resistance, obesity, type 2 diabetes, and metabolic syndrome. J. Steroid Biochem. Mol. Biol. 2018, 175, 177–189. [Google Scholar] [CrossRef] [PubMed]
  39. Strange, R.C.; Shipman, K.E.; Ramachandran, S. Metabolic syndrome: A review of the role of vitamin D in mediating susceptibility and outcome. World J. Diabetes 2015, 6, 896–911. [Google Scholar] [CrossRef]
  40. Dong, J.; Yang, S.; Zhuang, Q.; Sun, J.; Wei, P.; Zhao, X.; Chen, Y.; Chen, X.; Li, M.; Wei, L.; et al. The associations of lipid profiles with cardiovascular diseases and death in a 10-year prospective cohort study. Front. Cardiovasc. Med. 2021, 8, 745539. [Google Scholar] [CrossRef]
  41. Fuchs, F.D.; Whelton, P.K. High blood pressure and cardiovascular disease. Hypertension 2020, 75, 285–292. [Google Scholar] [CrossRef]
  42. Powell-Wiley, T.M.; Poirier, P.; Burke, L.E.; Després, J.P.; Gordon-Larsen, P.; Lavie, C.J.; Lear, S.A.; Ndumele, C.E.; Neeland, I.J.; Sanders, P.; et al. Obesity and cardiovascular disease: A scientific statement from the American Heart Association. Circulation 2021, 143, e984–e1010. [Google Scholar] [CrossRef] [PubMed]
  43. Khan, S.S.; Ning, H.; Wilkins, J.T.; Allen, N.; Carnethon, M.; Berry, J.D.; Sweis, R.N.; Lloyd-Jones, D.M. Association of body mass index with lifetime risk of cardiovascular disease and compression of morbidity. JAMA Cardiol. 2018, 3, 280–287. [Google Scholar] [CrossRef]
  44. Li, S.; Hou, L.; Zhu, S.; Yi, Q.; Liu, W.; Zhao, Y.; Wu, F.; Li, X.; Pan, A.; Song, P. Lipid variability and risk of cardiovascular diseases and all-cause mortality: A systematic review and meta-analysis of cohort studies. Nutrients 2022, 14, 2450. [Google Scholar] [CrossRef]
  45. Găman, M.A.; Dobrică, E.C.; Cozma, M.A.; Antonie, N.-I.; Stănescu, A.M.A.; Găman, A.M.; Diaconu, C.C. Crosstalk of magnesium and serum lipids in dyslipidemia and associated disorders: A systematic review. Nutrients 2021, 13, 1411. [Google Scholar] [CrossRef] [PubMed]
  46. Gholamzad, A.; Khakpour, N.; Kabipour, T.; Gholamzad, M. Association between serum vitamin D levels and lipid profiles: A cross-sectional analysis. Sci. Rep. 2023, 13, 21058. [Google Scholar] [CrossRef]
  47. Rai, K.N.; Kumari, N.S.; Gowda, K.M.D.; Kr, S. The evaluation of micronutrients and oxidative stress and their relationship with the lipid profile in healthy adults. J. Clin. Diagn. Res. 2013, 7, 1314–1318. [Google Scholar] [CrossRef]
  48. Saraswathy, K.N.; Joshi, S.; Yadav, S.; Garg, P.R. Metabolic distress in lipid and one-carbon metabolic pathway through low vitamin B-12: A population-based study from North India. Lipids Health Dis. 2018, 17, 96. [Google Scholar] [CrossRef] [PubMed]
  49. Nie, Q.; Wang, C.; Zhou, L. Association between serum selenium levels and lipids among people with and without diabetes. Nutrients 2023, 15, 3190. [Google Scholar] [CrossRef] [PubMed]
  50. Vahid, F.; Rahmani, W.; Davoodi, S.H.; Bohn, T. The micronutrient content of the diet is correlated with serum glucose biomarkers and lipid profile and is associated with the odds of being overweight/obese: A case–control study. Front. Nutr. 2023, 10, 1148183. [Google Scholar] [CrossRef]
  51. Mente, A.; Dehghan, M.; Rangarajan, S.; McQueen, M.; Dagenais, G.; Wielgosz, A.; Lear, S.; Li, W.; Chen, H.; Yi, S.; et al. Association of dietary nutrients with blood lipids and blood pressure in 18 countries: A cross-sectional analysis from the PURE study. Lancet Diabetes Endocrinol. 2017, 5, 774–787. [Google Scholar] [CrossRef] [PubMed]
  52. Kwon, Y.J.; Lee, S.; Lee, H.S.; Lee, J.W. Differing nutrient intake and dietary patterns according to the presence of hyper-low-density lipoprotein cholesterolemia or hypertriglyceridemia. Nutrients 2021, 13, 3008. [Google Scholar] [CrossRef] [PubMed]
  53. Morvaridzadeh, M.; Agah, S.; Alibakhshi, P.; Heydari, H.; Hoseini, A.S.; Palmowski, A.; Toupchian, O.; Abdollahi, S.; Rezamand, G.; Heshmati, J. Effects of calcium and vitamin D co-supplementation on the lipid profile: A systematic review and meta-analysis. Clin. Ther. 2021, 43, 274–296. [Google Scholar] [CrossRef]
  54. Ranasinghe, P.; Wathurapatha, W.S.; Ishara, M.H.; Jayawardana, R.; Galappatthy, P.; Katulanda, P.; Constantine, G.R. Effects of zinc supplementation on serum lipids: A systematic review and meta-analysis. Nutr. Metab. 2015, 12, 26. [Google Scholar] [CrossRef]
  55. Islam, M.Z.; Shamim, A.A.; Akhtaruzzaman, M.; Kärkkäinen, M.; Lamberg-Allardt, C. Effect of vitamin D, calcium and multiple micronutrients supplementation on lipid profile in pre-menopausal Bangladeshi garment factory workers with hypovitaminosis D. J. Health Popul. Nutr. 2014, 32, 687–695. [Google Scholar]
  56. Radkhah, N.; Zarezadeh, M.; Jamilian, P.; Ostadrahimi, A. The effect of vitamin D supplementation on lipid profiles: An umbrella review of meta-analyses. Adv. Nutr. 2023, 14, 1479–1498. [Google Scholar] [CrossRef]
  57. Storz, M.A.; Müller, A.; Niederreiter, L.; Zimmermann-Klemd, A.M.; Suarez-Alvarez, M.; Kowarschik, S.; Strittmatter, M.; Schlachter, E.; Pasluosta, C.; Huber, R.; et al. A cross-sectional study of nutritional status in healthy, young, physically-active German omnivores, vegetarians and vegans reveals adequate vitamin B12 status in supplemented vegans. Ann. Med. 2023, 55, 2269969. [Google Scholar] [CrossRef]
  58. World Health Organization (WHO). Cut-Off for BMI According to WHO Standards. Available online: https://gateway.euro.who.int/en/indicators/mn_survey_19-cut-off-for-bmi-according-to-who-standards/#id=32083 (accessed on 24 December 2025).
  59. Martin, M. (Ed.) Das Standardlabor in Der Naturheilkundlichen Praxis; Urban & Fischer in Elsevier: Munich, Germany, 2016; ISBN 978-3-437-56303-4. [Google Scholar]
  60. Berger, M.M.; Talwar, D.; Shenkin, A. Pitfalls in the interpretation of blood tests used to assess and monitor micronutrient nutrition status. Nutr. Clin. Pract. 2023, 38, 56–69. [Google Scholar] [CrossRef]
  61. Máčová, L.; Bičíková, M. Vitamin D: Current challenges between the laboratory and clinical practice. Nutrients 2021, 13, 1758. [Google Scholar] [CrossRef]
  62. Höller, U.; Bakker, S.J.L.; Düsterloh, A.; Frei, B.; Köhrle, J.; Konz, T.; Lietz, G.; McCann, A.; Michels, A.J.; Molloy, A.M.; et al. Micronutrient status assessment in humans: Current methods of analysis and future trends. TrAC Trends Anal. Chem. 2018, 102, 110–122. [Google Scholar] [CrossRef]
  63. Laur, N.; Kinscherf, R.; Pomytkin, K.; Kaiser, L.; Knes, O.; Deigner, H.P. ICP-MS trace element analysis in serum and whole blood. PLoS ONE 2020, 15, e0233357. [Google Scholar] [CrossRef] [PubMed]
  64. Kahoun, D.; Fojtíková, P.; Vácha, F.; Čížková, M.; Vodička, R.; Nováková, E.; Hypša, V. Development and validation of an LC-MS/MS method for determination of B vitamins and some of their derivatives in whole blood. PLoS ONE 2022, 17, e0271444. [Google Scholar] [CrossRef] [PubMed]
  65. Schulz-Ruhtenberg, N. Mikronährstoffe und Aminosäuren—Einsatz in der Sporternährung. Sportsnutrition 2014, 36–38. Available online: https://sportaerztezeitung.com/rubriken/ernaehrung/2474/mikronaehrstoffe-und-aminosaeuren/ (accessed on 28 April 2026).
  66. Nahrungsergänzungsmittel. 2021. Available online: https://sportaerztezeitung.com/rubriken/ernaehrung/7577/nahrungsergaenzungsmittel/ (accessed on 7 January 2021).
  67. Schultze, B.; Lind, P.M.; Larsson, A.; Lind, L. Whole blood and serum concentrations of metals in a Swedish population-based sample. Scand. J. Clin. Lab. Investig. 2014, 74, 143–148. [Google Scholar] [CrossRef]
  68. Gaffney-Stomberg, E. The impact of trace minerals on bone metabolism. Biol. Trace Elem. Res. 2019, 188, 26–34. [Google Scholar] [CrossRef]
  69. Berger, M.M.; Shenkin, A.; Dizdar, O.S.; Amrein, K.; Augsburger, M.; Biesalski, H.K.; Bischoff, S.C.; Casaer, M.P.; Gundogan, K.; Lepp, H.L.; et al. ESPEN practical short micronutrient guideline. Clin. Nutr. 2024, 43, 825–857. [Google Scholar] [CrossRef]
  70. Whelton, P.K.; Carey, R.M.; Aronow, W.S.; Casey, D.E.; Collins, K.J.; Himmelfarb, C.D.; DePalma, S.M.; Gidding, S.; Jamerson, K.A.; Jones, D.W.; et al. 2017 ACC/AHA/AAPA/ABC/ACPM/AGS/APhA/ASH/ASPC/NMA/PCNA Guideline for the Prevention, Detection, Evaluation, and Management of High Blood Pressure in Adults: Executive Summary. Hypertension 2018, 71, 1269–1324. [Google Scholar] [CrossRef]
  71. Millán, J.; Pintó, X.; Muñoz, A.; Zúñiga, M.; Rubiés-Prat, J.; Pallardo, L.F.; Masana, L.; Mangas, A.; Hernández-Mijares, A.; González-Santos, P.; et al. Lipoprotein ratios: Physiological significance and clinical usefulness in cardiovascular prevention. Vasc. Health Risk Manag. 2009, 5, 757–765. [Google Scholar]
  72. Harris, W.S. The omega-3 index: Clinical utility for therapeutic intervention. Curr. Cardiol. Rep. 2010, 12, 503–508. [Google Scholar] [CrossRef]
  73. von Schacky, C. Omega-3 index and cardiovascular health. Nutrients 2014, 6, 799–814. [Google Scholar] [CrossRef]
  74. McKay, J.; Ho, S.; Jane, M.; Pal, S. Overweight and obese Australian adults and micronutrient deficiency. BMC Nutr. 2020, 6, 12. [Google Scholar] [CrossRef]
  75. Benjamini, Y.; Hochberg, Y. Controlling the false discovery rate: A practical and powerful approach to multiple testing. J. R. Stat. Soc. Ser. B Methodol. 1995, 57, 289–300. [Google Scholar] [CrossRef]
  76. Yokoyama, Y.; Nishimura, K.; Barnard, N.D.; Takegami, M.; Watanabe, M.; Sekikawa, A.; Okamura, T.; Miyamoto, Y. Vegetarian diets and blood pressure: A meta-analysis. JAMA Intern. Med. 2014, 174, 577–587. [Google Scholar] [CrossRef]
  77. Shariq, O.A.; McKenzie, T.J. Obesity-related hypertension: A review of pathophysiology, management, and the role of metabolic surgery. Gland Surg. 2020, 9, 80–93. [Google Scholar] [CrossRef] [PubMed]
  78. López-Moreno, M.; Castillo-García, A.; Roldán-Ruiz, A.; Viña, I.; Bertotti, G. Plant-based diet and risk of iron-deficiency anemia: A review of the current evidence and implications for preventive strategies. Curr. Nutr. Rep. 2025, 14, 81. [Google Scholar] [CrossRef] [PubMed]
  79. Haider, L.M.; Schwingshackl, L.; Hoffmann, G.; Ekmekcioglu, C. The effect of vegetarian diets on iron status in adults: A systematic review and meta-analysis. Crit. Rev. Food Sci. Nutr. 2018, 58, 1359–1374. [Google Scholar] [CrossRef] [PubMed]
  80. Tong, T.Y.N.; Key, T.J.; Gaitskell, K.; Green, T.J.; Guo, W.; A Sanders, T.; E Bradbury, K. Hematological parameters and prevalence of anemia in white and British Indian vegetarians and nonvegetarians in the UK Biobank. Am. J. Clin. Nutr. 2019, 110, 461–472. [Google Scholar] [CrossRef]
  81. Pawlak, R.; Lester, S.E.; Babatunde, T. The prevalence of cobalamin deficiency among vegetarians assessed by serum vitamin B12: A review of literature. Eur. J. Clin. Nutr. 2014, 68, 541–548. [Google Scholar] [CrossRef]
  82. Bakaloudi, D.; Halloran, A.; Rippin, H.; Oikonomidou, A.C.; Dardavesis, T.I.; Williams, J.; Wickramasinghe, K.; Breda, J.; Chourdakis, M. Intake and adequacy of the vegan diet. A systematic review of the evidence. Clin. Nutr. 2020, 40, 3503–3521. [Google Scholar] [CrossRef] [PubMed]
  83. Weikert, C.; Trefflich, I.; Menzel, J.; Obeid, R.; Longree, A.; Dierkes, J.; Meyer, K.; Herter-Aeberli, I.; Mai, K.; Stangl, G.I.; et al. Vitamin and mineral status in a vegan diet. Dtsch. Arztebl. Int. 2020, 117, 575–582. [Google Scholar] [CrossRef]
  84. Schüpbach, R.; Wegmüller, R.; Berguerand, C.; Bui, M.; Herter-Aeberli, I. Micronutrient status and intake in omnivores, vegetarians and vegans in Switzerland. Eur. J. Nutr. 2017, 56, 283–293. [Google Scholar] [CrossRef]
  85. Niklewicz, A.; Smith, A.D.; Smith, A.; Holzer, A.; Klein, A.; McCaddon, A.; Molloy, A.M.; Wolffenbuttel, B.H.R.; Nexo, E.; McNulty, H.; et al. The importance of vitamin B12 for individuals choosing plant-based diets. Eur. J. Nutr. 2023, 62, 1551–1559. [Google Scholar] [CrossRef]
  86. EFSA Panel on Additives and Products or Substances Used in Animal Feed (FEEDAP); Bampidis, V.; Azimonti, G.; Bastos, M.L.; Christensen, H.; Dusemund, B.; Durjava, M.; Kouba, M.; López-Alonso, M.; López Puente, S.; et al. Safety and efficacy of a feed additive consisting of vitamin B12 (cyanocobalamin) produced by fermentation with Ensifer adhaerens CGMCC 19596 for all animal species (Hebei Huarong Pharmaceutical Co., Ltd.). EFSA J. 2023, 21, e07972. [Google Scholar] [CrossRef]
  87. Wang, R.; Bai, Y.; Yang, Y.; Wu, X.; Li, R. A Comparison of Production Performance, Egg Quality, and Cecal Microbiota in Laying Hens Receiving Graded Levels of Vitamin B12. Front. Vet. Sci. 2021, 8, 712183. [Google Scholar] [CrossRef]
  88. Wang, R.; Bai, Y.; Yang, Y. Effects of Dietary Supplementation of Different Levels of Vitamin B12 on the Liver Metabolism of Laying Hens. J. Sci. Food Agric. 2022, 102, 5787–5794. [Google Scholar] [CrossRef]
  89. Mahan, D.C.; Carter, S.D.; Cline, T.R.; Hill, G.M.; Kim, S.W.; Miller, P.S.; Nelssen, J.L.; Stein, H.H.; Veum, T.L.; North Central Coordinating Committee on Swine Nutrition (NCCC-42). Evaluating the Effects of Supplemental B Vitamins in Practical Swine Diets during the Starter and Grower-Finisher Periods—A Regional Study. J. Anim. Sci. 2007, 85, 2190–2197. [Google Scholar] [CrossRef] [PubMed]
  90. Blodgett, S.S.; Miller, P.S.; Fischer, R.L. Vitamin B12 Requirement for Weanling Pigs. Neb. Swine Rep. 2003, 53. Available online: https://digitalcommons.unl.edu/coopext_swine/53 (accessed on 28 April 2026).
  91. Hoy, M.K.; Goldman, J.D. Potassium intake of the U.S. population: What we eat in America, NHANES 2009–2010. In FSRG Dietary Data Briefs; United States Department of Agriculture (USDA): Beltsville, MD, USA, 2012; Dietary Data Brief No. 10. Available online: https://www.ncbi.nlm.nih.gov/books/NBK589562/ (accessed on 24 December 2025).
  92. Palmer, B.F.; Colbert, G.; Clegg, D.J. Potassium homeostasis, chronic kidney disease, and plant-enriched diets. Kidney360 2020, 1, 65–71. [Google Scholar] [CrossRef] [PubMed]
  93. Holick, M.F. Vitamin D deficiency. N. Engl. J. Med. 2007, 357, 266–281. [Google Scholar] [CrossRef]
  94. Brett, A.S. Standard Definition of Vitamin D Deficiency Is Challenged. 2017. Available online: https://www.jwatch.org/na44769/2017/08/15/standard-definition-vitamin-d-deficiency-challenged (accessed on 7 January 2024).
  95. Forouhi, N.G.; Luan, J.; Cooper, A.; Boucher, B.J.; Wareham, N.J. Baseline serum 25-hydroxy vitamin D is predictive of future glycemic status and insulin resistance: The Medical Research Council Ely Prospective Study 1990–2000. Diabetes 2008, 57, 2619–2625. [Google Scholar] [CrossRef] [PubMed]
  96. Kahwati, L.C.; Weber, R.P.; Pan, H.; Gourlay, M.; Leblanc, E.; Coker-Schwimmer, M.; Viswanathan, M. Vitamin D, Calcium, or Combined Supplementation for the Primary Prevention of Fractures in Community-Dwelling Adults: An Evidence Review for the U.S. Preventive Services Task Force; Agency for Healthcare Research and Quality: Rockville, MD, USA, 2018; Evidence Synthesis No. 160. Appendix A, Table 1: Serum Vitamin D Level Reference Ranges. Available online: https://www.ncbi.nlm.nih.gov/books/NBK525404/table/app_1/ (accessed on 28 April 2026).
  97. Saternus, R.; Vogt, T.; Reichrath, J. A critical appraisal of strategies to optimize vitamin D status in Germany, a population with a Western diet. Nutrients 2019, 11, 2682. [Google Scholar] [CrossRef]
  98. Pilz, S.; März, W.; Cashman, K.D.; Kiely, M.E.; Whiting, S.J.; Holick, M.F.; Grant, W.B.; Pludowski, P.; Hiligsmann, M.; Trummer, C.; et al. Rationale and plan for vitamin D food fortification: A review and guidance paper. Front. Endocrinol. 2018, 9, 373. [Google Scholar] [CrossRef] [PubMed]
  99. Foster, M.; Chu, A.; Petocz, P.; Samman, S. Effect of vegetarian diets on zinc status: A systematic review and meta-analysis of studies in humans. J. Sci. Food Agric. 2013, 93, 2362–2371. [Google Scholar] [CrossRef] [PubMed]
  100. Li, Y.; Liang, J.; Chen, Y.; Wang, Y. The mechanism of copper homeostasis and its role in disease. iLABMED 2023, 1, 109–120. [Google Scholar] [CrossRef]
  101. Babić, Ž.; Tariba, B.; Kovačić, J.; Pizent, A.; Varnai, V.M.; Macan, J. Relevance of serum copper elevation induced by oral contraceptives: A meta-analysis. Contraception 2013, 87, 790–800. [Google Scholar] [CrossRef]
  102. Chiu, H.F.; Venkatakrishnan, K.; Golovinskaia, O.; Wang, C.K. Impact of micronutrients on hypertension: Evidence from clinical trials with a special focus on meta-analysis. Nutrients 2021, 13, 588. [Google Scholar] [CrossRef]
  103. Li, S.; Chen, F.; Li, T.; Cheng, Y.; Huang, G.; Hou, D.; Liu, W.; Xu, T.; Liu, J. Higher serum ferritins are associated with higher blood pressure: A cross-sectional study. Medicine 2024, 103, e37485. [Google Scholar] [CrossRef]
  104. Zhao, L.; Yang, N.; Song, Y.; Si, H.; Qin, Q.; Guo, Z. Effect of iron overload on endothelial cell calcification and its mechanism. Ann. Transl. Med. 2021, 9, 1658. [Google Scholar] [CrossRef]
  105. Wang, H.; Huang, Z.; Du, C.; Dong, M. Iron dysregulation in cardiovascular diseases. Rev. Cardiovasc. Med. 2024, 25, 16. [Google Scholar] [CrossRef]
  106. Yan, F.; Li, K.; Xing, W.; Dong, M.; Yi, M.; Zhang, H. Role of iron-related oxidative stress and mitochondrial dysfunction in cardiovascular diseases. Oxid. Med. Cell. Longev. 2022, 2022, 5124553. [Google Scholar] [CrossRef]
  107. Miao, Q.; Zhang, J.; Yun, Y.; Wu, W.; Luo, C. Association between copper intake and essential hypertension: Dual evidence from Mendelian randomization analysis and the NHANES database. Front. Nutr. 2024, 11, 1454669. [Google Scholar] [CrossRef] [PubMed]
  108. Xu, H.; Liu, Z.; Yao, B.; Xu, Z. The impact of dietary copper intake on cardiovascular morbidity and mortality among hypertensive patients: A longitudinal analysis from NHANES (2001–2018). BMC Public Health 2025, 25, 936. [Google Scholar] [CrossRef]
  109. Kuria, A.; Tian, H.; Li, M.; Wang, Y.; Aaseth, J.O.; Zang, J.; Cao, Y. Selenium status in the body and cardiovascular disease: A systematic review and meta-analysis. Crit. Rev. Food Sci. Nutr. 2021, 61, 3616–3625. [Google Scholar] [CrossRef] [PubMed]
  110. Li, Z.; Wang, W.; Liu, H.; Li, S.; Zhang, D. The association of serum zinc and copper with hypertension: A meta-analysis. J. Trace Elem. Med. Biol. 2019, 53, 41–48. [Google Scholar] [CrossRef] [PubMed]
  111. Chu, A.; Foster, M.; Samman, S. Zinc status and risk of cardiovascular diseases and type 2 diabetes mellitus—A systematic review of prospective cohort studies. Nutrients 2016, 8, 707. [Google Scholar] [CrossRef]
  112. Morgan, J.; Roberts, W.; Lyson, H.; Meadows, M.; Ofili, E.; Gulati, M.; Michos, E.D. Blood pressure reduction by gender and menopause status among hypertensive participants of a mobile health cardiovascular risk self-management program. Am. J. Prev. Cardiol. 2025, 23, 101057. [Google Scholar] [CrossRef]
  113. Alhawari, H.; Alzoubi, O.; Alshelleh, S.; Alfaris, L.; Abdulelah, M.; AlRyalat, S.A.; Altarawneh, S.; Alzoubi, M. Blood pressure difference between pre- and post-menopausal women and age-matched men: A cross-sectional study at a tertiary center. J. Clin. Hypertens. 2024, 26, 1368–1374. [Google Scholar] [CrossRef]
  114. Laurent, S.; Boutouyrie, P. Arterial stiffness and hypertension in the elderly. Front. Cardiovasc. Med. 2020, 7, 544302. [Google Scholar] [CrossRef]
  115. Seals, D.R.; Jablonski, K.L.; Donato, A.J. Aging and vascular endothelial function in humans. Clin. Sci. 2011, 120, 357–375. [Google Scholar] [CrossRef]
  116. Cunningham, C.; O’Sullivan, R.; Caserotti, P.; Tully, M.A. Consequences of physical inactivity in older adults: A systematic review of reviews and meta-analyses. Scand. J. Med. Sci. Sports 2020, 30, 816–827. [Google Scholar] [CrossRef] [PubMed]
  117. Paolisso, G.; Gambardella, A.; Balbi, V.; Ammendola, S.; D’Amore, A.; Varricchio, M. Body composition, body fat distribution, and resting metabolic rate in healthy centenarians. Am. J. Clin. Nutr. 1995, 62, 746–750. [Google Scholar] [CrossRef]
  118. Briand, M.; Raffin, J.; Gonzalez-Bautista, E.; Ritz, P.; Abellan Van Kan, G.; Pillard, F.; Faruch-Bilfeld, M.; Guyonnet, S.; Dray, C.; Vellas, B.; et al. Body composition and aging: Cross-sectional results from the INSPIRE study in people 20 to 93 years old. Geroscience 2025, 47, 863–875. [Google Scholar] [CrossRef]
  119. Koceva, A.; Herman, R.; Janez, A.; Rakusa, M.; Jensterle, M. Sex- and gender-related differences in obesity: From pathophysiological mechanisms to clinical implications. Int. J. Mol. Sci. 2024, 25, 7342. [Google Scholar] [CrossRef] [PubMed]
  120. Flegal, K.M.; Carroll, M.D.; Kit, B.K.; Ogden, C.L. Prevalence of obesity and trends in the distribution of body mass index among US adults, 1999–2010. JAMA 2012, 307, 491–497. [Google Scholar] [CrossRef] [PubMed]
  121. Peabody, T. Association of Micronutrient Inadequacy and Body Mass Index in Young Adults. Bachelor’s Thesis, University of Arkansas, Fayetteville, NA, USA, 2020. Available online: https://scholarworks.uark.edu/hnhiuht/12 (accessed on 24 December 2025).
  122. Kimmons, J.E.; Blanck, H.M.; Tohill, B.C.; Zhang, J.; Khan, L.K. Associations between body mass index and the prevalence of low micronutrient levels among US adults. MedGenMed 2006, 8, 59. [Google Scholar]
  123. Schauer, M.; Mair, S.; Motevalli, M.; Tanous, D.; Burtscher, M.; Wirnitzer, K. Health patterns across adulthood: An age-based investigation of the nutritional status, homocysteine, and CoQ10 of bank staff. Clin. Pract. 2024, 14, 443–460. [Google Scholar] [CrossRef]
  124. Schauer, M.; Burtscher, M.; Motevalli, M.; Tanous, D.; Mair, S.; Wirnitzer, K. Gender disparities in health biomarkers, lifestyle patterns, and nutritional status among bank staff: A cross-sectional study. Medicina 2024, 60, 413. [Google Scholar] [CrossRef]
  125. García, O.P.; Long, K.Z.; Rosado, J.L. Impact of micronutrient deficiencies on obesity. Nutr. Rev. 2009, 67, 559–572. [Google Scholar] [CrossRef]
  126. Delle Monache, S.; Di Fulvio, P.; Iannetti, E.; Valerii, L.; Capone, L.; Nespoli, M.G.; Bologna, M.; Angelucci, A. Body mass index represents a good predictor of vitamin D status in women independently from age. Clin. Nutr. 2019, 38, 829–834. [Google Scholar] [CrossRef]
  127. Oliai Araghi, S.; Braun, K.V.E.; van der Velde, N.; van Dijk, S.C.; van Schoor, N.M.; Zillikens, M.C.; de Groot, L.C.P.G.M.; Uitterlinden, A.G.; Stricker, B.H.; Voortman, T.; et al. B-vitamins and body composition: Integrating observational and experimental evidence from the B-PROOF study. Eur. J. Nutr. 2020, 59, 1253–1262. [Google Scholar] [CrossRef]
  128. Seifu, C.N.; Fahey, P.P.; Atlantis, E. Micronutrient deficiencies and anaemia associated with body mass index in Australian adults: A cross-sectional study. BMJ Open 2022, 12, e061442. [Google Scholar] [CrossRef] [PubMed]
  129. Motevalli, M.; Tanous, D.R.; Drenowatz, C.; Schauer, M.; Mair, S.; Kohlberger, M.; Ruedl, G.; Wirnitzer, K. Sex-based analysis of health and micronutrient status in Austrian adults focusing on the role of blood micronutrients in predicting blood lipids and body composition. Dietetics 2025, 4, 45. [Google Scholar] [CrossRef]
  130. Motevalli, M.; Tanous, D.R.; Drenowatz, C.; Schauer, M.; Mair, S.; Kohlberger, M.; Ruedl, G.; Wirnitzer, K. The association of blood micronutrients with blood lipids and body composition in young and older Austrian adults. Dietetics 2025, 4, 59. [Google Scholar] [CrossRef]
  131. Crider, K.S.; Yang, T.P.; Berry, R.J.; Bailey, L.B. Folate and DNA methylation: A review of molecular mechanisms and the evidence for folate’s role. Adv. Nutr. 2012, 3, 21–38. [Google Scholar] [CrossRef] [PubMed]
  132. Siatka, T.; Mátuš, M.; Moravcová, M.; Harčárová, P.; Lomozová, Z.; Matoušová, K.; Suwanvecho, C.; Krčmová, L.K.; Mladěnka, P. Biological, dietetic and pharmacological properties of vitamin B9. NPJ Sci. Food 2025, 9, 30. [Google Scholar] [CrossRef]
  133. Bennour, I.; Haroun, N.; Sicard, F.; Mounien, L.; Landrier, J.F. Vitamin D and obesity/adiposity—A brief overview of recent studies. Nutrients 2022, 14, 2049. [Google Scholar] [CrossRef]
  134. Lee, M.J. Vitamin D enhancement of adipose biology: Implications on obesity-associated cardiometabolic diseases. Nutrients 2025, 17, 586. [Google Scholar] [CrossRef]
  135. Carrelli, A.; Bucovsky, M.; Horst, R.; Cremers, S.; Zhang, C.; Bessler, M.; Schrope, B.; Evanko, J.; Blanco, J.; Silverberg, S.J.; et al. Vitamin D storage in adipose tissue of obese and normal weight women. J. Bone Miner. Res. 2017, 32, 237–242. [Google Scholar] [CrossRef]
  136. EFSA Panel on Nutrition, Novel Foods and Food Allergens (NDA); Turck, D.; Bohn, T.; Castenmiller, J.; de Henauw, S.; Hirsch-Ernst, K.; Knutsen, H.K.; Maciuk, A.; Mangelsdorf, I.; McArdle, H.J.; et al. Scientific opinion on the tolerable upper intake level for vitamin B6. EFSA J. 2023, 21, e08006. [Google Scholar] [CrossRef]
  137. Clemente-Suárez, V.J.; Beltrán-Velasco, A.I.; Redondo-Flórez, L.; Martín-Rodríguez, A.; Tornero-Aguilera, J.F. Global impacts of Western diet and its effects on metabolism and health: A narrative review. Nutrients 2023, 15, 2749. [Google Scholar] [CrossRef] [PubMed]
  138. Toprak, U. Lipid metabolism in relation to calcium homeostasis. In Advances in Experimental Medicine and Biology; Springer: Cham, Switzerland, 2025; pp. 1–12. [Google Scholar] [CrossRef]
  139. Soares, M.J.; She-Ping-Delfos, W.L. Postprandial energy metabolism in the regulation of body weight: Is there a mechanistic role for dietary calcium? Nutrients 2010, 2, 586–598. [Google Scholar] [CrossRef] [PubMed]
  140. Akimbekov, N.S.; Coban, S.O.; Atfi, A.; Razzaque, M.S. The role of magnesium in pancreatic beta-cell function and homeostasis. Front. Nutr. 2024, 11, 1458700. [Google Scholar] [CrossRef]
  141. Piuri, G.; Zocchi, M.; Della Porta, M.; Ficara, V.; Manoni, M.; Zuccotti, G.V.; Pinotti, L.; Maier, J.A.; Cazzola, R. Magnesium in obesity, metabolic syndrome, and type 2 diabetes. Nutrients 2021, 13, 320. [Google Scholar] [CrossRef]
  142. Jakše, N.; FidlerMis, Z.; Fras, D.R.; Tanous, K.; Wirnitzer, K. Effects of vegan diets and lifestyle on adult body composition: A narrative review. Food Funct. 2025, 16, 5994–6027. [Google Scholar] [CrossRef]
Figure 1. Procedure of participants’ involvement and classification of dietary subgroups. Note: Plant-forward dieters refer to the pooled dietary subgroup of flexitarians, vegetarians, and vegans.
Dietetics 05 00028 g001
Table 1. Sociodemographic and lifestyle characteristics, stratified by dietary pattern.
Overall
(N = 488)
Omnivores
(n = 260)
Plant-Forward
Dieters
(n = 228)
Statistics
Age (years)38 (IQR 21)38 (IQR 19)38 (IQR 22)F(1, 486) = 0.22,
p = 0.638
Body Weight (kg)75 ± 1578 ± 1671 ± 13F(1, 486) = 30.77,
p < 0.001
Height (cm)174 ± 9175 ± 9173 ± 9F(1, 486) = 8.43,
p = 0.004
BMI (kg/m2)23.8 (IQR 5)24.4 (IQR 5.3)23.2 (IQR 3.5)F(1, 486) = 26.57,
p < 0.001
Sexfemales
males
48%
52%
41%
59%
55%
45%
χ2(1) = 10.23,
p = 0.001
Age categories<50 y
≥50 y
55%
45%
79%
21%
76%
24%
χ2(1) = 0.60,
p = 0.439
BMI Level<18.5
18.5–24.9
25.0–29.9
≥30.0
1%
66%
25%
8%
<1%
55%
33%
12%
2%
78%
17%
4%
χ2(3) = 33.04,
p < 0.001
Education Level compulsory
high school
university
26%
35%
39%
28%
37%
35%
24%
33%
43%
χ2(2) = 3.65,
p = 0.161
Dominant
Work Posture
sitting
standing
movement
82%
5%
13%
81%
5%
13%
83%
4%
13%
χ2(2) = 0.65,
p = 0.721
PA Levellow
moderate
high
51%
35%
11%
59%
32%
9%
41%
45%
14%
χ2(2) = 15.82,
p < 0.001
Region of Austriaeastern
western
55%
45%
48%
52%
62%
38%
χ2(1) = 8.78,
p = 0.003
Supplement Intakeyes
no
77%
23%
75%
25%
78%
22%
χ2(1) = 0.49,
p = 0.484
Medication Intakeyes
no
5%
95%
5%
95%
6%
94%
χ2(1) = 0.12,
p = 0.731
Alcohol Intakeregular
occasional
never
31%
63%
6%
34%
60%
5%
28%
66%
6%
χ2(2) = 2.14,
p = 0.343
Smokingregular
occasional
never
13%
30%
57%
15%
28%
58%
10%
32%
58%
χ2(2) = 2.90,
p = 0.234
Note. Values are reported as proportions (%), medians with interquartile ranges (IQR), or means (±standard deviation). Inferential analyses were conducted using Pearson’s chi-square tests (χ2) for categorical variables and Wilcoxon rank-based procedures with F statistics for continuous measures. BMI: body mass index; PA: physical activity.
Table 2. Participants’ health and blood biomarkers, stratified by dietary pattern.
Overall
(N = 488)
Omnivores
(n = 260)
Plant-Forward
Dieters (n = 228)
Statistics
Blood Pressuresystolic137 ± 17139 ± 17135 ± 17F(1, 486) = 9.15,
p = 0.003
diastolic86 ± 1088 ± 1084 ± 10F(1, 486) = 20.80,
p < 0.001
Blood Pressure Levelsnormal
systolic elevated
diastolic elevated
elevated
53%
14%
11%
22%
47%
12%
11%
29%
59%
16%
11%
15%
χ2(3) = 15.18,
p = 0.002
Leucocytes (cells/nL)5.90 ± 1.525.97 ± 1.385.82 ± 1.66F(1, 486) = 3.06,
p = 0.081
Erythrocytes (cells/pL)4.70 ± 0.424.75 ± 0.394.64 ± 0.44F(1, 486) = 9.56,
p = 0.002
Haematocrit (V%)42.8 ± 3.744.4 ± 3.442.2 ± 3.9F(1, 486) = 16.12,
p < 0.001
Platelets (cells/pL)254 ± 55257 ± 54250 ± 57F(1, 486) = 2.40,
p = 0.122
Mean Platelet Volume (fL)9.24 ± 0.949.24 ± 0.939.23 ± 0.95F(1, 486) = 0.00,
p = 0.982
Haemoglobin (g/dL)14.22 ± 1.3214.41 ± 1.2313.99 ± 1.39F(1, 486) = 14.64,
p < 0.001
Ferritin (ng/mL)86.3 ± 85.3102.0 ± 95.868.5 ± 67.2F(1, 486) = 20.18,
p < 0.001
Soluble Transferrin Receptor (mg/L)3.06 ± 1.343.03 ± 0.943.10 ± 1.68F(1, 486) = 0.76,
p = 0.383
Ferritin index2.06 ± 2.841.84 ± 1.352.32 ± 3.89F(1, 486) = 5.93,
p = 0.015
Homocysteine (µmol/L)11.75 ± 4.8811.84 ± 4.5911.63 ± 5.20F(1, 486) = 1.04,
p = 0.308
Mean Corpuscular Volume (fL)91.25 ± 4.2991.42 ± 4.1191.05 ± 4.47F(1, 486) = 0.69,
p = 0.408
Mean Corpuscular Haemoglobin (pg)30.28 ± 1.6230.34 ± 1.5130.20 ± 1.74F(1, 486) = 0.45,
p = 0.503
Mean Corpuscular Haemoglobin Concentration (g/dL Ery)33.18 ± 0.7433.19 ± 0.7233.16 ± 0.75F(1, 486) = 0.15,
p = 0.698
Cholesterol (mg/dL)209 ± 38213 ± 35204 ± 41F(1, 486) = 9.48,
p = 0.002
LDL (mg/dL)131.1 ± 37.3137.5 ± 35.6123.8 ± 38.0F(1, 486) = 15.71,
p < 0.001
HDL (mg/dL)64.7 ± 17.463.3 ± 16.166.4 ± 18.6F(1, 486) = 3.18,
p = 0.075
LDL-HDL Index2.20 ± 0.922.35 ± 0.932.03 ± 0.89F(1, 486) = 14.79,
p < 0.001
Triglycerides (mg/dL)98 ± 56100 ± 5095 ± 61F(1, 486) = 3.06,
p = 0.081
Lipoprotein A (g/L)0.27 ± 0.360.27 ± 0.360.26 ± 0.35F(1, 486) = 0.08,
p = 0.780
C-reactive Protein (mg/L)1.39 ± 2.601.44 ± 2.521.33 ± 2.69F(1, 486) = 4.74,
p = 0.030
EPA (% total FAs)0.87 ± 0.450.83 ± 0.420.91 ± 0.49F(1, 486) = 3.33,
p = 0.069
DHA (% total FAs)5.30 ± 1.285.30 ± 1.235.30 ± 1.34F(1, 486) = 0.01,
p = 0.927
Omega-3 Index (% total FAs)6.17 ± 1.546.14 ± 1.466.21 ± 1.64F(1, 486) = 0.13,
p = 0.720
Coenzyme Q10 (mg/L)0.88 ± 0.260.90 ± 0.260.86 ± 0.25F(1, 486) = 4.83,
p = 0.028
Adjusted CoQ10 (µmol/mmol Chol)0.19 ± 0.040.19 ± 0.040.19 ± 0.04F(1, 486) = 0.06,
p = 0.805
Note. Values are reported as proportions (%) or means (±standard deviation). Inferential analyses were conducted using Pearson’s chi-square tests (χ2) for categorical variables and Wilcoxon rank-based procedures with F statistics for continuous measures. HDL: high-density lipoprotein. LDL: low-density lipoprotein. EPA: eicosapentaenoic acid. DHA: docosahexaenoic acid.
Table 3. Participants’ absolute and standardized micronutrient values, stratified by dietary pattern.
Absolute ValuesStandardized Values *
Omnivores
(n = 260)
Plant-Forward Dieters
(n = 228)
StatisticsOmnivores
(n = 260)
Plant-Forward Dieters
(n = 228)
Statistics
Vitamin B6 (µg/L)33.65 ± 31.6032.17 ± 19.70W(1, 486) = 0.04,
p = 0.847
−0.51 ± 0.54−0.52 ± 0.53F(1, 486) = 0.04,
p = 0.849, q = 0.849
Vitamin B9 (ng/mL)8.49 ± 4.6510.29 ± 10.19W(1, 486) = 3.84,
p = 0.051
1.79 ± 1.011.96 ± 0.97F(1, 486) = 3.87,
p = 0.050, q = 0.108
Vitamin B12 (pg/mL)429.97 ± 157.5392.77 ± 139.4W(1, 486) = 8.37,
p = 0.004
−0.37 ± 0.45−0.48 ± 0.40F(1, 486) = 8.33,
p = 0.004, q = 0.026
Vitamin D (nmol/L)50.37 ± 26.6656.42 ± 33.37W(1, 486) = 3.41,
p = 0.065
−1.66 ± 0.69−1.50 ± 0.89F(1, 486) = 3.42,
p = 0.065, q = 0.120
Potassium (mg/L)1774.5 ± 125.81727.2 ± 147.1W(1, 486) = 14.45, p < 0.0010.72 ± 0.640.53 ± 0.77F(1, 486) = 7.56,
p = 0.006, q = 0.026
Calcium (mg/L)55.20 ± 3.5455.78 ± 3.55W(1, 486) = 3.52,
p = 0.061
−0.17 ± 0.67−0.15 ± 0.69F(1, 486) = 0.12, p = 0.726, q = 0.786
Magnesium (mg/L)34.37 ± 2.9733.51 ± 3.24W(1, 486) = 11.83,
p = 0.001
0.03 ± 0.74−0.13 ± 0.79F(1, 486) = 7.53, p = 0.006, q = 0.026
Copper (mg/L)0.86 ± 0.160.85 ± 0.15W(1, 486) = 0.49,
p = 0.486
−0.15 ± 0.76−0.32 ± 0.73F(1, 486) = 7.19, p = 0.008, q = 0.026
Iron (mg/L)510.02 ± 46.99494.85 ± 53.05W(1, 486) = 13.05,
p < 0.001
0.47 ± 0.680.33 ± 0.78F(1, 486) = 4.19, p = 0.041, q = 0.106
Zinc (mg/L)6.19 ± 0.656.04 ± 0.73W(1, 486) = 5.02,
p = 0.025
0.35 ± 0.640.26 ± 0.74F(1, 486) = 2.00, p = 0.158, q = 0.228
Selenium (µg/L)133.72 ± 22.33136.30 ± 26.74W(1, 486) = 0.43,
p = 0.513
0.43 ± 0.770.50 ± 0.85F(1, 486) = 0.42,
p = 0.515, q = 0.608
Manganese (µg/L)9.01 ± 3.058.79 ± 2.79W(1, 486) = 0.50,
p = 0.480
0.14 ± 0.840.03 ± 0.78F(1, 486) = 2.02,
p = 0.156, q = 0.228
Molybdenum (µg/L)1.16 ± 0.881.09 ± 0.61W(1, 486) = 1.31,
p = 0.252
0.20 ± 0.930.12 ± 0.93F(1, 486) = 1.31,
p = 0.252, q = 0.327
*: Standardization was performed using reference intervals established for German-speaking adult populations [59], with values within the physiological range rescaled from −1 (lower boundary) to +1 (upper boundary). Results are expressed as means ± standard deviations. Group comparisons were conducted using Wilcoxon rank-based tests with F statistics.
Table 4. Participants’ blood micronutrient status (below norm, within norm, above norm), stratified by dietary patterns.
Status *Omnivores
(n = 260)
Plant-Forward
Dieters
(n = 228)
Statistics
Potassium (mg/L)normal
<norm
>norm
76% (197)
2% (5)
22% (58)
79% (180)
5% (12)
16% (36)
χ2(2) = 6.73,
p = 0.035
Calcium (mg/L)normal
<norm
>norm
83% (215)
14% (36)
3% (9)
85% (193)
11% (25)
4% (10)
χ2(2) = 1.13,
p = 0.569
Magnesium (mg/L)normal
<norm
>norm
81% (211)
10% (27)
8% (22)
80% (182)
14% (31)
17% (15)
χ2(2) = 1.65,
p = 0.438
Copper (mg/L)normal
<norm
>norm
80% (208)
10% (27)
10% (25)
79% (181)
14% (33)
6% (14)
χ2(2) = 3.49,
p = 0.174
Iron (mg/L)normal
<norm
>norm
86% (223)
5% (12)
10% (25)
82% (186)
9% (21)
9% (21)
χ2(2) = 4.07,
p = 0.131
Zinc (mg/L)normal
<norm
>norm
87% (227)
5% (12)
8% (21)
83% (189)
7% (17)
10% (22)
χ2(2) = 2.27,
p = 0.322
Selenium (µg/L)normal
<norm
>norm
90% (223)
5% (12)
6% (15)
87% (198)
5% (12)
8% (18)
χ2(2) = 1.02,
p = 0.600
Manganese (µg/L)normal
<norm
>norm
78% (204)
8% (20)
14% (36)
81% (184)
8% (19)
11% (25)
χ2(2) = 0.95,
p = 0.623
Molybdenum (µg/L)normal
<norm
>norm
82% (212)
3% (9)
15% (39)
83% (190)
4% (9)
13% (29)
χ2(2) = 0.58,
p = 0.749
Vitamin B6 (µg/L)normal
<norm
>norm
95% (247)
2% (6)
3% (7)
96% (219)
1% (3)
3% (6)
χ2(2) = 0.66,
p = 0.718
Vitamin B9 (ng/mL)normal
<norm
>norm
74% (192)
26% (68)
N.A.
80% (182)
20% (46)
N.R.
χ2(1) = 2.43,
p = 0.119
Vitamin B12 (pg/mL) normal
<norm
>norm
97% (253)
0 (0)
3% (7)
96% (220)
3% (6)
<1% (2)
χ2(2) = 9.02,
p = 0.011
Vitamin D (nmol/L)normal
<norm
>norm
3% (9)
96% (249)
<1% (2)
4% (10)
93% (211)
3% (7)
χ2(2) = 3.89,
p = 0.143
*: Classification of blood micronutrient status was performed using reference intervals established for German-speaking adult populations [59]. Results are reported as proportions (%) alongside absolute participant counts. Group comparisons were conducted using Pearson’s chi-square tests (χ2). N.A.—not available.
Table 5. Regression analysis of micronutrients associations with blood pressure stratified by dietary pattern.
Overall
(N = 488)
Omnivores
(n = 260)
Plant-Forward Dieters
(n = 228)
bCIpbCIpbCIp
Intercept0.04820.369, −0.2720.768−1.06−0.041, −2.130.046−0.1660.305, −0.6440.490
Iron0.550.83, 0.278<0.0010.3750.801, −0.0390.0790.4960.897, 0.1150.012
Vitamin B90.3110.588, 0.04170.025
Sex (T.females)−0.844−0.465, −1.23<0.001−0.583−0.051, −1.120.032−1.01−0.438, −1.590.001
Age (T. > 50 y)0.8291.3, 0.372<0.0010.6751.38, −0.00150.0551.041.72, 0.3910.002
Vitamin D −0.3850.036, −0.8260.079
Selenium−0.2170.0229, −0.4630.080−0.49−0.124, −0.880.011
Zinc0.4750.941, 0.02210.042
Copper0.3250.58, 0.07250.0120.2860.643, −0.0680.1130.3160.708, −0.0760.111
Note. “T.females” denotes that females served as the reference category for comparison, while “T. > 50” designates participants aged 50 years and above as the reference age category.
Table 6. Regression analysis of micronutrients associations with body weight stratified by dietary pattern.
Overall
(N = 488)
Omnivores
(n = 260)
Plant-Forward Dieters
(n = 228)
bCIpbCIpbCIp
Intercept81.685.5, 77.6<0.00180.185.9, 74.3<0.00177.580.8, 74.1<0.001
Vitamin B9−1.79−0.661, −2.920.002−2.68−1.08, −4.280.001
Vitamin D−2.38−0.924, −3.830.001−5.94−3.31, −8.57<0.001−1.280.249, −2.810.100
Magnesium1.412.84, −0.03080.0552.034.17, −0.1060.062
Age (T. > 50 y)2.755.4, 0.0960.0425.529.49, 1.550.0072.926.13, −0.2970.075
Sex (T.females)−15.8−13.7, −18<0.001−15.8−12.6, −19<0.001−15.5−12.8, −18.2<0.001
Molybdenum−1.160.0182, −2.340.054−1.68−0.198, −3.170.026
Vitamin B63.917.22, 0.5980.021
Potassium−1.980.063, −4.010.057
Calcium−2.87−0.608, −5.140.013
Copper1.252.69, −0.1950.090
Note. “T.females” denotes that females served as the reference category for comparison, while “T. > 50” designates participants aged 50 years and above as the reference age category.
Table 7. Regression analysis of micronutrients associations with body mass index stratified by dietary pattern.
Overall
(N = 488)
Omnivores
(n = 260)
Plant-Forward Dieters
(n = 228)
bCIpbCIpbCIp
Intercept−1.35−0.51, −2.230.002−1.030.0646, −2.180.071−3.03−2.01, −4.27<0.001
Vitamin B9−0.1870.0219, −0.3970.080−0.2630.0137, −0.5460.065
Vitamin D−0.632−0.287, −1.010.001−0.98−0.469, −1.53<0.001−0.626−0.12, −1.230.028
Selenium0.3380.731, −0.05430.090
Magnesium0.4490.721, 0.1830.0010.5290.913, 0.1590.006
Age (T. > 50 y)0.8711.35, 0.396<0.0011.151.87, 0.4640.0011.131.87, 0.3860.003
Sex (T.females)−0.624−0.219, −1.030.003−0.847−0.294, −1.420.003
Vitamin B60.6421.25, 0.05250.034
Calcium−0.678−0.186, −1.20.008
Note. “T.females” denotes that females served as the reference category for comparison, while “T. > 50” designates participants aged 50 years and above as the reference age category.
Disclaimer/Publisher’s Note: The statements, opinions and data contained in all publications are solely those of the individual author(s) and contributor(s) and not of MDPI and/or the editor(s). MDPI and/or the editor(s) disclaim responsibility for any injury to people or property resulting from any ideas, methods, instructions or products referred to in the content.