1. Introduction
In the city of Wuhan, China, the cases of people with acute respiratory conditions, caused by the new SARS-CoV-2 (severe acute respiratory syndrome coronavirus-2) were reported in late 2019, resulting in an emerging disease named COVID-19.
The epicenter of the pandemic, between May and June 2020, focuses on the Americas, as 32,437,597 cases are known in this continent alone. In other words, the 43% of cases that were recorded worldwide, and with respect to deaths, 48% of the more than one million deaths are attributed to this area [
1]. For Colombia, WHO reports reported a total of 1,482,072 cumulative cases and 40,019 deaths in December 2020 [
1].
As a result of the pandemic that was generated by this new virus, social and health inequities in society, including the social determinants of health (SDH), became more pronounced, providing vital information, since it shows that the most vulnerable people do not have the ease to access timely or good-quality health care services, due to a lack of economic income [
2]. COVID-19 is directly related to the term syndemia [
3], due to the synergy between the base comorbidities and, in this case, COVID-19 together with the SDH [
4], which has gained strength after the beginning of the pandemic, as it fits perfectly into the current situation.
Based on the above, and using air quality data, quality in health service, food, socioeconomic strata and base diseases as SDH, and then as variables for vulnerability, contagion and death by COVID-19, and effective number of reproductions of the virus by location, the COVID-19 threat, the risk calculation and its respective analysis is made, in order to determine the risk to contagion by COVID-19 in the city of Bogota, taking into account the SDH in the period from February to August 2020.
2. Materials and Methods
A spatial epidemiological study was carried out to show the distribution of the contagions against COVID-19 that occurred in the city of Bogotá, Colombia, between February and August 2020, taking into account the SDH. In this study a model is created based on the following formula: Risk = Vulnerability ∗ Menace; this is modified for this study by adding the variables of SDH, effective number of reproduction and population density. Air quality variables (PM10 and PM2.5, O3 and NO2) are taken as environmental SDH, socioeconomic strata and quality in health service as social SDH, behavioral SDH take the food of the population of the capital and for biological SDH the diseases base that presents the residents of the city of Bogotá D.C. The threat is taken as a constant variable so it is present throughout the city.
2.1. Vulnerability Calculation
Vulnerability is taken as SDH according to the Canadian classification, in this case biological determinants are taken as pre-existing diseases of the population, a standard diet of 2000 calories is used as variable for behavioral determinants, while the socioeconomic stratum and quality in the health service were taken into account for the social SDH. In terms of environmental SDH the annual averages of the data of PM10 and PM2.5, O3 and NO2 for the city of Bogota were used. Finally, information on COVID-19 infections and deaths by localities between February and August is used.
With respect to the calculation of vulnerability, an equal weight is assigned, that is, each determinant was assigned a total of 25 points, in order to obtain 100 points in total.
2.2. Menace
This is taken as the presence of the virus, in this case COVID-19, so in this model the variable is constant, since it is present throughout the city. A value of 10 points was assigned, taking into account the WHO classification of infectious microorganisms for their risk.
2.3. Calculation of Risk
For this calculation the formula of risk and disaster assessment is taken into account, an adaptation is made to the model of this study, which is determined and established by the authors, the equation is the following:
where R: risk, 5: vulnerability weighting value, V: vulnerability, 0.2: menace weighting value, M: menace, PD: population density, Rt: effective number of reproductions. This calculation is carried out per block with the aim of obtaining the lowest possible error at the moment of obtaining the arithmetic mean for each locality, then the classification of the risk according to color and type of the averages by locality obtained is carried out.
3. Analysis and Results
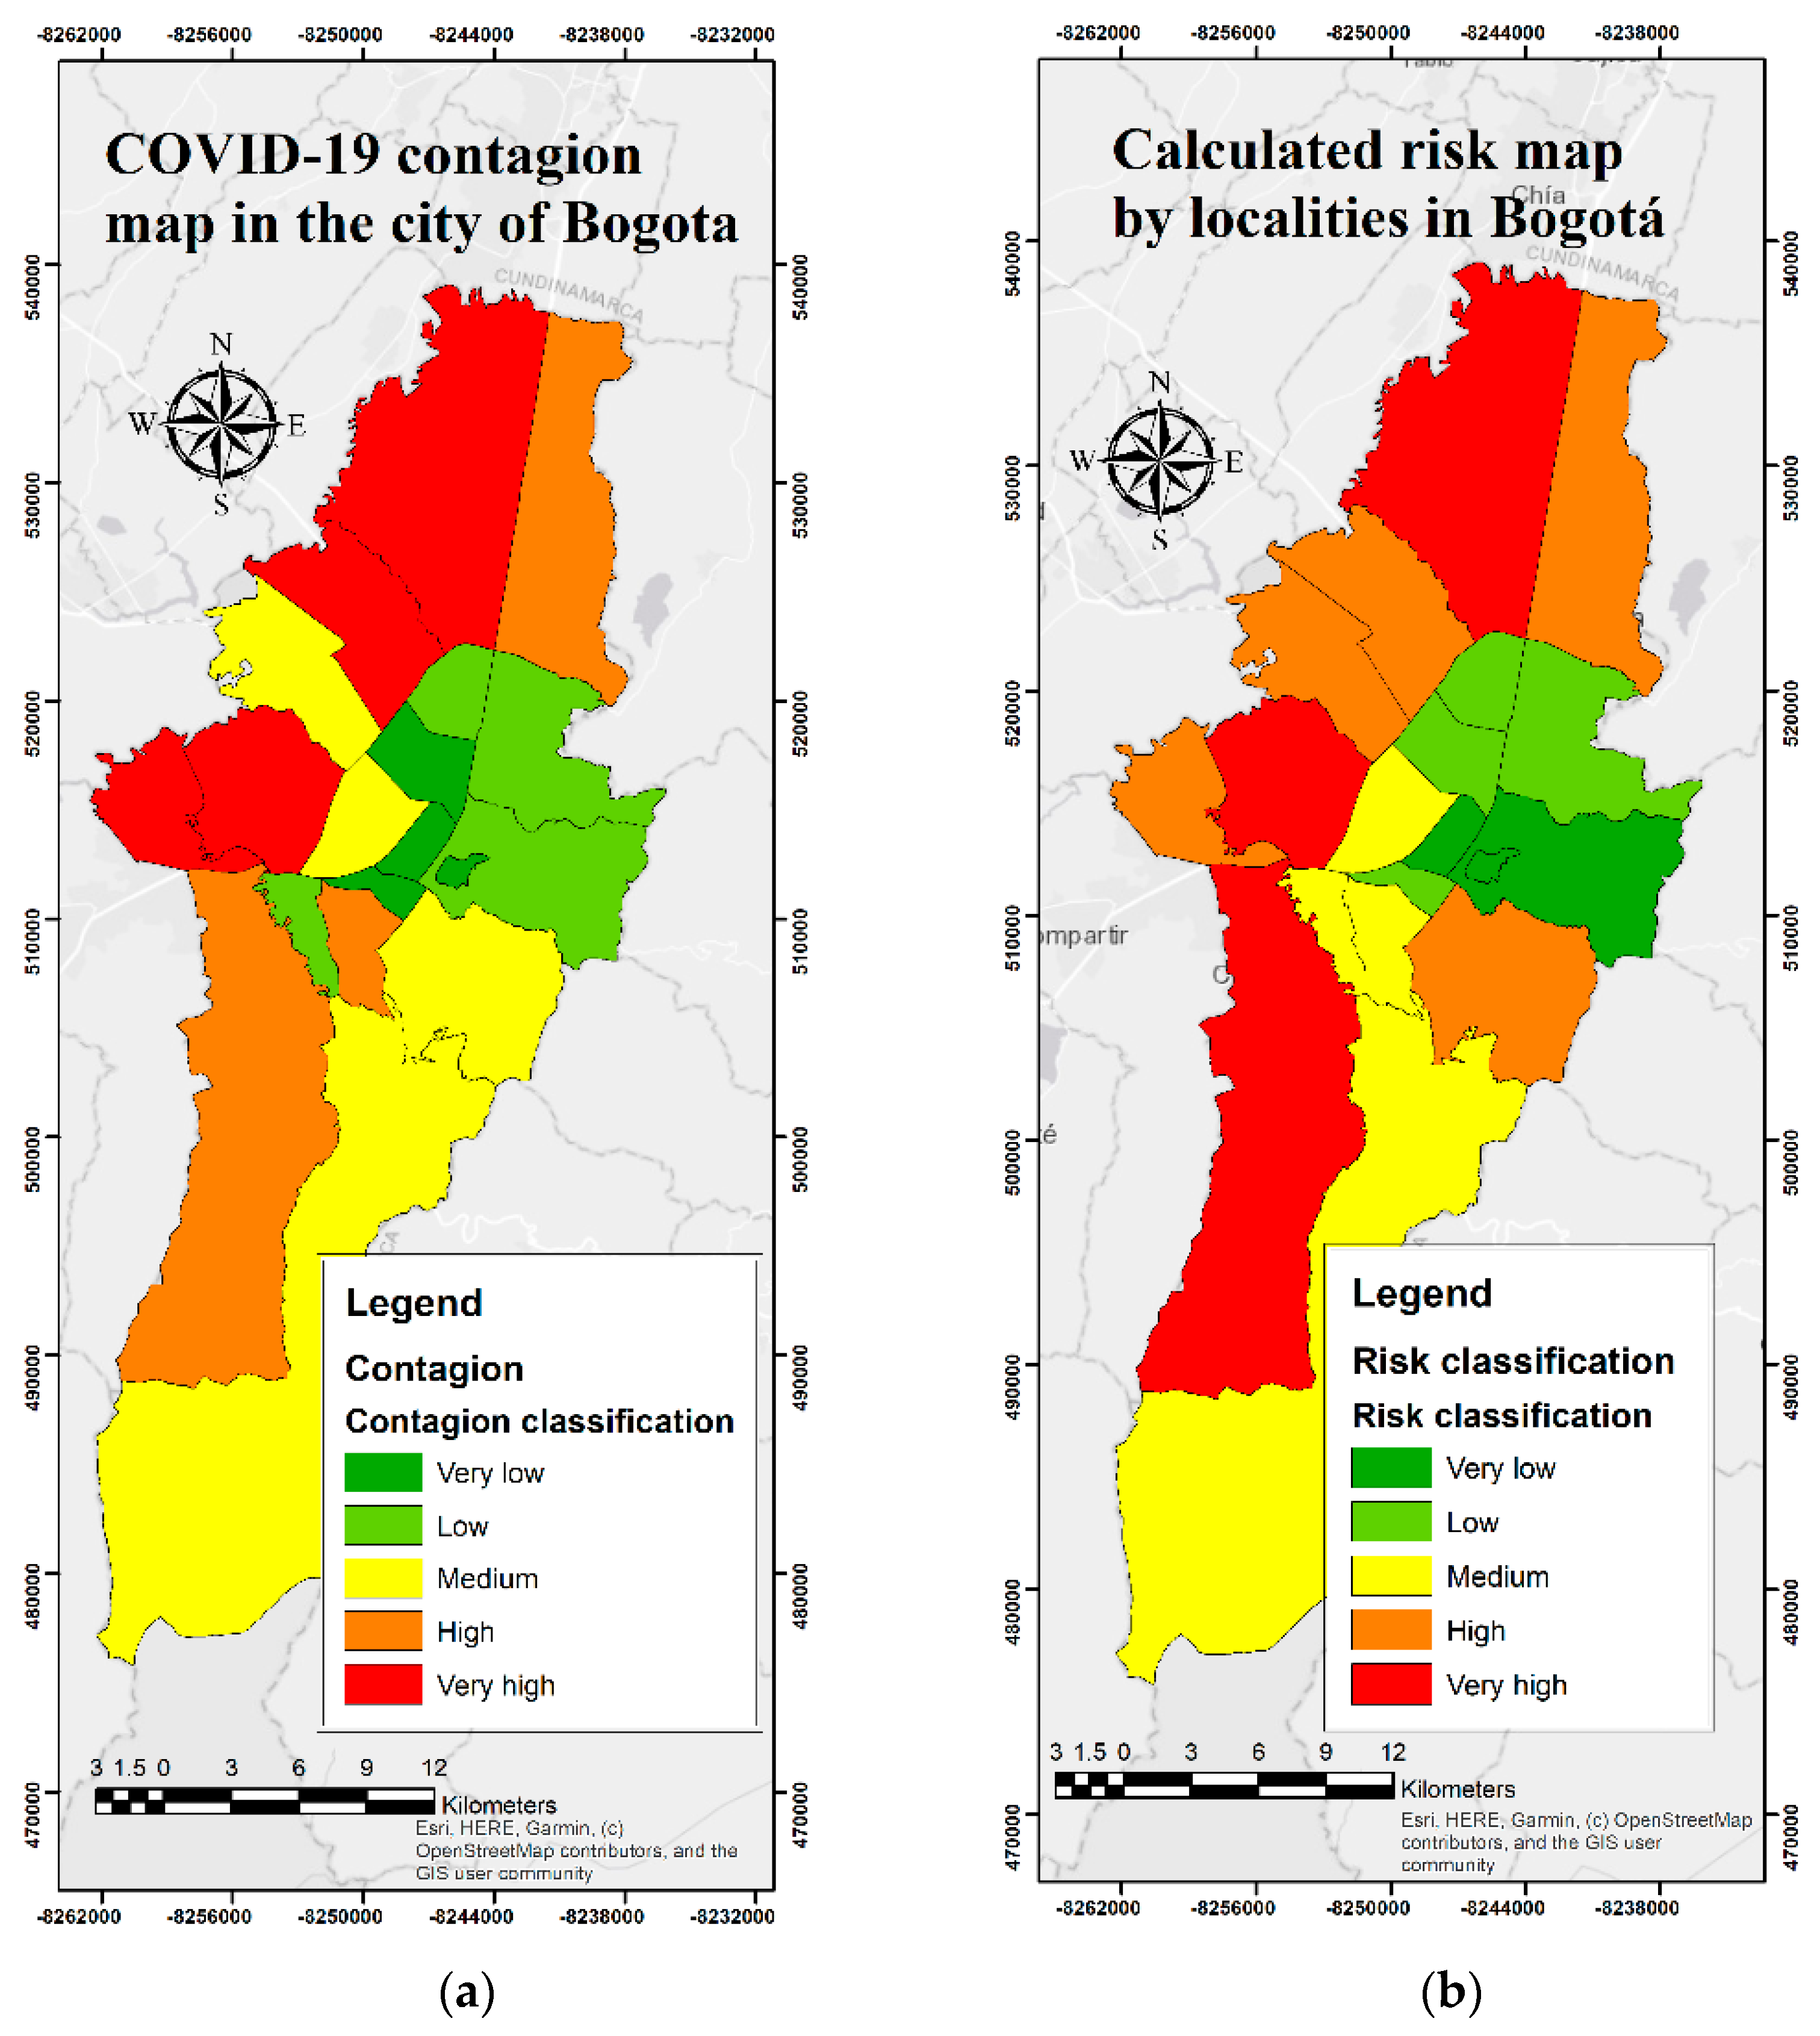
In
Figure 1, it is evident that the results that were obtained in map (a), from the model executed, have a close relationship with the map, showing the contagions of the city (b), recorded during the study period, since the western part presents a high and very high risk, with localities such as Suba, Ciudad Bolívar, and Kennedy, which present a very high risk. In addition, it shows that the localities that are located in the central-east, such as La Candelaria, Santa Fe, Teusaquillo, and Chapinero, reveal a low and very low risks, respectively, which resembles the map of contagions. On the other hand, localities such as Engativá, Fontibón, and Bosa, with high risk, according to the calculations made, resemble the contagions present, since they are found with significantly high risks.
Localities such as Kennedy, Bosa and Ciudad Bolívar, are among the most vulnerable, since the predominant stratum is two, which is related to the amount of income for what the country is stratified, is characterized by low to medium–low economic income; therefore, they sometimes do not have access to quality education, adequate food, among others. In addition, Suba, Engativá, Kennedy, and Usaquén are the localities with the greatest presence of adults older than 65 years, which increases the risk of infection with SARS-CoV-2 and the complications derived from COVID-19 [
5], since they are an extremely vulnerable population, due to their biological age and the comorbidities presented by these people [
6,
7].
4. Discussion
The SDH have a great influence, since they largely determine the level of risk that the population may present to infectious diseases; in this case, COVID-19, which has a direct relationship with the results given by the model carried out in this study, which shows that the localities that are located in the western area of the city, are those that present a higher high and very high risk, in addition to the south-eastern part. The western part of the city is known for the low quality of the air, since there are located areas of industry, with large numbers of companies [
8,
9], being a risk factor for cardiorespiratory diseases, which increases the possibilities of contagions to COVID-19 [
10,
11]. They also have a population that lives from informal work [
12], that is, their livelihood is given by the activities they carry out every day, which leads to the difficult access to education and health services of excellent quality [
13], among others.
The above mentioned is related to the term syndemia, as a consequence of the presence of COVID-19 together with base comorbidities that the population had long ago, along with social and health inequities [
4], which are represented with the SDH, so it is appropriate to define what is currently happening as syndemic and, in this way, it should be addressed in order to reduce the disparities that the same society raises.
One of the strengths of this study is the versatility it has to be able to extrapolate the model to different cities, as well as the ability to add more variables, such as lifestyle, amount of exercise done per week, food consumption per person daily or weekly, the amount of income and number of people contributing to the household, air pollutants, such as CO
2 and black carbon, and the time of exposure to them, among others; additional benefits of implementing spatial epidemiological studies include graphical demonstration [
14] by the mapping of risk distribution in the case of this study, and, in terms of weaknesses, errors can occur in the data taken from the DANE, since their basis is surveys carried out by ordinary people.
In conclusion, the result of the model created in this study can be used by governmental entities, adding more variables in order to make it more robust and, in this way, attack in a more efficient and precise way, in situations similar to the one being currently experienced with the COVID-19 and social and health disparities.
Author Contributions
Conceptualization, N.S.-O. and S.V.-D.; methodology, N.S.-O. and S.V.-D.; software, N.S.-O.; validation, N.S.-O.; formal analysis, N.S.-O.; investigation, N.S.-O.; resources, data curation, N.S.-O.; writing—original draft preparation, N.S.-O.; writing—review and editing, L.C.B.-B. and R.J.S.-P.; visualization, N.S.-O.; supervision, L.C.B.-B.; project administration, N.S.-O.; funding acquisition. All authors have read and agreed to the published version of the manuscript.
Institutional Review Board Statement
Not applicable.
Informed Consent Statement
Not applicable.
Data Availability Statement
The data presented in this study are available on request from the corresponding author.
Conflicts of Interest
The authors declare no conflict of interest.
References
- World Health Organization. COVID-19 Weekly Epidemiological Update; WHO, Ginebra: Manila, Philippines, 2020. [Google Scholar]
- Pinilla, M.; Varelay, A.R.; González, C. Los pobres, los más afectados por la pandemia; Universidad de los Andes: Bogotá, Colombia, 2020. [Google Scholar]
- Jaramillo, C.M. Al día con la COVID-19; Universidad de Antioquia: Medellín, Colombia, 2020. [Google Scholar]
- Horton, R. Offline: COVID-19 is not a pandemic. Lancet 2020, 396, 874. [Google Scholar] [CrossRef]
- Sauer, L. Jonh Hopkins Medicine; Jonh Hopkins Medicine: Baltimore, MD, USA, 2020; [En línea]; Available online: https://www.hopkinsmedicine.org/health/conditions-and-diseases/coronavirus (accessed on 10 December 2020).
- Center for Diseases Control and Prevention. Older Adults; Center for Diseases Control and Prevention: Atlanta, GA, USA, 2020. [Google Scholar]
- Calderón-Larrañaga, A.; Dekhtyar, S.; Vetrano, D.L.; Fratiglioni, T.B.y.L. COVID-19: Risk Accumulation among Biologically and Socially Vulnerable Older Populations. Ageing Res. Rev. 2020, 63, 101149. [Google Scholar] [CrossRef] [PubMed]
- Rodríguez-Camargo, L.A.; Sierra-Parada, R.J.; Blanco-Becerra, L.C. Análisis espacial de las concentraciones de PM2,5 en Bogotá según los valores de las guías de la calidad del aire de la Organización Mundial de la Salud para enfermedades cardiopulmonares, 2014–2015. Biomédica 2020, 20, 137–152. [Google Scholar] [CrossRef]
- Instituto de Hidrología, Meteorología y Estudio Ambiental. Calidad del aire; IDEAM: Bogotá, Colombia, 2015. [Google Scholar]
- Urrutia-Pereira, M.; Mello-da-Silva, C.A.; Solé, D. COVID-19 and air pollution: A dangerous association? Allergol. Immunopathol. 2020, 48, 496–499. [Google Scholar] [CrossRef]
- Economic Commission for Latin America and the Caribbean. The Social Challenge in Times of COVID-19; ECLAC: Santiago, Chile, 2020. [Google Scholar]
- Frölich, N. Coronavirus en Colombia: La cuarentena está causando hambre y protestas; Deutsche Welle: Bogotá, Colombia, 2020. [Google Scholar]
- Acosta, S.R. La desigualdad de ingreso y salud en Colombia. Rev. Fac. Latinoam. Cienc. Soc. 2016, 24, 265–296. [Google Scholar]
- Baker, D.; Nieuwenhuijsen, M.J. Environmental Epidemiology Study Methods and Application, 1st ed.; Oxford University Press: New York, NY, USA, 2008; Volume 1, pp. 189–197. [Google Scholar]
| Disclaimer/Publisher’s Note: The statements, opinions and data contained in all publications are solely those of the individual author(s) and contributor(s) and not of MDPI and/or the editor(s). MDPI and/or the editor(s) disclaim responsibility for any injury to people or property resulting from any ideas, methods, instructions or products referred to in the content. |
© 2021 by the authors. Licensee MDPI, Basel, Switzerland. This article is an open access article distributed under the terms and conditions of the Creative Commons Attribution (CC BY) license (https://creativecommons.org/licenses/by/4.0/).


 ,
, 