
Article

Storm Events Along the Coasts of Senegal

by
Cheikh Omar Tidjani Cisse
1,*,
Rafael Almar
2 and
Mamadou Sadio
3
1
Laboratory of Dynamics and Integrated Management of Coastal Areas, University of Quebec in Rimouski, 300 Ursuline Path, P.O. Box 3300, Rimouski, QC G5L 3A1, Canada
2
Laboratory of Geophysical and Oceanographic Spatial Studies, University of Toulouse/CNRS/IRD/CNES, CEDEX 9, 31999 Toulouse, France
3
Integrated Coastal Zone Management and Sustainable Development of the West African Coast (GIDEL) Cheikh Anta Diop University of Dakar Fann, Dakar P.O. Box 5005, Senegal
*
Author to whom correspondence should be addressed.
Submission received: 24 December 2025 / Revised: 16 February 2026 / Accepted: 23 February 2026 / Published: 3 March 2026
(This article belongs to the Special Issue Coastal Hydrology and Climate Change: Challenges and Solutions)

Abstract

Coastal storms represent a major environmental issue and constitute an important challenge for coastal flood management. This study analyzes the frequency and characteristics of storms on the Senegalese coast between 1993 and 2023, focusing on four coastal cities: Dakar, Saint-Louis, Mbour, and Cap-Skring. The analysis is based on wave data from the ERA5 model and on meteorological and oceanographic data from different models. Storms were detected using the Peak Over Threshold (POT) method, based on the 95th percentile and fitted to a generalized Pareto distribution (GPD). The results reveal a contrasted spatial distribution of coastal storms, with a higher occurrence in Dakar and Saint-Louis. An apparent increase in the frequency of storms is observed in Saint-Louis, Mbour, and Cap-Skring, while an apparent decrease is noted in Dakar; however, these trends are not statistically significant. Extreme coastal water levels (ECWL) associated with storms show an opposite evolution, with an apparent decrease in the first three regions and an apparent increase in Dakar. The most intense and longest storms, in terms of energy content (Es), are mainly observed in Dakar and Saint-Louis. A linear relationship is highlighted between the duration and intensity of storms. Storm occurrence shows a strong seasonal modulation, with a predominance during the dry season (November to May). The most energetic storms are mostly generated by waves from the west to west-northwest direction in Dakar and Saint-Louis, while Mbour and Cap-Skring present a wider directional window. This first analysis at the scale of the Senegalese coast provides essential elements for understanding the risk of coastal storms and constitutes support for coastal flood management in a context of climate change.

1. Introduction

Today, the proliferation of research works on coastal extremes, particularly coastal storms [1,2,3,4,5], shows in many ways that storms remain a genuine concern for the scientific community as well as for coastal communities. These events affect coastlines by causing dramatic economic, social, and environmental impacts [6,7,8]. Indeed, sandy low-lying coasts characterized by complex sedimentary processes are highly exposed to extreme weather and marine events [9,10,11,12,13]. On low coasts, coastal storms often tend to cause rapid morphological responses and very intense erosion, which can lead to damage to coastal assets behind the shoreline [14,15,16,17,18]. Moreover, according to [19], extreme coastal storms associated with high water levels due to storm surges and wave run-up often cause damage to coastal properties and infrastructures and, in addition, erode sandy beaches, gradually degrading coastal ecosystems. From the perspective of climate change, these events are expected to become larger and more intense. Numerous prospective studies on the impact of future climate estimate that coastal regions will experience a high occurrence of coastal storms [20,21,22,23]. It should be noted that this high occurrence of storms is unevenly distributed worldwide. According to [24], coastal regions located in the tropics will experience the strongest increases in storm surge frequency. The storm surge mainly results from variations in sea level pressure (SLP), often causing a sudden rise in sea level [25,26,27]. Storm surge is the main trigger of marine flooding in many coastal regions [28]. Understanding the spatial extent of storm surges has significant financial and practical implications for flood risk management and the protection of coastal communities [29,30,31]. Hence, it is important to know where coastal flooding occurs and, moreover, to identify the meteorological conditions and tides that cause coastal flooding [32,33]. Today, most coasts in the world are increasingly confronted with coastal storms capable of causing damage to the shoreline.
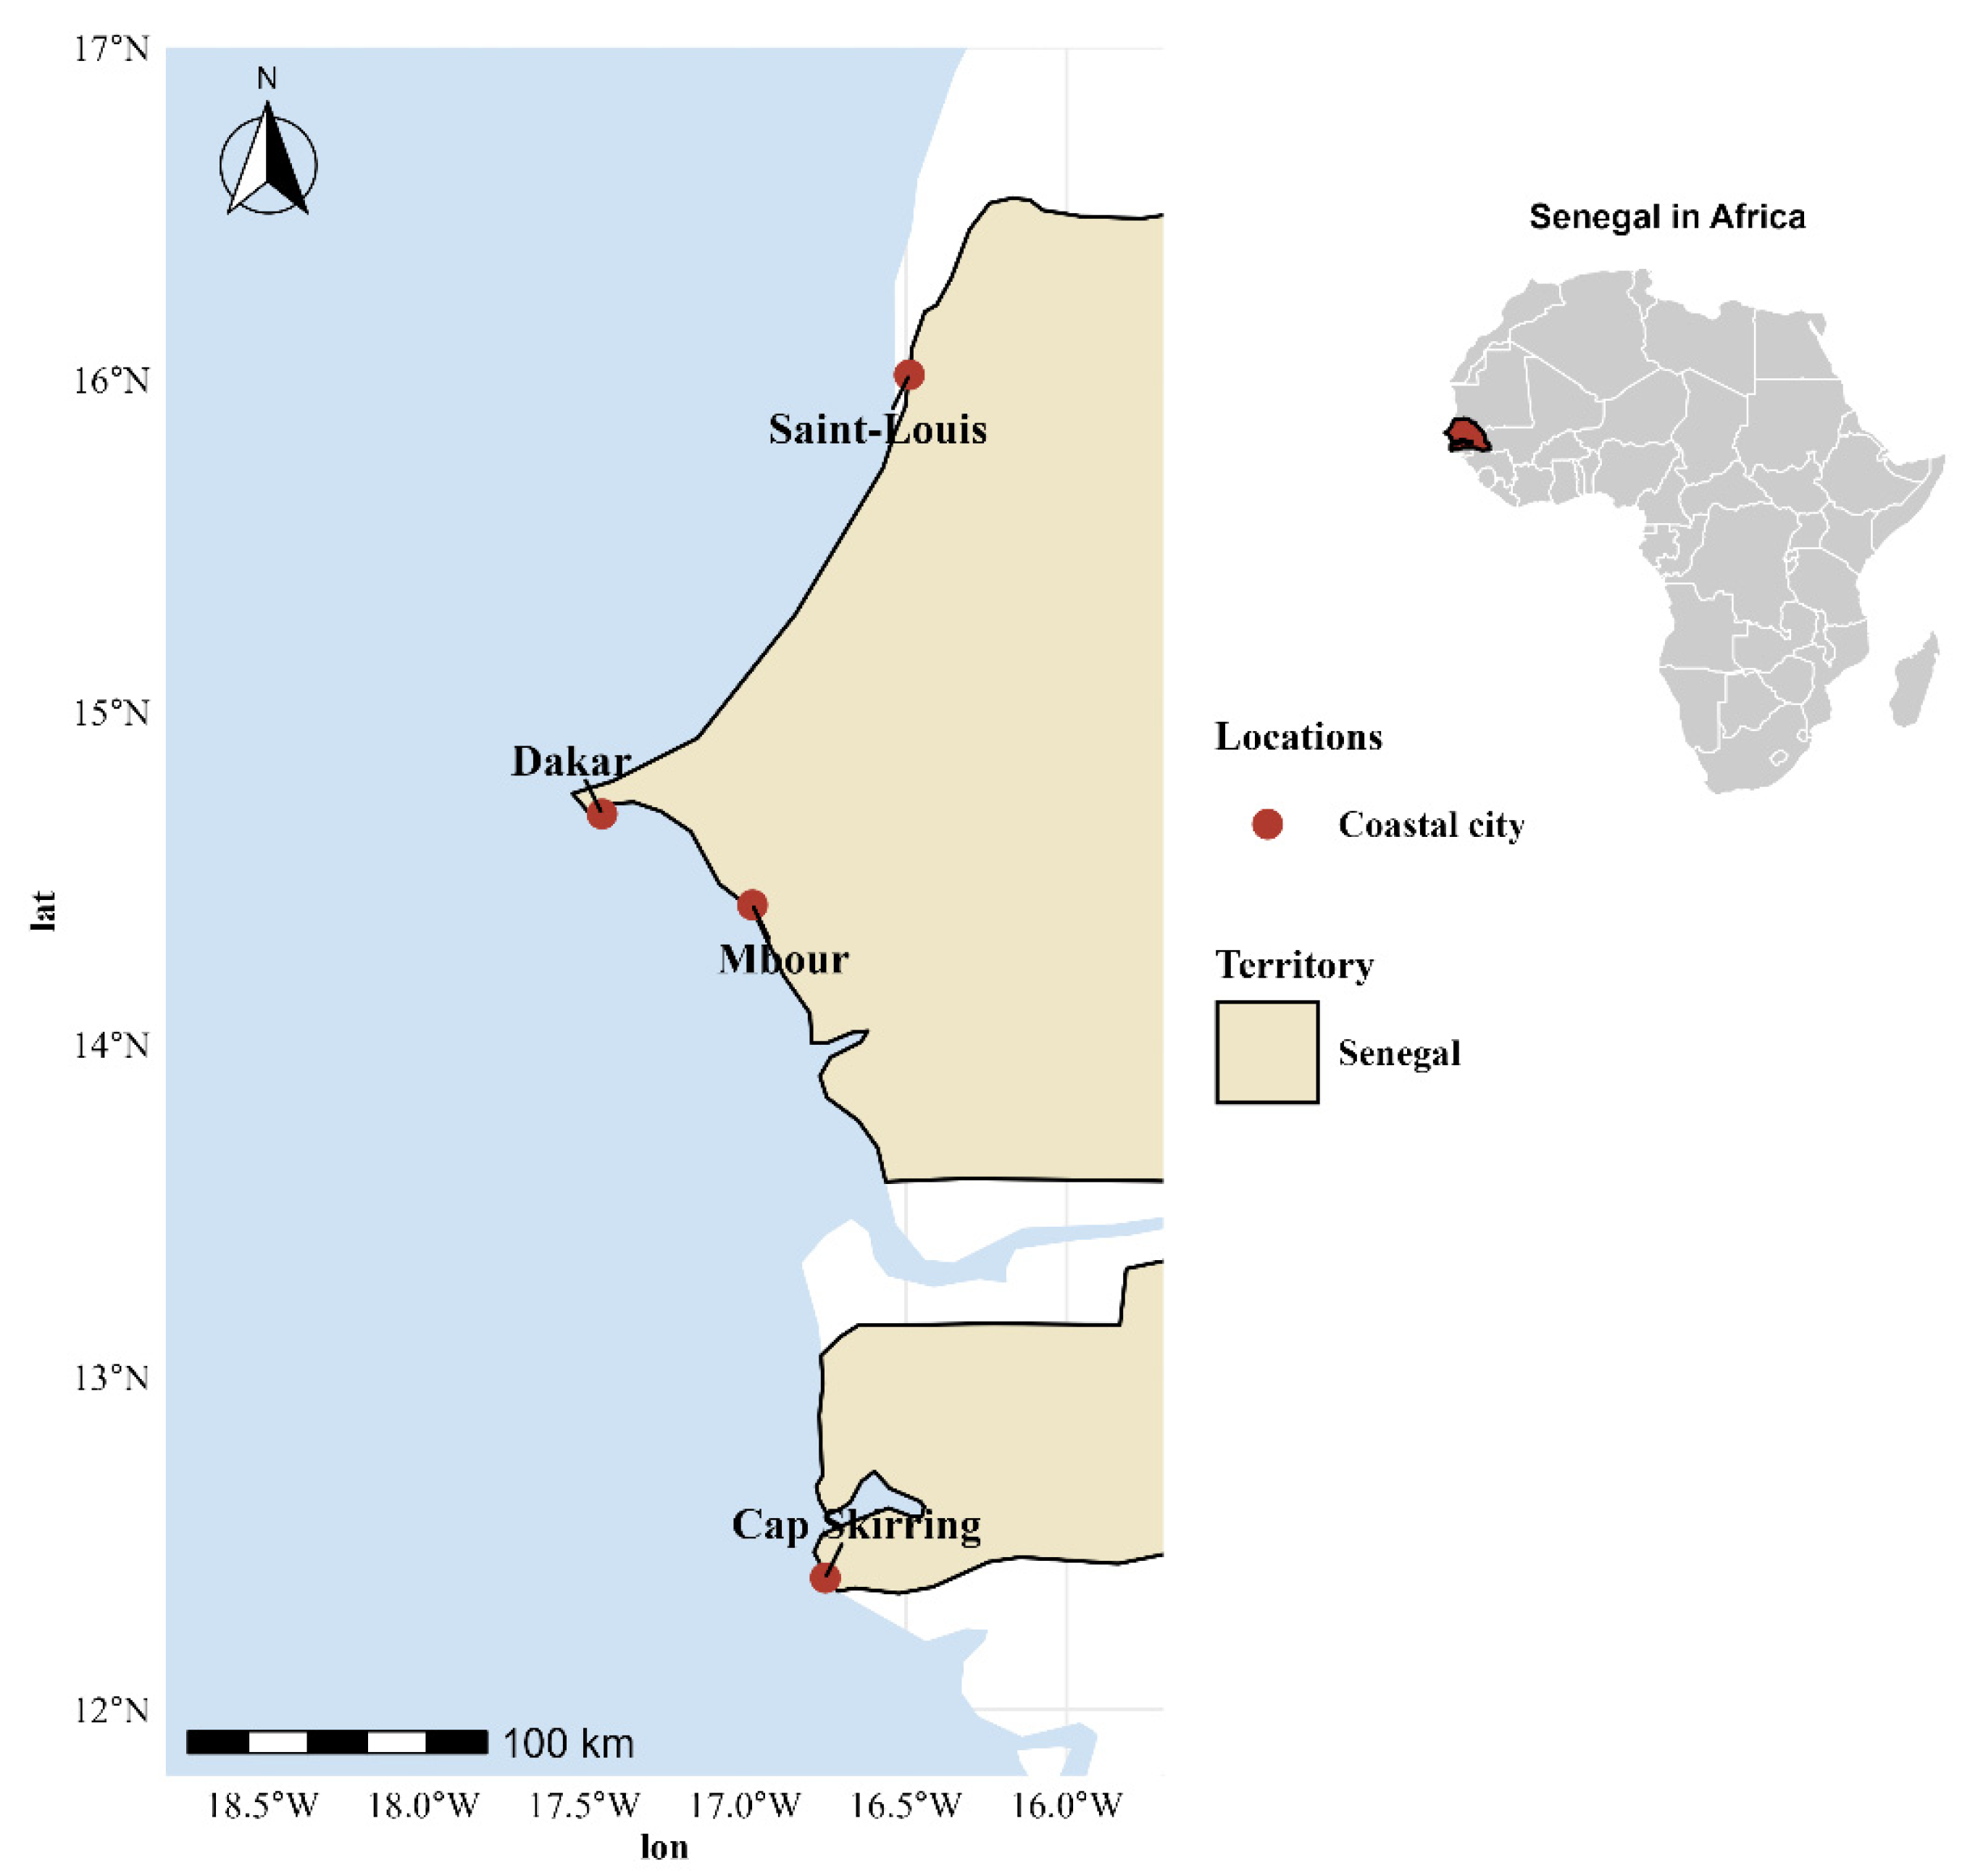
This situation of vulnerability to coastal hazards, particularly coastal storms, does not leave African coasts indifferent. Indeed, studies on African coasts, particularly West African coasts, clearly show that these coasts are exposed to coastal hazards, namely coastal storms. They are, in fact, one of the greatest threats to socio-economic and environmental balances on West African coasts [34,35]. Moreover, [36] state that many African coastal cities are subject to coastal flooding. Like many African countries, particularly in West Africa, Senegal has a coastline of 700 km [37]. An analysis of works on the Senegalese coast clearly shows that most studies address the issue of coastal erosion [38,39,40,41,42]. Although some sections of the coastline are vulnerable to coastal flooding [41,43,44], it is rare to find a study addressing this coastal issue on a portion of the coast or along the entire Senegalese coastline. Moreover, it can be stated without risk of error that there is no study on the assessment of coastal storms along the Senegalese coast. Yet, in the context of climate change, most works report a high recurrence of coastal storms [27,45,46]. Consequently, an acceleration of the vulnerability of Senegalese coasts to storms should be expected. Indeed, the potential impacts would be damaging, as the Senegalese coast is highly urbanized and coastalized, and mostly composed of sandy low-lying coasts. In this context, this study is part of an assessment of coastal storms along the Senegalese coast (north and south coast). It should be noted that the study is more precisely focused on four major coastal cities in Senegal: Dakar, Saint-Louis, Mbour, and Cap-Skring (Casamance region) (Figure 1). Due to the absence of studies on coastal storms in Senegal, this topic appears to be justified. This study provides the first integrated, multi-site assessment of coastal storm events along the Senegalese coast by combining wave reanalysis, sea level components, and wave run-up to estimate Extreme Coastal Water Levels over the period 1993–2023.

2. Study Area

The Senegalese coastal zone corresponds to the western boundary of the Meso-Cenozoic Senegal–Mauritania sedimentary basin. The Senegal–Mauritania sedimentary basin was formed in the Mesozoic, mainly during the Cretaceous. It is a geological depression or trough along which sediments are deposited. Geologically, it is characterized by large sedimentary thicknesses and a faulted structure, which are very present in Dakar and Mbour, where the coast is cut into a succession of horsts and grabens [47,48]. On the Cap-Vert Peninsula, volcanism from the Oligo-Miocene to the Quaternary is very well represented. Indeed, the volcanic basement forming the Cap-Vert Peninsula divides the Senegalese coast into two distinct parts: the Petite Côte (Dakar to Djiffére towards Mbour) and the Grande Côte (Dakar to Saint-Louis) (Figure 1). It should be noted that the Senegalese coastline can be divided into five geomorphological entities:
First, the first unit corresponds to the Grande Côte. Indeed, it is mainly sandy. Moreover, it is marked by a large dune system backed by wet depressions called Niayes. This part of the coastline is most often influenced by north-western swells, which induce a southward littoral drift [37]. It also includes the Senegal River delta, which hosts the coastal region of Saint-Louis. This part of the Senegalese coast is both sandy and straight from the Senegal River mouth, particularly at Saint-Louis, up to the Cap-Vert Peninsula, which is rocky and rugged, bordered by islets and islands (Ngor and Gorée) [49]. This section of the coast is also called the northern Senegalese coast.
The Petite Côte is a sandy–rocky coast, alternating small rocky outcrops and sandy bays with some lagoons [37,50]. The Petite Côte is located more precisely south of the Cap-Vert Peninsula. It is subjected to north-western swells [37,50,51], whose energy is dissipated by refraction phenomena observed around the Cap-Vert Peninsula [50,52,53,54]. The Sine-Saloum Delta is characterized by a marshy coastline, bordered by mangroves at the river mouths [55]. Finally, Casamance is a sandy coast backed by a fluvio-marine complex that also includes mangroves [56,57].
The Senegalese coastal zone hosts a large part of the population but also supports a variety of socio-economic activities. According to [58], the regions with the highest urban growth are Dakar, Mbour, and Saint-Louis. The Senegalese coast is a very attractive area socially and economically [59]. Today, this coastline shows characteristics of a vulnerable coastal area at the intersection of strong human pressure, coastalization, urbanization, and sea level rise. Moreover, numerous studies carried out on the Senegalese coasts attest that they are vulnerable to coastal hazards [37,41,42,59,60,61,62]. Low-altitude urban areas are the most vulnerable to erosion and coastal flooding.
From a hydrodynamic perspective, two types of swells mainly circulate along the Senegalese coasts [37,38,54]. In winter, the wave climate is dominated by swells from the North Atlantic depression. In contrast, in summer, the swells mainly come from the South Atlantic [54]. Wave energy is higher on the Grande Côte (Dakar to Saint-Louis) than on the Petite Côte (Dakar to Mbour). This situation results from the morphology of the Cap-Vert Peninsula, which forms a natural barrier reducing the kinetic energy of the waves [51]. The country’s climatology is characterized by two seasons at the annual scale: the dry season (November to May) and the rainy season (June to October).

3. Materials and Methods

3.1. Hydrodynamic Data

Wave parameters—significant wave height (Hs) and peak wave period (Tp)—were extracted from the ERA5 reanalysis produced by the ECMWF, at 0.25° × 0.25° spatial and 6-hourly temporal resolution for the 1993–2023 period. Astronomical tides were obtained from the global FES model at hourly resolution, at the nearest coastal grid points, for the same time span (1993–2023). For the satellite altimetry era (1993–2023), daily sea level anomaly time series were obtained from the SSALTO/DUACS multi-mission product, distributed by the Copernicus Marine Environment Monitoring Service (CMEMS). These gridded daily maps provide sterodynamic and manometric sea level variations (referenced to the WGS84/GRS80 ellipsoid) and were extracted at the grid points nearest to the coast. To include storm surge effects not represented in SSALTO/DUACS, we used outputs from the MOG2D-G barotropic model, forced by ERA5 surface winds and atmospheric pressure at 6-hourly intervals. The model provides daily storm surge corrections, representing high-frequency sea level responses to pressure and wind forcing, as an alternative to the standard Inverted Barometer correction. Details on model configuration and performance are available online: https://www.aviso.altimetry.fr/en/data/products/auxiliary-products/dynamic-atmospheric-correction/description-atmospheric-corrections.html (accessed on 15 February 2026).
MOG2D-G exhibits good agreement with other barotropic models and shows strong consistency with tide-gauge and altimetry records of surge and high-frequency sea level variability. In this study, wave run-up was estimated using the parameterization proposed by Stockdon et al. [63], which accounts for dissipative, intermediate, and reflective regimes depending on the Iribarren number (ξ0). The shore slope (β), required for this calculation, was not considered uniform but was extracted from the global coastal slope dataset of [64], which provides a coherent description of slopes at a near-global scale. This dataset allows capturing the spatial variations in coastal slope and identifying morphological contrasts along the Senegalese coastline, distinguishing low-slope sectors, associated with dissipative beaches, from steeper sectors, corresponding to intermediate to reflective beaches.

3.2. Identification of Coastal Storms

If we adhere to the definition that a coastal storm is a sequence of sea states with a significant wave height (Hs) exceeding a specific threshold without dropping below this threshold for a certain period [65] the Hs of waves seems relevant for the identification of extreme events. Today, in the study of extreme weather and marine events, this parameter is used for the inventory of storm waves [66,67,68,69,70,71]. To identify extreme events from wave data, it is imperative to define an appropriate threshold [3,72,73,74,75]. Indeed, within the framework of this study, we used a Peak Over Threshold (POT) approach, fitted to a Generalized Pareto Distribution (GPD), to identify coastal storms. The GPD allows describing a sample of independent and identically distributed random variables [66]. POT is an approach long used in studies addressing coastal extremes [76,77,78,79]. It consists of capturing coastal storms in the time series of wave data, particularly the significant wave height (Hs), by selecting wave heights equal to or above the chosen threshold. The application of this approach requires the fulfillment of two conditions, according to [80]: the choice of an appropriate threshold and the interdependence criterion. Today, with the abundance of research on coastal storms, a variety of approaches are used to define a consistent threshold. Among the most widely used approaches is the extreme quantile method [3]. The choice of threshold is not straightforward. Moreover, according to [81], the choice of threshold is a compromise between bias and variance.
Despite the numerous methods for threshold selection, the extreme quantile method, particularly the 95th percentile, was applied for the identification of coastal storms along the Senegalese coast. Many studies have used this threshold (95th percentile) to detect coastal storms [82,83,84,85,86,87]. To evaluate coastal storms at the global scale, [3] defined the 95th percentile as the threshold for detecting storms from wave Hs. Explicitly, we consider an event to be stormy when the wave Hs is greater than or equal to the 95th percentile for 6 h. The selected peaks correspond to all exceedances of the Hs threshold over 6 h intervals, and not only to local maxima. This approach makes it possible to account for all significant variations in wave height during each storm event, while maintaining an appropriate inter-event periodicity (48 h) for the statistical analysis.
It should be noted that in most studies on coastal storm detection, the duration used for the threshold ranges from 6 to 48 h. The independence of events was verified using an autocorrelation analysis. This method made it possible to determine the appropriate inter-event period, ensuring that the events considered are statistically independent of one another.
However, in the framework of this study, a 6 h duration was applied. This temporal threshold was also used by [66] in Spain.
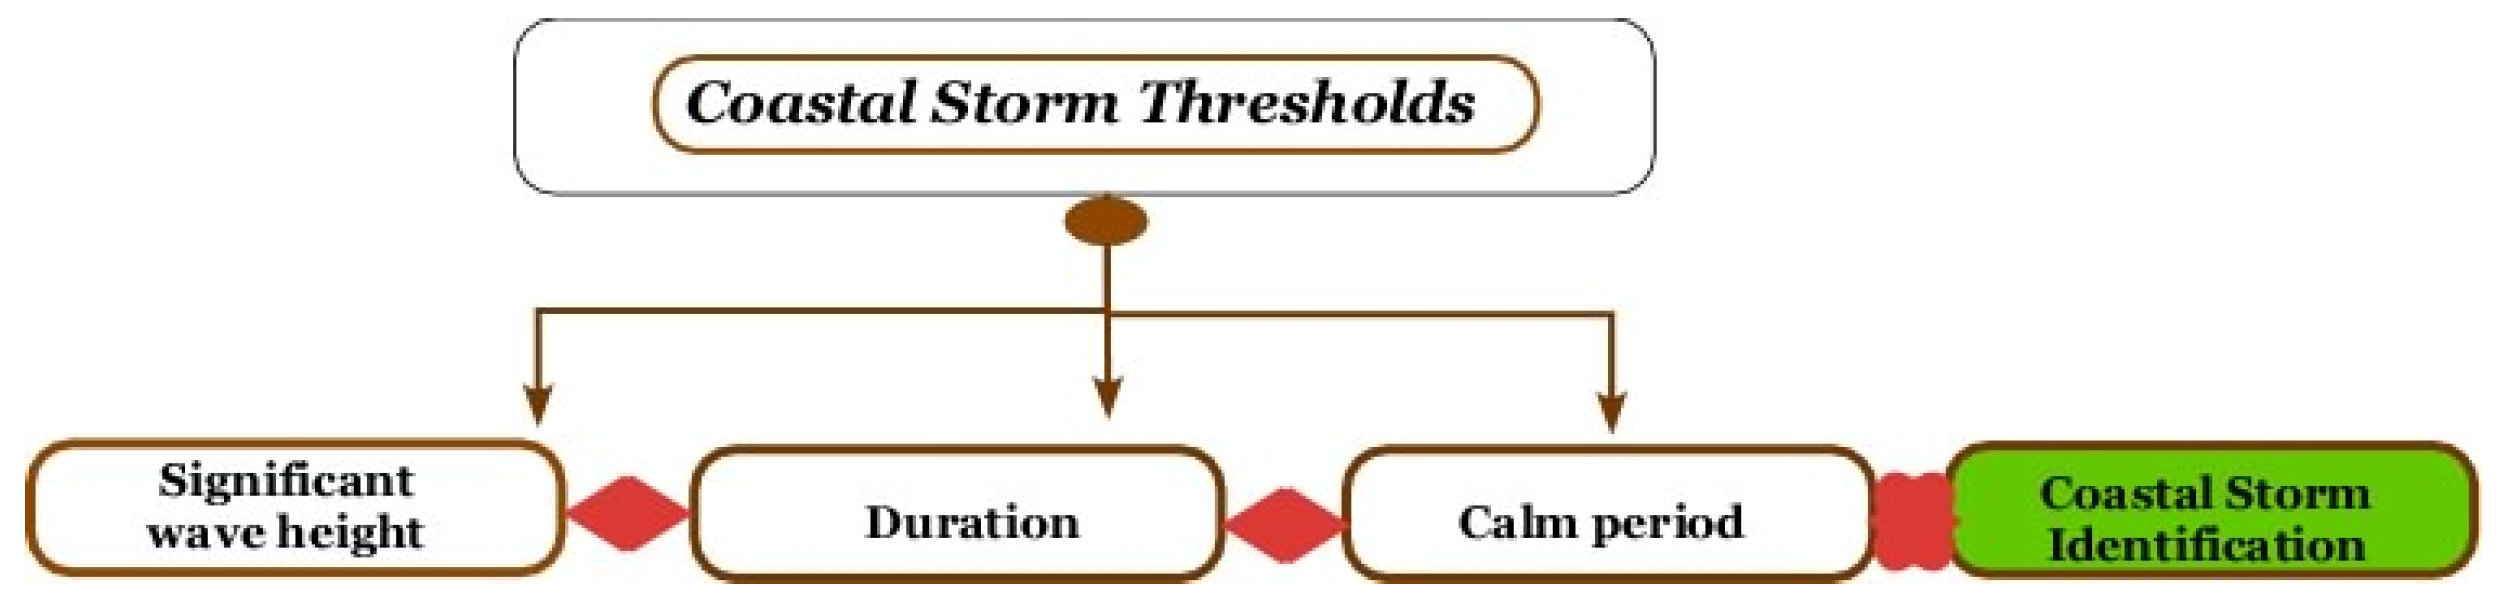
Consecutive storms are responsible for significant loads on coastal structures [88]. Therefore, it is essential to define an inter-event period to separate consecutive storms. Indeed, two consecutive storms are more damaging than when they occur individually. Hence, it is important to define a threshold for separating storms, although [89] removed the calm period in storm identification, considering a storm to end when Hs falls below Hthreshold. Thus, to separate consecutive storms and to accurately distinguish storms belonging to the same synoptic or meteorological system, a 48 h inter-event period was applied. The 48 h threshold for the calm or inter-event period allows the separation of consecutive storms or ensures the independence of events [90]. Using the three parameters (significant wave height, duration, and calm period) (Figure 2), we identified coastal storms at the four study sites (Dakar, Saint-Louis, Mbour, and Cap-Skring).
For a relevant characterization of events, for each identified storm, we extracted the following parameters: all wave characteristics (Hs, Tp, Dir), Sea Level Anomaly (SLA), storm surge (DAC), tide (Tide), wave run-up (R), Extreme Coastal Water Level (ECWL), and the energy content (Es) of the storm. The following equations were used to quantify ECWL and Es:
E C W L = Z 1 + Z 2 + Z 3 + Z 4
ECWL is the Extreme Coastal Water Level; Z1 = SLA is the Sea Level Anomaly; Z2 = DAC is the storm surge due to the depression; Z3 = Tide is the tide; and Z4 = R is the wave Run-up.

3.3. Estimation of Storm Energy Content

The formula of [91] (Equation (2)) was used to quantify the energy content (Es) of the identified storms. Indeed, this index informs us about the severity and intensity of the storm (Table 1). Many studies have used this index to estimate the intensity of coastal storms [43,66,92].
E s = t 1 t 2 H s 2 d t
where t1 and t2 define the duration during which Hs was above H t h r e s h o l d . According to [66], this equation is more suitable for obtaining a more precise value for Es, unlike the traditional wave energy equation. Indeed, the traditional wave energy equation uses a single value of Hs (most often the maximum Hs) to characterize the entire event.
The classification of the intensity of coastal storms is based on the Dolan–Davis scale (1992) [91]. This scale classifies storms into five categories (I to V) according to their energy content (Power, expressed in m2·h), ranging from weak to extreme storms (Table 1).
In the present study, this classification was adopted to discriminate storms according to their energy intensity and to facilitate the spatial and temporal comparison of events along the Senegalese coastline.

3.4. Statistical Analysis

To analyze the characteristics of storms at the different study sites, descriptive statistics were first applied to the data of identified storms along the northern and southern Senegalese coastlines. Furthermore, to track the trend in the evolution of storms and the ECWL associated with them, the Mann–Kendall test was applied. The Mann–Kendall test is widely used in the literature to monitor the trend in a time series of climatological, hydrological, oceanographic, etc., variables [92,93]. It is a non-parametric test, which does not require the data to follow a normal distribution [94]. Indeed, two hypotheses are considered for the interpretation of the Mann–Kendall test: the null hypothesis H0 states that the data come from a population with independent realizations and follow no trend [92,94,95]. Conversely, the alternative hypothesis states that the data follow a clear trend [96]. The Mann–Kendall test can be carried out using Equation (3).
S = k = 1 n 1   j = k + 1 n   s i g n   ( x j   x k )      
where
s i g n ( x j x k ) = { 1       i f   x j x k > 0 0       i f     x j x k = 0 1   i f   x j x k < 0
where n is the length of the time series, and x j and x k represent the observed values at times j and k , respectively, with j > k .
In this study, S represents the Mann–Kendall test statistic, while Kendall’s τ coefficient (reported in Table 2) corresponds to the normalized form of S .
The statistical significance of the Mann–Kendall test is evaluated using the p-value. A significance threshold of 0.05 is adopted. When p < 0.05 , the trend is considered statistically significant; otherwise, no significant trend is detected. A positive value of the statistic S indicates an increasing trend, while a negative value indicates a decreasing trend. However, the value of S alone does not allow a conclusion on the statistical significance of the trend; it must be evaluated using the probability associated with S , calculated according to the sample size n [92,93,97].

4. Results

4.1. Coastal Storm Characteristics

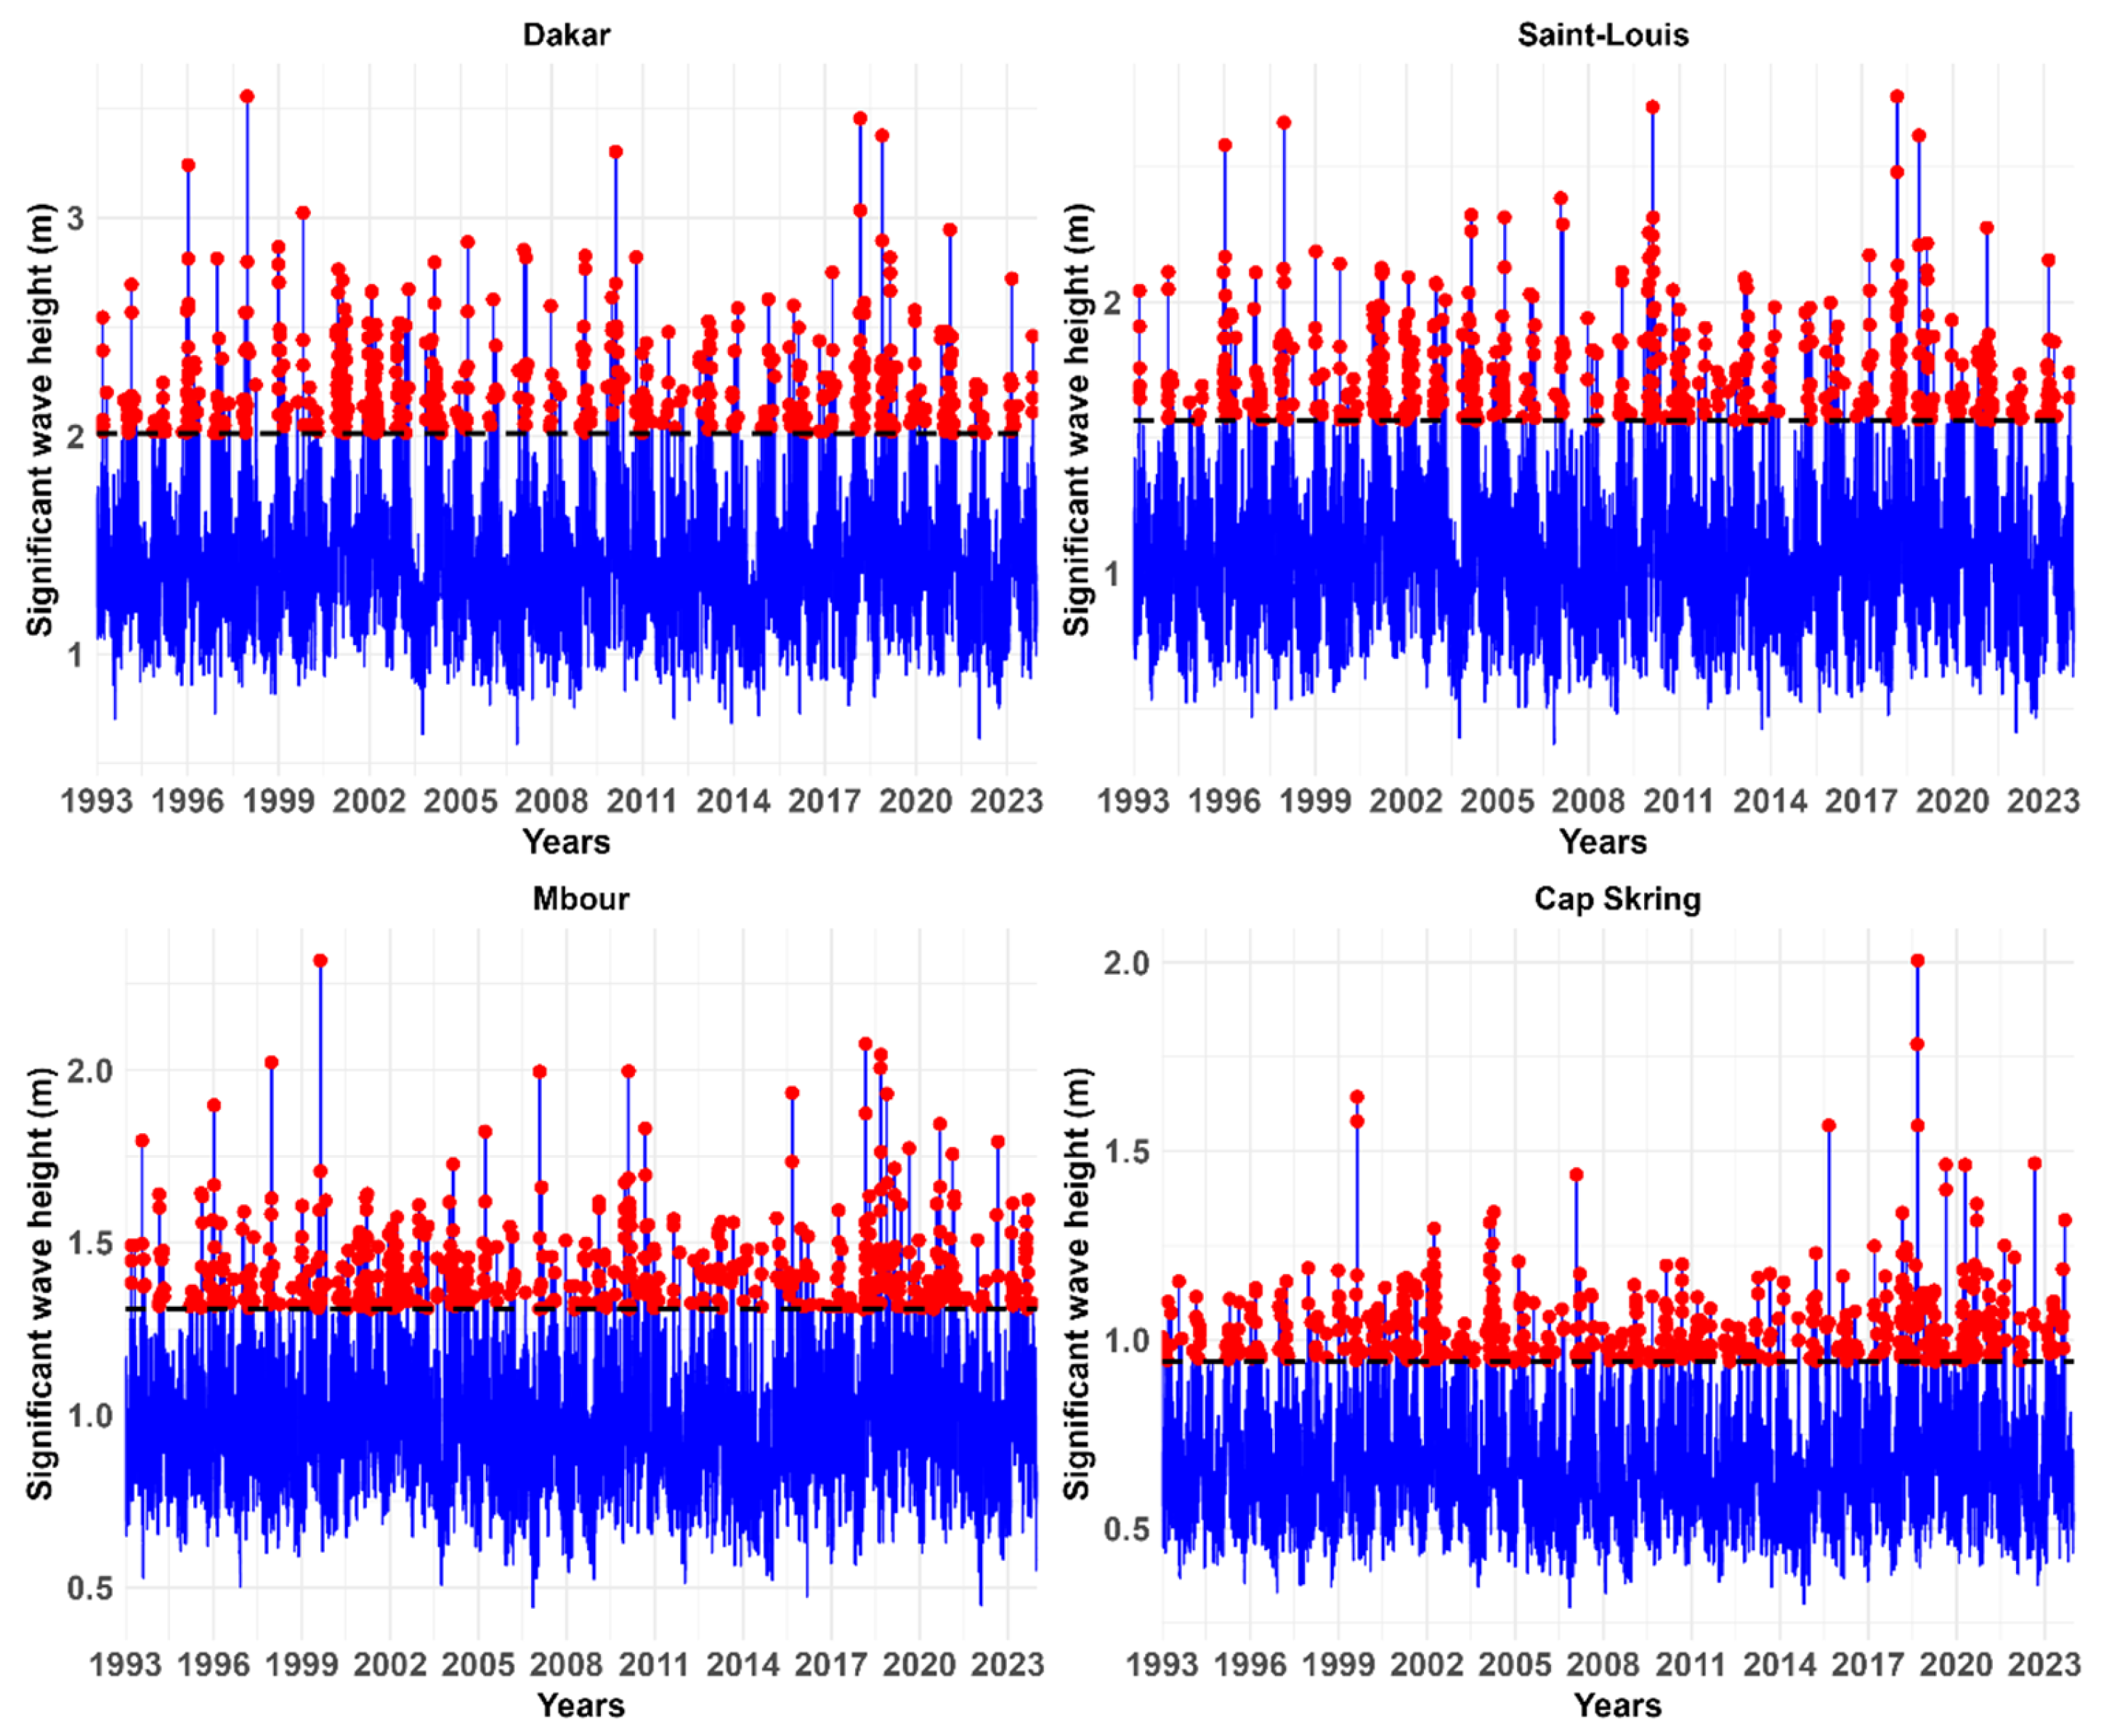
Figure 3 presents the time series of significant wave height (Hs) at the four study sites (Dakar, Saint-Louis, Mbour, and Cap Skiring) over the period 1993–2023. Extreme events corresponding to coastal storms, identified by exceeding the 95th percentile threshold for at least 6 h, are indicated by red dots.
First, the estimation of the threshold for the different study sites reveals different values: Dakar (2.01 m); Saint-Louis (1.56 m); Mbour (1.30 m); and Cap Skiring (0.94 m) (Figure 3). Indeed, the application of the methodology described in Section 3.2 allowed the identification of 244 coastal storms in Dakar; 243 in Saint-Louis; 282 in Mbour; and 162 in Cap Skiring. It should be noted that there is an imbalance in the number of coastal storm events recorded at the different sites.

4.2. Storm Occurrence Frequency

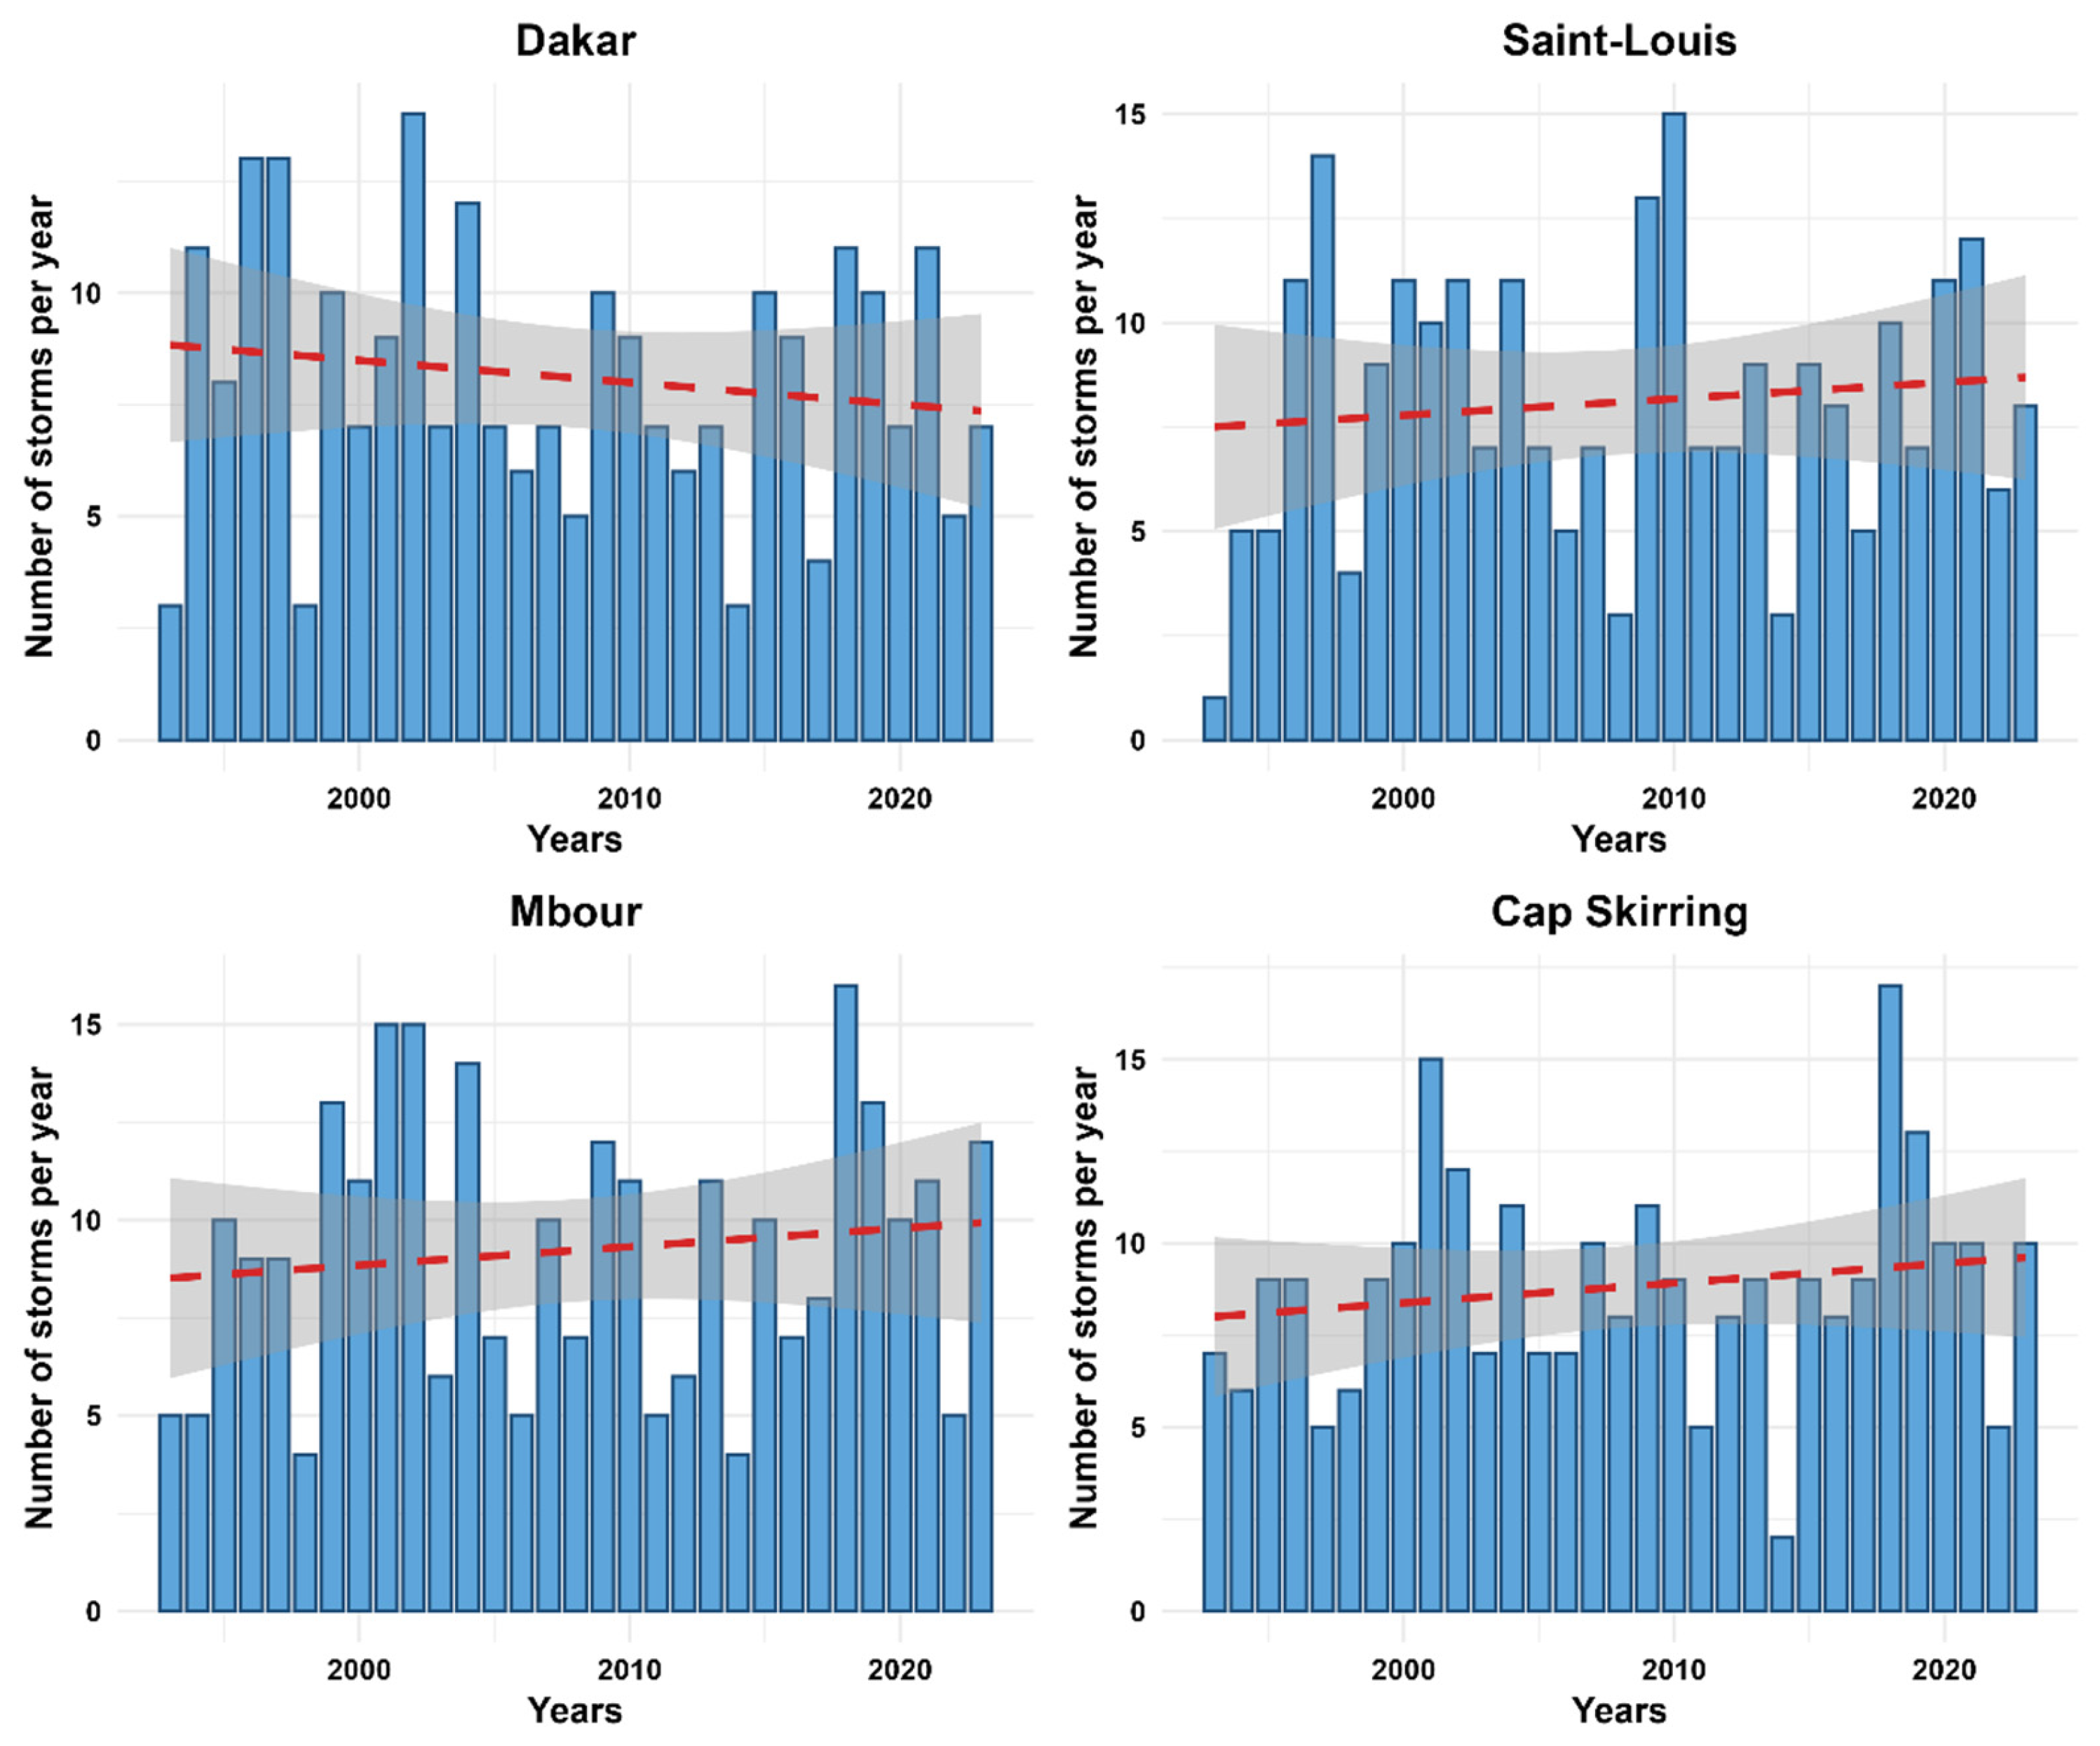
To better understand the frequency of coastal storms, the annual average of coastal storms was first estimated. It should be noted that the annual average of storms is 8 in Dakar and Saint-Louis, 9 in Mbour, and 5 in Cap Skiring.
The estimation of the occurrence frequency of coastal storms shows that the evolution varies according to the four study sites (Figure 4). The Mbour region presents the highest τ (τ = 0.102), suggesting a slight increasing trend. However, the associated p-value (0.441) indicates that this evolution is not statistically significant. For the other sites, the results are similar: Dakar (τ = −0.11, p = 0.409) shows a slight apparent decrease, while Saint-Louis (τ = 0.071, p = 0.595) and Cap-Skring (τ = 0.072, p = 0.603) present weak variations over time, all of which are not significant.
Although Mbour presents the highest trend, the associated p-value (0.441) indicates that this trend is not statistically significant at the usual 0.05 level. Similarly, the observed trends for Dakar (τ = −0.11, p = 0.408), Saint-Louis (τ = 0.071, p = 0.595), and Cap-Skring (τ = 0.072, p = 0.603) are not significant.
Comparative analysis of τ suggests, however, that Saint-Louis and Cap-Skring present similar profiles, with close values. The standard deviation of event occurrence frequency is distributed as follows: 2.4 for Dakar, 2.7 for Saint-Louis, 2.9 for Mbour, and 1.87 for Cap-Skring. It is important to note that the most active years are in the interval 2000–2023. For example, 14 events were observed in Dakar in 2012, 15 in Saint-Louis in 2010, 16 in Mbour in 2018, and 10 in Cap-Skring in 2002.

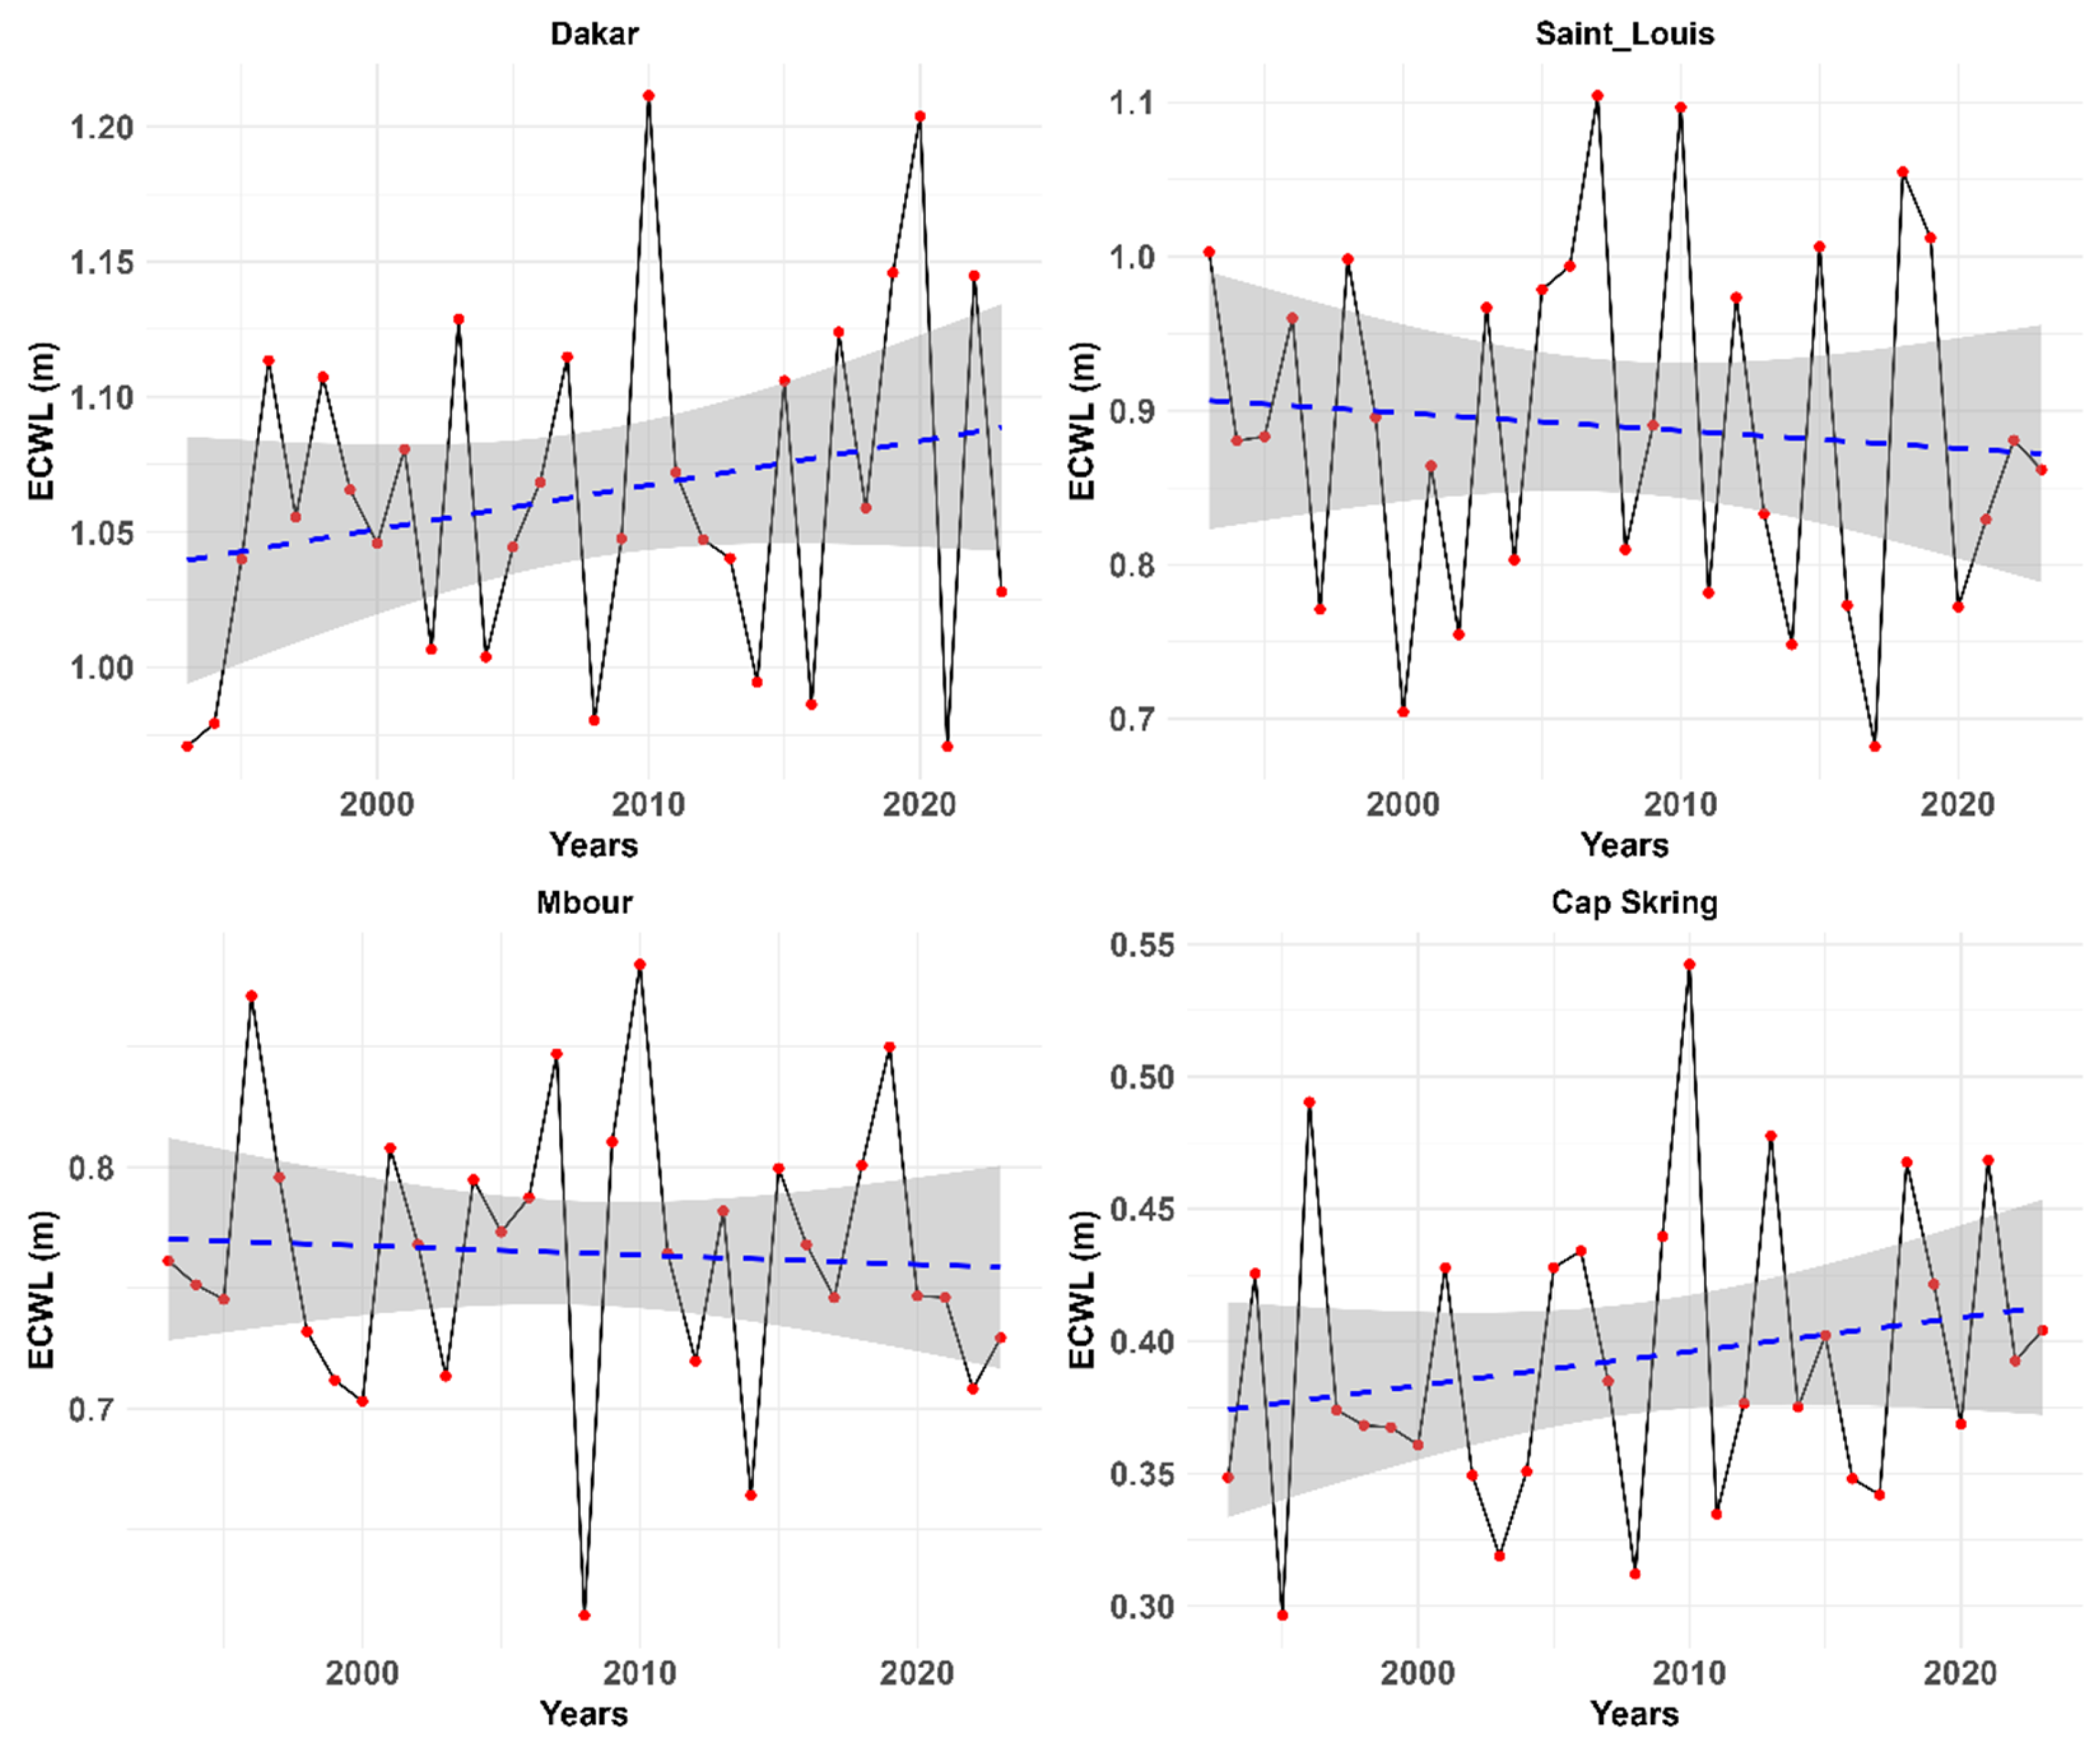
Evolution of the Mean Coastal Extreme Water Level (ECWL) of Storms

Considering that the severity of damage caused by coastal storms mainly depends on the ECWL, it is important to quantify the trend in the evolution of the mean ECWL of storms. The results show that this evolution differs according to the four sites between 1993 and 2023.
Comparative reading of Figure 5 indicates two contradictory trends: some regions show an increase while others show a decrease in the mean ECWL. The coastal region of Dakar stands out among the four sites, being the only one showing an apparent increasing trend. The Mann–Kendall τ estimated for Dakar is 0.13, with a p-value of 0.292 (Table 3), indicating that the trend is not statistically significant.
In contrast, Saint-Louis, Mbour, and Cap-Skring present negative τ values, suggesting an apparent decrease in mean ECWL, but it should be noted that the p-values (>0.23) indicate that these trends are not statistically significant. Figure 5 shows that the ECWL evolves in a very similar manner in the Mbour and Saint-Louis regions, with almost identical variations.
The comparison of Table 2 and Table 3 highlights a paradoxical dynamic: regions where storm frequency increases (Saint-Louis, Mbour, and Cap-Skring) simultaneously show a decreasing trend in mean ECWL. In Dakar, the situation is reversed: although storm frequency decreases, the ECWL associated with identified storms shows an apparent increasing trend. In summary, the results suggest that storm frequency and intensity, represented by ECWL, evolve in a decoupled manner depending on the site, and none of the observed trends are statistically significant.

4.3. Storm Classification

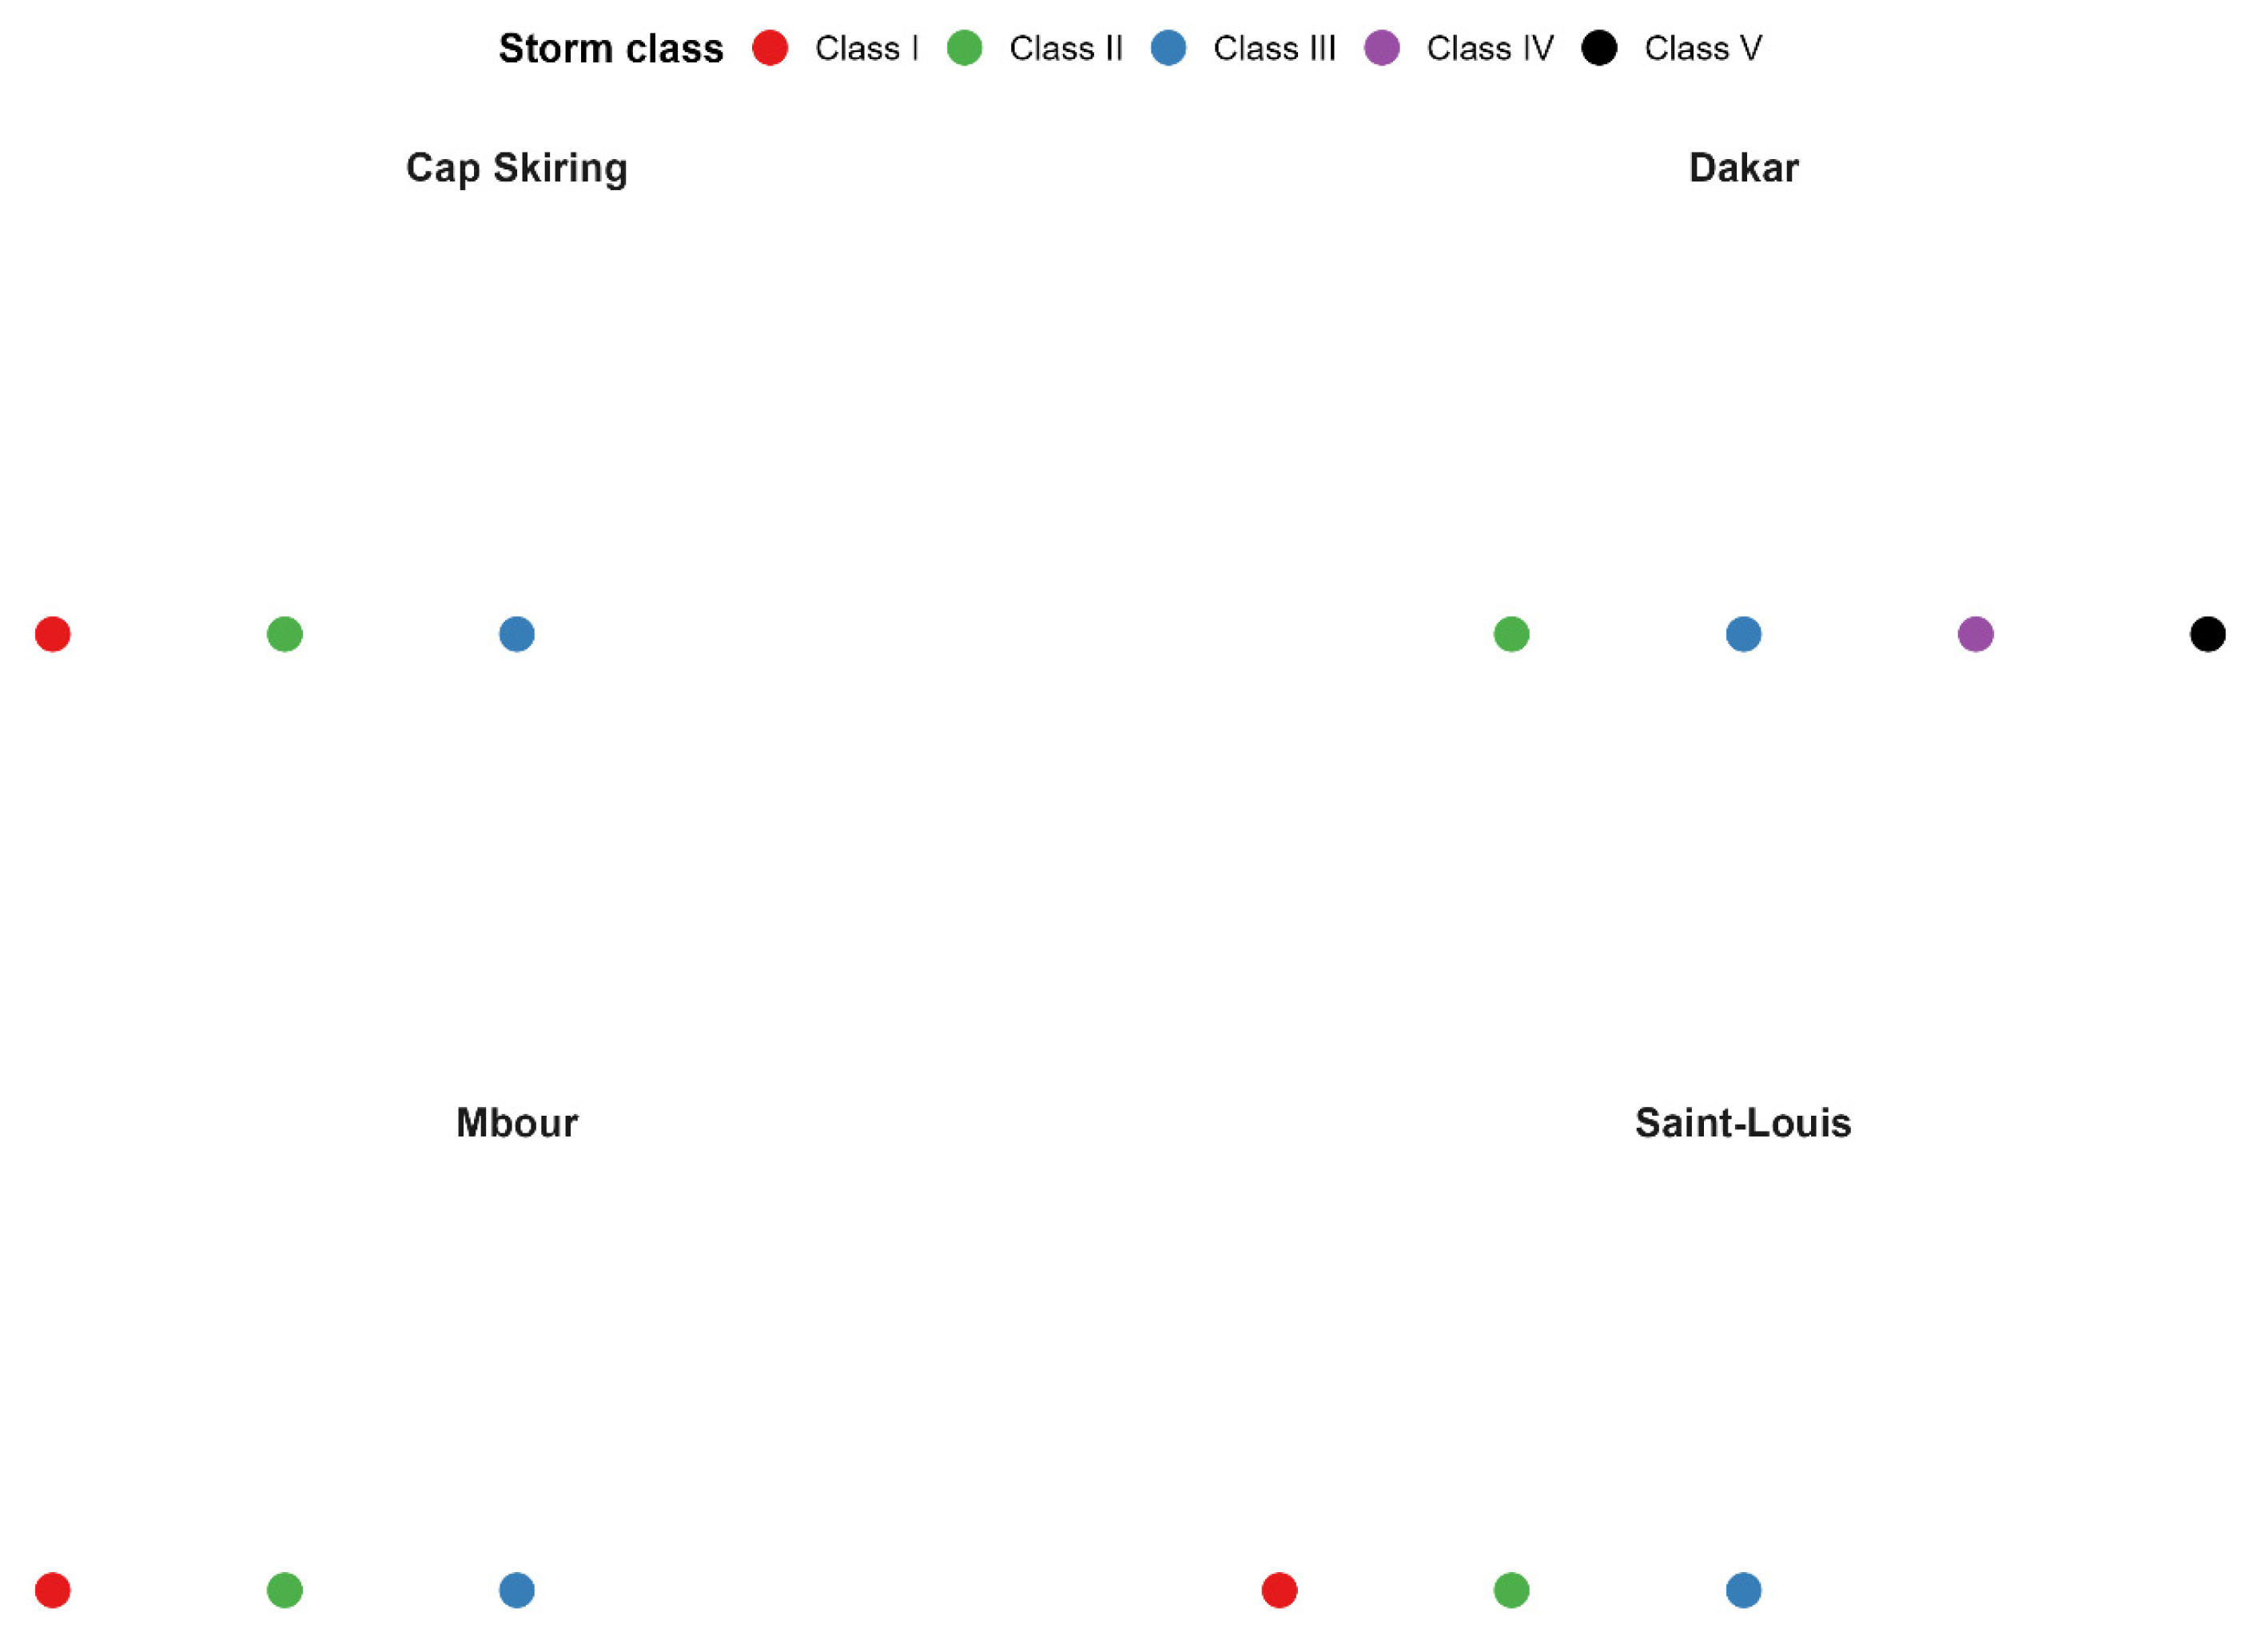
Using the Dolan and Davis (1992) [91] index, Equation (1), the coastal storms identified at the different sites were classified based on their energy content (Table 1). The clustering performed allowed the identification of only four classes of storms (Figure 6) out of the five classes defined by Dolan and Davis (1992) [91].
The results obtained reveal that the classes are unevenly distributed across the different sites. Explicitly, the storm intensity classes are heterogeneous. First, in the Dakar region, four classes were detected, Class II, III, IV, and V (Figure 6), corresponding to moderate, significant, severe, and extreme intensity, respectively. Similarly to Dakar, the coastal region of Saint-Louis also records four intensity classes: Class I (weak); II (moderate); III (significant); and IV (severe). In contrast to Dakar and Saint-Louis, the sites of Mbour and Cap-Skring show an analogous profile as each present three intensity classes, namely: I (weak); II (moderate); and III (significant) (Figure 6). Overall, the results of this section highlight the disparate nature of Es, particularly the intensity of storms at the different sites under study: Dakar, Saint-Louis, Mbour, and Cap-Skring.

4.3.1. Influence of Wave Direction on Coastal Storm Intensity

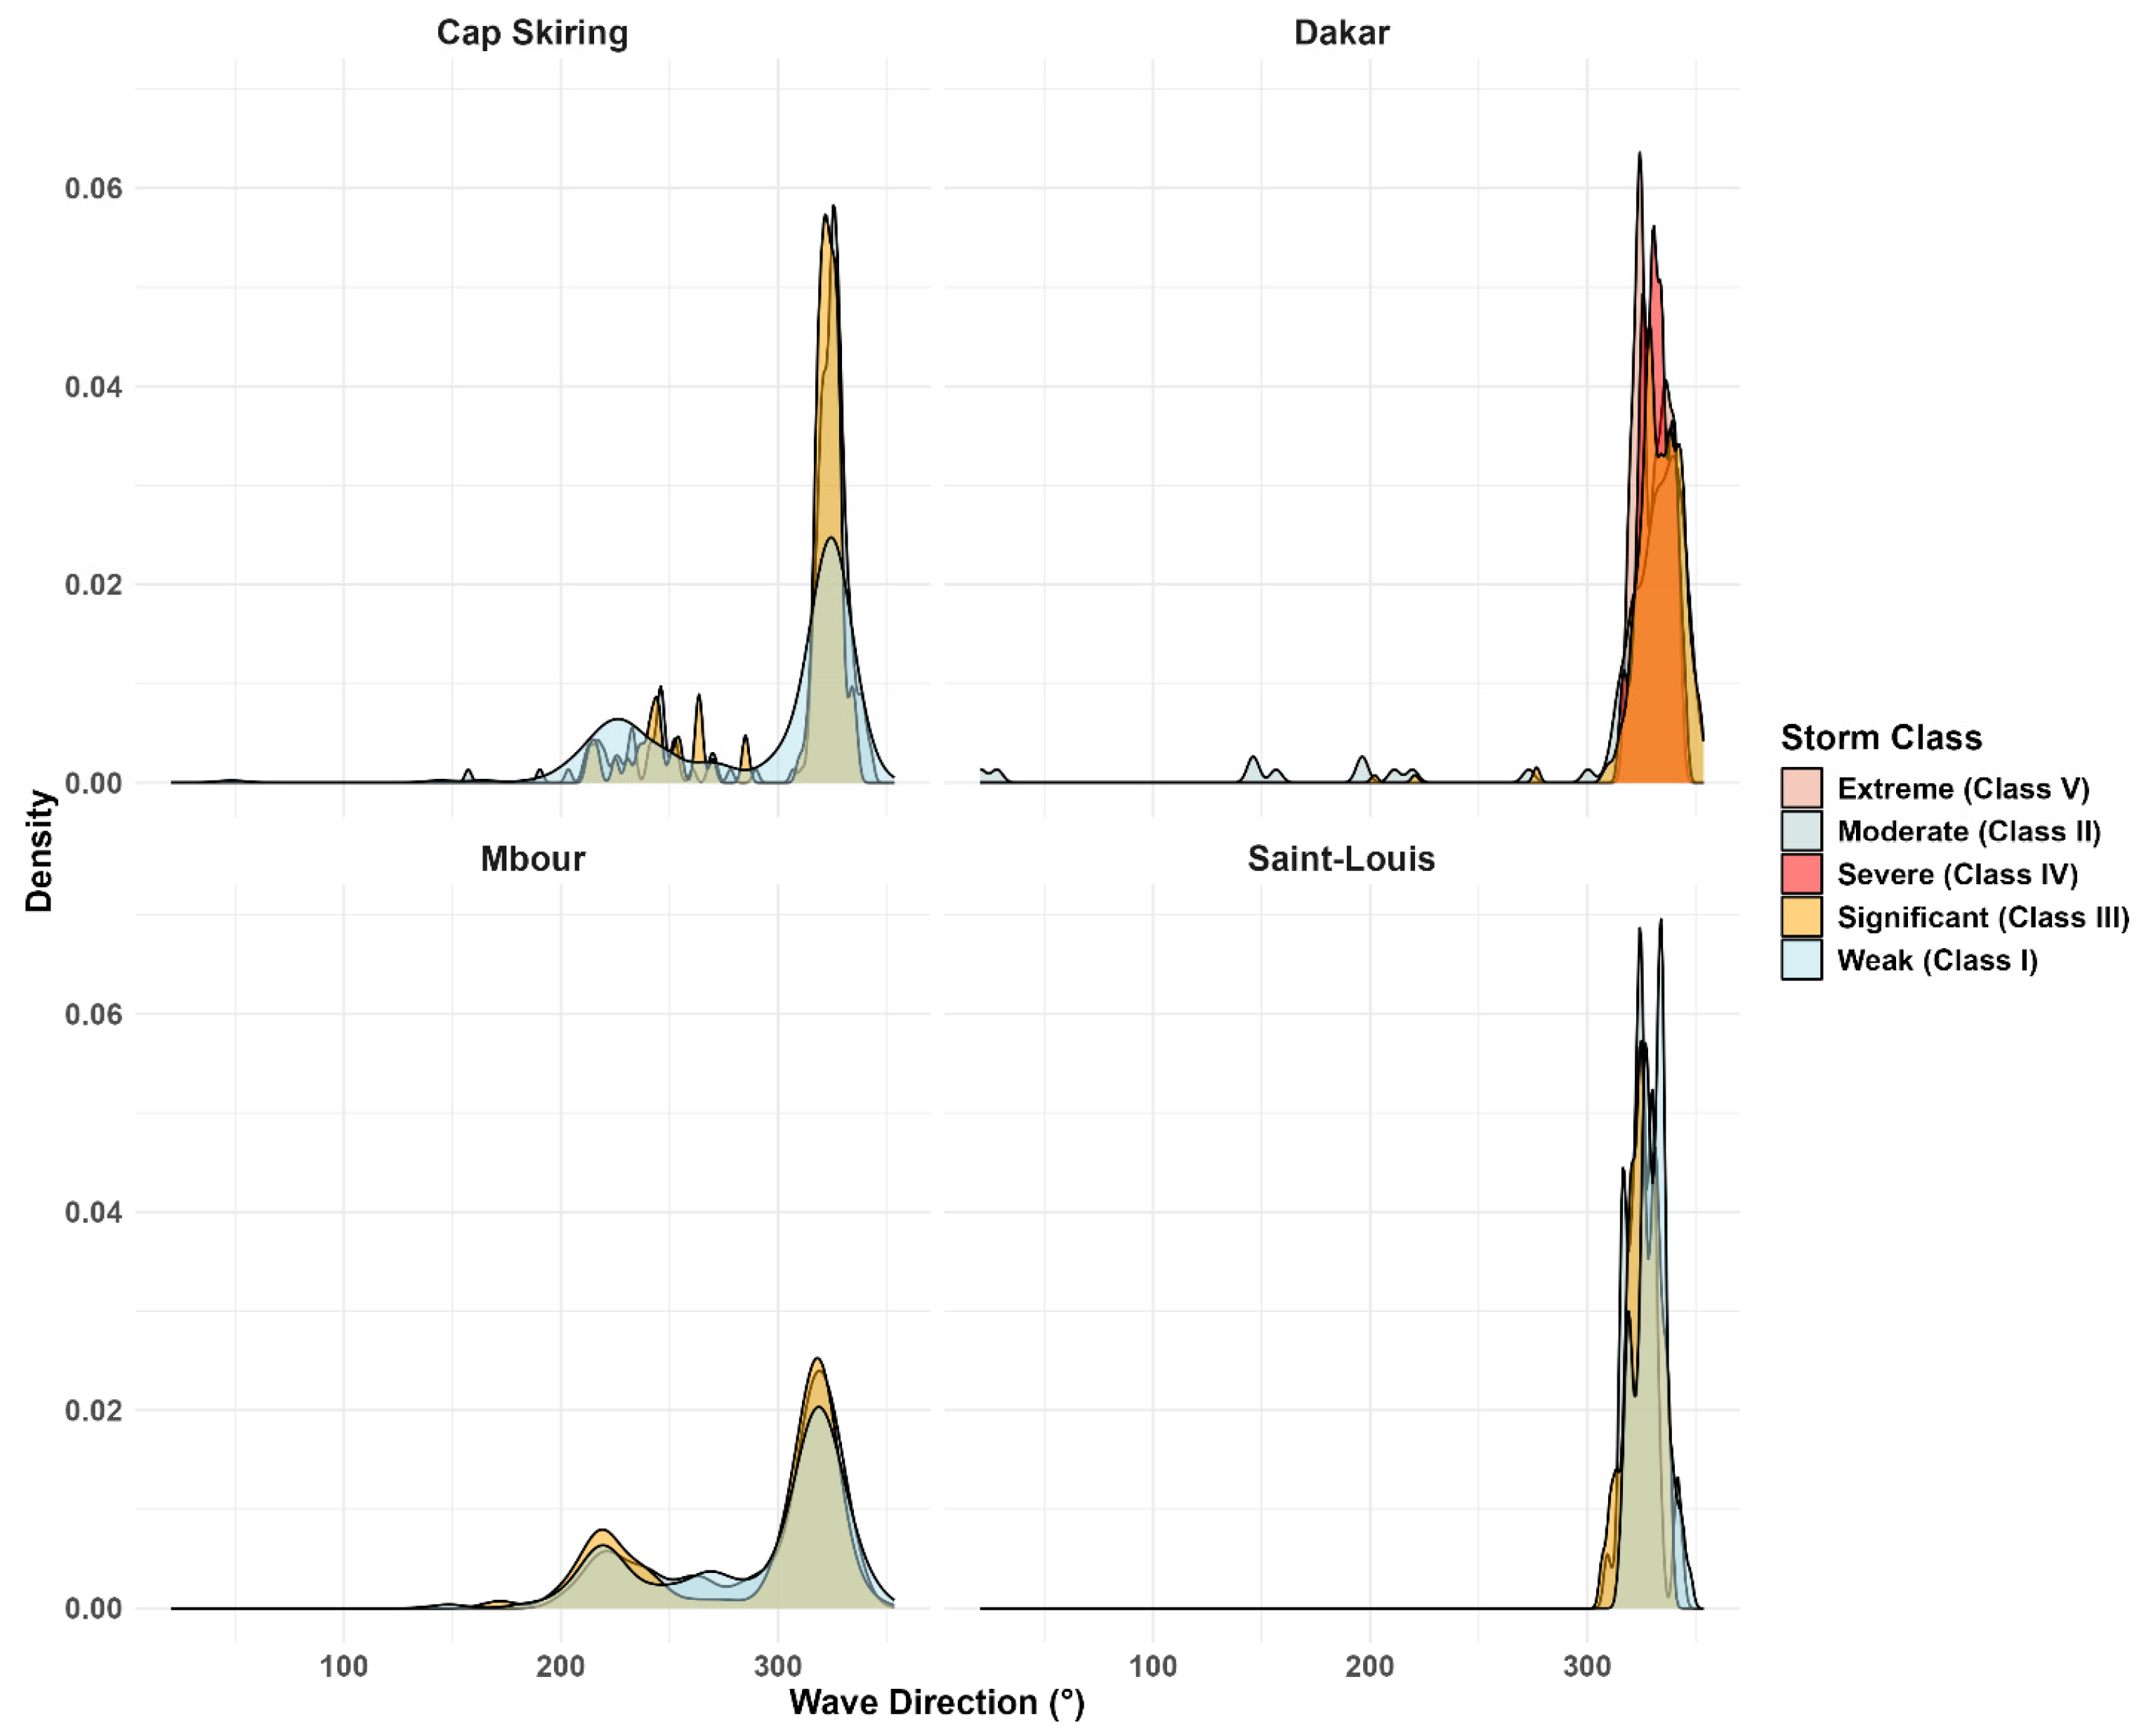
Knowledge of the wave direction generated by storms, according to their intensity, is essential. In this section of the results, we sought to highlight the wave direction for weak, moderate, significant, severe, and extreme.
Figure 7 provides information on the variability of coastal storm intensity according to wave direction. Indeed, the analysis of Figure 7 allows understanding the role or the implication of wave direction on the intensity of Es, particularly the storm intensity. Potentially damaging storms (Class IV and V) are often generated by waves from the west-northwest direction (Figure 7). It is also important to emphasize that there is some spatial disparity in the sense that the wave directions that generate intense storms in terms of Es are not the same in all regions.
First, in Dakar, Class III (significant), Class IV (severe), and Class V (extreme) storms are exclusively generated by storms from the west-northwest direction. In contrast to what is observed in Dakar, coastal storms of weak to severe intensity in Saint-Louis are induced by waves coming from the north-northwest (Figure 7).
In Mbour and Cap-Skring, the wave direction is more variable. In Mbour, the intensity of coastal storms ranges from weak to significant. Indeed, waves from the west-northwest and north-northwest directions explain storms of weak to significant intensity. It should be noted that storms with Es belonging to the significant class can also be generated by waves from the south and west-southwest directions. Like the Mbour coastal region, Cap-Skring is characterized by three types of storms based on Es (Class I weak; Class II moderate; Class III significant). Nevertheless, it is observed that weak intensity storms are primarily generated by waves coming from the west-northwest and northwest. Moreover, unlike what is observed in the other sites, particularly Dakar and Saint-Louis, moderate intensity storms are induced by waves from the south and west-northwest directions.

4.3.2. Seasonal Distribution of Storms According to Their Intensity

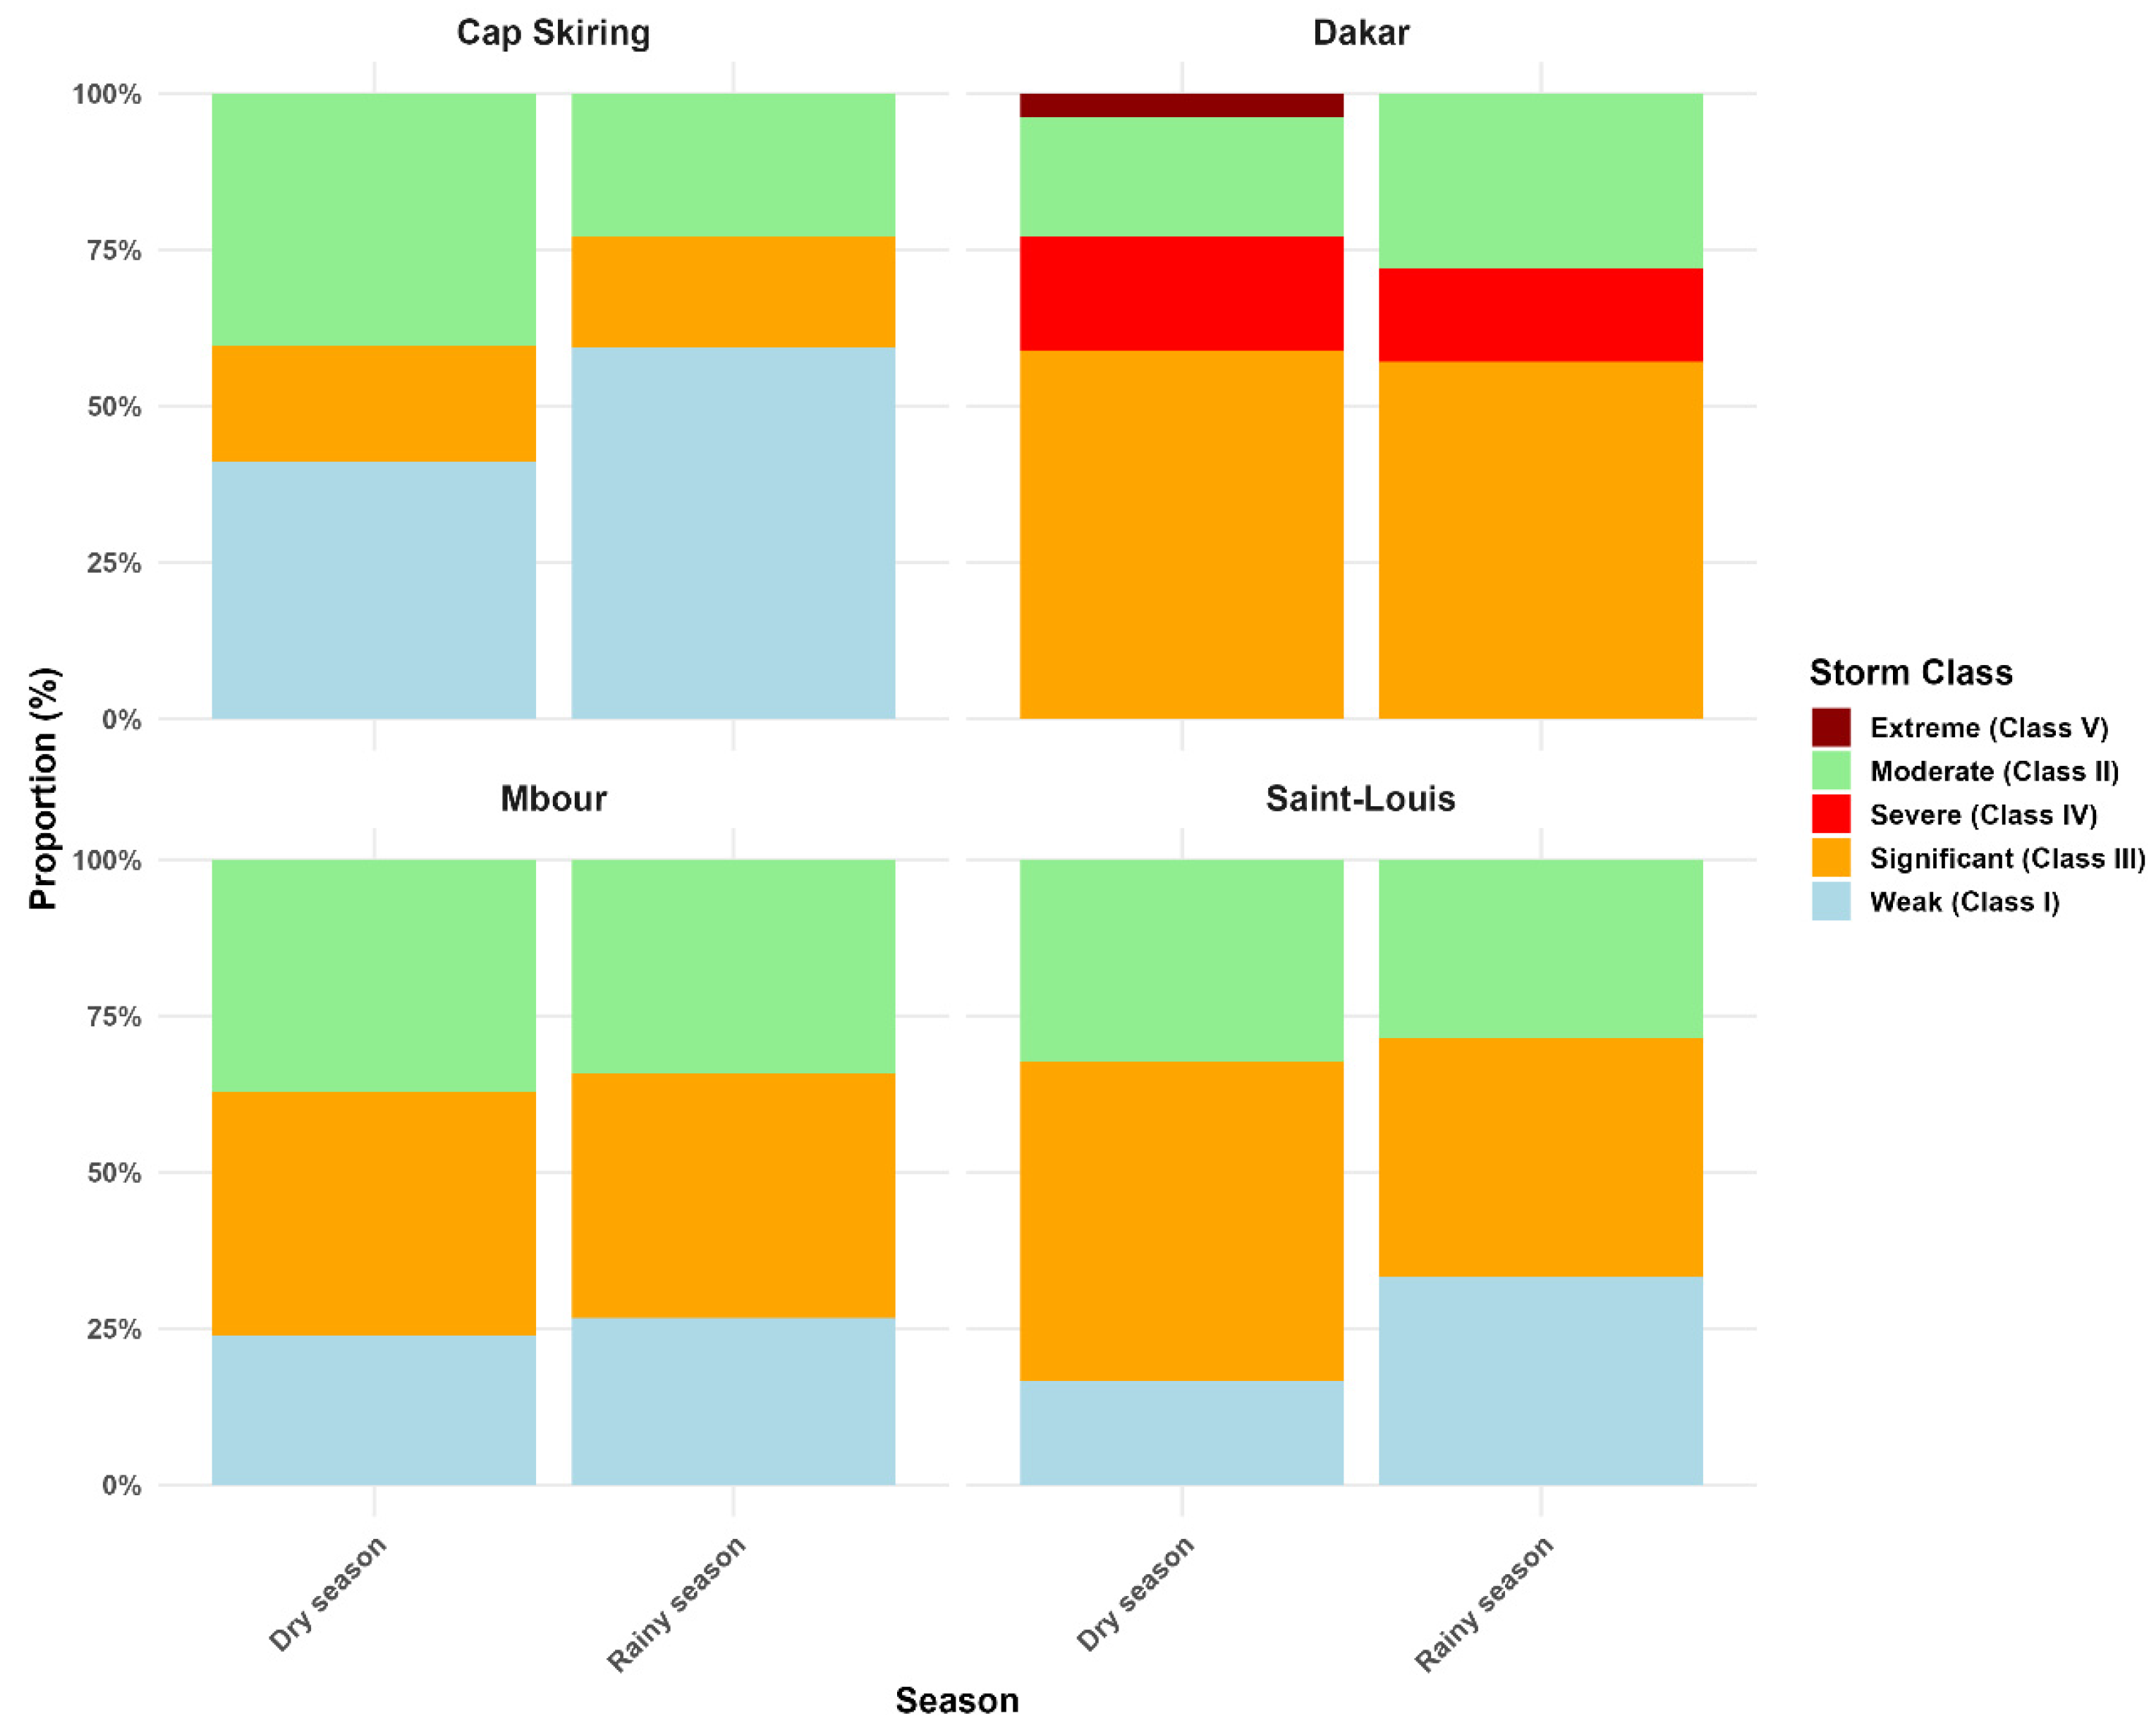
The knowledge of the distribution of storms according to their intensity on an annual or even seasonal scale is important. In this section of the results, the aim is to highlight the distribution of storms and their intensity according to seasonality, particularly the dry and rainy seasons. Climatically, Senegal experiences two seasons annually: the dry season (from November to May) and the rainy season (from June to October).
Figure 8 highlights the seasonal distribution of storms according to their intensity class for the different study sites. Indeed, the reading of Figure 8 shows that most storms occurred during the dry season, across all classes. It should also be noted that storms of low (Class I), moderate (Class II), and significant (Class III) intensity dominate across all sites, namely Dakar, Saint-Louis, Mbour, and Cap Skiring. In contrast, severe and extreme storms (Class IV and V) are not only rare but are observed exclusively in Dakar. In terms of frequency and high-intensity storms, the Dakar coastal region stands out, followed by Saint-Louis. Conversely, the coastal regions of Mbour and Cap Skiring mainly experience low-intensity storms. Overall, many storms in these regions occur during the dry season.

4.3.3. Spatial Distribution of Coastal Storm Intensity Along the Senegalese Coast

Since storm intensity is generally unevenly distributed spatially, it is important to highlight the distribution of the different intensity classes, estimated from the Dolan and Davis (1992) [91] index, across the four study sites.
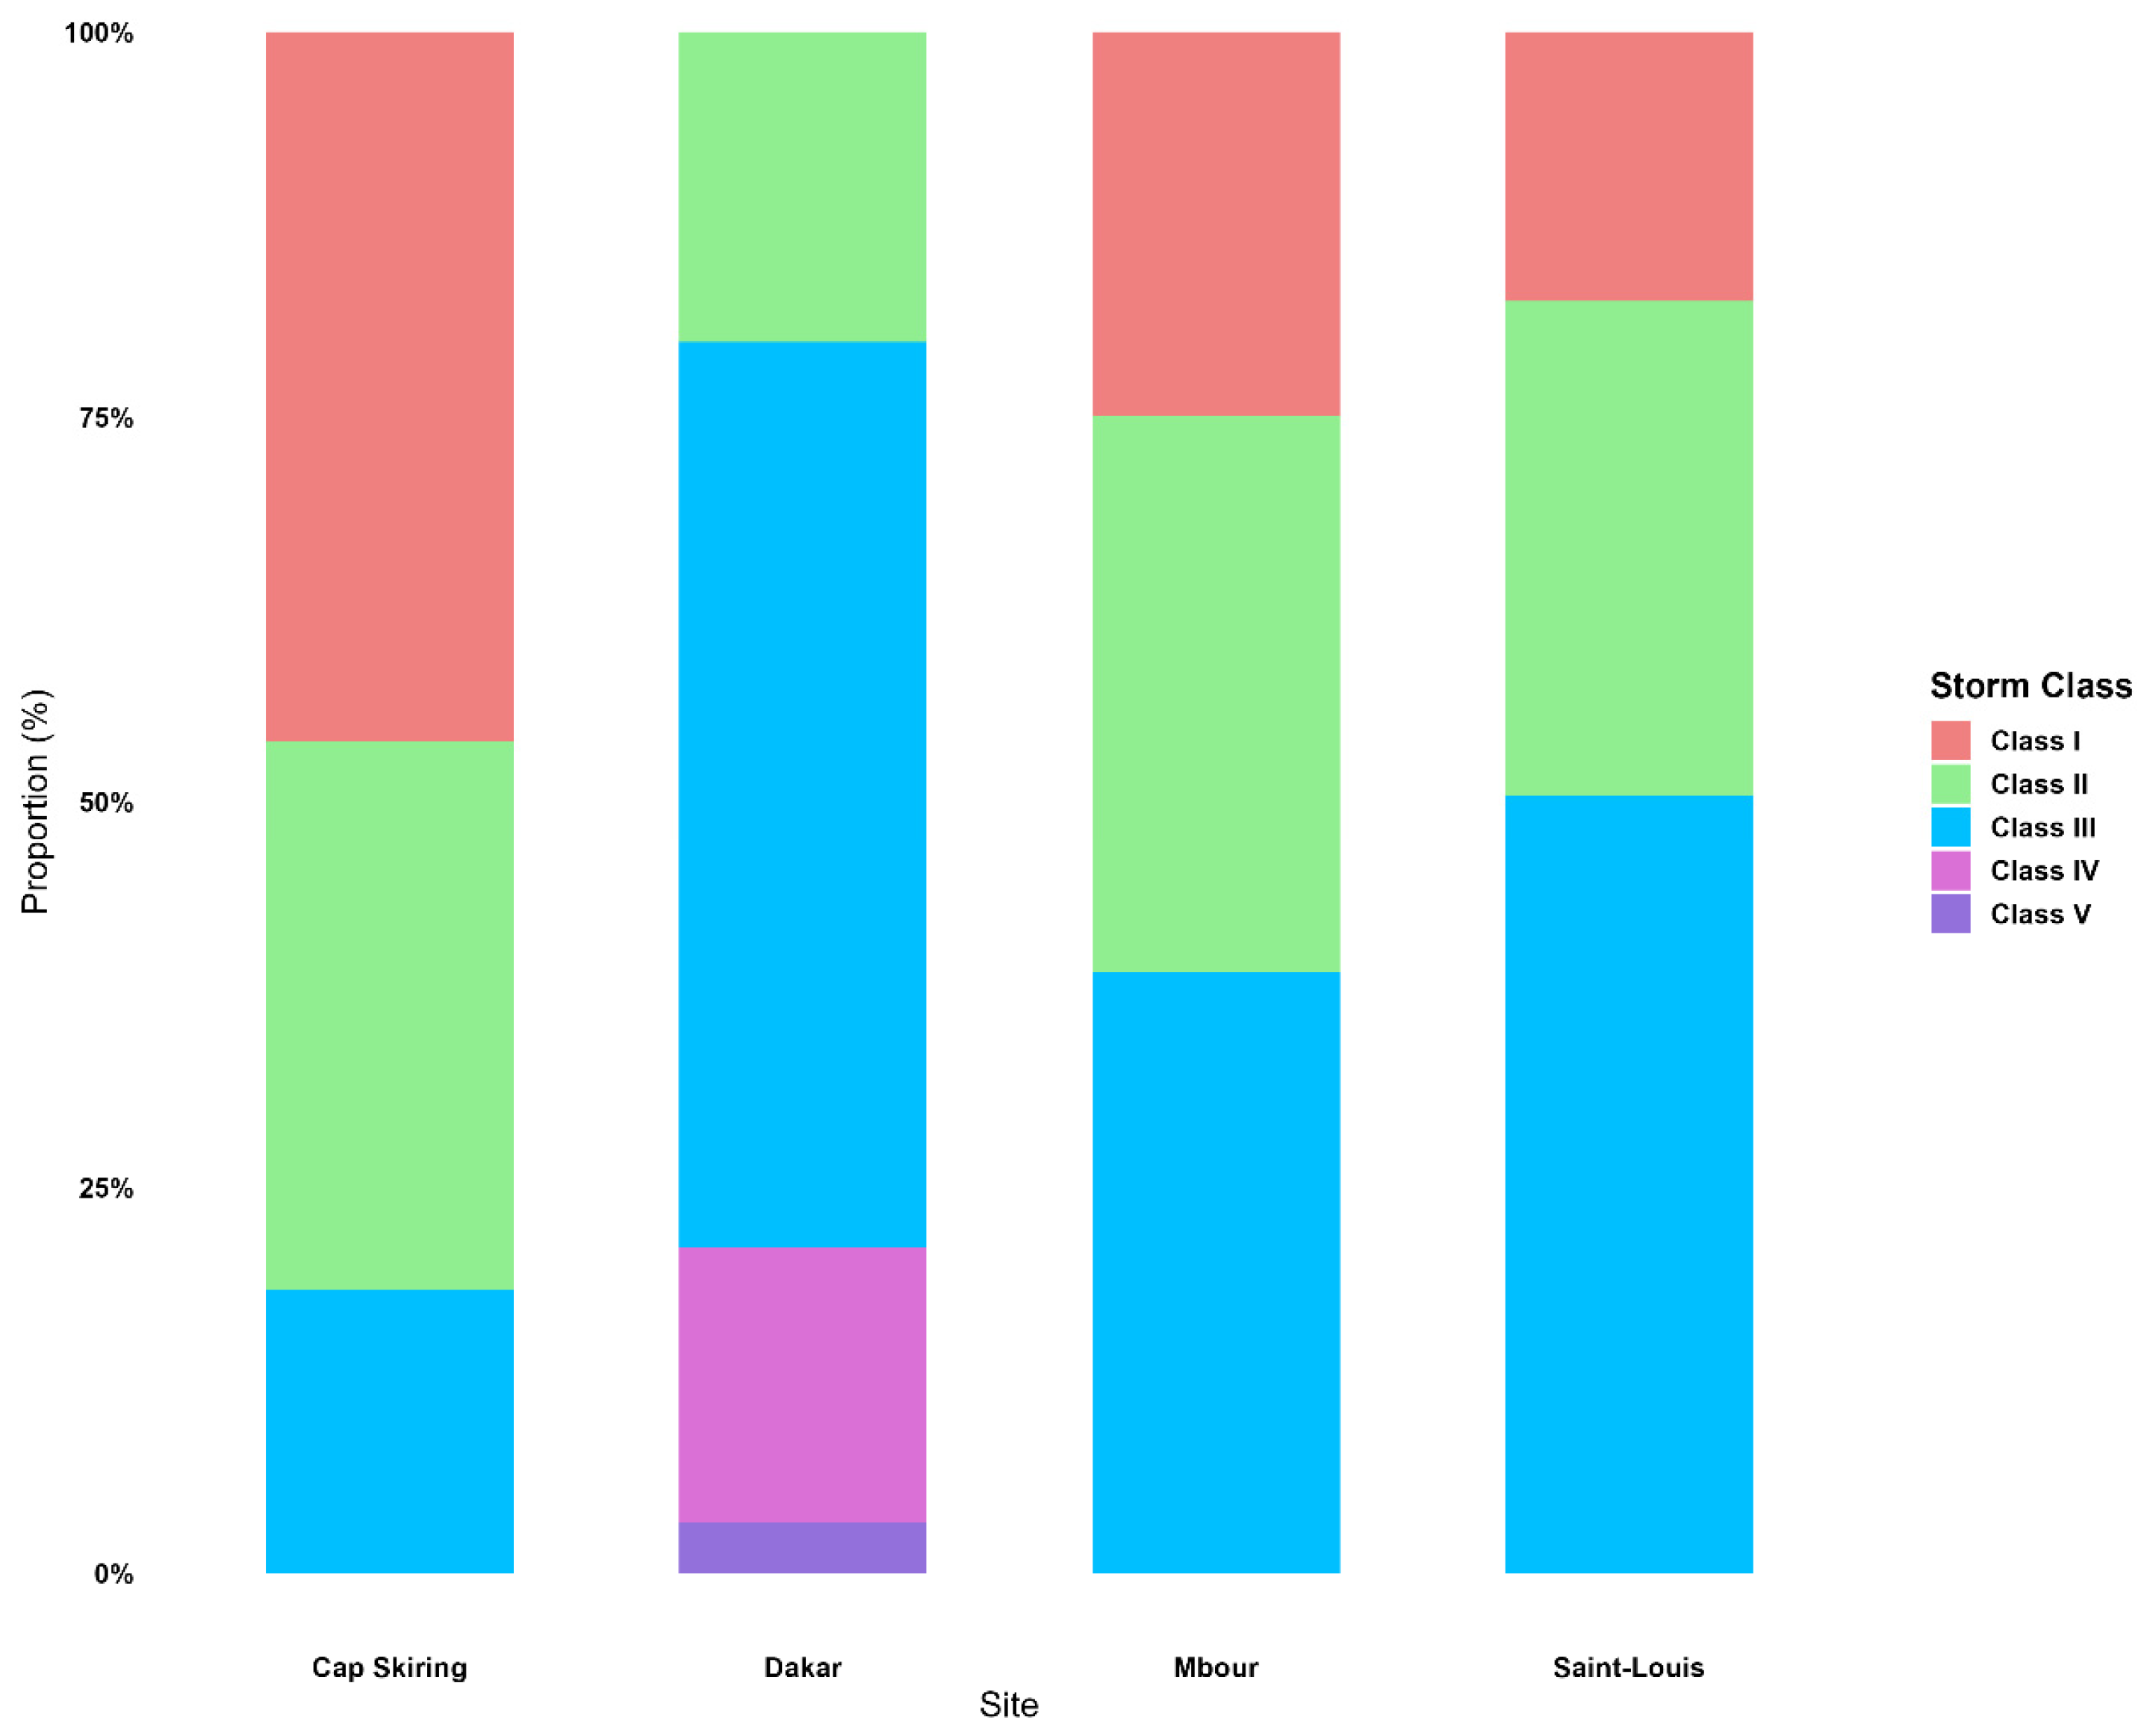
Figure 9 illustrates the proportion of each storm intensity class at the different study sites. The results clearly show that the spatial distribution of storm intensity classes is uneven. Firstly, it is important to note that storm intensity is heterogeneous at the spatial scale. The coastal regions of Dakar and Saint-Louis are the most vulnerable in terms of storm intensity, as the most violent storms in terms of intensity (Class IV—Severe and Class V—Extreme) are observed there. In Dakar, severe storms represent nearly 18% of the recorded storms, whereas in Saint-Louis, severe storms (Class IV) account for approximately 10% of the identified storms in this coastal region (Figure 9). Extreme storms are only observed in Dakar among all sites, representing roughly 2–3%.
The two coastal regions, Dakar and Saint-Louis, share some similarities: moderate storms are the most common in both regions, representing about 60% of storms. Like Dakar and Saint-Louis, the coastal regions of Mbour and Cap Skiring exhibit comparable characteristics, but they differ from those of Dakar and Saint-Louis. Figure 9 shows that Mbour and Cap Skiring share the same storm intensity classes, namely Class I, II, and III (low, moderate, and significant), but the proportions of these classes differ. Specifically, significant storms account for about 40% of the storm sample in Mbour, while at Cap Skiring they represent only about 5%. Moderate storms account for 35% in Mbour and 21% in Cap Skiring. Finally, low-intensity storms dominate the coastal region of Cap Skiring (62%) and represent 25% in Mbour.
Overall, storm intensity is higher in the coastal regions of Dakar and Saint-Louis. In contrast, in descending order, Cap Skiring and Mbour are the least exposed to storm energy (Es). In other words, storms are less severe in these two regions, as storm severity is directly related to its energy content (Es), especially in Cap Skiring.

4.4. Storm Duration at the Different Study Sites

Storm duration is an important factor in the study of coastal extremes. Indeed, an extreme-intensity storm (Class V) with a long duration will cause more damage than a short-duration storm of the same extreme intensity.
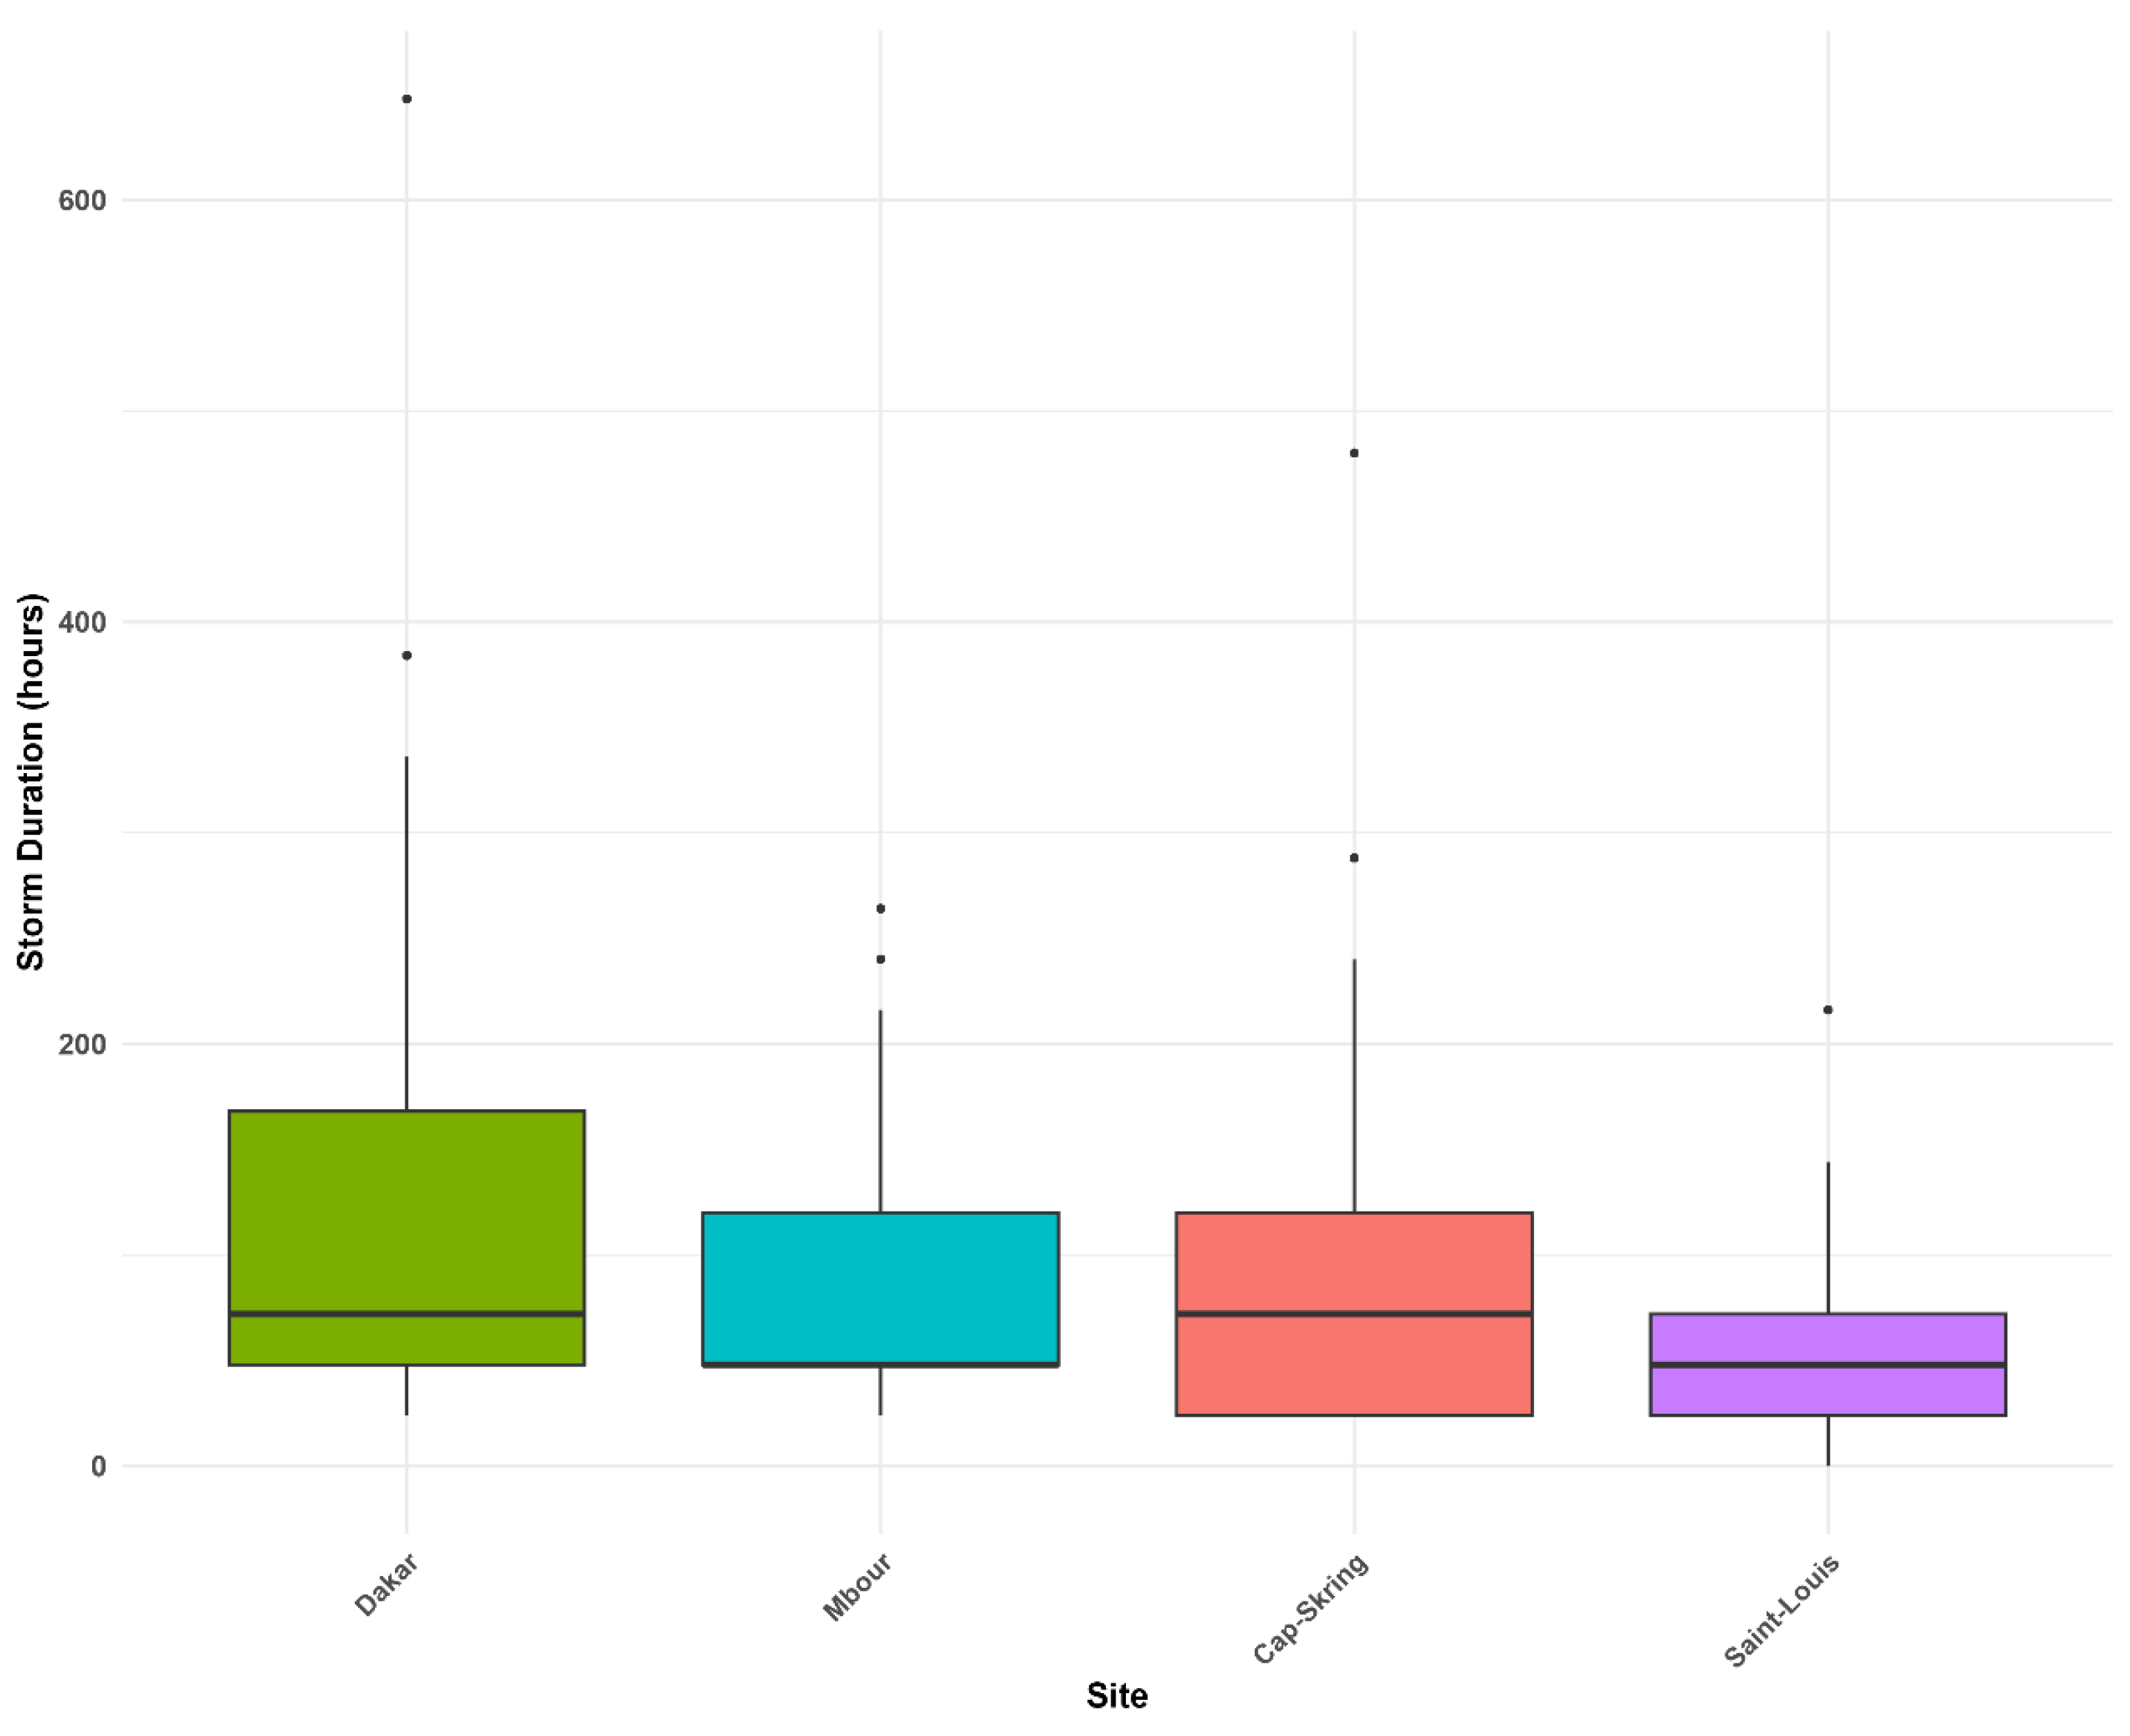
The results indicate a considerable spatial variation in storm duration at Cap Skiring, Dakar, Mbour, and Saint-Louis (Figure 10). Notably, the longest storms are observed in Dakar and Saint-Louis. In these two regions, the median storm duration (Figure 10) is around 90 h. Furthermore, it is worth noting that 25% of coastal storms in these regions last more than 180 h (Figure 10). In contrast, the regions of Mbour and Cap Skiring are quite similar, although a slight difference exists. Figure 10 shows that 50% of storms in Cap Skiring have a duration below 40 h. In this region, the longest storm lasted 216 h. This storm began on 20 February 2004, at 12:00 and ended on 29 February 2004, at 23:00. It is classified as a Class III event (significant intensity). The shortest storm occurred from 5 September 2023, at 12:00 to 6 September 2023, at 11:00 (Class I—low intensity).
Regarding the coastal region of Mbour, the longest storm was recorded from 2 September 2010, at 12:00 to 13 September 2010, at 11:00 (Class III—significant intensity), lasting 264 h. During this period, the significant wave height remained above the threshold of 1.30 m (the 95th percentile for the Mbour region).
In contrast, the longest storms were identified in the two major coastal regions: Dakar (current capital of Senegal) and Saint-Louis (former capital of Senegal). The maximum duration of 648 h was observed in both Dakar and Saint-Louis. This storm occurred from 22 February 2018, at 12:00 to 21 March 2018, at 11:00. Its intensity was classified as extreme in Dakar (Class V) and severe in Saint-Louis (Class IV). Furthermore, Figure 10 shows that less than 75% of storms have a duration of 180 h or less, particularly in Dakar, the capital of Senegal. The median storm durations (Figure 10) in Dakar and Saint-Louis indicate that storm durations in these two regions are almost identical.

Relationship Between Storm Duration and Intensity

This section focuses on the relationship between storm duration and intensity, characterized according to the classes defined by Dolan and Davis (1992) [91].
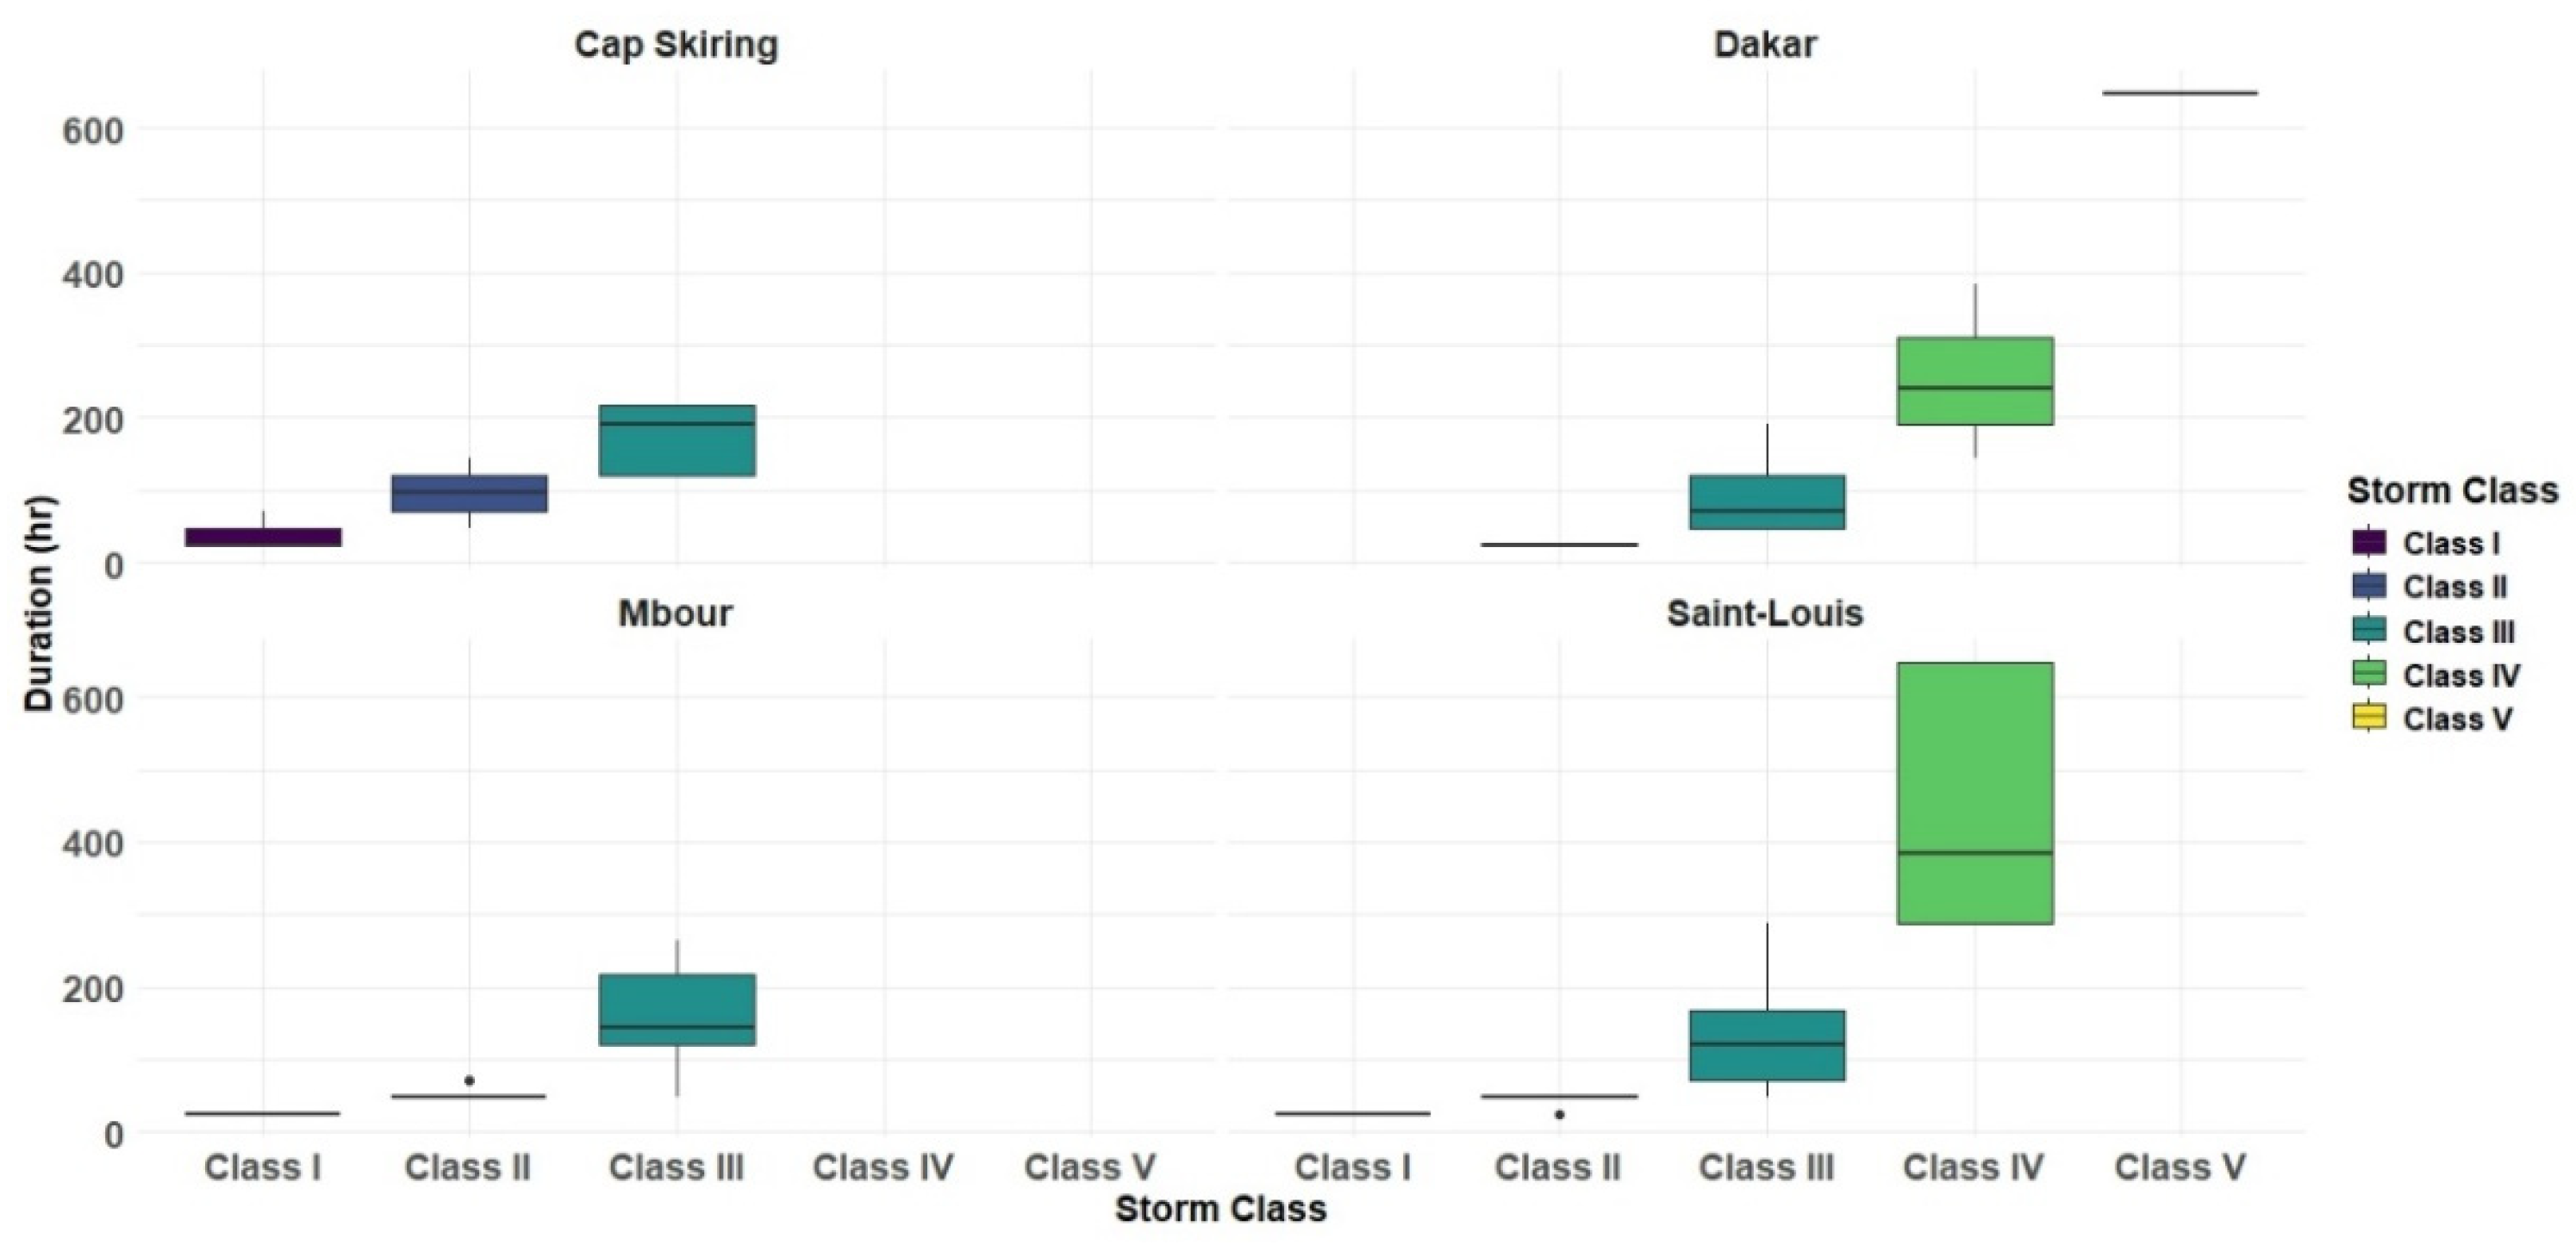
Visually, Figure 11 reveals an uneven spatial distribution of median storm duration, suggesting the existence of a linear relationship between storm duration and intensity. Across all sites, the median duration is not stable and appears somewhat variable. It should be noted that the longest storms often generate a considerable storm energy ( E s , Equation (1)). In Dakar and Saint-Louis, severe storms (Class III) correspond to long-duration events (264 h in Saint-Louis). Conversely, storms characterized by low or moderate intensity generally last 24 h or less. Moreover, storm variability is more pronounced along the coastal regions of Dakar and Saint-Louis, as indicated by the variations in the boxplots and median values for these regions. Overall, extreme and severe intensity classes are also observed in Dakar and Saint-Louis.

5. Discussion

Today, the abundance of scientific publications on coastal storms highlights the urgency of this issue for policymakers and coastal communities. Given the potentially damaging socio-economic and morphogenetic impacts on the Senegalese coast [98], it is crucial to study these events, as scientific information is essential for informed decision-making. According to [99], it is vital to identify the locations of coastal flooding in order to determine the meteorological and tidal conditions responsible. This study addresses this need.
The analysis of hydrodynamic, meteorological, and oceanographic data shows that the study sites (Dakar, Saint-Louis, Mbour, and Cap Skiring) are exposed to coastal storms, albeit at varying intensities. The number of extreme events identified based on the significant wave height (95th percentile threshold) clearly demonstrates this. The thresholds used in this study (95th percentile) highlight that the energy levels of waves responsible for 6 h storms differ from one site to another: 2.01 m in Dakar, 1.56 m in Saint-Louis, 1.30 m in Mbour, and 0.94 m in Cap Skiring. This shows that wave characteristics vary across the four coastal regions, and a storm detection threshold for one region is not applicable to others [88]. Factors explaining these differences include the continental shelf configuration, wave incidence angle, and fetch. Consequently, sites with lower thresholds (Mbour and Cap Skiring) likely have bathymetry and limited fetch. Indeed, [91] notes that coastal storm wave development depends on wind speed, duration, and fetch.
Although detection thresholds vary between sites, numerous storms were identified across all four regions. Significant wave heights are higher in Dakar and Saint-Louis. According to [54], along the NW swell refraction (dominant swell), wave heights drop by roughly half when reaching the Petite Côte. Hence, significant wave heights are higher along the Grande Côte (Dakar to Saint-Louis) than along the southern coast (Dakar to Mbour). Dakar is more exposed to swell action, with its morphology naturally diffracting wave energy, explaining lower Hs values on the Petite Côte.
To identify sites vulnerable to extreme coastal events, storm energy (E_s) was estimated using the index from [91]. Storms were classified by intensity according to [91]. The most severe storms were observed, in descending order, at Dakar, Saint-Louis, Mbour, and Cap Skiring. The two most violent storms (Classes IV and V) occurred at Saint-Louis and Dakar, respectively.
To understand storm dynamics along Senegal’s four coastal regions, the Mann–Kendall τ-test was used to assess the evolution of storm frequency. The results show that the evolution of storm frequency is not spatially homogeneous and varies between sites. Among the four regions, Mbour shows the highest τ (~0.10), which suggests a variation in storm frequency. However, the associated p-value exceeds 0.05 (Table 2), indicating that this variation is not statistically significant. Therefore, no robust trend regarding storm frequency can be affirmed for the period 1993–2023.
In Dakar, a slight apparent decrease in storm frequency is observed (negative τ), but again, the high p-value indicates that this trend is not statistically significant. Similarly, Saint-Louis and Cap Skiring show similar trends in storm frequency, but these trends remain statistically non-significant.
Coastal storms associated with high extreme water levels (ECWL) are potentially damaging. ECWLs for storms detected between 1993 and 2023 were quantified using Equation (2). The Mann–Kendall test evaluated trends in mean storm ECWL. Among the four sites, only Dakar shows a slight apparent increase in mean ECWL (τ = 0.13), but the p-value (0.29198) indicates that this trend is not significant (Table 3). This suggests that there is no statistically significant trend in the increase in ECWL at Dakar over the study period. In contrast, Saint-Louis, Mbour, and Cap Skiring exhibit negative τ values, but these trends are also statistically non-significant.
Cross-referencing Table 2 and Table 3, as well as Figure 4 and Figure 5, reveals contrasting dynamics between storm frequency and ECWL. Regions with an apparent increase in storm frequency (Saint-Louis, Mbour, Cap Skiring) show a paradoxical decrease in associated ECWL. Conversely, in Dakar, an apparent decrease in frequency accompanies an apparent increase in ECWL, suggesting a decoupling between storm frequency and hydrodynamic intensity, but this relationship is not statistically significant.
Storm classification based on E_s shows an uneven spatial distribution. The most intense storms occur at Dakar and Saint-Louis (Figure 6). At Dakar, intensities range from moderate to extreme (Classes II–V), while at Saint-Louis, they range from low to severe (Classes I–IV). In Mbour and Cap Skiring, storm intensity is generally lower, with the most energetic storms classified as significant (Class III). Even so, significant storms in Mbour and Cap Skiring can still cause coastal damage. Wave energy is higher on the northern coast (Dakar and Saint-Louis) than on the southern coast (Mbour and Cap Skiring) [38,54,100].
The relationship between storm frequency and wave direction shows that the most energetic storms (severe and extreme) are often driven by west-northwest waves in Dakar, and by north-northwest waves in Saint-Louis. In Mbour and Cap Skiring, wave directions are more variable. Seasonally, waves exhibit strong variability [54]. Significant storms in Mbour and Cap Skiring can also result from south and southwest swells, typical of Senegal’s southern coast. These southerly swells in boreal summer strongly influence sediment drift [101].
Storms and their intensities are unevenly distributed annually. Seasonal analysis shows most storms occur during the dry season (November–May) rather than the rainy season (June–October). The dominance of dry-season storms may relate to its longer duration (6 months) compared to the rainy season (3 months). Waves are more energetic in the rainy season, potentially affecting storm frequency and intensity, although the most destructive swells occur during the dry season [54].
Storm intensity is spatially heterogeneous. Extreme storms are mainly observed in Dakar and Saint-Louis, with severe storms representing around 18% and 10%, respectively (Figure 9). In Mbour and Cap Skiring, Class III (significant) storms predominate (40% in Mbour, low-intensity Class I storms dominate in Cap Skiring). This spatial variation may reflect differences in wave characteristics and storm duration, as E_s depends on Hs and storm duration (Equation (1)). Figure 10 and Figure 11 show spatial differences in storm duration, with the longest storms in Dakar and Saint-Louis. Hydrodynamic variability in storm duration may be explained by bathymetry and wave fetch [102], as well as wind intensity and direction.
There is a linear relationship between storm duration and intensity: severe and extreme storms are the longest, whereas short-duration storms are generally low to moderate intensity. Most storms lasting ≤24 h are low intensity. Duration amplifies storm intensity and potential impacts [88]. Consecutive and long-duration storms impose significant loads on coastal structures and reduce beach recovery time [103,104]. Long-duration storms are generally associated with high Hs and Tp values.
It should be noted that the ERA5 wave data, with a spatial resolution of 0.5° (~55 km), do not resolve nearshore wave transformation processes such as refraction, shoaling, or breaking. Therefore, the equation of [63], parameterization applied here provides a first-order approximation of run-up suitable for large-scale analyses but may not capture local-scale variability, particularly in complex coastal settings such as estuaries and deltas. The resulting ECWL estimates should thus be interpreted as spatially consistent indicators of relative variability rather than precise local predictions. Future efforts coupling regional wave models or high-resolution remote-sensing data would improve local ECWL representation. As for the lack of significance of the trend in extremes on the Senegalese coast, the wave data from the ERA5 model could explain this. Moreover, according to [105], the ERA5 model data underestimate extremes, but are sufficient to detect them. Indeed, this bias softens the variability of the data, which in turn masks the trend in extremes.
Today, new methodological approaches using machine learning are being used for coastal storm surge detection and coastal storm surge prediction [106,107,108,109]. It would therefore be interesting in future studies to combine this approach with the study of coastal extremes on the Senegalese coastline.

6. Conclusions

Maritime storms are major events with significant morphogenetic and socio-economic impacts. This study, one of the first along the Senegalese coast, better characterizes coastal storms and fills scientific gaps. Results show a spatially uneven storm distribution, with higher occurrence and storm energy ( E s ) in Dakar and Saint-Louis. Temporal evolution of storm frequency is spatially variable: apparent increases occur in Saint-Louis, Mbour, and Cap Skiring, while an apparent decrease occurs in Dakar, though trends are statistically non-significant (p > 0.05).
A notable contrast exists between storm frequency and extreme coastal water levels (ECWL). Regions with increasing storm frequency show a decrease in ECWL, while Dakar shows the opposite. These trends remain statistically non-significant. Most intense storms are generated by west to northwest waves in Dakar and Saint-Louis, whereas Mbour and Cap Skiring have a broader directional range. Storms are more frequent in the dry season (October–May), and duration amplifies intensity, with the longest storms associated with the highest energy content.
These results provide valuable insights into coastal risk in Senegal and can inform improved coastal flood management strategies. Future research could explore the co-occurrence of coastal and fluvial flooding, particularly in estuarine zones, using joint probability approaches (copulas) to better assess combined risks.

Author Contributions

Conceptualization, C.O.T.C.; methodology, C.O.T.C.; software, C.O.T.C.; formal analysis, C.O.T.C.; data curation, R.A. and C.O.T.C.; writing—original draft preparation, C.O.T.C.; writing—review and editing, C.O.T.C., R.A. and M.S.; visualization, C.O.T.C.; supervision, C.O.T.C. All authors have read and agreed to the published version of the manuscript.

Funding

This research received no external funding.

Data Availability Statement

The data presented in this study are available on request from the corresponding author due to ethical and confidentiality restrictions.

Conflicts of Interest

The authors declare no conflicts of interest.

References

  1. Wong, T.E.; Sheets, H.; Torline, T.; Zhang, M. Evidence for increasing frequency of extreme coastal sea levels. Front. Clim. 2022, 4, 796479. [Google Scholar] [CrossRef]
  2. Gorski, J.F.; Dietrich, J.C.; Passeri, D.L.; Mickey, R.C.; Luettich, R.A., Jr. Deterministic, dynamic model forecasts of storm-driven coastal erosion. Nat. Hazards 2024, 121, 6257–6283. [Google Scholar] [CrossRef]
  3. Lobeto, H.; Semedo, A.; Lemos, G.; Dastgheib, A.; Menendez, M.; Ranasinghe, R.; Bidlot, J.R. Global coastal wave storminess. Sci. Rep. 2024, 14, 3726. [Google Scholar] [CrossRef] [PubMed]
  4. Owusu, Y.; Angnuureng, B.D.; Kpogo-Nuwoklo, K.A.; Twum, A.; Nkrumah, F.; Nwanosike, B. Comprehensive analysis of extreme wave events along the West African Coast: A study using WAVERYS data and peak over threshold (pot) method. Afr. Geogr. Rev. 2026, 1–24. [Google Scholar] [CrossRef]
  5. Leal, K.B.; Robaina, L.E.D.S.; De Lima, A.D.S. Coastal impacts of storm surges on a changing climate: A global bibliometric analysis. Nat. Hazards 2022, 114, 1455–1476. [Google Scholar] [CrossRef]
  6. Li, Y.; Zhou, W.H.; Shen, P. Flood risk assessment of loss of life for a coastal city under the compound effect of storm surge and rainfall. Urban Clim. 2023, 47, 101396. [Google Scholar] [CrossRef]
  7. Kunze, S.; Strobl, E.A. The global long-term effects of storm surge flooding on human settlements in coastal areas. Environ. Res. Lett. 2024, 19, 024016. [Google Scholar] [CrossRef]
  8. Yin, J.; Yang, Y.; Yu, D.; Lin, N.; Wilby, R.; Lane, S.; Guan, M. Strategic storm flood evacuation planning for large coastal cities enables more effective transfer of elderly populations. Nat. Water 2024, 2, 274–284. [Google Scholar] [CrossRef]
  9. Maspataud, A.; Ruz, M.H.; Vanhée, S. Potential impacts of extreme storm surges on a low-lying densely populated coastline: The case of Dunkirk area, Northern France. Nat. Hazards 2013, 66, 1327–1343. [Google Scholar] [CrossRef]
  10. Duran, R.; Guillén, J.; Ruiz, A.; Jiménez, J.A.; Sagristà, E. Morphological changes, beach inundation and overwash caused by an extreme storm on a low-lying embayed beach bounded by a dune system (NW Mediterranean). Geomorphology 2016, 274, 129–142. [Google Scholar] [CrossRef]
  11. Hsiao, S.C.; Chiang, W.S.; Jang, J.H.; Wu, H.L.; Lu, W.S.; Chen, W.B.; Wu, Y.T. Flood risk influenced by the compound effect of storm surge and rainfall under climate change for low-lying coastal areas. Sci. Total Environ. 2021, 764, 144439. [Google Scholar] [CrossRef] [PubMed]
  12. Spiske, M.; Pilarczyk, J.E.; Mitchell, S.; Halley, R.B.; Otai, T. Coastal erosion and sediment reworking caused by hurricane Irma–implications for storm impact on low-lying tropical islands. Earth Surf. Process. Landf. 2022, 47, 891–907. [Google Scholar] [CrossRef]
  13. Gao, L.; Du, H.; Huang, H.; Zhang, L.; Zhang, P. Modelling the compound floods upon combined rainfall and storm surge events in a low-lying coastal city. J. Hydrol. 2023, 627, 130476. [Google Scholar] [CrossRef]
  14. Davlasheridze, M.; Fan, Q.; Highfield, W.; Liang, J. Economic impacts of storm surge events: Examining state and national ripple effects. Clim. Change 2021, 166, 11. [Google Scholar] [CrossRef]
  15. Maximiliano-Cordova, C.; Martínez, M.L.; Silva, R.; Hesp, P.A.; Guevara, R.; Landgrave, R. Assessing the impact of a winter storm on the beach and dune systems and erosion mitigation by plants. Front. Mar. Sci. 2021, 8, 734036. [Google Scholar] [CrossRef]
  16. Dudzińska-Nowak, J. Coastal Erosion, Protection Structures, and Subsequent Shoreline Effects. A Case Study from the Western Polish Coast (Southern Baltic Sea); Wydawnictwo Naukowe Uniwersytetu Szczecińskiego: Szczecin, Poland, 2022. [Google Scholar]
  17. Pang, T.; Wang, X.; Basheer, S.; Guild, R. Landcover-based detection of rapid impacts of extreme storm on coastal landscape. Sci. Total Environ. 2024, 932, 173099. [Google Scholar] [CrossRef]
  18. Stéphan, P.; Suanez, S.; Guérin, T.; Rivier, A.; Leballeur, L.; Waeles, B.; Houron, J. Breaching of the Sillon de Talbert gravel spit (North Brittany, France) and coastal flooding risk assessment. Geomorphology 2024, 461, 109302. [Google Scholar] [CrossRef]
  19. You, Z.J.; Nielsen, P. Extreme coastal waves, ocean surges and wave runup. In Coastal Hazards; Springer: Dordrecht, The Netherlands, 2012; pp. 677–733. [Google Scholar]
  20. Camelo, J.; Mayo, T.L.; Gutmann, E.D. Projected climate change impacts on hurricane storm surge inundation in the coastal United States. Front. Built Environ. 2020, 6, 588049. [Google Scholar] [CrossRef]
  21. Wolf, J.; Woolf, D.; Bricheno, L. Impacts of climate change on storms and waves relevant to the coastal and marine environment around the UK. MCCIP Sci. Rev. 2020, 2020, 132–157. [Google Scholar]
  22. Chen, C.; Lin, Z.; Beardsley, R.C.; Shyka, T.; Zhang, Y.; Xu, Q.; Xu, D. Impacts of sea level rise on future storm-induced coastal inundations over Massachusetts coast. Nat. Hazards 2021, 106, 375–399. [Google Scholar] [CrossRef]
  23. Cunha, J.; Cardona, F.S.; Bio, A.; Ramos, S. Importance of protection service against erosion and storm events provided by coastal ecosystems under climate change scenarios. Front. Mar. Sci. 2021, 8, 726145. [Google Scholar] [CrossRef]
  24. Vitousek, S.; Barnard, P.L.; Fletcher, C.H.; Frazer, N.; Erikson, L.; Storlazzi, C.D. Doubling of coastal flooding frequency within decades due to sea-level rise. Sci. Rep. 2017, 7, 1399. [Google Scholar] [CrossRef] [PubMed]
  25. Muis, S.; Verlaan, M.; Winsemius, H.C.; Aerts, J.C.; Ward, P.J. A global reanalysis of storm surges and extreme sea levels. Nat. Commun. 2016, 7, 11969. [Google Scholar] [CrossRef] [PubMed]
  26. Bromirski, P.D.; Flick, R.E.; Miller, A.J. Storm surge along the Pacific coast of North America. J. Geophys. Res. Ocean. 2017, 122, 441–457. [Google Scholar] [CrossRef]
  27. Andrée, E.; Su, J.; Larsen, M.A.D.; Madsen, K.S.; Drews, M. Simulating major storm surge events in a complex coastal region. Ocean Model. 2021, 162, 101802. [Google Scholar] [CrossRef]
  28. Camus, P.; Haigh, I.D.; Quinn, N.; Wahl, T.; Benson, T.; Gouldby, B.; Nadal-Caraballo, N.C. Tracking the spatial footprints of extreme storm surges around the coastline of the UK and Ireland. Weather. Clim. Extrem. 2024, 44, 100662. [Google Scholar] [CrossRef]
  29. Batista, C.M. Coastal flood hazard mapping. Encycl. Coast. Sci. 2018, 1, 471–479. [Google Scholar]
  30. Coquet, M.; Mercier, D.; Fleury-Bahi, G. Individuals’ perceptions of areas exposed to coastal flooding in four French coastal municipalities: The contribution of sketch mapping. Geoenviron. Disasters 2018, 5, 15. [Google Scholar] [CrossRef]
  31. Bukvic, A.; Rohat, G.; Apotsos, A.; de Sherbinin, A. A systematic review of coastal vulnerability mapping. Sustainability 2020, 12, 2822. [Google Scholar] [CrossRef]
  32. Hallegatte, S.; Green, C.; Nicholls, R.J.; Corfee-Morlot, J. Future flood losses in major coastal cities. Nat. Clim. Change 2013, 3, 802–806. [Google Scholar] [CrossRef]
  33. Barbaro, G.; Foti, G.; Nucera, A.; Barillà, G.C.; Canale, C.; Puntorieri, P.; Minniti, F. Risk mapping of coastal flooding areas. Case studies: Scilla and Monasterace (Italy). Int. J. Saf. Secur. Eng. 2020, 10, 59–67. [Google Scholar] [CrossRef]
  34. Alves, B.; Angnuureng, D.B.; Morand, P.; Almar, R. A review on coastal erosion and flooding risks and best management practices in West Africa: What has been done and should be done. J. Coast. Conserv. 2020, 24, 38. [Google Scholar] [CrossRef]
  35. Dada, O.A.; Almar, R.; Morand, P. Coastal vulnerability assessment of the West African coast to flooding and erosion. Sci. Rep. 2024, 14, 890. [Google Scholar] [CrossRef] [PubMed]
  36. Mbevo Fendoung, P. Vulnérabilité et adaptation des populations de cap Cameroun aux risques naturels. In Afrique Atlantique; EMS: Havre, France, 2019. [Google Scholar]
  37. Niang-Diop, I. Erosion Côtière sur la Petite Côte du Sénégal à Partir de L’exemple de Rufisque: Passé, Présent, Futur. Doctoral Dissertation, Université d’Angers, Angers, France, 1995. [Google Scholar]
  38. Sadio, M.; Anthony, E.J.; Diaw, A.T.; Dussouillez, P.; Fleury, J.T.; Kane, A.; Kestenare, E. Shoreline changes on the wave-influenced Senegal River delta, West Africa: The roles of natural processes and human interventions. Water 2017, 9, 357. [Google Scholar] [CrossRef]
  39. Bakhoum, P.W. A peninsula in coastal erosion? Dakar, the Senegalese capital city facing the sea level rise in the context of climate change. Environ. Water Sci. Public Health Territ. Intell. J. 2018, 2, 91–108. [Google Scholar]
  40. Ndour, A.; Ba, K.; Almar, A.; Almeida, P.; Sall, M.; Diedhiou, P.M.; Sy, B. On the natural and anthropogenic drivers of the Senegalese (West Africa) low coast evolution: Saint Louis beach 2016 COASTVAR experiment and 3D modeling of short-term coastal protection measures. J. Coast. Res. 2020, 95, 583–587. [Google Scholar] [CrossRef]
  41. Cissé, C.O.T.; Marić, I.; Domazetović, F.; Glavačević, K.; Almar, R. Derivation of coastal erosion susceptibility and socio-economic vulnerability models for sustainable coastal management in Senegal. Sustainability 2024, 16, 7422. [Google Scholar] [CrossRef]
  42. Sarr, M.A.; Pouye, I.; Sene, A.; Aniel-Quiroga, I.; Diouf, A.A.; Samb, F.; Sall, M. Monitoring and Forecasting of Coastal Erosion in the Context of Climate Change in Saint Louis (Senegal). Geographies 2024, 4, 287–303. [Google Scholar] [CrossRef]
  43. Mendoza, E.T.; Salameh, E.; Sakho, I.; Turki, I.; Almar, R.; Ojeda, E.; Laignel, B. Coastal flood vulnerability assessment, a satellite remote sensing and modeling approach. Remote Sens. Appl. Soc. Environ. 2023, 29, 100923. [Google Scholar] [CrossRef]
  44. Mendoza, E.T.; Salameh, E.; Turki, E.I.; Deloffre, J.; Laignel, B. Satellite-based flood mapping of coastal floods: The Senegal River estuary study case. Int. J. Appl. Earth Obs. Geoinf. 2025, 138, 104476. [Google Scholar] [CrossRef]
  45. Kim, S.K.; Peiser, R.B. The implication of the increase in storm frequency and intensity to coastal housing markets. J. Flood Risk Manag. 2020, 13, e12626. [Google Scholar] [CrossRef]
  46. Makris, C.V.; Tolika, K.; Baltikas, V.N.; Velikou, K.; Krestenitis, Y.N. The impact of climate change on the storm surges of the Mediterranean Sea: Coastal Sea level responses to deep depression atmospheric systems. Ocean Model. 2023, 181, 102149. [Google Scholar] [CrossRef]
  47. Sall, M. Dynamique et Morphogenèse Actuelle au Sénégal Occidental; Université Louis Pasteur: Strasbourg, France, 1982. [Google Scholar]
  48. Lo, P.G.; Diop, M.B. Problems associated with flooding in Dakar, western Senegal: Influence of geological setting and town management. Bull. Eng. Geol. Environ. 2000, 58, 145–149. [Google Scholar] [CrossRef]
  49. Sakho, P. Dakar et le·littoral. Population 2007, 3906592, 6. [Google Scholar]
  50. Turmine, V. La Dynamique Littorale Entre Mbour et Joal (Petite Côte, Sénégal). Master’s Thesis, Université Denis Diderot, Paris France, 2000; 255p. [Google Scholar]
  51. Diallo, S. Geomorphological Evolution of the Coastline on the Little Coast in Dakar. Master’s Thesis, Cheikh Anta Diop University in Dakar, Dakar, Senegal, 1982; 117p. [Google Scholar]
  52. Ndour, A. Evolution Morpho-Sédimentaire et Impacts des Ouvrages de Protection sur le Littoral de Dakar, Petite Côte. Ph.D. Thesis, Cheikh Anta Diop University in Dakar, Dakar, Senegal, 2015; 243p. [Google Scholar]
  53. Sané, T.; Dièye, E.H.B.; Solly, B.; Ba, B.D.; Thior, M.; Descroix, L.; Diakhaté, M.M. Vulnérabilité et résilience des socio-écosystèmes littoraux d’Afrique de l’Ouest: état des connaissances actuelles et interrogation sur le devenir du littoral sénégalo-bissau-guinéen. Belgeo. Rev. Belg. Géographie 2021, 1, 22. [Google Scholar] [CrossRef]
  54. Samou, M.S.; Bertin, X.; Sakho, I.; Lazar, A.; Sadio, M.; Diouf, M.B. Wave Climate Variability along the Coastlines of Senegal over the Last Four Decades. Atmosphere 2023, 14, 1142. [Google Scholar] [CrossRef]
  55. Diadhiou, Y.B.; Ndour, A.; Niang, I.; Niang-Fall, A. Étude comparative de l’évolution du trait de côte sur deux flèches sableuses de la Petite Côte (Sénégal): Cas de Joal et de Djiffère. Norois. Environ. Aménagement Société 2016, 240, 25–42. [Google Scholar] [CrossRef]
  56. Thior, M.; Sane, T.; Sy, O.; Descroix, L.; Ba, B.D.; Solly, B.; Mendy, V. Analyse Spatiale de l’évolution du Trait de Côte Autour de l’embouchure du Fleuve Casamance (Sénégal) de 1968 à 2017, à Partir de l’outil DSAS. Eur. Sci. J. 2019, 15, 1857–7881. [Google Scholar] [CrossRef]
  57. Bocoum, S. Tourisme De La Basse Casamance Face À Différentes Contraintes À Juguler. Afr. Sci. J. 2025, 3, 348. [Google Scholar]
  58. Sidibé, I. Un territoire littoral dans l’espace politique, économique et religieux du Sénégal. Le cas de la baie de Ouakam (Dakar). Espace Popul. Sociétés Space Popul. Soc. 2013, 33, 159–176. [Google Scholar] [CrossRef]
  59. Weissenberger, S.; Noblet, M.; Plante, S.; Chouinard, O.; Guillemot, J.; Aubé, M.; Seck, A. Changements climatiques, changements du littoral et évolution de la vulnérabilité côtière au fil du temps: Comparaison de territoires français, canadien et sénégalais. VertigO Rev. Électron. Sci. L’Environ. 2016, 16, 3. [Google Scholar]
  60. Ndour, A.; Laïbi, R.A.; Sadio, M.; Degbe, C.G.; Diaw, A.T.; Oyédé, L.M.; Sambou, H. Management strategies for coastal erosion problems in west Africa: Analysis, issues, and constraints drawn from the examples of Senegal and Benin. Ocean Coast. Manag. 2018, 156, 92–106. [Google Scholar] [CrossRef]
  61. Enríquez-de-Salamanca, Á. Evolution of coastal erosion in Palmarin (Senegal). J. Coast. Conserv. 2020, 24, 25. [Google Scholar] [CrossRef]
  62. Taveneau, A.; Almar, R.; Bergsma, E.W.; Sy, B.A.; Ndour, A.; Sadio, M.; Garlan, T. Observing and predicting coastal erosion at the Langue de Barbarie sand spit around Saint Louis (Senegal, West Africa) through satellite-derived digital elevation model and shoreline. Remote Sens. 2021, 13, 2454. [Google Scholar] [CrossRef]
  63. Stockdon, H.F.; Holman, R.A.; Howd, P.A.; Sallenger, A.H., Jr. Empirical parameterization of setup, swash, and runup. Coast. Eng. 2006, 53, 573–588. [Google Scholar] [CrossRef]
  64. Athanasiou, P.; Van Dongeren, A.; Giardino, A.; Vousdoukas, M.; Gaytan-Aguilar, S.; Ranasinghe, R. Global distribution of nearshore slopes with implications for coastal retreat. Earth Syst. Sci. Data 2019, 11, 1515–1529. [Google Scholar] [CrossRef]
  65. Boccotti, P. On coastal and offshore structure risk analysis. Excerpta Ital. Contrib. Field Hydraul. Eng. 1986, 1, 19–36. [Google Scholar]
  66. Mendoza, E.T.; Jimenez, J.A.; Mateo, J. A coastal storms intensity scale for the Catalan Sea (NW Mediterranean). Nat. Hazards Earth Syst. Sci. 2011, 11, 2453–2462. [Google Scholar] [CrossRef]
  67. Favaretto, C.; Martinelli, L.; Ruol, P. A Spatial Structure Variable Approach to Characterize Storm Events for Coastal Flood Hazard Assessment. Water 2021, 13, 2556. [Google Scholar] [CrossRef]
  68. Della-Marta, P.M.; Mathis, H.; Frei, C.; Liniger, M.A.; Kleinn, J.; Appenzeller, C. The return period of wind storms over Europe. Int. J. Climatol. J. R. Meteorol. Soc. 2009, 29, 437–459. [Google Scholar] [CrossRef]
  69. Saviano, S.; Biancardi, A.A.; Uttieri, M.; Zambianchi, E.; Cusati, L.A.; Pedroncini, A.; Cianelli, D. Sea storm analysis: Evaluation of multiannual wave parameters retrieved from HF radar and wave model. Remote Sens. 2022, 14, 1696. [Google Scholar] [CrossRef]
  70. Celedón, V.; Del Río, L.; Ferreira, Ó.; Costas, S.; Plomaritis, T.A. Identification of risk hotspots to storm events in a coastal region with high morphodynamic alongshore variability. Nat. Hazards 2023, 115, 461–488. [Google Scholar] [CrossRef]
  71. López Solano, C.; Turki, E.I.; Mendoza, E.T.; Gutiérrez Barceló, A.D.; Migaud, A.; Hamdi, Y.; Lafite, R. Hydrodynamic modelling for simulating nearshore waves and sea levels: Classification of extreme events from the English Channel to the Normandy coasts. Nat. Hazards 2024, 120, 13951–13973. [Google Scholar] [CrossRef]
  72. Del Río, L.; Plomaritis, T.A.; Benavente, J.; Valladares, M.; Ribera, P. Establishing storm thresholds for the Spanish Gulf of Cádiz coast. Geomorphology 2012, 143, 13–23. [Google Scholar] [CrossRef]
  73. Plomaritis, T.A.; Benavente, J.; Laiz, I.; Del Río, L. Variability in storm climate along the Gulf of Cadiz: The role of large scale atmospheric forcing and implications to coastal hazards. Clim. Dyn. 2015, 45, 2499–2514. [Google Scholar] [CrossRef]
  74. Almeida, L.P.; Vousdoukas, M.V.; Ferreira, Ó.; Rodrigues, B.A.; Matias, A. Thresholds for storm impacts on an exposed sandy coastal area in southern Portugal. Geomorphology 2012, 143, 3–12. [Google Scholar] [CrossRef]
  75. Harley, M. Coastal storm definition. In Coastal Storms: Processes and Impacts; Wiley-Blackwell: Hoboken, NJ, USA, 2017; pp. 1–21. [Google Scholar]
  76. Méndez, F.J.; Menéndez, M.; Luceño, A.; Losada, I.J. Estimation of the long-term variability of extreme significant wave height using a time-dependent peak over threshold (pot) model. J. Geophys. Res. Ocean. 2006, 111, C07024. [Google Scholar] [CrossRef]
  77. Cañellas, B.; Orfila, A.; Méndez, F.J.; Menéndez, M.; Gómez-Pujol, L.; Tintoré, J. Application of a POT model to estimate the extreme significant wave height levels around the Balearic Sea (Western Mediterranean). J. Coast. Res. 2007, 50, 329–333. [Google Scholar] [CrossRef]
  78. Mazas, F.; Hamm, L. A multi-distribution approach to POT methods for determining extreme wave heights. Coast. Eng. 2011, 58, 385–394. [Google Scholar] [CrossRef]
  79. Liang, B.; Shao, Z.; Li, H.; Shao, M.; Lee, D. An automated threshold selection method based on the characteristic of extrapolated significant wave heights. Coast. Eng. 2019, 144, 22–32. [Google Scholar] [CrossRef]
  80. Zhu, Z.; Zhang, W.; Zhu, W. Compound Impact of Storm Surge and Flood Characteristics in Coastal Area Based on Copula. Water 2024, 16, 270. [Google Scholar] [CrossRef]
  81. Hiles, C.E.; Robertson, B.; Buckham, B.J. Extreme wave statistical methods and implications for coastal analyses. Estuar. Coast. Shelf Sci. 2019, 223, 50–60. [Google Scholar] [CrossRef]
  82. Davies, G.; Callaghan, D.P.; Gravois, U.; Jiang, W.; Hanslow, D.; Nichol, S.; Baldock, T. Improved treatment of non-stationary conditions and uncertainties in probabilistic models of storm wave climate. Coast. Eng. 2017, 127, 1–19. [Google Scholar] [CrossRef]
  83. Gad, F.K.; Chatzinaki, M.; Vandarakis, D.; Kyriakidou, C.; Kapsimalis, V. Assessment of wave storm-induced flood vulnerability in Rhodes Island, Greece. Water 2020, 12, 2978. [Google Scholar] [CrossRef]
  84. Billson, O. The Impact of Extreme Storm Waves at the Coast; The Role of Infragravity Waves; The University of Liverpool: Liverpool, UK, 2021. [Google Scholar]
  85. Meucci, A.; Young, I.R.; Hemer, M.; Kirezci, E.; Ranasinghe, R. Projected 21st century changes in extreme wind-wave events. Sci. Adv. 2020, 6, eaaz7295. [Google Scholar] [CrossRef]
  86. Rivas, V.; Garmendia, C.; Rasilla, D. Analysis of ocean parameters as sources of coastal storm damage: Regional empirical thresholds in Northern Spain. Climate 2022, 10, 88. [Google Scholar] [CrossRef]
  87. Bernardino, M.; Rusu, L.; Guedes Soares, C. Evaluation of extreme storm waves in the Black Sea. J. Oper. Oceanogr. 2021, 14, 114–128. [Google Scholar] [CrossRef]
  88. Martzikos, N. Analysis of Coastal Storms for Their Application in Harbours and Coastal Structures Design. Doctoral Dissertation, National Technical University of Athens, Athens, Greece, 2021. [Google Scholar]
  89. Laface, V.; Arena, F. On correlation between wind and wave storms. J. Mar. Sci. Eng. 2021, 9, 1426. [Google Scholar] [CrossRef]
  90. Dorsch, W.; Newland, T.; Tassone, D.; Tymons, S.; Walker, D. A statistical approach to modelling the temporal patterns of ocean storms. J. Coast. Res. 2008, 24, 1430–1438. [Google Scholar] [CrossRef]
  91. Dolan, R.; Davis, R.E. An intensity scale for Atlantic coast northeast storms. J. Coast. Res. 1992, 8, 840–853. [Google Scholar]
  92. Martzikos, N.; Afentoulis, V.; Tsoukala, V.; Martzikos, N.; Afentoulis, V.; Tsoukala, V. Storm clustering and classification for the port of Rethymno in Greece. Water Util. J. 2018, 20, 67–79. [Google Scholar]
  93. Alhaji, U.U.; Yusuf, A.S.; Edet, C.O.; Oche, C.O.; Agbo, E.P. Trend analysis of temperature in Gombe state using Mann Kendall trend test. J. Sci. Res. Rep. 2018, 20, 1–9. [Google Scholar] [CrossRef]
  94. Minh, H.N.; Duy, V.V. How climate change affected on water level in Ha Long coastal area in the period 1974–2020: Results from the Mann Kendall test and sen’s slope estimate. Vietnam. J. Mar. Sci. Technol. 2022, 22, 257–269. [Google Scholar] [CrossRef]
  95. Gadedjisso-Tossou, A.; Adjegan, K.I.; Kablan, A.K.M. Rainfall and temperature trend analysis by Mann–Kendall test and significance for Rainfed Cereal Yields in Northern Togo. Sci 2021, 3, 17. [Google Scholar] [CrossRef]
  96. Koudahe, K.; Koffi, D.; Kayode, J.; Awokola, S.; Adebola, A. Impact of climate variability on crop yields in southern Togo. Environ. Pollut. Clim. Change 2018, 2, 1–9. [Google Scholar]
  97. Nguyen, H.M.; Ouillon, S.; Vu, V.D. Sea level variation and trend analysis by comparing Mann–Kendall test and innovative trend analysis in front of the Red River Delta, Vietnam (1961–2020). Water 2022, 14, 1709. [Google Scholar] [CrossRef]
  98. De Luque Söllheim, Á.L.; Scafura, J. Effects of Climate Change on Coastal Erosion and Flooding May 2020 Technical Report in Benin, Côte d’Ivoire, Mauritania, Senegal, and Togo; International Bank for Reconstruction and Development, The World Bank: Washington, DC, USA, 2020. [Google Scholar]
  99. Serafin, K.A.; Ruggiero, P.; Stockdon, H.F. The relative contribution of waves, tides, and nontidal residuals to extreme total water levels on US West Coast sandy beaches. Geophys. Res. Lett. 2017, 44, 1839–1847. [Google Scholar] [CrossRef]
  100. Cisse, C.O.T. Satellite and Statistical Approach for the Characterization of Coastal Storms Causing Damage on the Dakar Coast, Capital of Senegal (West Africa). Coasts 2025, 5, 24. [Google Scholar] [CrossRef]
  101. Almar, R.; Kestenare, E.; Boucharel, J. On the key influence of remote climate variability from Tropical Cyclones, North and South Atlantic mid-latitude storms on the Senegalese coast (West Africa). Environ. Res. Commun. 2019, 1, 071001. [Google Scholar] [CrossRef]
  102. Gao, Y.; Li, X.; Chen, X.; Wang, L. Extreme wave and storm surge characteristics in the southeastern coastal and offshore regions of China. Sci. Rep. 2025, 15, 26915. [Google Scholar] [CrossRef]
  103. Corbella, S.; Stretch, D.D. Multivariate return periods of sea storms for coastal erosion risk assessment. Nat. Hazards Earth Syst. Sci. 2012, 12, 2699–2708. [Google Scholar] [CrossRef]
  104. Dissanayake, P.; Brown, J.; Wisse, P.; Karunarathna, H. Effects of storm clustering on beach/dune evolution. Mar. Geol. 2015, 370, 63–75. [Google Scholar] [CrossRef]
  105. Mendoza, E.T.; Turki, I.; Ojeda, E.; Soloy, A.; Salameh, E.; Lopez-Solano, C.; Lecoq, N. Storm response of the upper intertidal zone on a gravel beach. Int. J. Appl. Earth Obs. Geoinf. 2025, 144, 104945. [Google Scholar] [CrossRef]
  106. Lee, J.W.; Irish, J.L.; Bensi, M.T.; Marcy, D.C. Rapid prediction of peak storm surge from tropical cyclone track time series using machine learning. Coast. Eng. 2021, 170, 104024. [Google Scholar] [CrossRef]
  107. Liu, Y.; Zhao, Q.; Hu, C.; Luo, N. Prediction of storm surge water level based on machine learning methods. Atmosphere 2023, 14, 1568. [Google Scholar] [CrossRef]
  108. Qin, Y.; Su, C.; Chu, D.; Zhang, J.; Song, J. A review of application of machine learning in storm surge problems. J. Mar. Sci. Eng. 2023, 11, 1729. [Google Scholar] [CrossRef]
  109. Naeini, S.S.; Snaiki, R. A novel hybrid machine learning model for rapid assessment of wave and storm surge responses over an extended coastal region. Coast. Eng. 2024, 190, 104503. [Google Scholar] [CrossRef]
Figure 1. Location of the study area.
Coasts 06 00009 g001
Figure 2. Coastal storm detection approach using a POT.
Coasts 06 00009 g002
Figure 3. Illustration of the variation in significant wave height above the 95th percentile at the different sites. The red color indicates Hs values that are above the threshold.
Coasts 06 00009 g003
Figure 4. Occurrence frequency of coastal storms along the Senegalese coastline.
Coasts 06 00009 g004
Figure 5. Evolution of the mean ECWL of storms.
Coasts 06 00009 g005
Figure 6. Storm intensity classes identified at the four sites.
Coasts 06 00009 g006
Figure 7. Influence of wave direction on coastal storms.
Coasts 06 00009 g007
Figure 8. Seasonal distribution of storms according to intensity classes.
Coasts 06 00009 g008
Figure 9. Spatial distribution of different coastal storm intensity classes along the Senegalese coast.
Coasts 06 00009 g009
Figure 10. Boxplot of coastal storm duration.
Coasts 06 00009 g010
Figure 11. Boxplot of storm duration and intensity.
Coasts 06 00009 g011
Table 1. Dolan–Davis Scale (Dolan and Davis, 1992) [91].
Storm ClassPower [m2·h]Class
Weak≤71.63I
Moderate71.63–163.51II
Significant163.51–929.03III
Severe929.03–2322.58IV
Extreme>2322.58V
Table 2. Mann–Kendall Tau (τ) for the four sites showing the evolution of coastal storms.
SitesMann–Kendall Tau (τ)p-Value
Dakar−0.110.408
Saint-Louis0.070.595
Mbour0.100.441
Cap-Skring0.070.603
Table 3. Mann–Kendall Tau of the four study sites for ECWL evolution.
SitesMann–Kendall Tau (τ)p-Value
Dakar0.130.291
Saint-Louis−0.090.454
Mbour−0.040.759
Cap-Skring−0.150.234
Disclaimer/Publisher’s Note: The statements, opinions and data contained in all publications are solely those of the individual author(s) and contributor(s) and not of MDPI and/or the editor(s). MDPI and/or the editor(s) disclaim responsibility for any injury to people or property resulting from any ideas, methods, instructions or products referred to in the content.