Article

Biochemical Composition and Antioxidant Capacity of Mediterranean Marine Macroalgae: Fatty Acids, Carotenoids, and Phenolics


by
José António Mestre Prates
1,2,
Mohamed Ezzaitouni
3,
Tarik Chileh-Chelh
3,
Rosalía López-Ruiz
4 and
José Luis Guil-Guerrero
3,*
1
CIISA—Centro de Investigação Interdisciplinar em Sanidade Animal, Faculdade de Medicina Veterinária, Universidade de Lisboa, Av. da Universidade Técnica, 1300-477 Lisboa, Portugal
2
Associate Laboratory for Animal and Veterinary Sciences (AL4AnimalS), Av. da Universidade Técnica, 1300-477 Lisboa, Portugal
3
Department of Agronomy, Food Technology División, University of Almería, 04120 Almería, Spain
4
Department of Chemistry-Physics, Analytical Chemistry of Contaminants, University of Almería, 04120 Almería, Spain
*
Author to whom correspondence should be addressed.
Phycology 2026, 6(2), 37; https://doi.org/10.3390/phycology6020037
Submission received: 16 February 2026 / Revised: 27 March 2026 / Accepted: 31 March 2026 / Published: 2 April 2026

Abstract

Macroalgae are increasingly recognised as promising sources of bioactive compounds with nutritional and functional relevance. This study investigated the biochemical composition of selected green, brown, and red marine macroalgae from the Mediterranean coast sampled at different seasons, focusing on fatty acid profiles, carotenoid composition, phenolic and flavonoid contents, antioxidant activity, and multivariate biochemical structuring. Fatty acid distributions were determined by Gas Chromatography (GC)-Flame Ionisation detector (FID), carotenoids were quantified and profiled by Liquid Chromatography–Mass Spectrometry (LC-MS), and total phenolic content, total flavonoid content, and antioxidant capacity (ABTS•+ and DPPH methods) were assessed using standard spectrophotometric assays. Principal component analysis was applied to evaluate relationships among biochemical variables and taxonomic patterns. Brown macroalgae tended to exhibit more complex and enriched biochemical profiles, containing high proportions of long-chain n-3 polyunsaturated fatty acids, particularly eicosapentaenoic acid, elevated total carotenoid contents dominated by fucoxanthin, the highest total phenolic and flavonoid contents, and antioxidant activities. Green macroalgae were characterised by fatty acid profiles rich in saturated and C18 polyunsaturated fatty acids, while carotenoid compositions were dominated by lutein and siphonoxanthin. Red macroalgae exhibited comparatively simpler lipid and pigment patterns, characterised by palmitic acid and zeaxanthin as dominant components and lower total carotenoid levels. Principal component analysis revealed taxonomic structuring, with brown algae clearly separated from green and red groups, while seasonal differences were minor. Antioxidant activity closely clustered with carotenoids and total phenolic content, suggesting their combined contribution to radical-scavenging capacity. Overall, brown species appear as promising candidates for functional foods and nutraceutical applications.

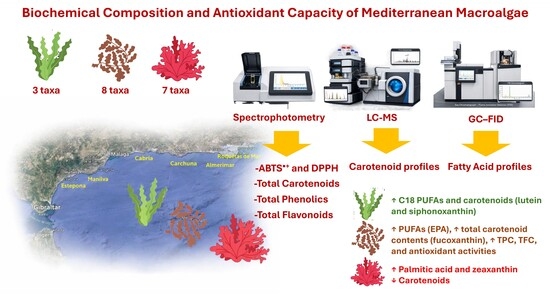
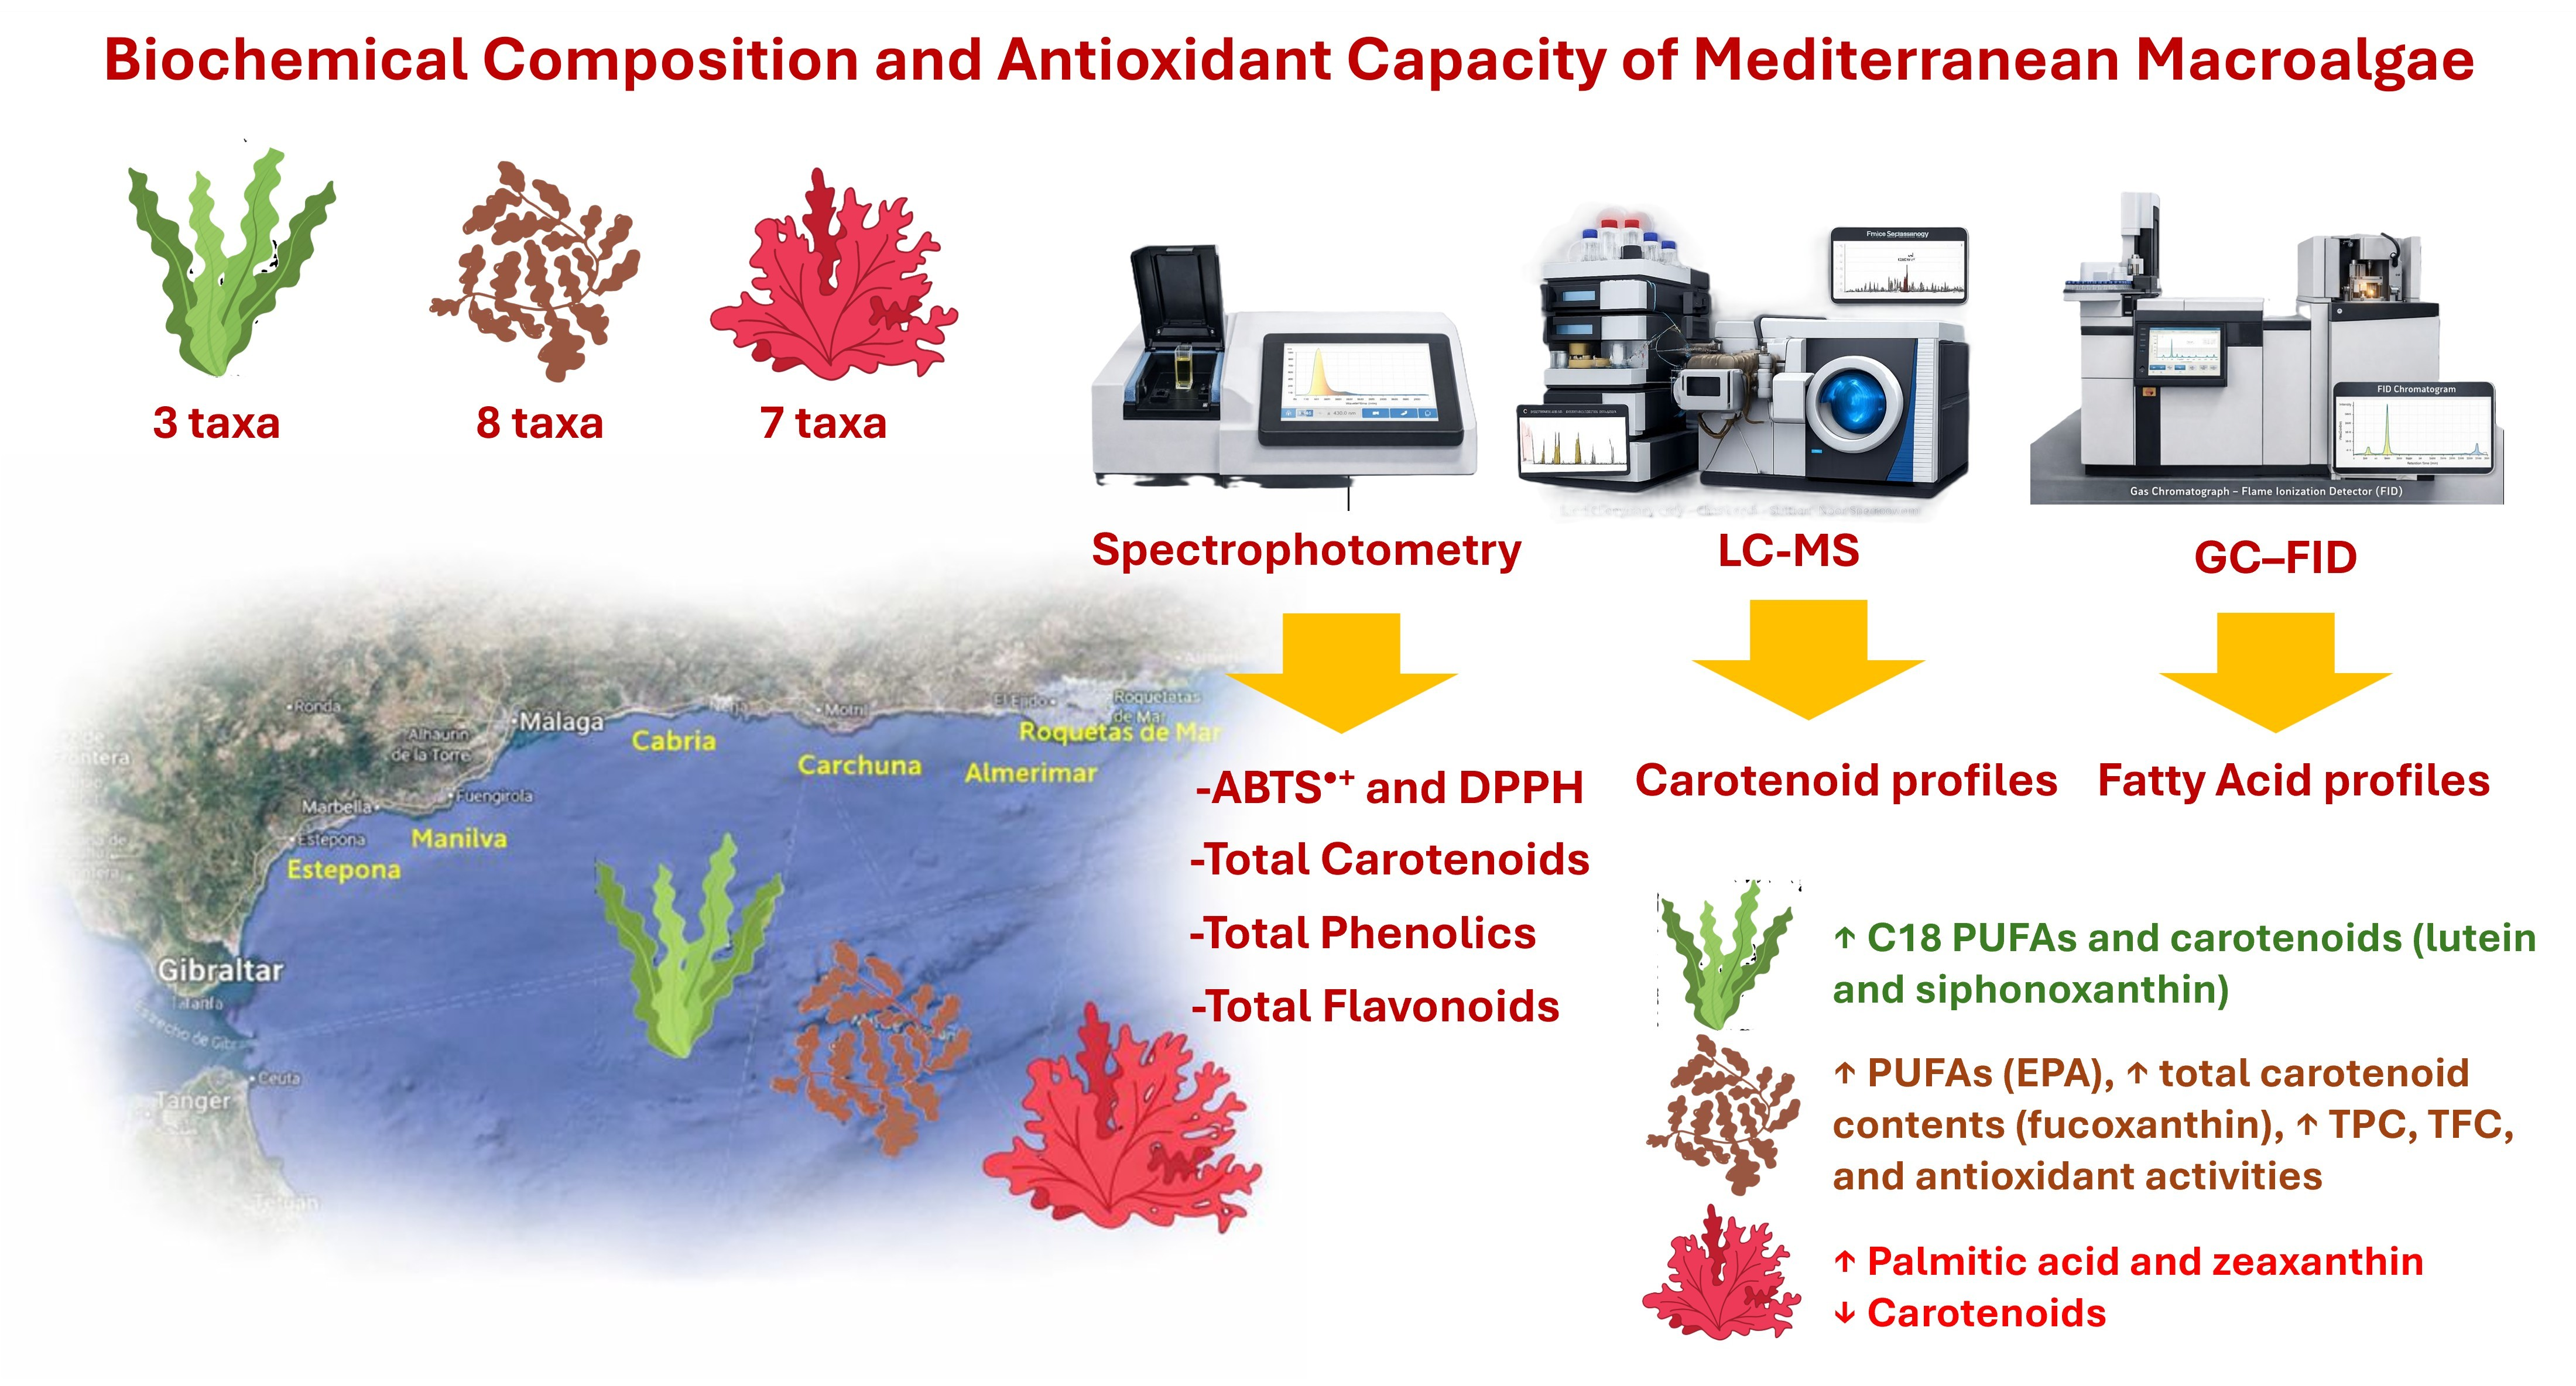
Graphical Abstract

1. Introduction

Marine macroalgae (seaweeds) are increasingly recognised as ecologically important primary producers and valuable reservoirs of bioactive compounds with growing relevance for food, feed, nutraceutical, pharmaceutical, and cosmetic applications [1]. In the Mediterranean region, seaweed has long been harvested to exploit these properties, reflecting its traditional use and emerging economic value [2]. In coastal ecosystems, macroalgae contribute substantially to oxygen production, nutrient cycling, habitat structuring, and carbon sequestration, while their biochemical versatility reflects a high degree of metabolic plasticity shaped by both evolutionary lineage and environmental pressures [3,4]. This capacity to synthesise structurally diverse metabolites, including fatty acids (FAs), carotenoids, and phenolic compounds, underpins their functional value and has fueled renewed scientific and industrial interest.
Macroalgae are traditionally classified into three major taxonomic groups–Chlorophyta (green algae), Phaeophyceae (brown algae), and Rhodophyta (red algae)–which differ fundamentally in photosynthetic pigments, storage compounds, and cell wall composition. These phylogenetic distinctions are closely reflected in their biochemical profiles and ecological strategies. Brown algae typically dominate temperate coastal zones, red algae are particularly abundant in warmer and deeper waters, while green algae occupy a wide range of intertidal and subtidal habitats. Such taxonomic and ecological differentiation is accompanied by marked variability in lipid composition, pigment profiles, and antioxidant metabolites, giving rise to group-specific biochemical fingerprints [4,5].
Although lipids generally represent a minor fraction of algal biomass, usually accounting for 1–6% of dry weight (dw), they are of disproportionate nutritional and physiological importance [3]. Macroalgal lipid fractions are often rich in polyunsaturated FAs (PUFAs), including essential FAs (EFAs) and long-chain omega-3 PUFAs (n-3 LCPUFAs) compounds with established health benefits. Green macroalgae typically contain higher proportions of C18 PUFAs, such as linoleic acid (LA, 18:2n-6) and α-linolenic acid (ALA, 18:3n-3), with comparatively lower levels of LCPUFAs, including eicosapentaenoic acid (EPA, 20:5n-3) and arachidonic acid (ARA, 20:4n-6) [4,6]. Despite their relatively low total lipid content, green algae often exhibit favourable n-6/n-3 ratios, enhancing their nutritional relevance [5]. In contrast, brown macroalgae are generally characterised by higher proportions of n-3 LCPUFAs, particularly EPA, alongside saturated and monounsaturated FAs (SFAs and MUFAs) such as palmitic acid (PA, 16:0) and oleic acid (OA, 18:1n-9) as dominant FAs, respectively [3]. These lipid profiles are associated with anti-inflammatory and cardioprotective effects, supporting the potential of brown algae as sustainable sources of n-3 FAs [4]. Red algae often display intermediate FA patterns, typically dominated by SFAs such as PA, and moderate levels of EPA and ARA [5,6]. Across macroalgal taxa, the generally low n-6/n-3 ratios observed contrast favourably with those of Western diets and reinforce their potential role in functional nutrition [3]. Importantly, FA composition is strongly modulated by environmental factors, including temperature, light regime, salinity, and nutrient availability, with colder and nutrient-rich conditions favouring PUFA accumulation [7].
Beyond lipids, macroalgae synthesise a wide range of carotenoids, which are essential for photosynthesis, photoprotection, and oxidative stress mitigation. These lipid-soluble pigments exhibit pronounced taxonomic specificity. Fucoxanthin, the dominant carotenoid in brown algae, confers their characteristic brown colouration and has attracted considerable attention due to its antioxidant, anti-obesity, and anticancer properties [8,9]. Green algae, including genera such as Ulva and Codium, are typically enriched in lutein and siphonoxanthin, pigments associated with photoprotective, immunomodulatory, and anti-inflammatory activities [9,10]. Red algae characteristically accumulate zeaxanthin, often accompanied by β-carotene, contributing to both pigmentation and antioxidant capacity [11,12]. In addition to their ecological functions, algal carotenoids are increasingly valued as functional food ingredients due to their demonstrated benefits for visual health, lipid metabolism, and cellular protection [9].
Phenolic compounds represent another important class of macroalgal secondary metabolites with strong antioxidant, anti-inflammatory, and antimicrobial properties. Brown algae are particularly rich in phlorotannins, polymers of phloroglucinol that play key roles in defence against ultraviolet radiation, herbivory, and oxidative stress [8,11,13]. These compounds exert antioxidant capacity through multiple mechanisms, including radical scavenging, metal chelation, and inhibition of pro-oxidant enzymes. Green and red algae generally contain lower phenolic levels but may synthesise other bioactive compounds such as flavonoids, phenolic acids, and bromophenols, which also contribute to their antioxidant potential [14,15,16]. The overall antioxidant activity of macroalgae therefore reflects the combined contribution of phenolics, carotenoids, and lipid-derived compounds, modulated by both taxonomy and environmental conditions.
The Mediterranean Sea is a recognised biodiversity hotspot characterised by strong gradients in temperature, salinity, light availability, and hydrodynamics, supporting a highly diverse macroalgal flora [17,18]. Despite this richness, the biochemical composition of Mediterranean macroalgae remains comparatively underexplored compared to the Atlantic and Indo-Pacific regions. Existing studies often focus on individual metabolite classes, such as FAs, phenolics, or pigments, whereas integrated analyses encompassing multiple biochemical families are still limited [19,20]. Comprehensive profiling approaches are essential for revealing taxon-specific metabolic signatures, identifying potential biochemical markers, and fully assessing the nutritional and functional potential of regional species [21,22].
Moreover, Mediterranean coastal ecosystems are undergoing rapid environmental change driven by warming, eutrophication, habitat modification, and the spread of invasive species, with consequent impacts on native macroalgal communities [23]. Documenting the biochemical characteristics of indigenous species is therefore crucial not only for valorisation but also for conservation and sustainable resource management [24].
In this context, the present study investigates the biochemical composition of 18 representative Mediterranean marine macroalgal species belonging to brown, green, and red taxa. The sampling process was designed to obtain samples from both cold and warm seasons, which was achieved for most species. The study focuses on FA profiles, carotenoid composition, total phenolic and flavonoid contents, and antioxidant activities assessed by the DPPH and ABTS•+ assays. By integrating these datasets, this work aims to elucidate taxonomic and compositional patterns that underpin the nutritional, functional, and ecological value of Mediterranean macroalgae, providing a biochemical baseline to support their future exploitation in functional foods, nutraceuticals, and marine biotechnology.

2. Materials and Methods

2.1. Samples

Samples of seaweed were collected from different locations in the south of Spain (Figure 1, Table 1). After collecting, seaweed biomasses were stored at 4 °C in a portable fridge, and after arrival at the laboratory, they were washed with distilled water to remove sand, salt and epiphytes, which could influence subsequent analyses. Finally, they were frozen at −20 °C until analysis. For moisture determination, 4 g of the samples were dried in a forced air oven at 50 °C until constant weight.
The macroalgal material analysed in this study comprised 18 species representing the three major phyla of marine macroalgae, brown (Phaeophyceae), green (Chlorophyta), and red (Rhodophyta), collected along the southern Mediterranean coast of Spain. Sampling was conducted between September 2022 and February 2024 to encompass specimens collected under different seasonal and environmental conditions.
All samples were obtained from coastal sites in Andalusia, including the provinces of Almería, Granada, and Málaga. The geographical coordinates of the sampling sites ranged from approximately 36.32–36.84° N and −5.24 to −2.33° W, representing a narrow latitudinal span but encompassing a variety of coastal habitats, including Toyo Beach, Roquetas de Mar, Almerimar, Carchuna, Estepona, Manilva, and Cabria Beach.

2.2. Chemicals and Reagents

Standard phenolics, β-carotene, ABTS•+ and DPPH were purchased from Sigma (St. Louis, MO, USA). FA standards and the remaining reagents and solvents used were purchased from Merck (Madrid, Spain).

2.3. Total Carotenoids

These were determined spectrophotometrically, as described by Muntean et al. [25]. Details of extraction and full procedures are given in Supplementary File S1.

2.4. Antioxidant Activity

These activities were determined spectrophotometrically. The ABTS•+ method was effected following the procedure of Re et al. [26], and the DPPH method as reported by Skenderidis et al. [27]. Both procedures are detailed in Supplementary File S1.

2.5. Total Phenolics and Flavonoids Content

Both methods were determined spectrophotometrically. Total phenolic content (TPC) by the Folin–Ciocalteu method [28], and total flavonoid content (TFC) by the procedure of Zou et al. [29]. Both methods are detailed in Supplementary File S1.

2.6. Fatty Acids Analysis

The FA composition was determined following direct derivatisation of samples to FA methyl esters (FAMEs), which were analysed using a Focus GC system following the procedure described by Lyashenko et al. [30]. The method is fully described in Supplementary File S1, and the Method validation results for the determination of FAs are detailed in Supplementary Table S1.

2.7. Characterisation of Carotenoids by Liquid Chromatography-Mass Spectrometry

The carotenoid extract obtained previously was characterised by Liquid Chromatography–Mass Spectrometry (LC-MS). The chromatographic separations were performed on a Vanquish Flex Quaternary LC equipped with a reverse-phase C18 column. Liquid chromatography was coupled to a hybrid quadrupole–Orbitrap mass spectrometer. The method is fully described in Supplementary File S1, and the LC-MS parameters for carotenoid detection are detailed in Supplementary Table S2.

2.8. Methodological Rationale for Site Selection

To effectively disentangle taxonomic biochemical differentiation from environmental noise, El Toyo (Almería) was designated as the primary reference site for seasonal comparative analysis. Among the various Mediterranean localities surveyed, El Toyo provided the most extensive and taxonomically diverse sample set, encompassing representative species from the green, brown, and red groups collected across both cold and warm thermal regimes. By focusing the seasonal analysis on this high-density dataset, the influence of confounding spatial variables—including hydrodynamics, heterogeneous nutrient availability, microhabitat fluctuations, and localized anthropogenic factors—was significantly minimized. This localized approach provided a controlled environmental baseline, ensuring that the observed shifts in FA, carotenoids, and phenolic content were primarily attributable to seasonal periodicity and inherent taxonomic metabolic strategies rather than geographic or environmental heterogeneity.

2.9. Statistical Analysis

Chemical analyses were conducted using three independent biological replicates, and the results are presented as mean ± standard deviation. Subsequently, a one-way ANOVA was performed, and the separation of means was performed using the Duncan Multiple Range test, and the statistical significance was determined as p < 0.05.
To compare the seasonal biochemical shifts across taxonomically diverse groups with different baseline values, a normalized variation analysis was performed on the subset of data from El Toyo (Almería). Seasonal variation was calculated as the percentage difference between the mean values of the warm months and the cold months, relative to the cumulative group means for each taxonomic group (Green, Brown, and Red). This normalization allowed for a direct comparison of the relative metabolic plasticity (e.g., the percentage increase in TPC or decrease in Total FA) across taxa, effectively neutralizing absolute concentration differences inherent to specific species. Statistical significance for these seasonal shifts was determined using a two-way ANOVA (factors: Taxa and Season), followed by a post hoc Tukey HSD test (p < 0.05) to identify specific parameters where seasonal periodicity significantly altered the biochemical profile within each taxonomic group.
Principal Component Analysis (PCA) was conducted to investigate multivariate relationships among variables and to evaluate the combined influence of species identity and light intensity. Before PCA, a variable selection procedure was applied to reduce redundancy and enhance biological interpretability. Summed variables (e.g., total carotenoids, total sterols, total tocopherols) were excluded to avoid duplication of information, and only significant individual compounds were considered. All selected variables were autoscaled (Z-score normalised) prior to PCA according to the following equation:
Z i j = X i j X ¯ j S j
where
  • X i j is the raw value of the variable j in sample i ;
  • X ¯ j is the mean of the variable j across all samples;
  • S j is the standard deviation of the variable j .
This transformation centres each variable to a mean of zero and scales it to unit variance, ensuring equal contribution of all variables regardless of their original units or magnitude. The complete autoscaled (Z-score normalised) data matrix used for PCA, expressed as dimensionless values, is reported in Supplementary Table S3.
Principal Component Analysis was performed on the correlation matrix using Statgraphics® Centurion XVI (StatPoint Technologies, Warrenton, VA, USA). Principal components were extracted based on eigenvalues and cumulative explained variance. The eigenvalues, percentage of variance explained, and cumulative variance of the extracted components are presented in Supplementary Table S4.

3. Results

3.1. Sample Collection and Characterization

Brown macroalgae were represented by eight taxa collected between September 2022 and January 2024, while four green taxa were sampled from October 2022 to February 2024. Red macroalgae constituted the most diverse group, including multiple Polysiphonia and Porphyra specimens collected between September 2022 and January 2024, with repeated sampling of P. umbilicalis at different times and locations to account for potential temporal variability.
This dataset spans approximately 17 months and has a consistent geographic range along the Andalusian coast, providing a representative framework for comparative analyses of biochemical composition among green, brown, and red macroalgae (see Table 1).

3.2. Moisture, Total Carotenoids, Total Phenolic and Flavonoid Contents, and Antioxidant Activity

Marked variability was observed in moisture content, pigment concentration, phenolic and flavonoid levels, and antioxidant activity among the analysed Mediterranean macroalgae (Table 2), reflecting both taxonomic differences and species-specific characteristics.
Moisture content varied significantly among species (p < 0.05), ranging from 64.4% in the red alga P. elongata to 91.9% in the green alga C. bursa CB1. In general, green macroalgae exhibited higher moisture levels (74.8–91.9%) than brown macroalgae (69.3–87.9%), while red algae displayed intermediate values.
Total carotenoid content showed pronounced interspecific and intergroup variability. Brown macroalgae exhibited the highest carotenoid concentrations overall, with maximum values recorded in R. okamurae (47.1–49.6) mg 100 g−1 of fresh weight (fw), D. dichotoma (42.6–45.1 mg 100 g−1 fw), and C. humilis (39.3–43.3 mg 100 g−1 fw). Green macroalgae generally contained lower carotenoid levels, ranging from trace amounts in U. lactuca (0.3–2.6 mg 100 g−1 fw) to higher values in F. petiolata (31.8–32.7 mg 100 g−1 fw). Red macroalgae showed comparatively low carotenoid contents, typically below 20 mg 100 g−1 fw, except G. pusillum, which reached 33.1 mg 100 g−1 fw.
Seaweed phenolics include phenolic acids, flavonoids, bromophenols, and phlorotannins, the latter being characteristic of brown algae [31]. Total phenolic content (TPC) varied significantly among species (p < 0.05), with brown macroalgae displaying the highest values overall. The maximum TPC was observed in E. selaginoides ES2 (291.5 mg GAE 100 g−1 fw) and E. selaginoides ES2 (241.3 mg GAE 100 g−1 fw), followed by D. dichotoma DD2 (up to 223.3 mg GAE 100 g−1 fw). Green macroalgae generally exhibited lower TPC values, ranging from 97.8 in U. lactuca UL1 to 47.1 mg GAE 100 g−1 fw in F. petiolata FP2. Red macroalgae showed variable phenolic contents, with A. armata, G. pusillum and Polysiphonia sp. PS2 reaching high levels (76.9, 73.7, and 72.3 mg GAE 100 g−1 fw, respectively), while the remaining samples exhibited comparatively low values (<70 mg GAE 100 g−1 fw).
Total flavonoid content (TFC) followed a pattern similar to that of TPC. Brown macroalgae contained the highest flavonoid levels, with maximum values in C. humilis CH2 (up to 151.7 mg QE 100 g−1 fw), E. selaginoides ES1 and ES2 (150.5 and 150.9 mg QE 100 g−1 fw), D. dichotoma DD2 (149.2 mg QE 100 g−1 fw) and R. okamurae RO2 (147.3 mg QE 100 g−1 fw). Green macroalgae displayed moderate flavonoid contents, ranging from 14.9 in F. petiolata FP1 to 33.1 mg QE 100 g−1 fw in C. tomentosum CT2. Red macroalgae showed disparate TFC values, with A. armata (54.3), Polysiphonia sp. PS1 and PS2 (50.0 and 52.8), and G. pusillum (48.7 mg QE 100 g−1 fw), exhibiting relatively high levels compared with other red taxa.
The antioxidant activity, assessed by both DPPH and ABTS•+ assays, differed significantly among species and taxonomic groups (p < 0.05). Overall, brown macroalgae exhibited the strongest antioxidant capabilities. The highest DPPH scavenging activities were recorded in R. okamurae (5.2–5.4 mmol TE 100 g−1 dw), D. dichotoma (2.5–5.3 mmol TE 100 g−1 dw), and E. selaginoides (2.4–3.5 mmol TE 100 g−1 dw). Similarly, ABTS•+ values were highest in brown species, reaching up to 3.9 mmol TE 100 g−1 dw in D. dichotoma DD2; very low in green macroalgae (0.6–1.6), especially in C. bursa and F. petioalta; and very disparate within red species, since A. armata (3.2) and G. pusillum (3.6 mmol TE 100 g−1 dw) showed high values, while Porphyra and Polysiphonia species displayed consistently low scavenging capacities.

3.3. Fatty Acids

The FA profiles of the analysed Mediterranean macroalgae showed marked variability among species and clear differentiation among brown, green, and red taxa (Table 3, Table 4 and Table 5). Across all samples, SFAs, MUFAs, and PUFAs were consistently detected, although their relative proportions and dominant components differed significantly among groups (p < 0.05).

3.3.1. Brown Macroalgae

Brown macroalgae exhibited FA contents ranging from 0.8 to 6.0 g 100 g−1 dw. SFAs constituted the predominant fraction in most species, accounting for 44.8–70.8% of total FAs. PA was the dominant SFA across all brown taxa, reaching particularly high proportions in C. humilis CH2 (up to 45.0%) and D. dichotoma DD2 (up to 45.4%). Other SFAs, including myristic (14:0), stearic (18:0), and arachidic acids (20:0), were present in lower but variable proportions.
MUFAs represented 11.7–31.3% of total FAs, with OA as the predominant FA, especially in R. okamurae, where it exceeded 19% of total FAs. Palmitoleic acid (16:1n-7) and eicosenoic acid (20:1n-9) were also detected in several species.
PUFAs accounted for 9.7–42.6% of total FAs, with marked interspecific variation. LA, ALA, ARA, and EPA were consistently present. EPA was particularly abundant in D. dichotoma DD1 (up to 8.1%) and C. spongiosus CS1 (up to 7.4%). The n-6/n-3 ratios ranged from 0.9 to 4.4, with most species exhibiting values close to or below 2.0.

3.3.2. Green Macroalgae

Green macroalgae contained total FA levels ranging from 1.1 to 5.4 g 100 g−1 dw. SFAs were the dominant class in most samples, representing 37.2–69.1% of total FAs. PA was again the major SFA, accounting for up to 38.3% of total FAs in C. tomentosum CT2.
MUFAs constituted 11.3–25.1% of total FAs, with OA and palmitoleic acid as the main components. Notably, F. petiolata and U. lactuca exhibited relatively high proportions of palmitoleic acid, exceeding 12% in some samples.
PUFAs represented a substantial fraction of total FAs, ranging from 20.1% to 46.0%. Green macroalgae were characterised by elevated levels of C18 PUFAs, particularly LA and ALA. EPA was also detected in all green species, with the highest proportions observed in U. lactuca (up to 10.7% in UL1) and C. tomentosum (up to 8.0% CT1). Docosahexaenoic acid (DHA, 22:6n-3) was present at low levels in several species. The n-6/n-3 ratios ranged from 1.0 to 2.6.

3.3.3. Red Macroalgae

Red macroalgae displayed lower total FA contents overall, ranging from 0.3 to 3.2 g 100 g−1 dw. SFAs accounted for 39.2–65.2% of total FAs, with PA as the dominant component in all species. Myristic acid (14:0) was also present at notable levels in some taxa, particularly A. armata.
MUFAs represented a smaller fraction of total FAs compared with brown and green algae, generally remaining below 25%. OA was the principal MUFA across red species. PUFAs accounted for 21.1–44.0% of total FAs, ARA, and EPA as the dominant LCPUFAs. G. pusillum exhibited particularly high PUFA levels, including elevated EPA proportions. DHA was detected in several red algae, but generally at low concentrations. The n-6/n-3 ratios varied among species, ranging from values close to unity to above 2.0.
Overall, the FA profiles revealed strong taxonomic structuring, with brown macroalgae characterised by higher proportions of LCPUFAs, green macroalgae enriched in C18 PUFAs, and red macroalgae dominated by SFAs with moderate levels of EPA and ARA.

3.4. Carotenoid Profiles

The carotenoid composition of the analysed Mediterranean macroalgae showed clear taxonomic differentiation, both in total carotenoid content (Table 2) and in the qualitative profiles obtained by LC–MS analysis (Table 6, Supplementary Table S2). Distinct carotenoid assemblages were observed among brown, green, and red macroalgae, with marked interspecific variability within each group.

3.4.1. Brown Macroalgae

Brown macroalgae generally exhibited higher total carotenoid contents among all analysed taxa, with values ranging from 2.5 to 89.6 mg 100 g−1 fw. R. okamurae showed the highest concentrations (87.1–89.6 mg 100 g−1 fw), followed by D. dichotoma (62.6–65.1 mg 100 g−1 fw) and C. humilis (59.3–63.3 mg 100 g−1 fw). In contrast, E. selaginoides and P. pavonica displayed comparatively low total carotenoid levels (<5 mg 100 g−1 fw).
LC–MS analysis revealed fucoxanthin as the dominant carotenoid in all brown species, accompanied by lower amounts of violaxanthin, neoxanthin, antheraxanthin, and β-carotene. The relative abundance of fucoxanthin varied among species and sampling periods, accounting for most of the total carotenoids in R. okamurae, D. dichotoma, and C. humilis. Minor carotenoids were detected in species-specific patterns, contributing to intra-group variability.

3.4.2. Green Macroalgae

Green macroalgae exhibited moderate to low total carotenoid contents, ranging from 0.3 mg 100 g−1 fw in U. lactuca to over 50 mg 100 g−1 fw in F. petiolata. Codium species generally contained low to moderate levels (2.6–6.8 mg 100 g−1 fw), whereas F. petiolata consistently showed elevated carotenoid concentrations (51.8–52.7 mg 100 g−1 fw).
Carotenoid profiling by LC–MS indicated lutein as the predominant pigment in all green species, along with high β-carotene amounts. Siphonoxanthin was detected in C. bursa and C. tomentosum CT1. Other carotenoids were below 10%, such as neoxanthin, violaxanthin, zeaxanthin, and antheraxanthin. The relative proportions of lutein varied among species and sampling dates, while total carotenoid levels remained consistently lower than those observed in brown macroalgae, except for F. petiolata.

3.4.3. Red Macroalgae

Red macroalgae generally displayed the lowest total carotenoid contents among the analysed groups, with most species containing less than 20 mg 100 g−1 fw. G. pusillum represented a notable exception, exhibiting relatively high carotenoid levels (63.1 mg 100 g−1 fw), comparable to those observed in several brown algae. Other red species, including P. umbilicalis and Polysiphonia spp., showed consistently low carotenoid concentrations (≤7.5 mg 100 g−1 fw).
LC–MS analysis demonstrated that β-carotene was the dominant carotenoid in red macroalgae, followed by zeaxanthin. Minor carotenoids were detected at low intensities and varied among species. The overall carotenoid profiles of red algae were less complex than those of brown and green taxa, reflecting a narrower diversity of detectable pigments.

3.5. Principal Component Analysis

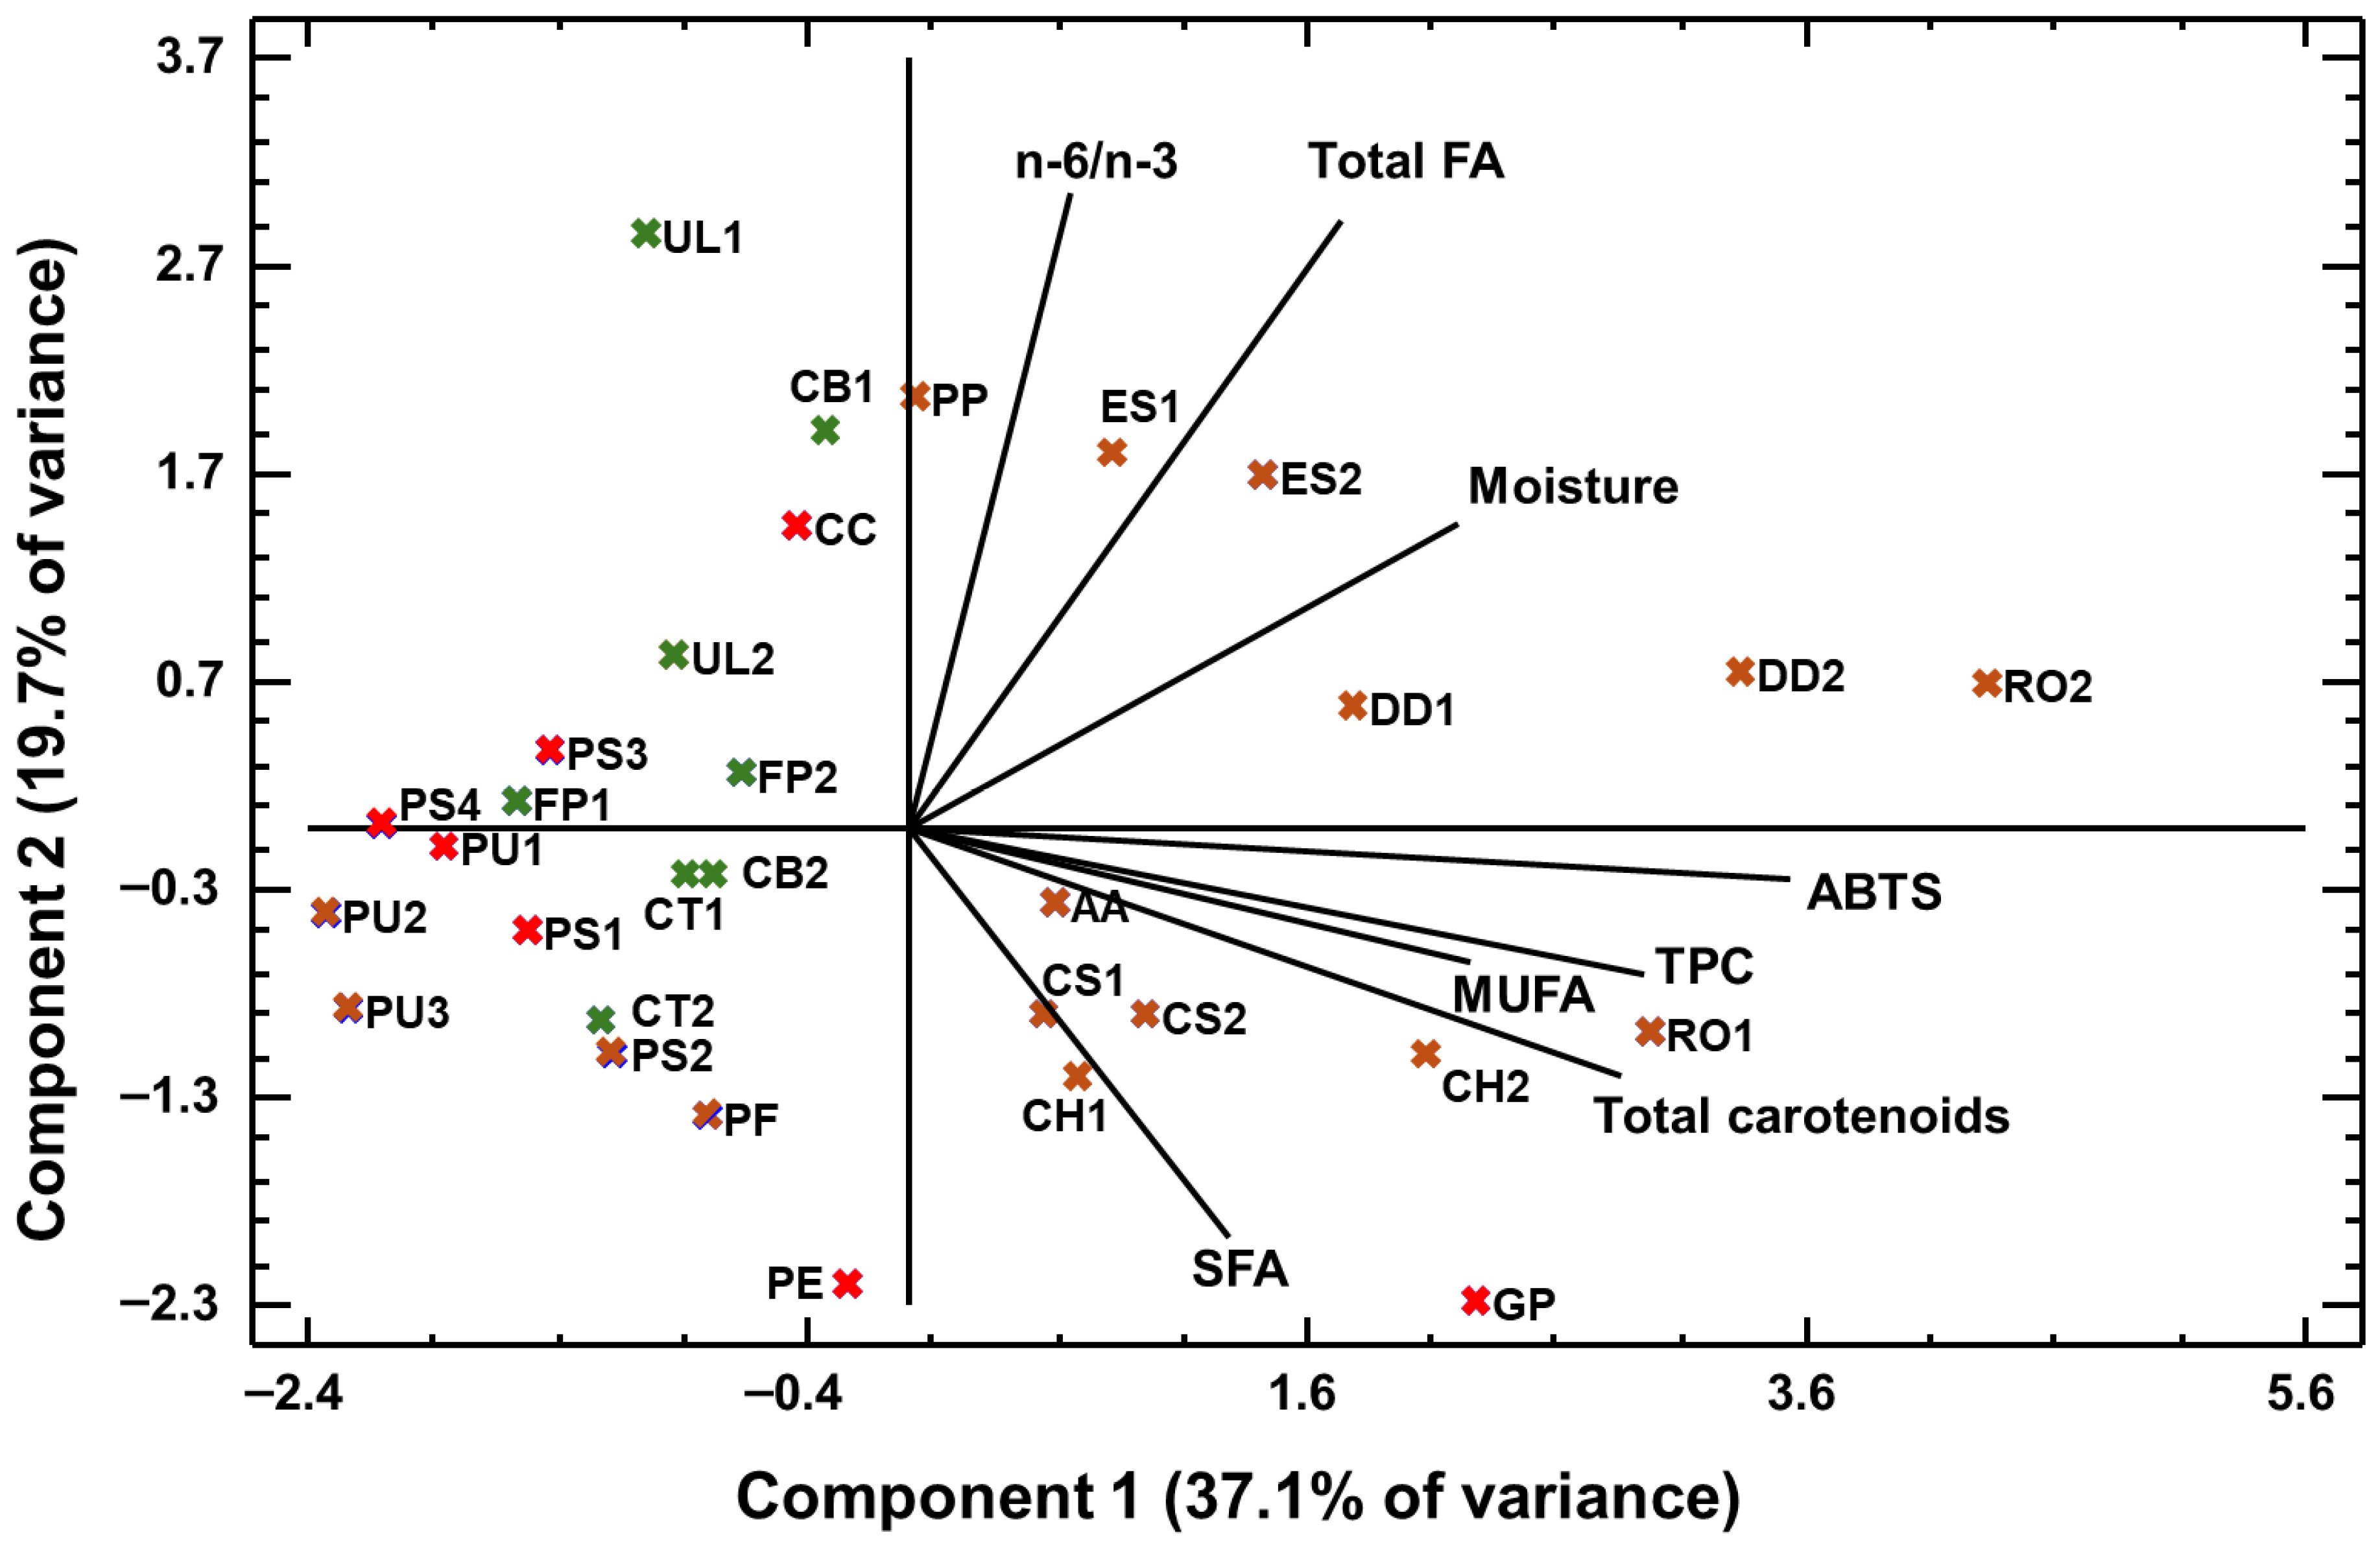
This analysis was conducted to identify potential relationships among the analysed variables and sample characteristics. Principal component analysis (PCA) was applied to a subset of selected variables, and the results are presented in the corresponding graphical output. A total of 8 principal components were extracted, cumulatively explaining 100.0% of the variance in the dataset. The first two principal components, PC1 and PC2, accounted for 37.1% and 19.7% of the total variance, respectively, together explaining 56.8% of the overall variability. Among the PCA graphical representations, the biplot provided the most informative visualisation of the multivariate structure of the data. In this biplot, PC1 and PC2 are represented on the horizontal and vertical axes, respectively. The spatial distribution of samples indicates clustering patterns based on similarities among the measured variables. Figure 2 illustrates the PCA biplot projected onto the plane defined by PC1 and PC2.

4. Discussion

4.1. Moisture Content, Total Carotenoids, Total Phenolic Content, Total Flavonoid Content, and Antioxidant Activity

The biochemical traits analysed varied markedly among species and taxonomic groups and were modulated by seasonal conditions, particularly between samples collected during colder months (1) and warmer periods (2). Such variability reflects the strong influence of temperature, irradiance, and environmental stressors on macroalgal metabolism [3,4]. The concentration of all the aforementioned compounds and their antioxidant capacities tend to vary within the same species at different seasons and sampling locations. Furthermore, comparisons are difficult within and between groups, given the differences in sampling locations and seaweed collection dates. Logically, sample collection has been conditioned by its availability.
Moisture content differed significantly among taxa, with green algae generally exhibiting higher values than brown and red species, consistent with their less rigid thalli and greater intracellular water retention [4,5]. Specimens collected during colder months (1) frequently showed slightly higher moisture contents than those harvested in warmer months (2), likely due to reduced evaporative demand in winter [7]. Seasonal changes were less pronounced in brown and red algae, whose thicker, fibrous thalli provide greater structural stability [3]. Even moderate moisture variation, however, may affect metabolite concentrations expressed on a fresh-weight (fw) basis. These values agree with those previously reported [32], and differences are consistent with contrasting thallus morphologies and tissue densities among taxonomic groups.
Total carotenoids displayed clear taxonomic structuring, with brown macroalgae consistently showing the highest levels, in agreement with the dominance of fucoxanthin in this group [8,9]. Brown species collected during warmer months (2) generally exhibited increased carotenoid contents, reflecting enhanced photoprotective responses under higher irradiance [9]. Green macroalgae showed more variable seasonal patterns, likely linked to species-specific pigment composition [10]. Red macroalgae maintained comparatively low carotenoid levels, consistent with their reliance on phycobiliproteins [11,12].
Total phenolic (TPC) and flavonoid (TFC) contents were highest in brown macroalgae, probably reflecting the abundance of phlorotannins [8,13,33]. Warmer-month samples (2) often showed elevated TPC and TFC, consistent with stress-induced phenolic biosynthesis under increased temperature and UV exposure [4,14]. Green and red algae generally contained lower levels, although seasonal increases were observed in some taxa [15,16]. The values found in this work agree with previous findings. In general, brown macroalgae such as Padina pavonica and Sargassum spp. show higher phenolic contents and antioxidant activity, whereas green species such as U. lactuca and red algae such as C. crispus tend to exhibit lower levels [15,31]. Variability in GAE and QE values reflects both taxonomic differences and environmental influences on secondary metabolism [8,14].
Antioxidant activity (DPPH and ABTS•+) paralleled carotenoid and phenolic patterns. Brown macroalgae generally exhibited higher antioxidant capacities, particularly in warmer months (2), supporting the protective role of phlorotannins and fucoxanthin [8,9]. Green and red algae showed lower but species-dependent responses [11,12]. The antioxidant capacity quantified here aligns with previous research indicating that brown macroalgae generally show the highest antioxidant activities due to their elevated levels of phlorotannins and carotenoids such as fucoxanthin [34]. Species such as P. pavonica, Sargassum muticum, and Dictyota spp. frequently exhibit strong DPPH and ABTS•+ scavenging capacities [14,33]. Green macroalgae usually display moderate antioxidant activity, as observed in U. lactuca, where phenolics and carotenoids contribute to radical-scavenging capacity [15]. Red macroalgae typically present lower but still notable antioxidant potential, with species such as C. crispus and Porphyra spp. showing activity associated with bromophenols and PUFAs [35]. Overall, antioxidant capacity varies widely among taxa and environmental conditions, although brown algae consistently rank among the most potent sources of natural antioxidants.
The combined data indicate strong taxonomic structuring of moisture content, bioactive compound abundance, and antioxidant capacity among Mediterranean macroalgae, with brown species consistently exhibiting the highest concentrations of carotenoids, phenolics, flavonoids, and antioxidant activity.
The close correspondence among TPC, TFC, carotenoids, and antioxidant activity supports the concept of a synergistic antioxidant network in macroalgae [4,14].
Both taxonomic identity and season strongly influenced moisture and antioxidant-related traits. Warmer-month samples generally exhibited higher carotenoid and phenolic contents and greater antioxidant activity, particularly in brown macroalgae, whereas colder-month samples showed higher moisture content. These findings emphasise the importance of seasonally optimised harvesting strategies for sustainable exploitation and biotechnological valorisation [23,24].

4.2. Fatty Acids

The FA profiles of the Mediterranean macroalgae analysed in this study showed strong taxonomic structuring and clear modulation by seasonal conditions, particularly when comparing samples collected during the coldest months (1) with those harvested during warmer periods (2). These patterns are consistent with the high physiological plasticity of macroalgae and the sensitivity of lipid metabolism to environmental drivers such as temperature, light availability, and nutrient status [3,4].
Across all taxa, SFAs constituted a major proportion of total FAs, with PA consistently dominating the SFA fraction. This predominance has been widely reported in marine macroalgae and reflects the structural role of SFAs in membrane lipids [5,6]. Brown macroalgae generally exhibited higher total FA contents and more complex FA profiles than green and red species, particularly due to their enrichment in LCPUFAs, including EPA and ARA [3].
Green macroalgae were characterised by higher proportions of C18 PUFAs, notably LA and ALA, in agreement with previous studies highlighting chlorophytes as important sources of essential FAs (EFAs) [5,6]. Red macroalgae displayed comparatively simpler FA profiles, dominated by SFAs and moderate levels of EPA and ARA, consistent with earlier reports [3,5]. Previous reports indicate that brown seaweed generally contains substantial proportions of LCPUFAs, such as EPA, along with PA as a major SFA; species of Sargassum, Dictyota, and Laminaria frequently exhibit this pattern [35,36]. Green macroalgae are typically characterised by higher levels of C16 and C18 FA, including PA, OA, LA, and ALA, as reported for genera such as Ulva and Codium [35,36]. Red macroalgae often show relatively high proportions of PA together with significant amounts of EPA and, in some species, ARA; examples include Porphyra, Gelidium, and Chondrus species [35,36]. Overall, although total lipid contents in seaweeds are generally low, their FA composition—particularly the presence of health-relevant n-3 LCPUFAs—contributes to the nutritional and functional value of macroalgal biomass.
Seasonal effects on FA composition were evident across all taxonomic groups, with samples collected during colder months (1) generally exhibiting higher relative proportions of PUFAs, particularly n-3 PUFAs, compared with those collected during warmer months (2). This trend is consistent with the well-documented role of unsaturated FAs in maintaining membrane fluidity at lower temperatures, a phenomenon widely observed in marine photosynthetic organisms [3,7]
In brown macroalgae, cold-season samples often showed elevated EPA and total n-3 PUFA levels, whereas warmer-season specimens tended to exhibit higher proportions of SFAs and MUFAs. These shifts suggest temperature-dependent regulation of desaturase and elongase activities, with reduced unsaturation during warmer periods when membrane rigidity is less critical [7]. Green macroalgae also displayed seasonal changes, with colder-month samples showing increased ALA and EPA proportions, while warmer-month samples were relatively enriched in SFAs and MUFAs.
Red macroalgae exhibited less pronounced seasonal variability, possibly reflecting their generally lower lipid content and simpler FA composition. Nevertheless, increases in EPA and total PUFA content during colder months were still observable in some species, indicating that temperature-driven lipid modulation is a common physiological response across macroalgal taxa [6].
The n-6/n-3 PUFA ratios observed in this study were generally low across all macroalgal groups, particularly in brown species, and frequently decreased further in samples collected during colder months (1). Such low ratios are considered nutritionally advantageous and contrast favourably with those of typical Western diets [3]. Seasonal reductions in n-6/n-3 ratios during colder periods were primarily driven by increased accumulation of n-3 PUFAs, especially EPA, reinforcing the importance of harvest timing for maximising nutritional quality.
The observed seasonal modulation of FA profiles likely reflects the combined influence of temperature, light intensity, and nutrient availability on lipid biosynthesis and desaturation pathways. Cold temperatures favour PUFA accumulation to preserve membrane functionality, while warmer conditions promote SFA and MUFA synthesis, potentially reducing susceptibility to lipid peroxidation under high irradiance [4,7]. Additionally, seasonal changes in growth rate and metabolic demand may further contribute to the observed variability among species and sampling periods.
Overall, the FA composition of Mediterranean macroalgae is shaped by both taxonomy and seasonality, with colder-month collections generally yielding biomass richer in nutritionally valuable PUFAs, particularly n-3 ones. Brown macroalgae emerge as especially promising sources of n-3 LCPUFAs, whereas green algae provide substantial amounts of C18 EFAs. These findings underscore the importance of seasonally optimised harvesting strategies to maximise lipid quality and support the sustainable use of Mediterranean macroalgae in functional foods, nutraceuticals, and marine biotechnology applications [23,24].

4.3. Carotenoids

Carotenoid composition and abundance in the analysed Mediterranean macroalgae exhibited strong taxonomic structuring and clear seasonal modulation, particularly when comparing samples collected during the coldest months (1) with those harvested during warmer periods (2). These patterns are consistent with the multifunctional roles of carotenoids in light harvesting, photoprotection, and oxidative stress mitigation in marine macroalgae [8,9].
Brown macroalgae consistently displayed the highest total carotenoid contents, largely driven by the dominance of fucoxanthin, which is a characteristic pigment of this group. Fucoxanthin plays a central role in enhancing light absorption efficiency under blue-green wavelengths and provides protection against excess irradiance, conferring a competitive advantage in variable light environments [8,9]. The high carotenoid levels observed in several brown species are therefore consistent with their ecological distribution and physiological requirements.
Green macroalgae were characterised by carotenoid profiles dominated by lutein and siphonoxanthin, with generally lower total carotenoid contents compared with brown algae. These pigments are associated with photoprotection and antioxidant defence, particularly under high-light conditions [9,10]. Red macroalgae typically exhibited the lowest total carotenoid contents, reflecting their reliance on phycobiliproteins for light harvesting, although species-specific deviations highlight metabolic flexibility within this group [11,12].
Seasonal variation in total carotenoid content was most pronounced in brown macroalgae, with samples collected during warmer months (2) generally exhibiting higher carotenoid concentrations than those collected during colder months (1). Increased light intensity, longer photoperiods, and higher temperatures during spring and summer are known to stimulate carotenoid biosynthesis, particularly of photoprotective pigments such as fucoxanthin, violaxanthin, and antheraxanthin [8,9]. These conditions likely enhance the need for energy dissipation and reactive oxygen species scavenging, resulting in elevated carotenoid accumulation.
In green macroalgae, seasonal trends were more variable and species-dependent. Some taxa showed moderate increases in carotenoid content during warmer months, whereas others maintained relatively stable levels across seasons. This variability may reflect differences in habitat exposure, pigment composition, and acclimation capacity among chlorophytes [10]. Red macroalgae generally exhibited limited seasonal fluctuation in carotenoid content, consistent with the secondary role of carotenoids in their photosynthetic apparatus [11].
Carotenoid content in seaweeds varies widely among taxonomic groups and species, reflecting differences in pigment composition and photosynthetic strategies. The results exposed here agree with previous findings stating that brown macroalgae generally contain the highest carotenoid levels. Species such as S. muticum, P. pavonica, and D. dichotoma have been reported to contain relatively high total carotenoid concentrations, often dominated by fucoxanthin [32,37]. Green macroalgae typically show lower total carotenoid contents, with pigments mainly represented by lutein, β-carotene, and siphonoxanthin; examples include U. lactuca and Codium species [38]. Red macroalgae generally possess the lowest carotenoid levels because their photosynthetic apparatus relies primarily on phycobiliproteins, although carotenoids such as β-carotene and zeaxanthin are still present in species such as Porphyra and C. crispus [32,38]. Overall, the taxonomic distribution of carotenoids in macroalgae reflects adaptations to light capture and photoprotection in different marine environments.
The seasonal patterns observed in carotenoid content were closely aligned with variations in antioxidant activity, particularly in brown macroalgae. Carotenoids contribute to antioxidant defence through quenching of singlet oxygen and scavenging of free radicals, acting synergistically with phenolic compounds and other antioxidants [4,8]. The higher carotenoid concentrations observed during warmer months (2), therefore, likely contribute to the enhanced antioxidant capacities measured in these samples.
In green and red macroalgae, the contribution of carotenoids to overall antioxidant activity appears more limited, reflecting their lower concentrations and the greater relative importance of other antioxidant systems. Nevertheless, seasonal increases in carotenoid content in selected species suggest that these pigments still play a role in modulating oxidative stress responses under changing environmental conditions [9,10].
The observed seasonal modulation of carotenoid content can be attributed primarily to variations in light intensity and temperature, which influence pigment synthesis, turnover, and photoprotective demand. Warmer months impose higher photooxidative stress due to increased irradiance and thermal load, promoting carotenoid accumulation as a protective strategy, whereas colder months are associated with reduced pigment requirements and lower biosynthetic investment [4,8]. These responses highlight the dynamic regulation of carotenoid metabolism in macroalgae and its role in environmental acclimation.
From an applied perspective, the pronounced seasonal and taxonomic variability in carotenoid content underscores the importance of harvest timing and species selection for the valorisation of macroalgal biomass. Brown macroalgae collected during warmer months represent particularly rich sources of fucoxanthin and related carotenoids, whereas selected green and red species may offer niche pigment profiles of interest for functional foods and nutraceutical applications [9,23]. Incorporating seasonal dynamics into harvesting strategies is therefore essential for maximising carotenoid yield and functional value.

4.4. PCA Analysis

For the PCA, a reduced set of non-redundant biochemical variables was selected to maximise discriminatory power while avoiding collinearity. Moisture (%) was included as a structurally independent parameter reflecting tissue hydration and influencing concentration-based measurements. Total FAs (g 100 g−1 dw) were used as an integrative lipid metric, while PUFA (% total FA) captured lipid quality and nutritional relevance. SFA, MUFA, and the n-6/n-3 ratio were incorporated as a synthetic indicator of FA balance, summarising PUFA families into a lower number of interpretable variables. Total carotenoids (mg 100 g−1 fw) represented the main pigment fraction across taxa. Total phenolic content (TPC) was selected as the most robust predictor of antioxidant potential. ABTS•+ activity was included as an integrative antioxidant metric, reflecting both hydrophilic and lipophilic contributions more comprehensively than DPPH. Together, these variables provide a compact and biologically meaningful dataset for multivariate discrimination among algal groups.
The score plot shows a clear taxonomic structuring of samples; however, given the different sampling conditions, interpreting clustering as taxonomic structuring should be approached with caution. Brown seaweed occupies a broader and more dispersed area of the ordination space, whereas green and red seaweeds cluster more tightly. This indicates that brown taxa exhibit greater biochemical variability across the selected variables (moisture, total FA, PUFA-related metrics, carotenoids, TPC, ABTS•+), whereas green and red taxa display more homogeneous profiles.
The separation of brown algae along the primary component suggests that their higher total carotenoids, elevated TPC, stronger ABTS•+ activity, and enriched LCPUFA content are major drivers of variance. Species such as R. okamurae and D. dichotoma likely contribute strongly to this axis due to their elevated phenolic and pigment contents. In contrast, green and red algae cluster in a narrower region, reflecting lower carotenoid levels, moderate phenolic contents, and less extreme lipid structuring.
Importantly, seasonal replicates (codes 1 vs. 2) do not show systematic separation. Samples collected in colder months overlap extensively with those from warmer months within each taxonomic group. This indicates that interspecific biochemical differences are stronger than seasonal shifts in the present dataset.
The close proximity of ABTS•+, total carotenoids, and TPC vectors indicates their strong positive correlation. This suggests that antioxidant capacity in these macroalgae is jointly driven by both carotenoid and phenolic pools, rather than by a single dominant compound class.
Overall, the PCA supports that taxonomic identity is the primary structuring factor of biochemical composition, with brown seaweed exhibiting the most distinctive and enriched bioactive profiles. However, a more comprehensive sampling could definitively shed light on this issue.

4.5. Disentangling Seasonal Influence on Macroalgal Biochemical Composition

The primary objective of this study was to isolate the effect of seasonal periodicity on the biochemical profile of Mediterranean macroalgae, focusing on the metabolic transition between cold and warm thermal regimes. To achieve this, El Toyo (Almería) was strategically selected as the representative study site. As the location with the most extensive sample set, El Toyo allows for a robust analysis that minimizes confounding spatial variables—such as hydrodynamics, nutrient availability, and localized anthropogenic factors—thereby effectively disentangling seasonal influence from environmental noise. The parameters analyzed were selected to provide a holistic view of macroalgal physiological responses, focusing on photoprotective/antioxidant defenses (carotenoids, TPC, and ABTS) and structural lipid remodeling (Total FA, SFA, MUFA, and PUFA).
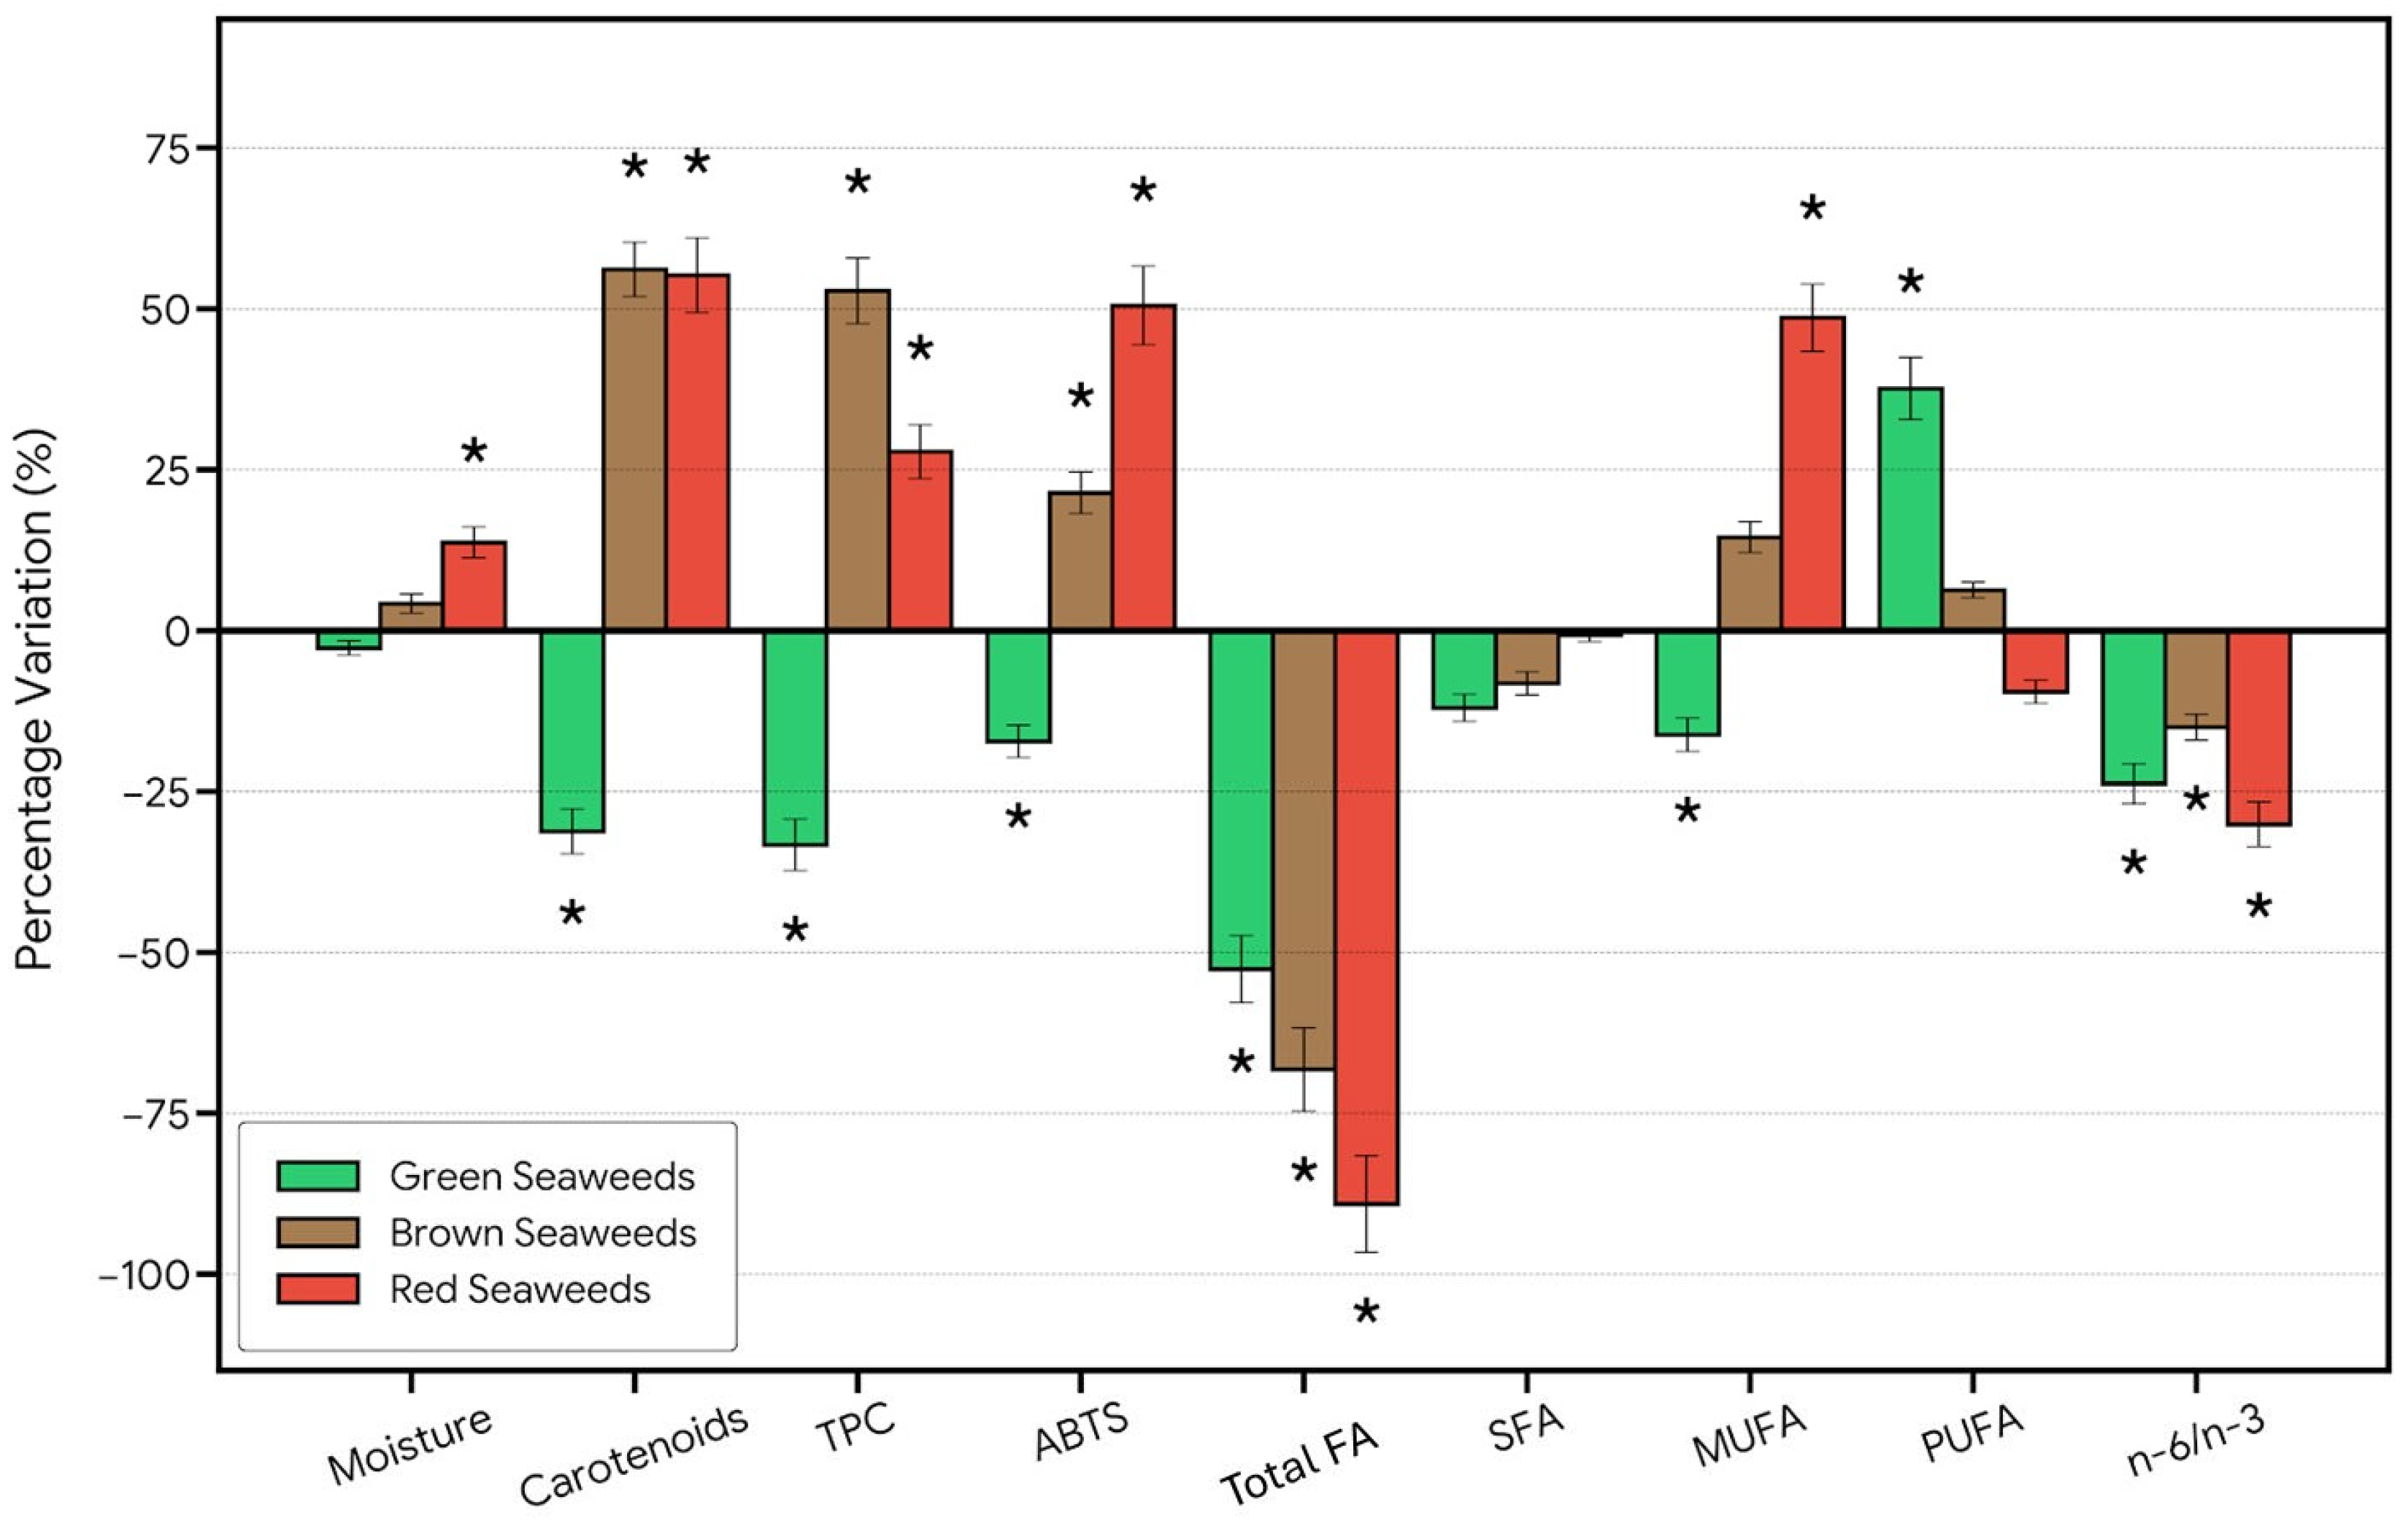
As illustrated in Figure 3, the normalized seasonal variations reveal a high degree of metabolic plasticity, with distinct strategies emerging across the three taxonomic groups. Notably, the Brown seaweeds generally exhibited the most robust seasonal response in bioactive compounds, characterized by a statistically significant increase in TPC (+52.8%) and carotenoids (+56.1%) during the warm months (p < 0.05). This surge in phenolic compounds, coupled with a 21.4% increase in ABTS radical scavenging activity, suggests that Brown algae prioritize the synthesis of secondary metabolites to mitigate the oxidative stress associated with higher solar irradiance and temperatures. This is consistent with findings in Mediterranean Brown seaweeds, where phlorotannins serve as primary photoprotectors and chemical defenses against heat-induced ROS generation [39].
Similarly, the red seaweeds indicated a significant upward shift in antioxidant capacity (ABTS•+: +50.5%) and carotenoids (+55.2%). In the Mediterranean, red algae are known to accumulate pigments and phenolic terpenoids as a protective measure when thermal stratification limits nutrient vertical flux, leading to increased light penetration [40]. In contrast, the green seaweeds showed a divergent trend, with a marked reduction in both carotenoids (−31.2%) and TPC (−33.3%) during the warm season. This depletion suggests that while some opportunistic green species exhibit high initial plasticity, their metabolic capacity for sustained chemical defense may be more sensitive to prolonged summer thermal stress or nutrient limitation compared to their brown and red counterparts.
The lipidomic data shown in Figure 3 further highlight a generalized strategy of homeoviscous membrane adaptation across all taxa. A sharp reduction in total FA was observed in the warm season, most notably in red (−89.1%) and brown (−68.2%) seaweeds (p < 0.05). This quantitative decline was accompanied by a qualitative remodelling of FA profiles. Specifically, the reduction in PUFA levels in brown (−15.0%) and red (−30.1%) seaweeds, relative to their group means, serves to decrease membrane fluidity in response to thermal stress, a mechanism widely documented in marine organisms to maintain membrane integrity under rising temperatures [41]. Conversely, green seaweeds exhibited a significant increase in PUFA (+37.6%), highlighting a unique taxonomic variation in lipid metabolism that may be linked to their rapid growth rates and distinct physiological niche. Furthermore, the significant increase in MUFA in the red group (+48.6%) suggests a transition toward more stable fatty acid chains.
In conclusion, these findings underscore that Mediterranean macroalgae employ highly specialized and taxonomically distinct resource allocation strategies to maintain physiological homeostasis. The ability of brown and red seaweeds to bolster their antioxidant arsenal while simultaneously remodelling membrane lipids suggests a high degree of resilience to seasonal thermal fluctuations, which may be a critical determinant for species persistence in an increasingly warming Mediterranean ecosystem.

4.6. Limitations and Practical Applications

Although this work provides a broad biochemical characterisation of Mediterranean macroalgae, several limitations should be acknowledged. Seasonal comparisons were not supported by in situ measurements of temperature, irradiance, or nutrients, limiting direct attribution of biochemical shifts to specific environmental drivers. Analyses were conducted on whole thalli, without accounting for tissue- or stage-specific variability in lipids, phenolics, and pigments. Additionally, since species were collected across different locations and periods without accompanying environmental measurements, it is difficult to disentangle taxonomic from seasonal effects.
Antioxidant activity was assessed using in vitro assays (DPPH, ABTS•+), which do not reflect bioavailability or in vivo efficacy, and colourimetric methods provided only global estimates of phenolics and flavonoids. Beyond the rigorous protocol that has been followed in this study to analyse carotenoids and despite technological advancements, LC–MS analysis of carotenoids requires rigorous validation and specialised laboratory conditions—including light protection and inert atmospheres—to mitigate degradation. The field continues to move toward high-resolution mass spectrometry (HRMS) and the development of more stable extraction protocols to overcome these persistent limitations.
Despite these limitations, the results establish a robust biochemical baseline for sustainable exploitation. Marine macroalgae harvesting is an important and rapidly growing component of the global blue economy. Seaweed is widely utilised for food, hydrocolloids (agar, carrageenan, alginates), and bioactive compounds used in nutraceutical, pharmaceutical, and cosmetic industries. Global production exceeds 35 million tonnes annually, largely from aquaculture but still includes significant wild harvesting [42]. This growing demand highlights the need for sustainable harvesting and aquaculture practices to avoid overexploitation and ensure long-term ecological and economic stability.
Macroalgae aquaculture has expanded rapidly and now represents the main source of global algae production. Cultivation systems are well established for several brown, red, and green taxa, including Saccharina and Undaria (brown algae), Porphyra/Pyropia and Kappaphycus (red algae), and Ulva species (green algae). These farmed macroalgae support major food and hydrocolloid industries while providing biomass for emerging applications in nutraceuticals, functional foods, and bio-based products. Continued development of sustainable cultivation technologies and species diversification is therefore essential to reduce pressure on wild populations and ensure a stable supply of macroalgal biomass [42,43].
Beyond some limitations mentioned, taxonomic identity and harvest season strongly influenced lipid, pigment, phenolic, and antioxidant profiles. Brown macroalgae showed promise for nutraceutical use due to high n-3 LCPUFAs, fucoxanthin, and phlorotannins, whereas green and red taxa offer complementary nutritional and functional applications. Understanding this variability supports targeted harvesting, aquaculture planning, and evidence-based valorisation strategies.
It should be noted that the sampling design, encompassing multiple locations and seasons, may introduce environmental variability influencing biochemical composition. Consequently, differences observed among taxonomic groups should be interpreted cautiously, as they likely reflect both intrinsic biological traits and external environmental drivers. Future work integrating abiotic parameters (e.g., temperature, nutrients, light) would allow a clearer disentanglement of environmental and taxonomic effects.

5. Conclusions

This study indicates that Mediterranean green, brown, and red macroalgae exhibit clear taxonomic differentiation in their FA, carotenoid, phenolic, and antioxidant profiles, driven primarily by divergent metabolic responses to seasonal transitions. By focusing the seasonal analysis on the El Toyo (Almería) site—which provided the largest and most taxonomically diverse sample set—we effectively minimized the influence of spatial variability, such as hydrodynamics and nutrient availability. This strategic site selection allowed for the disentanglement of taxonomic effects from seasonal ones, revealing that brown seaweeds exhibit the highest plasticity in antioxidant defenses, while red seaweeds prioritize dramatic total FA remodeling (reduction in PUFAs) to maintain membrane integrity during warm periods. Conversely, green seaweed followed a distinct trajectory with seasonal increases in PUFA content. These findings underscore the potential of Mediterranean macroalgae as sustainable, taxonomically distinct bioresources for functional and nutraceutical applications. However, further studies under controlled environmental conditions are needed to confirm these patterns.

Supplementary Materials

The following supporting information can be downloaded at: https://www.mdpi.com/article/10.3390/phycology6020037/s1. Supplementary File S1: Materials and Methods. This file includes Supplementary Table S1: Method validation results for the determination of fatty acids; Supplementary Table S2: LC-MS parameters for detected carotenoids. Supplementary Table S3: Autoscaled (Z-score normalised) data matrix used for Principal Component Analysis (values are dimensionless); Supplementary Table S4: Extracted components of the PCA analysis. References [44,45] are cited in the Supplementary Materials.

Author Contributions

Conceptualization, J.L.G.-G., M.E., T.C.-C., R.L.-R. and J.A.M.P.; writing—original draft preparation, J.L.G.-G., M.E., T.C.-C., R.L.-R. and J.A.M.P.; writing—review and editing, J.L.G.-G., M.E., T.C.-C., R.L.-R. and J.A.M.P.; project administration, J.L.G.-G. and J.A.M.P.; funding acquisition, J.L.G.-G. and J.A.M.P. All authors have read and agreed to the published version of the manuscript.

Funding

This research was funded by Fundação para a Ciência e a Tecnologia grants (Lisbon, Portugal) UIDB/00276/2020 to CIISA and LA/P/0059/2020 to AL4AnimalS.

Institutional Review Board Statement

Not applicable.

Informed Consent Statement

Not applicable.

Data Availability Statement

The original contributions presented in this study are included in the article. Further inquiries can be directed to the corresponding author(s).

Conflicts of Interest

The authors declare no conflicts of interest.

References

  1. Kaur, M.; Shitanaka, T.; Surendra, K.C.; Khanal, S.K. Macroalgae-derived bioactive compounds for functional food and pharmaceutical applications—A critical review. Crit. Rev. Food Sci. Nutr. 2025, 65, 4172–4194. [Google Scholar] [CrossRef] [PubMed]
  2. Bernard, M.; Tonk, L. Medicinal Uses of Seaweeds; Wageningen Marine Research: Wageningen, The Netherlands, 2019; pp. 1–2. [Google Scholar]
  3. Janarthanan, M.; Kumar, S. The properties of bioactive substances obtained from seaweeds and their applications in textile industries. J. Ind. Text. 2018, 48, 361–401. [Google Scholar] [CrossRef]
  4. Afreen, A.B.; Rasool, F.; Fatima, M. Bioactive properties of brown seaweed, Sargassum wightii and its nutritional, therapeutic potential and health benefits: A review. J. Environ. Biol. 2023, 44, 146–158. [Google Scholar] [CrossRef]
  5. Rohani-Ghadikolaei, K.; Abdulalian, E.; Ng, W.K. Evaluation of the proximate, fatty acid and mineral composition of representative green, brown and red seaweeds from the Persian Gulf of Iran as potential food and feed resources. J. Food Sci. Technol. 2012, 49, 774–780. [Google Scholar] [CrossRef]
  6. Zhong, B.; Robinson, N.; Warner, R.; Barrow, C.; Dunshea, F.; Suleria, H. LC-ESI-QTOF-MS/MS characterization of seaweed phenolics and their antioxidant potential. Mar. Drugs 2020, 18, 331. [Google Scholar] [CrossRef]
  7. Premarathna, A.D.; Tuvikene, R.; Fernando, P.H.P.; Adhikari, R.; Perera, M.C.N.; Ranahewa, T.H.; Rajapakse, R.P.V.J. Comparative analysis of proximate compositions, mineral and functional chemical groups of 15 different seaweed species. Sci. Rep. 2022, 12, 19610. [Google Scholar] [CrossRef]
  8. Khalid, S.; Abbas, M.; Saeed, F.; Bader-Ul-Ain, H.; Suleria, H. Therapeutic potential of seaweed bioactive compounds. In Bioactive Compounds; IntechOpen: London, UK, 2018. [Google Scholar] [CrossRef]
  9. Pradhan, B.; Ki, J.S. Antioxidant and chemotherapeutic efficacies of seaweed-derived phlorotannins in cancer treatment: A review regarding novel anticancer drugs. Phytother. Res. 2023, 37, 2067–2091. [Google Scholar] [CrossRef]
  10. Ismail, M.; Zokm, G.E.; Lopez, J.M. Nutritional, bioactive compounds content, and antioxidant activity of brown seaweeds from the Red Sea. Front. Nutr. 2023, 10, 1210934. [Google Scholar] [CrossRef]
  11. Maheswari, V.; Babu, P. Phlorotannin and its Derivatives, a potential antiviral molecule from brown seaweeds, an overview. Russ. J. Mar. Biol. 2022, 48, 309–324. [Google Scholar] [CrossRef]
  12. Keramane, B.; Del Pilar Sánchez-Camargo, A.; Montero, L.; Laincer, F.; Bedjou, F.; Ibáñez, E. Pressurized liquid extraction of bioactive extracts with antioxidant and antibacterial activity from green, red and brown Algerian algae. Algal Res. 2023, 76, 103293. [Google Scholar] [CrossRef]
  13. Templonuevo, R.; Lee, K.-H.; Oh, S.-M.; Zhao, Y.; Chun, J. Bioactive compounds of sea mustard (Undaria pinnatifida) waste affected by drying methods. Foods 2024, 13, 3815. [Google Scholar] [CrossRef] [PubMed]
  14. Balboa, E.M.; Conde, E.; Moure, A.; Falqué, E.; Domínguez, H. In vitro antioxidant properties of crude extracts and compounds from brown algae. Food Chem. 2013, 138, 1764–1785. [Google Scholar] [CrossRef] [PubMed]
  15. Farasat, M.; Khavari-Nejad, R.A.; Nabavi, S.M.B.; Namjooyan, F. Antioxidant activity, total phenolics and flavonoid contents of some edible green seaweeds from northern coasts of the Persian Gulf. Iran. J. Pharm. Res. 2014, 13, 163–170. [Google Scholar] [CrossRef] [PubMed]
  16. Ilyas, Z.; Redha, A.; Wu, Y.; Ozeer, F.Z.; Aluko, R. Nutritional and health benefits of the brown seaweed Himanthalia elongata. Plant Foods Hum. Nutr. 2023, 78, 233–242. [Google Scholar] [CrossRef]
  17. Bianchi, C.N.; Morri, C.; Chiantore, M.; Montefalcone, M.; Parravicini, V.; Rovere, A. Mediterranean Sea biodiversity between the legacy from the past and a future of change. In Life in the Mediterranean Sea: A Look at Habitat Changes; Stambler, N., Ed.; Nova Science Publishers: New York, NY, USA, 2012; pp. 1–55. [Google Scholar]
  18. Taglioni, E.; Cavaliere, C.; Cerrato, A.; Laganà, A.; Montone, C.; Capriotti, A. Comprehensive profiling of sulfated phenolic compounds in edible and infesting seaweeds by a dedicated software-assisted platform. Anal. Bioanal. Chem. 2025, 417, 5199–5209. [Google Scholar] [CrossRef]
  19. Biris-Dorhoi, E.-S.; Michiu, D.; Pop, C.-R.; Rotar, A.; Tofana, M.; Socaciu, C.; Farcas, A. Macroalgae-A sustainable source of chemical compounds with biological activities. Nutrients 2020, 12, 3085. [Google Scholar] [CrossRef]
  20. Ghaliaoui, N.; Hazzit, M.; Mokrane, H. Seaweeds as a potential source of bioactive compounds. Res. Biotechnol. Environ. Sci. 2024, 3, 1–8. [Google Scholar] [CrossRef]
  21. İrkin, L.C.; Yayıntas, Ö. Pharmacological properties and therapeutic benefits of seaweeds a review. Int. J. Trend Sci. Res. Dev. 2018, 2, 1126–1131. [Google Scholar] [CrossRef]
  22. D’Armas, H.; Jaramillo-Jaramillo, C.; D’Armas, M.; Ordaz-González, G.J. Fatty acid profile, total phenolic content and antioxidant capacity of seaweeds in Salinas Bay, Ecuador. Rev. Biol. Mar. Oceanogr. 2023, 58, 126–136. [Google Scholar] [CrossRef]
  23. Calvo, E.; Simó, R.; Coma, R.; Ribes, M.; Pascual, J.; Sabatés, A.; Gili, J.M.; Pelejero, C. Effects of climate change on Mediterranean marine ecosystems: The case of the Catalan Sea. Clim. Res. 2011, 50, 1–29. [Google Scholar] [CrossRef]
  24. Ismail, M.M.; Zokm, G.M.E. Algae as keystone for blue economy: Sustainability and challenges. Discov. Sustain. 2025, 6, 366. [Google Scholar] [CrossRef]
  25. Muntean, E.; Bercea, V.; Muntean, N. Small-scale batch technology for production of a natural food dye from green algae. In International Symposium Euro-Aliment, The Annals of the University Dunarea de Jos of Galati, Fascicle IV-Food Technology; Galati University Press: Galati, Romania, 2007; pp. 56–60. [Google Scholar]
  26. Re, R.; Pellegrini, N.; Proteggente, A.; Pannala, A.; Yang, M.; Rice-Evans, C. Antioxidant activity applying an improved ABTS radical cation decolorization assay. Free Radic. Biol. Med. 1999, 26, 1231–1237. [Google Scholar] [CrossRef] [PubMed]
  27. Skenderidis, P.; Lampakis, D.; Giavasis, I.; Leontopoulos, S.; Petrotos, K.; Hadjichristodoulou, C.; Tsakalof, A. Chemical properties, fatty-acid composition, and antioxidant activity of goji berry (Lycium barbarum L. and Lycium chinense Mill.) fruits. Antioxidants 2019, 8, 60. [Google Scholar] [CrossRef] [PubMed]
  28. Singleton, V.L.; Orthofer, R.; Lamuela-Raventós, R.M. Analysis of total phenols and other oxidation substrates and antioxidants by means of Folin-Ciocalteu reagent. Methods Enzymol. 1999, 299, 152–178. [Google Scholar] [CrossRef]
  29. Zou, Y.; Lu, Y.; Wei, D. Antioxidant activity of a flavonoid-rich extract of Hypericum perforatum L. in vitro. J. Agric. Food Chem. 2004, 52, 5032–5039. [Google Scholar] [CrossRef]
  30. Lyashenko, S.; González-Fernández, M.J.; Gómez-Mercado, F.; Yunusova, S.; Denisenko, O.; Guil-Guerrero, J.L. Ribes taxa: A promising source of γ-linolenic acid-rich functional oils. Food Chem. 2019, 301, 125309. [Google Scholar] [CrossRef]
  31. Holdt, S.L.; Kraan, S. Bioactive compounds in seaweed: Functional food applications and legislation. J. Appl. Phycol. 2011, 23, 543–597. [Google Scholar] [CrossRef]
  32. Wang, S.; Qiu, Y.; Zhu, F. A comparative review of red, green, and brown seaweed: Bioactive components, health effects, and machine learning approaches. Food Res. Int. 2026, 118420, in press. [Google Scholar] [CrossRef]
  33. Li, Y.X.; Wijesekara, I.; Li, Y.; Kim, S.K. Phlorotannins as bioactive agents from brown algae. Process Biochem. 2011, 46, 2219–2224. [Google Scholar] [CrossRef]
  34. Miyashita, K.; Beppu, F.; Hosokawa, M.; Liu, X.; Wang, S. Nutraceutical characteristics of the brown seaweed carotenoid fucoxanthin. Arch. Biochem. Biophys. 2020, 686, 108364. [Google Scholar] [CrossRef]
  35. van Ginneken, V.J.T.; Helsper, J.P.F.G.; de Visser, W.; van Keulen, H.; Brandenburg, W.A. Polyunsaturated fatty acids in various macroalgal species from North Atlantic and tropical seas. Lipids Health Dis. 2011, 10, 104. [Google Scholar] [CrossRef]
  36. Pereira, L. Edible Seaweeds of the World; CRC Press: Boca Raton, FL, USA, 2016. [Google Scholar]
  37. Peng, J.; Yuan, J.-P.; Wu, C.-F.; Wang, J.-H. Fucoxanthin, a marine carotenoid present in brown seaweeds and diatoms: Metabolism and bioactivities relevant to human health. Mar. Drugs 2011, 9, 1806–1828. [Google Scholar] [CrossRef] [PubMed]
  38. Takaichi, S. Carotenoids in algae: Distributions, biosyntheses and functions. Mar. Drugs 2011, 9, 1101–1118. [Google Scholar] [CrossRef] [PubMed]
  39. Celis-Plá, P.S.; Bouzon, Z.L.; Hall-Spencer, J.M.; Schmidt, E.C.; Korbee, N.; Figueroa, F.L. Seasonal biochemical and photophysiological responses in the intertidal macroalga Cystoseira tamariscifolia (Ochrophyta). Mar. Environ. Res. 2016, 115, 89–97. [Google Scholar] [CrossRef] [PubMed]
  40. Ismail, M.M.; Osman, M.E. Seasonal fluctuation of photosynthetic pigments of most common red seaweeds species collected from Abu Qir, Alexandria, Egypt. Rev. Biol. Mar. Oceanogr. 2016, 51, 515–525. [Google Scholar] [CrossRef]
  41. Stillwell, W.; Wassall, S.R. Docosahexaenoic acid: Membrane properties of a unique fatty acid. Chem. Phys. Lip. 2003, 126, 1–27. [Google Scholar] [CrossRef]
  42. FAO. The State of World Fisheries and Aquaculture 2022: Towards Blue Transformation; Food and Agriculture Organization of the United Nations: Rome, Italy, 2022. [Google Scholar] [CrossRef]
  43. Buschmann, A.H.; Camus, C.; Infante, J.; Neori, A.; Israel, Á.; Hernández-González, M.C.; Pereda, S.V.; Gomez-Pinchetti, J.L.; Golberg, A.; Tadmor-Shalev, N.; et al. Seaweed production: Overview of the global state of exploitation, farming and emerging research activity. Eur. J. Phycol. 2017, 52, 391–406. [Google Scholar] [CrossRef]
  44. Forbes-Hernandez, T.Y.; Gasparrini, M.; Afrin, S.; Bompadre, S.; Mezzetti, B.; Quiles, J.L.; Giampieri, F.; Battino, M. The healthy effects of strawberry polyphenols: Which strategy behind antioxidant capacity? Crit. Rev. Food Sci. Nutr. 2016, 56, 46–59. [Google Scholar] [CrossRef]
  45. Barroso, F.G.; Sánchez-Muros, M.J.; Rincón, M.Á.; Rodriguez-Rodriguez, M.; Fabrikov, D.; Morote, E.; Guil-Guerrero, J.L. Production of n-3-rich insects by bioaccumulation of fishery waste. J. Food Comp. Anal. 2019, 82, 103237. [Google Scholar] [CrossRef]
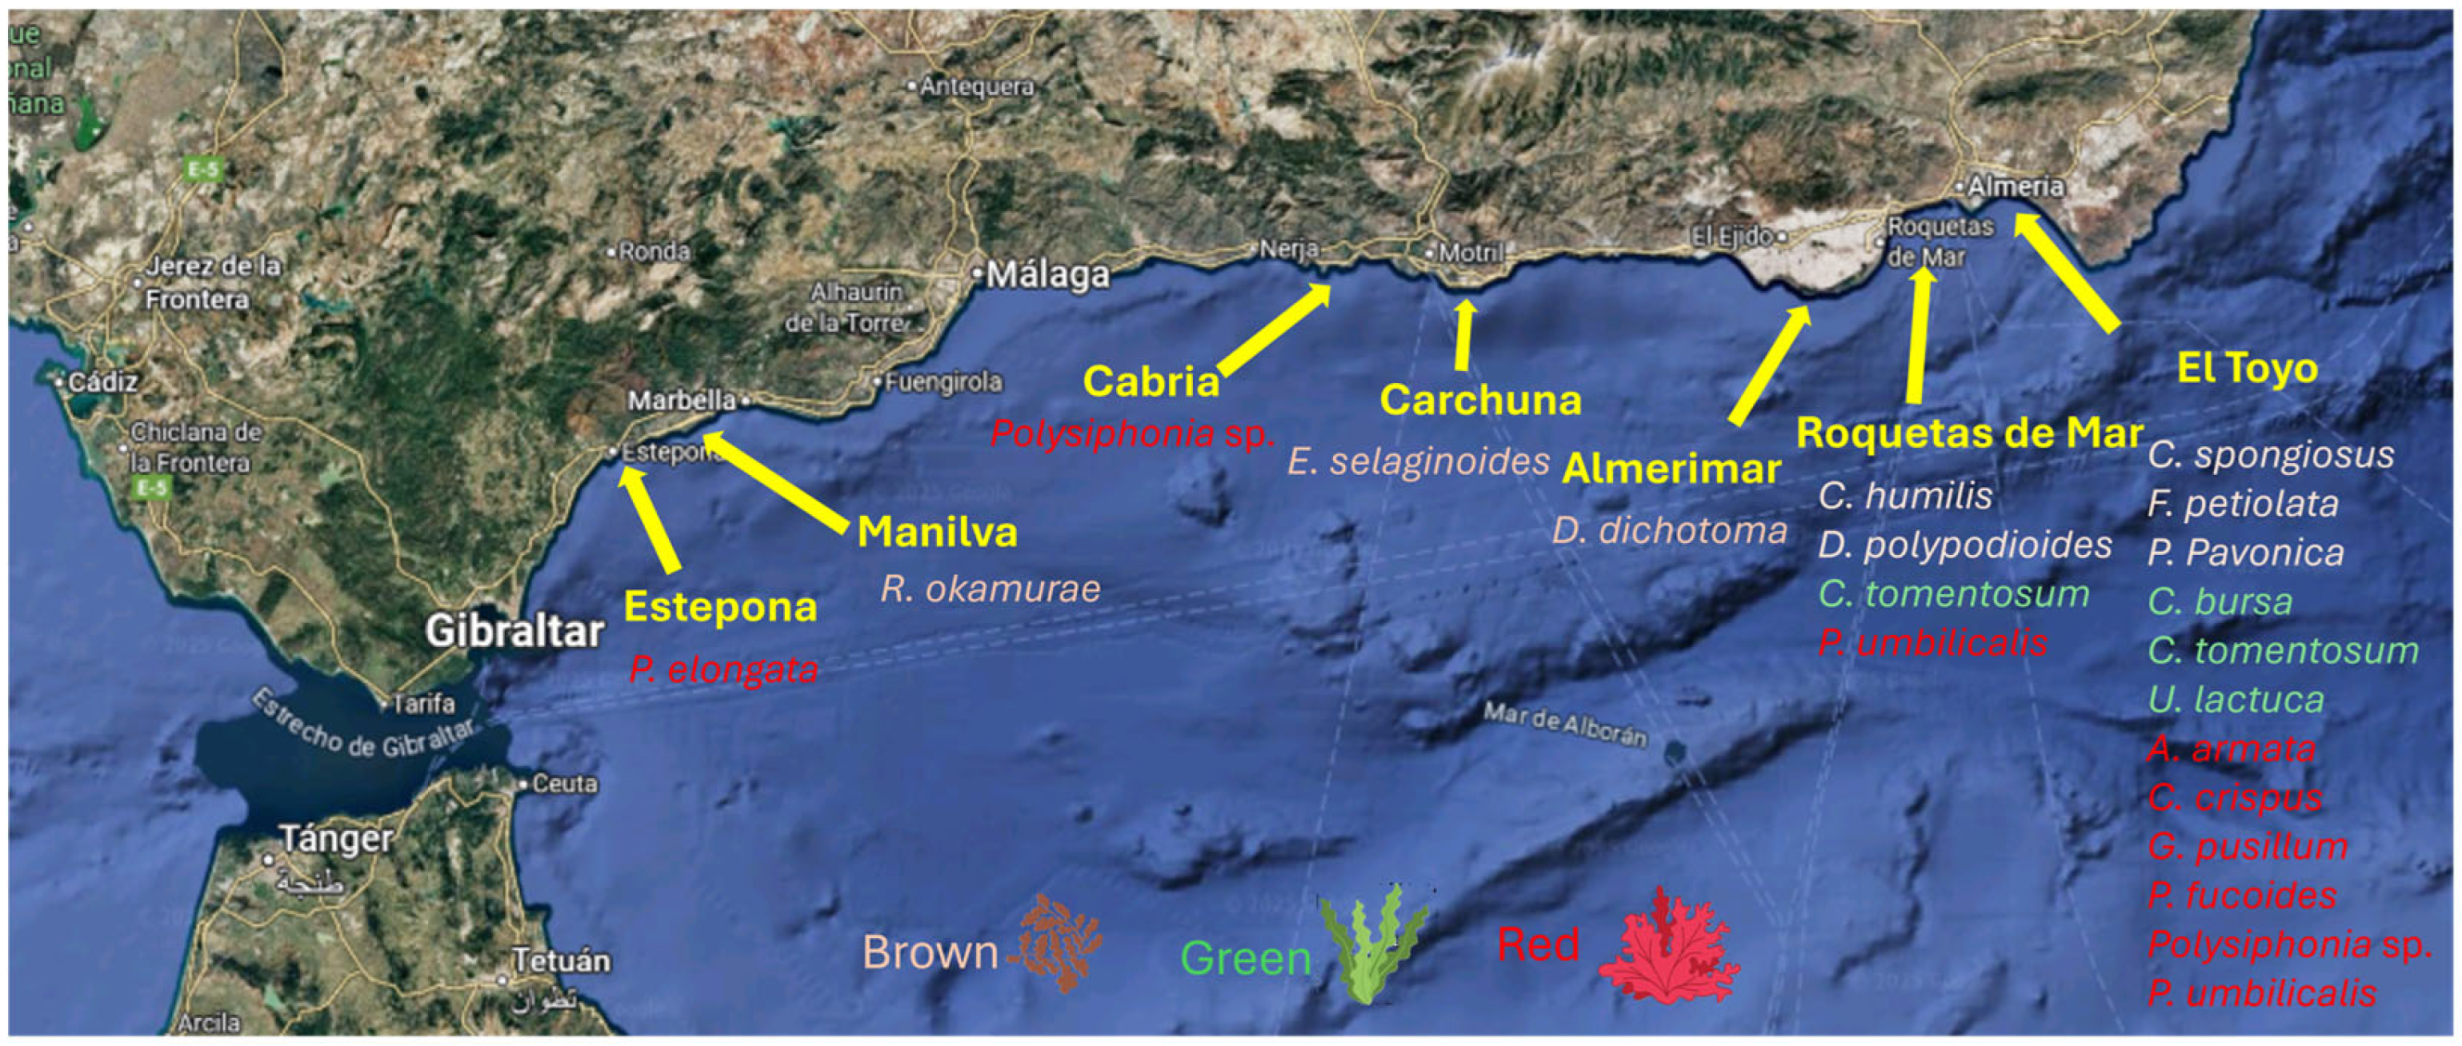
Figure 1. Geographic locations of Mediterranean macroalgae sampling sites along the southern coast of Spain (Andalusia), including the provinces of Almería, Granada, and Málaga. Sampling areas comprised Toyo Beach, Roquetas de Mar, Almerimar, Carchuna, Estepona, Manilva, and Cabria Beach.
Phycology 06 00037 g001
Figure 2. Biplot representing the first two principal components. Data points correspond to Brown (x), Green (x), and Red (x) samples. Codes as in Table 1.
Phycology 06 00037 g002
Figure 3. Normalized Seasonal Variation in Biochemical Composition and Antioxidant Capacity of Macroalgae from the El Toyo Site. The data represent the biochemical profile of representative macroalgae species collected at El Toyo, including Chlorophyta (C. bursa, C. tomentosum, F. petiolata, and U. lactuca), Ochrophyta (C. spongiosus and P. pavonica), and Rhodophyta (A. armata, C. crispus, G. pusillum, P. fucoides, Polysiphonia sp., and P. umbilicalis). Values are expressed as the percentage variation in the difference between warm months and cold months relative to the cumulative mean value of each specific algal group. Parameters analysed include moisture, total carotenoids, TPC, ABTS•+ radical scavenging activity, total FA, and FA profiles comprising SFA, MUFA, PUFA, and the n-6/n-3 ratio. Error bars indicate the standard deviation of the calculated seasonal deviations across the sampled taxa. Asterisks (*) denote statistically significant seasonal shifts (p < 0.05) determined by a comparison of sampling periods within each taxonomic group.
Phycology 06 00037 g003
Table 1. Summary of Mediterranean seaweed species collected along the southern Spanish coast, showing their taxonomic groups, collection sites, provinces, sampling dates, habitats, and moisture contents. Sampling coordinates ranged from 36.32–36.84° N and −5.24 to −2.33° W.
Seaweed SpeciesCodeDate of CollectionLocationGeographical Coordinates
Brown Seaweeds
Cladostephus spongiosusCS121 January 2024Toyo Beach, Almería36.835711, −2.326845
Cladostephus spongiosusCS212 August 2024Toyo Beach, Almería36.835711, −2.326845
Cystoseira humilisCH19 May 2022Roquetas de Mar, Almería36.712321, −2.635997
Cystoseira humilisCH22 October 22Roquetas de Mar, Almería36.712321, −2.635997
Dictyota dichotomaDD11 March 2023Almerimar, Almería36.705501, −2.811383
Dictyota dichotomaDD21 July 2023Almerimar, Almería36.705501, −2.811383
Ericaria selaginoidesES13 March 2022Carchuna, Granada36.695148, −3.440386
Ericaria selaginoidesES29 September 2022Carchuna, Granada36.695148, −3.440386
Padina pavonicaPP18 May 2024Toyo Beach, Almería36.835711, −2.326845
Rugulopteryx okamuraeRO112 April 2023Manilva, Málaga36.318979, −5.244384
Rugulopteryx okamuraeRO212 August 2023Manilva, Málaga36.318979, −5.244384
Green Seaweeds
Codium bursaCB121 January 2024Toyo Beach, Almería36.835711, −2.326845
Codium bursaCB218 May 2024Toyo Beach, Almería36.835711, −2.326845
Codium tomentosumCT120 January 2024Toyo Beach, Almería36.835711, −2.326845
Codium tomentosumCT22 November 2022Roquetas de Mar, Almería36.712321, −2.635997
Flabellia petiolataFP120 January 2024Toyo Beach, Almería36.835711, −2.326845
Flabellia petiolataFP21 July 2024Toyo Beach, Almería36.835711, −2.326845
Ulva lactucaUL11 February 2024Toyo Beach, Almería36.835711, −2.326845
Ulva lactucaUL21 July 2024Toyo Beach, Almería36.835711, −2.326845
Red Seaweeds
Asparagopsis armataAA28 November 2022Toyo Beach, Almería36.835711, −2.326845
Chondrus crispusCC2 January 2024Toyo Beach, Almería36.835711, −2.326845
Gelidium pusillumGP21 April 2024Toyo Beach, Almería36.835711, −2.326845
Polysiphonia elongataPE22 November 2022Estepona, Málaga36.415978, −5.173438
Polysiphonia fucoidesPF20 January 2024Toyo Beach, Almería36.835711, −2.326845
Polysiphonia sp.PS120 January 2024Toyo Beach, Almería36.835711, −2.326845
Polysiphonia sp.PS222 January 2023Toyo Beach, Almería36.835711, −2.326845
Polysiphonia sp.PS329 September 2022Toyo Beach, Almería36.835711, −2.326845
Polysiphonia sp.PS46 November 2022Cabria Beach, Granada36.746683, −3.657804
Porphyra umbilicalisPU120 January 2024Toyo Beach, Almería36.835711, −2.326845
Porphyra umbilicalisPU223 February 2023Toyo Beach, Almería36.835711, −2.326845
Porphyra umbilicalisPU32 November 2022Roquetas de Mar, Almería36.712321, −2.635997
Table 2. Moisture content, total carotenoids, total phenolic content (TPC), total flavonoid content (TFC), and antioxidant activity (ABTS•+ and DPPH assays) of Mediterranean macroalgae. Values are expressed as mean ± SD (n = 3) A, B, C.
Antioxidant Activity
Macroalgal Species (Code)Moisture %Total Carotenoids mg 100 g−1 fwTPC
mg GAE 100 g−1 fw
TFC
mg QE 100 g−1 fw
DPPH mmol TE 100 g−1 dwABTS•+ mmol TE 100 g−1 dw
Brown
C. spongiosus CS186.2 ± 1.3 b16.9 ± 0.3 d138.8 ± 21.6 b67.2 ± 11.4 cd2.4 ± 0.2 ef3.2 ± 0.2 c
C. spongiosus CS186.8 ± 1.1 b17.5 ± 0.3 dl75.1 ± 20.3 bc80.4 ± 13.4 c5.5 ± 0.4 ef3.7 ± 0.3 a
C. humilis CH169.3 ± 1.5 gh39.3 ± 4.8 b149.3 ± 4.2 bc89.3 ± 7.2 c2.3 ± 0.1 ef1.8 ± 0.1 f
C. humilis CH275.4 ± 2.1 ef43.3 ± 4.0 b291.5 ± 4.0 a151.7 ± 5.3 a3.9 ± 0.2 b3.2 ± 0.2 b
D. dichotoma DD186.9 ± 0.2 b42.6 ± 2.9 b173.4 ± 13.2 b123.4 ± 8.2 b2.5 ± 0.2 e3.8 ± 0.2 a
D. dichotoma DD287.2 ± 0.3 b45.1 ± 2.0 b223.3 ± 11.5 a149.2 ± 6.5 a5.3 ± 0.2 q3.9 ± 0.3 a
E. selaginoides ES177.4 ± 0.2 cde4.3 ± 0.8 f163.5 ± 10.5 b150.5 ± 3.0 a2.4 ± 0.1 c2.8 ± 0.2 c
E. selaginoides ES278.3 ± 0.3 cde4.5 ± 0.8 f246.3 ± 14.7 a150.9 ± 3.3 a3.5 ± 0.0 c3.0 ± 0.0 c
P. pavonica PP78.6 ± 1.7 cd2.5 ± 0.7 fg133.8 ± 25.7 c65.0 ± 13.2 cd1.5 ± 0.0 h1.5 ± 0.0 g
R. okamurae RO187.1 ± 0.1 b49.6 ± 0.7 a145.3 ± 10.2 bc77.7 ± 15.1 c5.2 ± 0.1 a3.3 ± 0.1 b
R. okamurae RO287.9 ± 0.1 b47.1 ± 0.5 a205.2 ± 9.2 a147.3 ± 10.8 a5.4 ± 0.1 a3.7 ± 0.1 a
Green
C. bursa CB191.9 ± 0.1 a4.8 ± 0.4 f29.7 ± 2.4 g17.0 ± 4.0 hi0.5 ± 0.1 i0.8 ± 0.1 jk
C. bursa CB290.5 ± 0.1 a6.8 ± 0.4 ef38.7 ± 3.5 ef26.3 ± 4.0 gh0.7 ± 0.2 i0.9 ± 0.1 ij
C. tomentosum CT175.9 ± 0.5 ef2.6 ± 0.3 fg29.3 ± 20.7 g18.3 ± 1.2 hi2.3 ± 0.1 ef1.0 ± 0.1 ij
C. tomentosum CT276.0 ± 0.3 ef2.9 ± 0.2 fg45.3 ± 9.6 ef33.1 ± 11.6 f3.7 ± 0.3 b1.3 ± 0.1 hi
F. petiolata FP166.7 ± 1.1 hij32.7 ± 1.6 c28.0 ± 9.8 g14.9 ± 9.2 i0.1 ± 0.0 j0.6 ± 0.1 jk
F. petiolata FP269.5 ± 1.1 gh31.8 ± 1.3 c47.1 ± 5.0 e27.6 ± 6.8 fg0.7 ± 0.1 i0.7 ± 0.2 jk
U. lactuca UL185.3 ± 1.5 b0.3 ± 0.4 g27.8 ± 0.2 g16.6 ± 3.2 hi0.3 ± 0.0 ij1.2 ± 0.0 hi
U. lactuca UL286.5 ± 1.5 b2.6 ± 0.3 fg33.8 ± 4.1 gh18.4 ± 3.2 hi2.0 ± 0.1 ef1.6 ± 0.2 g
Red
A. armata AA80.3 ± 0.6 c16.0 ± 2.7 d76.9 ± 11.9 d54.3 ± 5.0 d3.8 ± 0.2 b3.2 ± 0.1 b
C. crispus CC81.5 ± 0.6 c18.9 ± 0.3 d36.9 ± 4.3 fg25.9 ± 1.9 gh0.9 ± 0.2 i1.3 ± 0.2 hi
G. pusillum GP78.2 ± 0.9 c33.1 ± 2.0 c73.7 ± 4.1 d48.7 ± 5.0 de4.9 ± 0.3 a3.6 ± 0.2 a
P. elongata PE64.4 ± 2.8 j21.2 ± 4.9 d68.8 ± 17.6 d41.6 ± 12.2 e3.1 ± 0.1 d1.4 ± 0.0 gh
P. fucoides PF77.3 ± 0.0 def0.7 ± 0.6 g61.5 ± 4.2 d25.4 ± 3.3 gh1.8 ± 0.0 g1.4 ± 0.0 gh
Polysiphonia sp. PS169.4 ± 0.7 g17.5 ± 0.3 d62.1 ± 3.1 d50.0 ± 7.5 d0.3 ± 0.0 j0.5 ± 0.1 k
Polysiphonia sp. PS270.5 ± 0.1 gh4.3 ± 0.8 f72.3 ± 18.7 d52.8 ± 12.8 d3.3 ± 0.2 c0.7 ± 0.1 jk
Polysiphonia sp. PS365.5 ± 0.4 ij7.2 ± 0.4 e33.1 ± 10.4 fg17.8 ± 3.9 hi0.1 ± 0.0 j0.9 ± 0.1 ij
Polysiphonia sp. PS466.2 ± 0.4 ij8.3 ± 0.4 e34.5 ± 10.4 fg17.8 ± 3.9 hi0.1 ± 0.0 j0.6 ± 0.2 jk
P. umbilicalis PU167.1 ± 2.8 ghi2.3 ± 0.2 fg38.6 ± 2.7 f20.0 ± 10.1 hi0.1 ± 0.0 j0.2 ± 0.2 k
P. umbilicalis PU267.9 ± 2.1 gh2.5 ± 0.1 fg39.9 ± 2.9 f19.5 ± 8.3 hi0.2 ± 0.0 j0.2 ± 0.1 k
P. umbilicalis PU367.4 ± 2.0 ghi2.6 ± 0.1 fg37.4 ± 1.9 fg21.0 ± 6.6 hi0.3 ± 0.0 j0.3 ± 0.1 k
A Data represent mean ± S.D. of samples analysed in triplicate; B Differences in moisture content, total carotenoids, total phenolic content, total flavonoid content, and antioxidant activity amounts were tested according to one-way ANOVA followed by Duncan’s test; C In a column, means followed by different letters are significantly different at p < 0.05.
Table 3. Fatty acid composition of Mediterranean Brown macroalgae, expressed as percentage of total fatty acids (% of total FA) A, B, C.
Fatty AcidsC. spongiosus
CS1
C. spongiosus
CS2
C. humilis
CH1
C. humilis
CH2
D. dichotoma
DD1
D. dichotoma
DD2
E. selaginoides
ES1
E. selaginoides
ES2
P. pavonica
PP
R. okamurae
RO1
R. okamurae
RO2
Brown Macroalgae
FA g 100 g−1 dw0.8 ± 0.1 ghi1.1 ± 0.1 efghi2.6 ± 0.2 bc2.9 ± 0.2 bc5.6 ± 0.9 a5.9 ± 0.9 a2.5 ± 0.8 bc3.0 ± 0.2 bc2.5 ± 0.8 bc5.8 ± 0.3 a6.0 ± 0.3 a
∑ SFA50.0 ± 0.0 de58.3 ± 0.5 b64.6 ± 0.6 a70.8 ± 3.1 a48.9 ± 0.5 de56.3 ± 0.7 b44.8 ± 1.1 fg52.4 ± 1.1 cde50.4 ± 0.7 cde53.4 ± 0.9 c57.2 ± 0.3 b
8:0<LOQ<LOQ<LOQ<LOQ<LOQ<LOQ<LOQ<LOQ1.6 ± 0.5 b2.4 ± 0.2 a2.6 ± 0.1 a
11:0<LOQ<LOQ<LOQ<LOQ<LOQ<LOQ<LOQ<LOQ<LOQ<LOQ<LOQ
12:0<LOQ<LOQ<LOQ<LOQ<LOQ<LOQ<LOQ<LOQ<LOQ2.1 ± 0.2 c2.0 ± 0.3 c
13:01.2 ± 0.2 defg1.2 ± 0.2 defg1.2 ± 0.1 defg0.8 ± 0.1 i<LOQ<LOQ0.6 ± 0.1 i0.7 ± 0.1 i<LOQ2.9 ± 0.2 a2.4 ± 0.2 ab
14:06.4 ± 0.2 def6.8 ± 0.2 def7.4 ± 1.0 cde7.9 ± 0.1 cde4.0 ± 0.7 ijk5.3 ± 0.3 ghi5.0 ± 0.1 ghi6.1 ± 0.3 def7.5 ± 0.5 cde9.3 ± 1.1 ab8.7 ± 0.3 bc
15:0<LOQ<LOQ<LOQ<LOQ<LOQ<LOQ<LOQ<LOQ<LOQ1.7 ± 0.1 cd1.2 ± 0.3 d
16:0 (PA)31.2 ± 2.1 ef38.2 ± 0.7 cd40.2 ± 0.7 cd45.0 ± 0.1 a39.4 ± 0.7 cd45.4 ± 0.3 a30.5 ± 1.2 efg37.5 ± 0.7 cd21.5 ± 0.3 k23.2 ± 1.5 ij25.7 ± 0.5 hi
17:00.6 ± 0.1 ijk0.6 ± 0.2 ijk2.1 ± 0.3 defg3.5 ± 0.1 bc<LOQ<LOQ0.7 ± 0.0 ijk0.3 ± 0.2 jk3.8 ± 0.2 bc1.3 ± 0.1 ghi0.9 ± 0.2 ij
18:0 (SA)5.0 ± 0.1 ab5.6 ± 0.1 ab1.7 ± 0.2 bcd1.9 ± 0.1 bcd<LOQ<LOQ0.4 ± 0.0 efg0.4 ± 0.1 efg1.2 ± 0.0 def5.2 ± 0.4 a6.9 ± 0.4 a
20:04.6 ± 1.7 ef4.8 ± 1.0 ef10.2 ± 0.6 b11.7 ± 0.6 b5.5 ± 0.0 de5.6 ± 0.2 de3.0 ± 0.0 gh2.5 ± 0.1 h13.5 ± 0.1 a4.0 ± 0.3 fg5.3 ± 0.3 de
21:0<LOQ<LOQ1.7 ± 0.1 b<LOQ<LOQ<LOQ4.0 ± 0.7 a3.8 ± 0.5 a1.4 ± 0.3 b<LOQ<LOQ
22:01.0 ± 0.0 ab0.7 ± 0.0 ab<LOQ<LOQ<LOQ<LOQ0.5 ± 0.2 cd0.9 ± 0.1 ab<LOQ1.0 ± 0.1 ab1.3± 0.2 a
23:0<LOQ<LOQ<LOQ<LOQ<LOQ<LOQ0.2 ± 0.2 a0.2 ± 0.1 a<LOQ0.1 ± 0.0 a0.2 ± 0.1 a
24:0<LOQ<LOQ<LOQ<LOQ<LOQ<LOQ<LOQ<LOQ<LOQ<LOQ<LOQ
∑ MUFA20.0 ± 0.1 de16.0 ± 0.1 f20.6 ± 0.8 de21.3± 0.6 de11.7 ± 0.7 hi12.2 ± 0.3 h12.6 ± 0.2 h13.0 ± 0.2 h18.7 ± 0.7 ef30.4 ± 0.9 a31.3 ± 0.8 a
14:1n-5<LOQ<LOQ<LOQ<LOQ<LOQ<LOQ<LOQ<LOQ<LOQ1.4 ± 0.1 c1.6 ± 0.2 c
15:1n-5<LOQ<LOQ0.6 ± 0.0 c<LOQ<LOQ<LOQ0.4 ± 0.0 c0.5 ± 0.1 c<LOQ5.0 ± 0.3 a4.8 ± 0.3 a
16:1n-77.4 ± 0.2 b7.1 ± 0.2 b0.7 ± 0.1 hi0.5 ± 0.1 i<LOQ<LOQ0.3 ± 0.0 ij0.4 ± 0.1 ij4.2 ± 0.0 ef4.6 ± 0.4 e4.3 ± 0.2 ef
18:1n-9 cis (OA)11.2 ± 0.4 f7.2 ± 0.2 hij16.7 ± 0.6 b17.7 ± 0.6 b6.8 ± 0.7 hij7.1 ± 0.7 hij6.5 ± 0.6 ij7.0 ± 0.2 hij14.5 ± 0.7 cd18.1 ± 0.7 ab19.9 ± 0.9 a
18:1n-7<LOQ<LOQ<LOQ<LOQ<LOQ<LOQ0.1 ± 0.1 f0.2 ± 0.1 f<LOQ<LOQ<LOQ
20:1n-91.4 ± 0.0 d1.2 ± 0.1 d2.6 ± 0.4 c3.1 ± 0.3 b4.8 ± 0.0 b5.1 ± 0.2 a5.3 ± 0.9 a4.9 ± 0.1 b<LOQ1.4 ± 0.1 d0.7 ± 0.3 e
24:1n-9<LOQ<LOQ<LOQ<LOQ<LOQ<LOQ<LOQ<LOQ<LOQ<LOQ<LOQ
∑ PUFA29.9 ± 0.1 ij25.3 ± 0.1 j14.8 ± 1.5 L9.7 ± 0.6 m39.4 ± 0.7 bcd29.9 ± 0.2 ij42.6 ± 1.0 ab36.8 ± 1.0 cdef30.9 ± 1.4 hij16.2 ± 0.0 L13.9 ± 0.7 lm
16:3n-30.8 ± 0.0 c0.4 ± 0.0 c1.9 ± 0.4 a1.4 ± 0.6 b<LOQ<LOQ0.8 ± 0.1 c0.7 ± 0.1 c<LOQ1.1 ± 0.1 b1.3 ± 0.2 b
18:2n-6 cis (LA)4.2 ± 0.1 j4.1 ± 0.1 j0.5 ± 0.2 L0.7 ± 0.2 L14.6 ± 0.0 c13.6 ± 0.3 d16.7 ± 0.6 b14.3 ± 0.4 c5.7 ± 0.2 hi6.7 ± 0.7 fgh4.1 ± 0.2 j
18:3n-6 (GLA)<LOQ<LOQ<LOQ<LOQ<LOQ<LOQ<LOQ<LOQ<LOQ<LOQ<LOQ
18:3 n-3 (ALA)6.5 ± 0.6 cd5.5 ± 0.1 defg1.3 ± 0.8 L1.1± 0.1 L5.9 ± 0.0 cdef4.9 ± 0.2 efg1.1 ± 0.2 L0.9 ± 0.2 L5.4 ± 0.0 defg1.7 ± 0.1 L2.1 ± 0.3 L
20:2n-60.7 ± 0.1 de0.5 ± 0.0 ef<LOQ<LOQ<LOQ<LOQ0.8 ± 0.2 de0.7 ± 0.2 de<LOQ0.5 ± 0.0 ef0.9 ± 0.1 de
20:3n-6<LOQ<LOQ<LOQ<LOQ<LOQ<LOQ<LOQ<LOQ<LOQ<LOQ<LOQ
20:4 n-6 (ARA)9.2 ± 0.3 def8.2 ± 0.0 f8.1 ± 0.0 f5.5 ± 0.1 gh10.8 ± 0.7 cde6.3 ± 0.7 g17.1 ± 1.3 a14.9 ± 0.5 b10.5 ± 0.9 cde4.0 ± 0.3 hi3.8 ± 0.4 hi
20:4n-3<LOQ<LOQ<LOQ<LOQ<LOQ<LOQ1.2 ± 0.1 c1.0 ± 0.2 c2.4 ± 0.2 a<LOQ<LOQ
20:5n-3 (EPA)7.4 ± 0.2 hi5.4 ± 0.4 j2.8 ± 0.2 L0.6 ± 0.1 m8.1 ± 0.0 gh5.1 ± 0.72 jk4.8 ± 0.4 k4.3 ± 0.2 k6.2 ± 0.2 j1.8 ± 0.1 L1.5 ± 0.3 L
22:6n-3 (DHA)1.1 ± 0.1 def1.0 ± 0.1 def0.3 ± 0.2 gh0.4 ± 0.1 gh<LOQ<LOQ<LOQ<LOQ0.6 ± 0.0 efgh0.5 ± 0.0 fgh0.2 ± 0.0 gh
n-614.1 ± 0.3 lm12.9 ± 0.1 no8.6 ± 0.2 op6.2 ± 0.2 q25.4 ± 0.7 cde19.9 ± 0.3 ghi34.7 ± 0.9 a29.9 ± 0.7 b16.3 ± 1.0 jkl11.2 ± 0.4 no8.8 ± 0.2 op
n-315.9 ± 0.2 cde12.4 ± 0.4 efgh6.2 ± 1.7 kL3.5 ± 0.2 m14.0 ± 0.0 efgh10.0 ± 0.2 j7.9 ± 0.0 k6.9 ± 0.2 k14.6 ± 0.4 defg5.0 ± 0.4 L5.1 ± 0.3 L
n-6/n-30.9 ± 0.0 ij1.0 ± 0.0 ij1.4 ± 0.4 cdefgh1.8 ± 0.1 bc1.8 ± 0.0 bc2.0 ± 0.1 bc4.4 ±0.1 a4.3 ± 0.6 a1.1 ± 0.0 ghi2.2 ± 0.2 b1.7 ± 0.2 bc
A Data represent mean ± S.D. of samples analysed in triplicate; B Differences in FA amounts were tested according to one-way ANOVA followed by Duncan’s test; C In a row, means followed by different letters are significantly different at p < 0.05; LOQ: limit of quantification. Abbreviations: PA—palmitic acid, SA—stearic acid, OA—oleic acid, LA—linoleic acid, ALA—α-linolenic acid, ARA—arachidonic acid, EPA—eicosapentaenoic acid, DHA—docosahexaenoic acid.
Table 4. Fatty acid composition of Mediterranean Green macroalgae, expressed as percentage of total fatty acids (% of total FA) A, B, C.
Fatty AcidsC. bursa CB1C. bursa CB2C. tomentosum CT1C. tomentosum CT2F. petiolata FP1F. petiolata FP2U. lactuca UL1U. lactuca UL2
Green Macroalgae
FA g/100 g dw1.9 ± 0.4 cdef2.5 ± 0.1 bc1.1 ± 0.2 efghi2.4 ± 0.1 bc3.2 ± 0.3 b5.4 ± 0.4 a1.9 ± 0.2 cdef2.3 ± 0.1 bc
∑ SFA59.0 ± 0.9 b69.1 ± 3.1 a51.6 ± 0.7 cde60.3 ± 1.8 b41.6 ± 0.1 ghi51.0 ± 0.2 cde37.2 ± 0.5 j47.3 ± 0.7 cde
11:02.3 ± 0.2 b2.6 ± 0.3 b1.5 ± 0.2 c<LOQ1.1 ± 0.2 d1.5 ± 0.2 c<LOQ<LOQ
12:03.9 ± 0.2 a4.1 ± 0.3 a<LOQ3.2 ± 0.5 b<LOQ<LOQ<LOQ<LOQ
13:01.8 ± 0.2 bc1.9 ± 0.3 bc1.9 ± 0.7 bc1.2 ± 0.1 de1.5 ± 0.0 cd2.2 ± 0.5 bc<LOQ<LOQ
14:03.5 ± 0.7 jk4.4 ± 0.3 hij6.03.8 ± 0.2 ijk4.2 ± 0.0 hij4.5 ± 0.5 hij1.4 ± 0.3 L5.9 ± 0.2 fg
15:01.7 ± 0.0 cd2.3 ± 0.3 fg2.0 ± 0.1 c<LOQ<LOQ<LOQ<LOQ<LOQ
16:0 (PA)28.9 ± 1.8 fgh33.1 ± 2.0 ef26.9 ± 0.1 gh38.3 ± 1.3 d29.4 ± 0.0 efgh33.3 ± 2.1 ef31.6 ± 2.4 ef37.0 ± 1.1 d
17:04.1 ± 0.1 ab4.2 ± 0.2 ab4.8 ± 0.1 a3.8 ± 0.6 b2.9 ± 0.0 bcd3.6 ± 0.6 b<LOQ<LOQ
18:0 (SA)2.8 ± 0.0 b3.3 ± 0.1 a1.9 ± 0.1 bcd1.2 ± 0.2 def<LOQ<LOQ<LOQ<LOQ
20:010.1 ± 0.1 b13.2 ± 0.3 a6.5 ± 0.8 d8.7 ± 0.7 c2.4 ± 0.1 h5.9 ± 0.2 a4.2 ± 2.1 efg4.4 ± 0.0 b
22:0<LOQ<LOQ<LOQ<LOQ<LOQ<LOQ<LOQ<LOQ
24:0<LOQ<LOQ<LOQ<LOQ<LOQ<LOQ<LOQ<LOQ
∑ MUFA11.3 ± 0.2 hi12.4 ± 0.2 h15.7 ± 0.9 g16.8 ± 0.1 fg23.9 ± 0.0 bc25.1 ± 0.6 b16.8 ± 1.6 fg22.1± 0.2 cd
14:1n-51.1 ± 0.0 cd1.3 ± 0.1 c1.7 ± 0.1 b<LOQ<LOQ<LOQ<LOQ<LOQ
15:1n-5<LOQ<LOQ1.4 ± 0.7 b<LOQ<LOQ<LOQ<LOQ<LOQ
16:1n-7<LOQ<LOQ<LOQ1.4 ± 0.2 g11.5 ± 0.0 a12.0 ± 0.2 a7.0 ± 0.1 c12.2 ± 0.2 a
18:1n-9 cis (OA)8.6 ± 0.4 h9.3 ± 0.2 gh10.7 ± 0.2 fg14.5 ± 1.2 cd12.4 ± 0.0 ef13.1 ± 0.7 de8.2 ± 0.1 hi7.9 ± 0.1 hi
18:1n-7<LOQ<LOQ<LOQ<LOQ<LOQ<LOQ<LOQ<LOQ
24:1n-91.6 ± 0.6 a1.8 ± 0.0 a<LOQ0.9 ± 0.2 b<LOQ<LOQ1.7 ± 0.0 a2.0
∑ PUFA29.7 ± 0.8 ij20.1 ± 0.5 k32.8 ± 0.7 ghi22.9 ± 0.2 k34.5 ± 0.0 fgh22.0 ± 0.3 k46.0 ± 0.7 a30.4 ± 0.7 hi
18:2n-6 cis (LA)9.7 ± 0.1 d5.6± 0.2 hi5.8 ± 0.2 hi8.3 ± 1.0 e16.7 ± 0.3 b10.5 ± 0.1 d18.1 ± 1.3 a16.1 ± 0.3 b
18:3n-61.1 ± 0.3 de<LOQ1.3 ± 0.1 cd<LOQ<LOQ<LOQ<LOQ<LOQ
18:3n-3 (ALA)9.2 ± 0.1 a7.2± 0.3 bc5.4 ± 0.3 defg6.5 ± 1.1 cd3.5 ± 0.0 jk3.3 ± 0.2 jk3.6 ± 0.7 ijk3.1± 0.0 k
20:2n-6<LOQ<LOQ<LOQ<LOQ<LOQ<LOQ<LOQ<LOQ
20:3n-6<LOQ<LOQ1.3 ± 0.1 bc<LOQ<LOQ<LOQ<LOQ<LOQ
20:4n-6 (ARA)6.1 ± 1.2 g4.3 ± 0.4 ghi9.0 ± 0.6 ef4.4 ± 0.4 ghi5.6 ± 0.1 gh4.2 ± 0.3 ghi11.1 ± 0.0 c5.8 ± 0.1 gh
20:4n-31.2 ± 0.0 c1.1 ± 0.1 c<LOQ1.8 ± 0.5 b<LOQ<LOQ<LOQ<LOQ
20:5n-3 (EPA)2.5 ± 0.1 L1.8 ± 0.2 L8.0 ± 0.4 gh1.9 ± 0.2 L6.7 ± 0.0 ij4.0 ± 0.2 k10.7 ± 0.6 bcd3.7 ± 0.2 k
22:6n-3 (DHA)<LOQ0.1 ± 0.1 gh1.8 ± 0.1 bcd<LOQ1.9 ± 0.0 bc<LOQ2.5 ± 0.6 b1.7 ± 0.1 bcd
∑ n-616.9 ± 0.8 jk9.9 ± 0.4 no17.5 ± 0.9 ijk12.7 ± 0.6 mn22.3 ± 0.1 fg14.7 ± 1.0 klm29.2 ± 1.3 b21.9 ± 0.1 fg
∑ n-312.8 ± 0.0 ghi10.2 ± 0.8 j15.3 ± 0.2 cdef10.2 ± 0.8 j12.1 ± 0.6 hij7.3 ± 0.1 k16.8 ± 0.8 c8.5 ± 0.0 jk
n-6/n-31.3 ± 0.1 defghi1.0 ± 0.1 fghi1.1 ± 0.1 fghi1.3± 0.0 efghi1.8 ± 0.1 bcd2.0 ± 0.1 bcd1.7± 0.2 cde2.6 ± 0.2 b
A Data represent mean ± S.D. of samples analysed in triplicate; B Differences in FA amounts were tested according to one-way ANOVA followed by Duncan’s test; C In a row, means followed by different letters are significantly different at p < 0.05; LOQ: limit of quantification. Abbreviations: PA—palmitic acid, SA—stearic acid, OA—oleic acid, LA—linoleic acid, ALA—α-linolenic acid, ARA—arachidonic acid, EPA—eicosapentaenoic acid, DHA—docosahexaenoic acid.
Table 5. Fatty acid composition of Mediterranean Red macroalgae, expressed as percentage of total fatty acids (% of total FA) A, B, C.
Fatty AcidsA. armata
AA
C. crispus
CC
G. pusillum
GP
P. elongata
PE
P. fucoides
PF
Polysiphonia sp. PS1Polysiphonia sp. PS2Polysiphonia sp. PS3Polysiphonia sp. PS4P. umbilicalis PU1P. umbilicalis PU2P. umbilicalis PU3
Red Macroalgae
FA g 100 g−1 dw2.3 ± 0.8 bcd2.3 ± 0.8 bcd1.4 ± 0.3 defg0.3 ± 0.0 i0.7 ± 0.1 ghi1.3 ± 0.5 efgh0.9 ± 0.0 ghi3.2 ± 1.1 b0.6 ± 0.0 ghi2.6 ± 0.1 bc0.5 ± 0.0hi0.4 ± 0.0hi
∑ SFA58.7 ± 0.3 b40.0 ±1.6 hij58.9 ± 1.6 b65.2 ± 1.1 a49.7 ± 1.0 cde43.2 ± 3.1 gh51.5 ± 0.3 cde51.9 ± 2.0 cde39.2 ± 5.8 ij58.7 ± 2.2 b48.1 ± 3.8 ef52.6 ± 0.7 cde
11:0<LOQ<LOQ2.5 ± 0.0 a<LOQ1.5 ± 0.3 c0.8 ± 0.0 e<LOQ<LOQ1.1 ± 0.3 de<LOQ<LOQ<LOQ
12:0<LOQ1.5 ± 0.6 d0.7 ± 0.0 e<LOQ0.7 ± 0.1 e<LOQ<LOQ<LOQ<LOQ<LOQ<LOQ<LOQ
13:00.7 ± 0.3 hi<LOQ1.0 ± 0.0 efghi0.8 ± 0.0 fghi1.1 ± 0.3 defgh0.7 ± 0.0 hi0.9 ± 0.1 efghi1.2 ± 0.3 def1.1 ± 0.3 efgh0.6 ± 0.2 i0.8 ± 0.1 ghi2.1 ± 0.2 b
14:010.5 ± 1.2 a2.7 ± 0.5 kL7.6 ± 0.7 cd8.7 ± 0.9 bc6.5 ± 0.5 def6.4 ± 0.2 defg8.6 ± 0.2 bc8.7 ± 0.3 bc5.5 ± 1.4 fgh6.2 ± 0.9 efg4.5 ± 0.5 hij8.1 ± 0.5 bc
15:0<LOQ2.5 ± 0.7 b<LOQ2.6 ± 0.8 b1.3 ± 0.3 d4.2 ± 0.1 a<LOQ0.3 ± 0.1 ef0.5 ± 0.1 e<LOQ<LOQ<LOQ
16:0 (PA)44.4 ± 1.8 ab22.3 ± 1.8 k42.3 ± 1.1 bc47.1 ± 1.7 a32.7 ± 1.5 e26.0 ± 3.5 hi39.3 ± 0.3 cd39.3 ± 2.9 cd29.6 ± 3.7 efg47.9 ± 0.6 a37.8 ± 1.8 d37.3 ± 1.2 d
17:02.0 ± 1.1 efgh3.5 ± 0.1 bcd1.4 ± 0.0 fghi2.7 ± 0.4 cde1.1 ± 0.7 ij2.3 ± 0.1 def1.2 ± 0.0 hij0.4 ± 0.0 jk1.1 ± 0.0 ij2.5 ± 0.4 de2.4 ± 0.9 de2.9 ± 0.7 bcd
18:0 (SA)0.7 ± 0.2 defg5.0 ± 1.6 a2.5 ± 0.0 bc1.8 ± 0.8 bcd4.9 ± 1.4 a1.8 ± 0.0 bcd1.3 ± 0.0 def1.5 ± 0.7 cde0.2 ± 0.1 fg0.5 ± 0.4 efg1.8 ± 0.6 bcd1.3 ± 1.0 def
20:0<LOQ2.0 ± 0.0 hi0.9 ± 0.0 ij<LOQ<LOQ<LOQ<LOQ<LOQ<LOQ<LOQ<LOQ<LOQ
22:00.4 ± 0.2 d<LOQ<LOQ1.4 ± 0.8 a<LOQ<LOQ0.3 ± 0.1 de0.5 ± 0.2 cd0.2 ± 0.0 de1.0 ± 0.0 ab0.9 ± 0.2 bc0.9 ± 0.1 b
24:0<LOQ0.5 ± 0.3 b<LOQ<LOQ<LOQ1.0 ± 0.0 a<LOQ<LOQ<LOQ<LOQ<LOQ<LOQ
∑ MUFA5.1 ± 2.7 k25.0 ± 0.4 b19.9 ± 1.7 de7.4 ± 1.3 k12.5 ± 0.7 h21.8 ± 2.6 cd9.7 ± 1.4 ij11.4 ± 0.6 hi18.4± 1.5 ef6.1 ± 0.3 k7.0 ± 0.4 k7.4 ± 0.6 jk
14:1n-50.7 ± 0.4 efg<LOQ0.8 ± 0.0 def1.1 ± 0.2 cd0.6 ± 0.3 fg<LOQ0.4 ± 0.1 g0.7 ± 0.4 efg<LOQ0.8 ± 0.2 def1.0 ± 0.0 de2.8 ± 0.4 a
15:1n-5<LOQ<LOQ<LOQ<LOQ0.5 ± 0.3 c<LOQ<LOQ<LOQ<LOQ<LOQ<LOQ<LOQ
16:1n-70.6 ± 0.1 hi5.1 ± 0.1 d6.6 ± 0.8 c0.5 ± 0.0 i4.1 ± 0.0 f7.5 ± 0.2 b0.4 ± 0.1 ij0.4 ± 0.1 i0.3 ± 0.1 ij0.6 ± 0.2 hi0.9 ± 0.2 h0.6 ± 0.0 hi
18:1n-9 cis (OA)2.7 ± 2.0 k19.9 ± 0.4 a12.5 ± 0.9 def5.4 ± 1.1 j7.2 ± 0.7 hij14.4 ± 2.4 cde8.3 ± 1.3 hi8.8 ± 1.2 gh16.3 ± 1.1 bc3.3 ± 0.3 k2.7 ± 0.3 k2.4 ± 0.4 k
18:1n-71.0 ± 0.2 d<LOQ<LOQ0.4 ± 0.1 e<LOQ<LOQ0.7 ± 0.1 e1.5 ± 0.2 c1.7 ± 0.4 b1.4 ± 0.2 c2.4 ± 0.2 a1.6 ± 0.2 bc
24:1n-9<LOQ<LOQ<LOQ<LOQ<LOQ<LOQ<LOQ<LOQ<LOQ<LOQ<LOQ<LOQ
∑ PUFA36.2 ± 2.4 defg35.1 ± 1.2 fg21.1 ± 0.1 k27.5 ± 0.2 j37.8± 1.7 cdef35.0 ± 0.5 fg38.7 ± 1.0 cde36.6 ± 2.6 cdef42.4 ± 4.3 ab35.2 ± 2.5 efg44.9 ± 4.2 a40.0 ± 1.4 bc
18:2n-6 cis (LA)8.0 ± 0.8 ef6.7 ± 0.6 gh4.8 ± 0.1 ij1.7 ± 0.9 kL1.5 ± 0.0 L9.0 ± 0.5 de2.9 ± 0.2 k4.3 ± 0.2 j8.5 ± 0.5 de7.7 ± 0.6 efg8.5 ± 1.6 de6.0 ± 0.8 hi
18:3n-60.7 ± 0.2 ef<LOQ1.0 ± 0.0 de0.4 ± 0.0 f<LOQ1.6 ± 0.0 ab1.3 ± 0.2 cd0.5 ± 0.1 f1.4 ± 0.4 bcd1.5 ± 0.4 bc1.9 ± 0.1 a2.0 ± 0.4 a
18:3n-3 (ALA)5.5 ± 0.1 defg0.9 ± 0.0 L0.9 ± 0.0 L4.1 ± 1.0 hij4.7 ± 0.0 ghi3.0 ± 0.1 k7.7 ± 0.1 b5.0 ± 0.1 efgh5.5 ± 1.4 defg4.8 ± 0.6 fgh6.1 ± 1.0 cde7.0 ± 0.1 bc
20:2n-6<LOQ1.3 ± 0.0 d<LOQ<LOQ0.5 ± 0.1 ef3.2 ± 0.1 c<LOQ6.5 ± 0.9 b8.4 ± 1.2 a<LOQ<LOQ<LOQ
20:3n-60.6 ± 0.0 cde1.5 ± 0.0 b<LOQ3.6 ± 1.7 a0.4 ± 0.0 de1.0 ± 0.0 bcd0.9 ± 0.1 bcd<LOQ0.4 ± 0.0 de0.7 ± 0.0 cde0.9 ± 0.0 bcd0.9 ± 0.1 bcd
20:4n-6 (ARA)10.8 ± 1.5 cde14.6 ± 1.2 b2.0 ± 0.0 j9.7 ± 0.3 cdef10.9 ± 0.7 cd3.4 ± 0.1 ij13.9 ± 0.8 b11.2 ± 1.5 c8.1 ± 0.8 f10.9 ± 1.9 cd16.5 ± 0.8 a14.1 ± 0.7 b
20:4n-3<LOQ<LOQ<LOQ0.6 ± 0.1 de0.5 ± 0.3 ef0.9 ± 0.0 d0.3 ± 0.1 fg0.5 ± 0.0 ef0.4 ± 0.0 efg0.2 ± 0.0 gh<LOQ<LOQ
20:5n-3 (EPA)9.6 ± 0.6 def4.8 ± 1.5 k7.8 ± 0.7 h7.1 ± 0.6 hij18.9 ± 0.7 a11.6 ± 0.3 b11.5 ± 0.2 bc8.0 ± 0.1 h9.3 ± 0.0 ef9.2 ± 1.1 f10.4 ± 0.7 cde9.2 ± 0.3 f
22:6n-3 (DHA)0.9 ± 0.8 efg5.3 ± 1.4 a4.6 ± 0.5 a0.2 ± 0.1 gh0.5 ± 0.0 fgh1.3 ± 0.3 cde0.3 ± 0.1 gh0.6 ± 0.0 efgh0.5 ± 0.0 fgh0.2 ± 0.0 gh0.6 ± 0.0 efgh0.8 ± 0.3 efg
∑ n-620.2 ± 2.6 ghi24.0± 1.8 def7.8 ±0.1 p15.4 ± 0.4 klm13.2 ± 0.7 mn18.3 ±0.2 hij19.0 ± 0.9 hij22.5 ± 2.6 fg26.7 ± 2.9 bcd20.8 ± 0.8 gh27.8 ± 2.5 bc22.9 ± 1.9 efg
∑ n-316.0 ± 0.2 cd11.0 ± 2.9 ij13.3 ± 0.2 fgh12.0 ± 0.2 hij24.6 ± 1.0 a16.7 ± 0.7 c19.7 ± 0.1 b14.1 ± 0.0 defg15.7 ± 1.4 cde14.4 ± 1.7 defg17.1 ± 1.7 c17.1 ± 0.5 c
n-6/n-31.3 ± 0.2 efghi2.3 ± 0.8 b0.6 ± 0.0 j1.3 ± 0.1 efghi0.5 ± 0.0 j1.1 ± 0.1 ghi1.0 ± 0.0 hij1.6 ± 0.2 cdef1.7 ± 0.0 cde1.5 ± 0.1 cdefg1.6 ± 0.0 cdef1.3 ± 0.2 defghi
A Data represent mean ± S.D. of samples analysed in triplicate; B Differences in FA amounts were tested according to one-way ANOVA followed by Duncan’s test; C In a row, means followed by different letters are significantly different at p < 0.05; LOQ: limit of quantification. Abbreviations: PA—palmitic acid, SA—stearic acid, OA—oleic acid, LA—linoleic acid, ALA—α-linolenic acid, ARA—arachidonic acid, EPA—eicosapentaenoic acid, DHA—docosahexaenoic acid.
Table 6. Relative carotenoid composition of Mediterranean macroalgae determined by LC–MS, expressed as peak area percentage (% of total identified carotenoids) A, B, C.
Anteraxanthinα-Caroteneβ-Caroteneβ-CryptoxanthinDiadinoxanthinDiatoxanthinFucoxanthinFucoxanthinolLuteinNeoxanthinSiphonaxanthinViolaxanthinZeaxanthin
Brown
C. spongiosus CS11.1 ± 0.2 e-6.1 ± 0.4 ij-7.9 ± 0.7 d3.9 ± 0.6 ab50.9 ± 1.9 d-12.8 ± 1.2 c5.8 ± 0.7 b-6.1 ± 0.5 cd9.3 ± 0.7 g
C. spongiosus CS21.0 ± 0.3 e-9.1 ± 0.1 i-5.3 ± 0.4 ef3.1 ± 0.2 bc43.0 ± 0.9 e-15.7 ± 1.3 c3.6 ± 0.4 cd-4.0 ± 0.3 de15.4 ± 2.1 e
C. humilis CH12.3 ± 0.5 de4.9 ± 0.3 a7.6 ± 0.8 ij-15.9 ± 0.7 b-61.1 ± 1.6 b----8.9 ± 0.9 bc-
C. humilis CH23.9 ± 0.3 d3.0 ± 0.2 bc8.8 ± 0.5 i-11.4 ± 0.5 bc-55.3 ± 1.0 cd-5.3 ± 0.9 e--4.0 ± 0.4 de7.9 ± 0.6 g
D. dichotoma DD16.9 ± 0.3 c-6.2 ± 0.5 ij-7.1 ± 0.7 de3.5 ± 0.3 ab68.1 ± 2.1 a1.3 ± 0.3 ab-1.0 ± 0.2 d-4.4 ± 0.5 de1.3 ± 0.5 ij
D. dichotoma DD24.8 ± 0.1 cd-8.9 ± 0.4 i-3.1 ± 0.6 f0.9 ± 0.2 d66.0 ± 1.4 a3.0 ± 0.5 a-2.5 ± 0.6 d-3.3 ± 0.3 e8.0 ± 0.7 g
E. selaginoides CH10.8 ± 0.2 e-5.1 ± 0.7 ij-12.2 ± 0.6 bc1.5 ± 0.2 cd63.8 ± 2.4 ab0.5 ± 0.1 b---12.0 ± 0.9 a3.9 ± 0.4 hi
E. selaginoides CH22.0 ± 0.3 de-8.8 ± 0.91-10.1 ± 0.5 cd0.9 ± 0.2 d58.4 ± 1.8 bc0.9 ± 0.2 b---4.0 ± 0.2 de14.9 ± 0.8 e
P. pavonica PP1.0 ± 0.2 e-6.7 ± 0.5 ij-13.1 ± 0.4 bc3.7 ± 0.4 ab63.0 ± 1.0 ab----9.3 ± 1.0 b2.8 ± 0.5 i
R. okamurae RO12.9 ± 0.1 de-6.0 ± 0.4 ij-19.8 ± 1.1 a5.1 ± 0.2 a59.1 ± 1.8 bc----6.9 ± 0.9 cd0.6 ± 0.1 j
R. okamurae RO23.2 ± 0.3 d-4.0 ± 0.5 j-10.3 ± 0.6 cd3.2 ± 0.1 bc63.9 ± 1.1 ab----4.0 ± 0.2 de11.7 ± 0.7 fg
Green
C. bursa CB15.1± 0.3 c-27.9 ± 3.1 f-----42.8 ± 1.8 b8.1 ± 0.8 a9.7 ± 1.0 a4.9 ± 0.8 de1.5 ± 0.3 ij
C. bursa CB24.3 ± 0.3 cd-32.0 ± 0.2 ef-----40.2 ±1.6 b7.5 ± 0.8 ab5.4 ± 0.2 b1.9 ± 0.2 f9.4 ± 0.7 g
C. tomentosum CT13.9 ± 0.4 d-30.5 ± 1.9 ef3.8 ± 0.8 ab----40.3 ± 3.5 b6.1 ± 0.5 b8.6 ± 0.9 a4.5 ± 0.4 de3.0 ± 0.5 hi
C. tomentosum CT21.0 ± 0.1 e-38.9 ± 2.2 d5.9 ± 0.6 a----38.5 ± 3.2 b4.4 ± 0.2 c-2.0 ± 0.2 ef9.9 ± 0.8 g
F. petiolata FP11.3 ± 0.3 e0.9 ± 0.1 d27.1 ± 1.0 fg2.2 ± 0.3 bc----48.1 ± 3.0 a7.5 ± 1.0 ab-9.0 ± 0.3 bc4.0 ± 0.6 h
F. petiolata FP22.6 ± 0.3 de1.0 ± 0.2 cd29.3 ± 2.5 f0.4 ± 0.1 c----43.3 ± 3.3 ab6.5 ± 0.7 b-2.0 ± 0.4 ef14.9 ± 1.3 e
U. lactuca UL11.1 ± 0.2 e-24.1 ± 0.3 g0.8 ± 0.2 c----48.8 ± 2.2 a8.8 ± 0.9 a-13.4 ± 1.1 a2.8 ± 0.5 i
U. lactuca UL21.9 ± 0.4 e1.5 ± 0.3 cd19.8 ± 0.2 h0.9 ± 0.1 c----45.9 ± 1.9 a6.9 ± 0.6 b-6.2 ± 0.6 c16.7 ± 1.1 e
Red
A. armata AA7.8 ± 0.2 b3.6 ± 0.3 b39.1 ± 0.2 d1.0 ± 0.2 c----12.8 ± 2.9 c1.0 ± 0.2 d-5.0 ± 0.6 d29.0 ± 2.0 bc
C. crispus CC7.6 ± 0.3 bc3.8 ± 0.1 b44.0 ± 3.1 c-----11.4 ± 1.3 cd--7.8 ± 0.7 c26.1 ± 2.3 cd
G. pusillum GP6.0 ± 0.3 c2.0 ± 0.2 cd44.7 ± 1.6 c-----14.8 ± 1.4 c--3.9 ± 0.3 e28.7 ± 0.9 c
P. elongata PE7.9 ± 0.35 bc3.7 ± 0.4 b46.9 ± 1.8 bc0.8 ± 0.2 c----11.7 ± 2.0 c--4.9 ± 0.2 de24.1 ± 2.5 d
P. fucoides PF5.4 ± 0.3 c1.6 ± 0.2 c48.6 ± 2.1 b0.7 ± 0.1 c----7.9 ± 0.8 de--3.6 ± 0.2 e32.3 ± 2.1 ab
Polysiphonia sp. PS18.9 ± 0.3 b0.8 ± 0.1 d52.7 ± 1.6 ab2.8 ± 0.2 b----7.9 ± 0.6 dd--4.0 ± 0.5 de23.0 ± 2.5 d
Polysiphonia sp. PS26.8 ± 0.2 c0.3 ± 0.2 d56.0 ± 1.5 a2.1 ± 0.4 bc----8.3 ± 1.2 de--4.7 ± 0.3 de21.7 ± 2.3 d
Polysiphonia sp. PS311.5 ± 0.2 a0.9 ± 0.2 d47.1 ± 1.1 b0.5 ± 0.1 c----6.7 ± 1.0 de--3.9 ± 0.1 e29.4 ± 1.7 bc
Polysiphonia sp. PS47.0 ± 0.5 bc2.8 ± 0.2 c48.8 ± 1.9 b1.0 ± 0.2 c----11.8 ± 1.8 cd--3.1 ± 0.2 e25.6 ± 0.8 d
P. umbilicalis PU14.7 ± 0.3 cd1.8 ± 0.2 cd52.8 ± 1.3 a0.5 ± 0.1 c----8.8 ± 0.9 de--2.8 ± 0.2 ef28.8 ± 1.3 c
P. umbilicalis PU23.7± 0.2 d3.8 ± 0.4 b55.9 ± 1.2 a0.9 ± 0.1 c----7.3 ± 1.3 de--2.4 ± 0.1 ef26.2 ± 1.7 cd
P. umbilicalis PU36.7 ± 0.3 c1.3 ± 0.4 cd47.1 ± 2.0 b0.6 ± 0.2 c----8.1 ± 0.6 de--1.1 ± 0.2 f35.3 ± 1.9 a
A Data represent mean ± S.D. of samples analysed in triplicate; B Differences in carotenoid amounts were tested according to one-way ANOVA followed by Duncan’s test; C In a row, means followed by different letters are significantly different at p < 0.05; - means absent or below LOQ (limit of quantification).
Disclaimer/Publisher’s Note: The statements, opinions and data contained in all publications are solely those of the individual author(s) and contributor(s) and not of MDPI and/or the editor(s). MDPI and/or the editor(s) disclaim responsibility for any injury to people or property resulting from any ideas, methods, instructions or products referred to in the content.