Article

Growth, Productivity, and Size Structure of Spirulina Strain Under Different Salinity Levels: Implications for Cultivation Optimization

by
Imma Krissalina M. Lao
and
Brisneve Edullantes
*
Department of Biology and Environmental Science, College of Science, University of Philippines Cebu, Lahug, Cebu 6000, Philippines
*
Author to whom correspondence should be addressed.
Phycology 2025, 5(3), 31; https://doi.org/10.3390/phycology5030031
Submission received: 18 April 2025 / Revised: 29 May 2025 / Accepted: 25 June 2025 / Published: 2 July 2025

Abstract

Salinity serves as a critical environmental factor influencing the physiological and morphological characteristics of Spirulina, a filamentous cyanobacterium used for food production and commercial purposes. This study examined a Spirulina strain’s responses to different salinity levels (10–45 ppt) through three independent laboratory experiments that determined growth, productivity, and size structure. Growth across salinity treatments was assessed by monitoring optical density in 24-well microplates over 20 days and estimating specific growth rates using a logistic growth model. Primary productivity under different salinity and light conditions was measured using light and dark bottle experiments to calculate gross primary productivity (GPP) and to estimate photosynthetic efficiency through linear regression of GPP against light intensity. The size structure was assessed through tube-based experiments and image analysis, with organism sizes categorized and analyzed to identify salinity-induced patterns in filament structure. The study demonstrated that the Spirulina strain achieved its greatest growth at 10 ppt yet produced the highest photosynthetic efficiency between 27 and 45 ppt because it reallocated energy during salinity stress. The morphological analysis revealed that the Spirulina strain produced medium-sized filaments between 400 and 799 µm at elevated salinity levels, and our analysis confirmed substantial variations in size structure. The Spirulina strain demonstrates both physiological and morphological plasticity when exposed to salinity changes. The cultivation of the Spirulina strain at 27 ppt provides conditions that support moderate growth, enhanced productivity, and manageable morphological shifts while using its natural salinity tolerance to improve the efficiency and scalability of production for diverse biotechnological applications.

1. Introduction

Spirulina is a filamentous cyanobacterium and is among the most widely cultivated microalgae for its high nutritional value, resilience to environmental stress, and potential biotechnological applications [1]. Spirulina is often called the ‘super food’ due to the fact that it contains proteins, fatty acids, vitamins, pigments like phycocyanin and chlorophyll a, and many minerals [2,3]. In addition to the economic and dietary value of Spirulina, it also plays an ecological role as a primary producer in saline–alkaline aquatic ecosystems and contributes to the global carbon cycle and primary production [4,5].
Optimizing environmental conditions remains a key focus in Spirulina research, particularly for improving biomass yield and metabolite production [6,7]. Among the environmental variables, salinity is a critical factor that influences not only growth and photosynthesis but also morphological and biochemical traits [8]. Salt stress disturbs cellular homeostasis through the development of osmotic stress and ionic toxicity that impact metabolism and energy use [9].
In recent years, an increase in the salinization of freshwater and coastal systems has been observed due to climate change, sea-level rise, decreases in rainfall, and human activities like irrigation and industrial discharge [10]. This environmental shift is important to address how photosynthetic organisms like Spirulina will react to changing salt concentrations in their natural environment and in culture. Understanding these responses is essential for sustaining large-scale production in changing environments.
There are conflicting findings on the effect of salinity on the growth and production of Spirulina. For example, Rai and Rajashekhar [11] found that Spirulina major had higher chlorophyll a content at moderate salinities (9–16 ppt), but the highest salinities (≥25 ppt) caused a significant reduction in biomass. On the other hand, other studies have indicated that Spirulina is able to thrive in a broad range of salinities and can have enhanced photosynthetic rates under high salt concentrations [12]. However, much of the existing literature has focused narrowly on physiological parameters such as pigment concentration and nutrient uptake, with limited attention to morphological traits.
Spirulina has been observed to exhibit morphological flexibility in terms of filament length, arrangement, and coiling under stressors like temperature and light [13,14,15]. However, the influence of salinity on filament size structure remains poorly documented. Morphological characteristics can affect harvesting efficiency, settling behavior, and stress tolerance—factors that are highly relevant to scalable cultivation. A more integrated approach that considers both physiological and morphological responses is therefore essential to define optimal and resilient production strategies under variable salinity conditions.
In this context, the present study aimed to test the effects of different salinity levels on a Spirulina strain concerning three biological aspects: (1) growth, (2) productivity, and (3) filament size structure. We hypothesized that salinity alters not only the growth and physiological performance but also the morphological traits of Spirulina in ways that influence its suitability for large-scale cultivation. This study provides insights into how salinity stress may shape Spirulina’s functional responses and informs strategies for improving production under increasingly saline conditions.

2. Materials and Methods

2.1. Test Organism

In this study, a Spirulina strain, a filamentous cyanobacterium known for its high protein content and nutritional value, was used as a test organism for the experiments. The live Spirulina culture was obtained from a local cultivator who had sourced it from a commercial supplier in Switzerland. The strain was maintained in Zarrouk’s medium [16] at the University of the Philippines Cebu through repeated subculturing under non-axenic conditions but lacks formal molecular characterization (i.e., 16S rRNA sequencing) to verify its taxonomic identity. The study refers to this strain as an unverified Spirulina strain pending genotypic validation. Microscopic examination revealed that the strain has a loss of spiral structure in most filaments, with the majority being linear. Filament length ranges from 100–1000 µm, and filament width ranges from 6.5 to 8.2 µm. Helical parameters were not measured due to the absence of visible coiling.

2.2. Experimental Treatments

To test the effects of salinity on the growth, productivity, and size structure of Spirulina strain, the experiment was designed with eight different salinity treatments (i.e., 10, 17, 22, 27, 31, 36, 40, and 45 ppt). A digital salinometer was used to measure salinity levels before adding cultures to the medium. The selection of the salinity treatments was based on studies reporting the growth of Spirulina at salinity levels ranging from 10 to 45 ppt in indoor and outdoor cultivation settings [17].
Each treatment was prepared in 1 L glass containers filled with Zarrouk’s liquid medium adjusted to the target salinity. All media were autoclaved at 121 °C and 15 psi for 20 min and allowed to stabilize at pH 9.3 ± 0.3 before inoculation. The setup was housed in an improvised growth chamber maintained at room temperatures between 28 and 31 °C throughout the 20-day incubation period.
To ensure acclimation to the laboratory conditions, the stock culture was kept for about 14 days before the experiment. It was kept in an improvised growth chamber under a light–dark cycle of 12:12 h via an LED light source with an average illuminance of 3500 lux (equivalent to 52.5 µmol photons·m−2·s−1). The temperature was recorded daily and was between 28 and 31 °C throughout the incubation period.
Proper aseptic methods were followed during the experimental procedures. All the equipment and work surfaces were sterilized before and after use, and different sets of equipment were used for each treatment to avoid any contamination.
We conducted three independent experiments to examine the effects of salinity on the growth, productivity, and size structure of the Spirulina strain. In each experiment detailed below, we inoculated the Spirulina strain into the prepared salinity-adjusted Zarrouk medium. To ensure consistent starting biomass across all treatments, the volume of culture inoculated into each vessel was standardized through optical density (OD) measurements at 450 nm.

2.3. Plate-Based Growth Experiments

Growths of the Spirulina strain across different salinity treatments were assessed through plate-based growth experiments using sterile 24-well microplates following Edullantes et al. [18] with modifications. Each well is inoculated with 0.2 mL of diluted culture solution and added to 1.8 mL of salinity-adjusted Zarrouk medium. The microplates were covered with gas-permeable polyvinylidene chloride membranes for gas exchange while preventing contamination through aseptic membrane replacement at each measurement. The experiments were conducted with four replicates per salinity treatment.
Growth rates were estimated by monitoring changes in biomass, which were inferred from optical density (OD) measurements [19]. OD measurements were taken every two days over a 20-day incubation period, specifically between 16:00 and 17:00. OD was measured at 450 nm using a BioTek microplate reader with Gen5 2.09 Software (BioTek Instruments; Winusky, Vermont, USA) configured with an area scan protocol.
The maximum specific growth rate (r, d−1) for each treatment was estimated by measuring optical density (OD) values at predetermined time intervals (days) and plotting them against time. The data was then fitted to a logistic growth model (Equation (1)), which has an initial lag phase followed by a rapid exponential phase and ends with a plateau corresponding to the stationary phase using non-linear regression techniques.
N ( t ) = K 1 + K N 0   N 0 e r t  
where N(t) is the OD at time t in days, K is the carrying capacity, N0 is the initial OD, r is the specific growth rate, and e is the base of the natural logarithm.
The specific growth rate was determined by finding the steepest slope of the fitted curve, which corresponded to the maximum first-derivative value during the exponential growth phase. This parameter indicates the intrinsic division rate under each treatment condition and provides important information about the culture growth dynamics.

2.4. Light and Dark Bottle Experiments

The light and dark bottle experiments were used to determine the primary productivity of the cultures under various light intensities across different salinity treatments. Each bottle received 22.5 mL of the salinity-adjusted Zarrouk medium, followed by the addition of 2.5 mL of undiluted stock culture. Plastic films with different opacities were used to control light intensity, simulating ambient light availability at 0%, 25%, 50%, 75%, 90%, and 100%, equivalent to 0, 13.1, 26.3, 39.4, 47.3, and 52.5 µmol photons·m−2·s−1, respectively. The experiments were conducted with three replicates per salinity treatment.
Prior to the 24 h incubation, the initial dissolved oxygen (DO) concentration of this mixture was assessed using a dissolved oxygen sensor linked to a PASCO interface. The sensor probe was calibrated for precision by being placed in clean, distilled water for several minutes both before and after the DO measurements were taken. This calibration step made certain that the sensor readings were correct and consistent.
Final DO readings were taken at the end of the incubation period. To prevent any artefacts (such as oxygen from the atmosphere) entering the sample, the DO readings were taken as soon as the bottle covers were removed. Rapid measurement was important to make sure that the DO values were a true reflection of the metabolic activities of the culture and not some form of interference.
The changes in DO concentration over the incubation period were used to compute respiration (R, mg O2·L−1·d−1), Net Primary Productivity (NPP, mg O2·L−1·d−1), and Gross Primary Productivity (GPP, mg O2·L−1·d−1) using Equations (2)–(4), respectively.
R = D O i n i t i a l D O f i n a l   ( d a r k )  
N P P = D O f i n a l   ( l i g h t ) D O i n i t i a l  
G P P = N P P R  
where DOinitial is the initial dissolved oxygen concentration before incubation (mg O2·L−1), DOfinal (dark) is the final dissolved oxygen concentration in the dark bottle after incubation (mg O2·L−1), and DOfinal (light) is the final dissolved oxygen concentration in the light bottle after incubation (mg O2·L−1).
The relationship between light intensity and photosynthetic response was analyzed by fitting GPP against light intensity levels using a linear regression model (Equation (5)). The linear model’s slope represented the photosynthetic rate at which GPP changed with each light intensity unit. The calculated rates from photosynthetic efficiency were used to create plots that evaluated how photosynthesis responded to different light intensities at various salinity levels.
G P P = β + θ I + ε
where I is the light intensity (µmol photons·m−2·s−1), β is the intercept of the regression model (mg O2·L−1·d−1), θ is the slope, representing the rate of change in GPP per unit increase in light intensity (i.e., photosynthetic efficiency, mg O2·L−1·d−1 per µmol photons·m−2·s−1), and ε is the error term.

2.5. Tube-Based Growth Experiments

Size structure responses were assessed through tube-based growth experiments, which were conducted in 20 mL glass test tubes. Each test tube received 15 mL of salinity-adjusted Zarrouk medium with 1.5 mL of inoculum added. The test tubes were covered with autoclaved cotton plugs to prevent contamination while maintaining gas exchange and reducing evaporative losses. The experiments were conducted with three replicates per salinity treatment.
The cultures were incubated at different salinity levels for 20 days. After the incubation period, about 10 mL volume from each test tube was sampled and run through a PlanktoScope for image acquisition [20,21]. The lighting, focus, ISO, shutter speed, and white balance settings were optimized before image acquisition to ensure image clarity. A peristaltic pump was used to move the sample incrementally between image captures, minimizing the re-imaging of the same organisms. Approximately 100 images were captured per run, with each image containing an estimated 20–30 organisms, targeting a total of 1000–2000 organisms per sample. All images and metadata were stored locally and subsequently transferred to a computer using FileZilla for further processing. Then, image segmentation was performed using the PlanktoScope’s built-in segmentation tool. Segmented images were uploaded to the EcoTaxa platform (https://ecotaxa.obs-vlfr.fr/ (accessed on 1 February 2023)) for automated classification and assessment of morphological parameters (i.e., length and width). Initial classifications were reviewed and manually validated.
For each of the validated images of the Spirulina strain, the diagonal length was calculated to represent the organism size using Equation (6). Based on the computed diagonal length, the organisms were categorized into size classes: <200 μm, 200–399 μm, 400–599 μm, 600–799 μm, 800–999 μm, and >1000 μm.
L D = L 2 × W 2  
where LD is the diagonal length, L is the length, and W is the width.
The density (D) of filaments per size category in each treatment was computed using Equation (7).
D e n s i t y   ( D ) = n V   s a m p l e   i m a g e d      
where n represents the number of filaments from a given size category and Vsample imaged refers to the volume of the water sample (i.e., 0.8 μL) captured using the PlanktoScope.

2.6. Data Analyses

To assess the effect of salinity on the maximum specific growth rate and photosynthetic efficiency of Spirulina sp., a Generalized Linear Model (GLM) was fitted using a Gaussian error distribution and an identity link function. The model included salinity treatment as a categorical predictor. An analysis of deviance was conducted to evaluate the overall significance of the predictor by comparing the full model against the null model.
Following a significant effect of salinity treatment, a post hoc pairwise comparison was performed using Tukey’s Honest Significant Difference (HSD) test to determine which salinity levels significantly differed from each other. The glht function from the multcomp R package [22] was used to carry out the multiple comparisons, with adjusted p-values obtained using the single-step method to control for Type I error across all contrasts.
Principal Component Analysis (PCA) was employed to investigate the changes in size structure across salinity treatments. The counts in each size class were combined and transformed into relative proportions to standardize the data per treatment. We used PCA to reduce the dimensionality of the relative abundance after centering and scaling while employing a correlation matrix to identify patterns in size structure. We focused on the first two principal components to detect significant patterns while using size class loadings to understand which size categories influenced these observed patterns.
The analysis of size structure under salinity influence used a permutational multivariate analysis of variance (PERMANOVA) with the adonis2 function from the vegan R package [23]. The analysis used a Bray–Curtis dissimilarity matrix, which was created from square root-transformed size class densities. The analysis examined salinity as a fixed effect through 999 permutations of a reduced model.
All statistical analyses were conducted in R version 4.5.0 [24], and the significance was assessed at an alpha level of 0.05.

3. Results

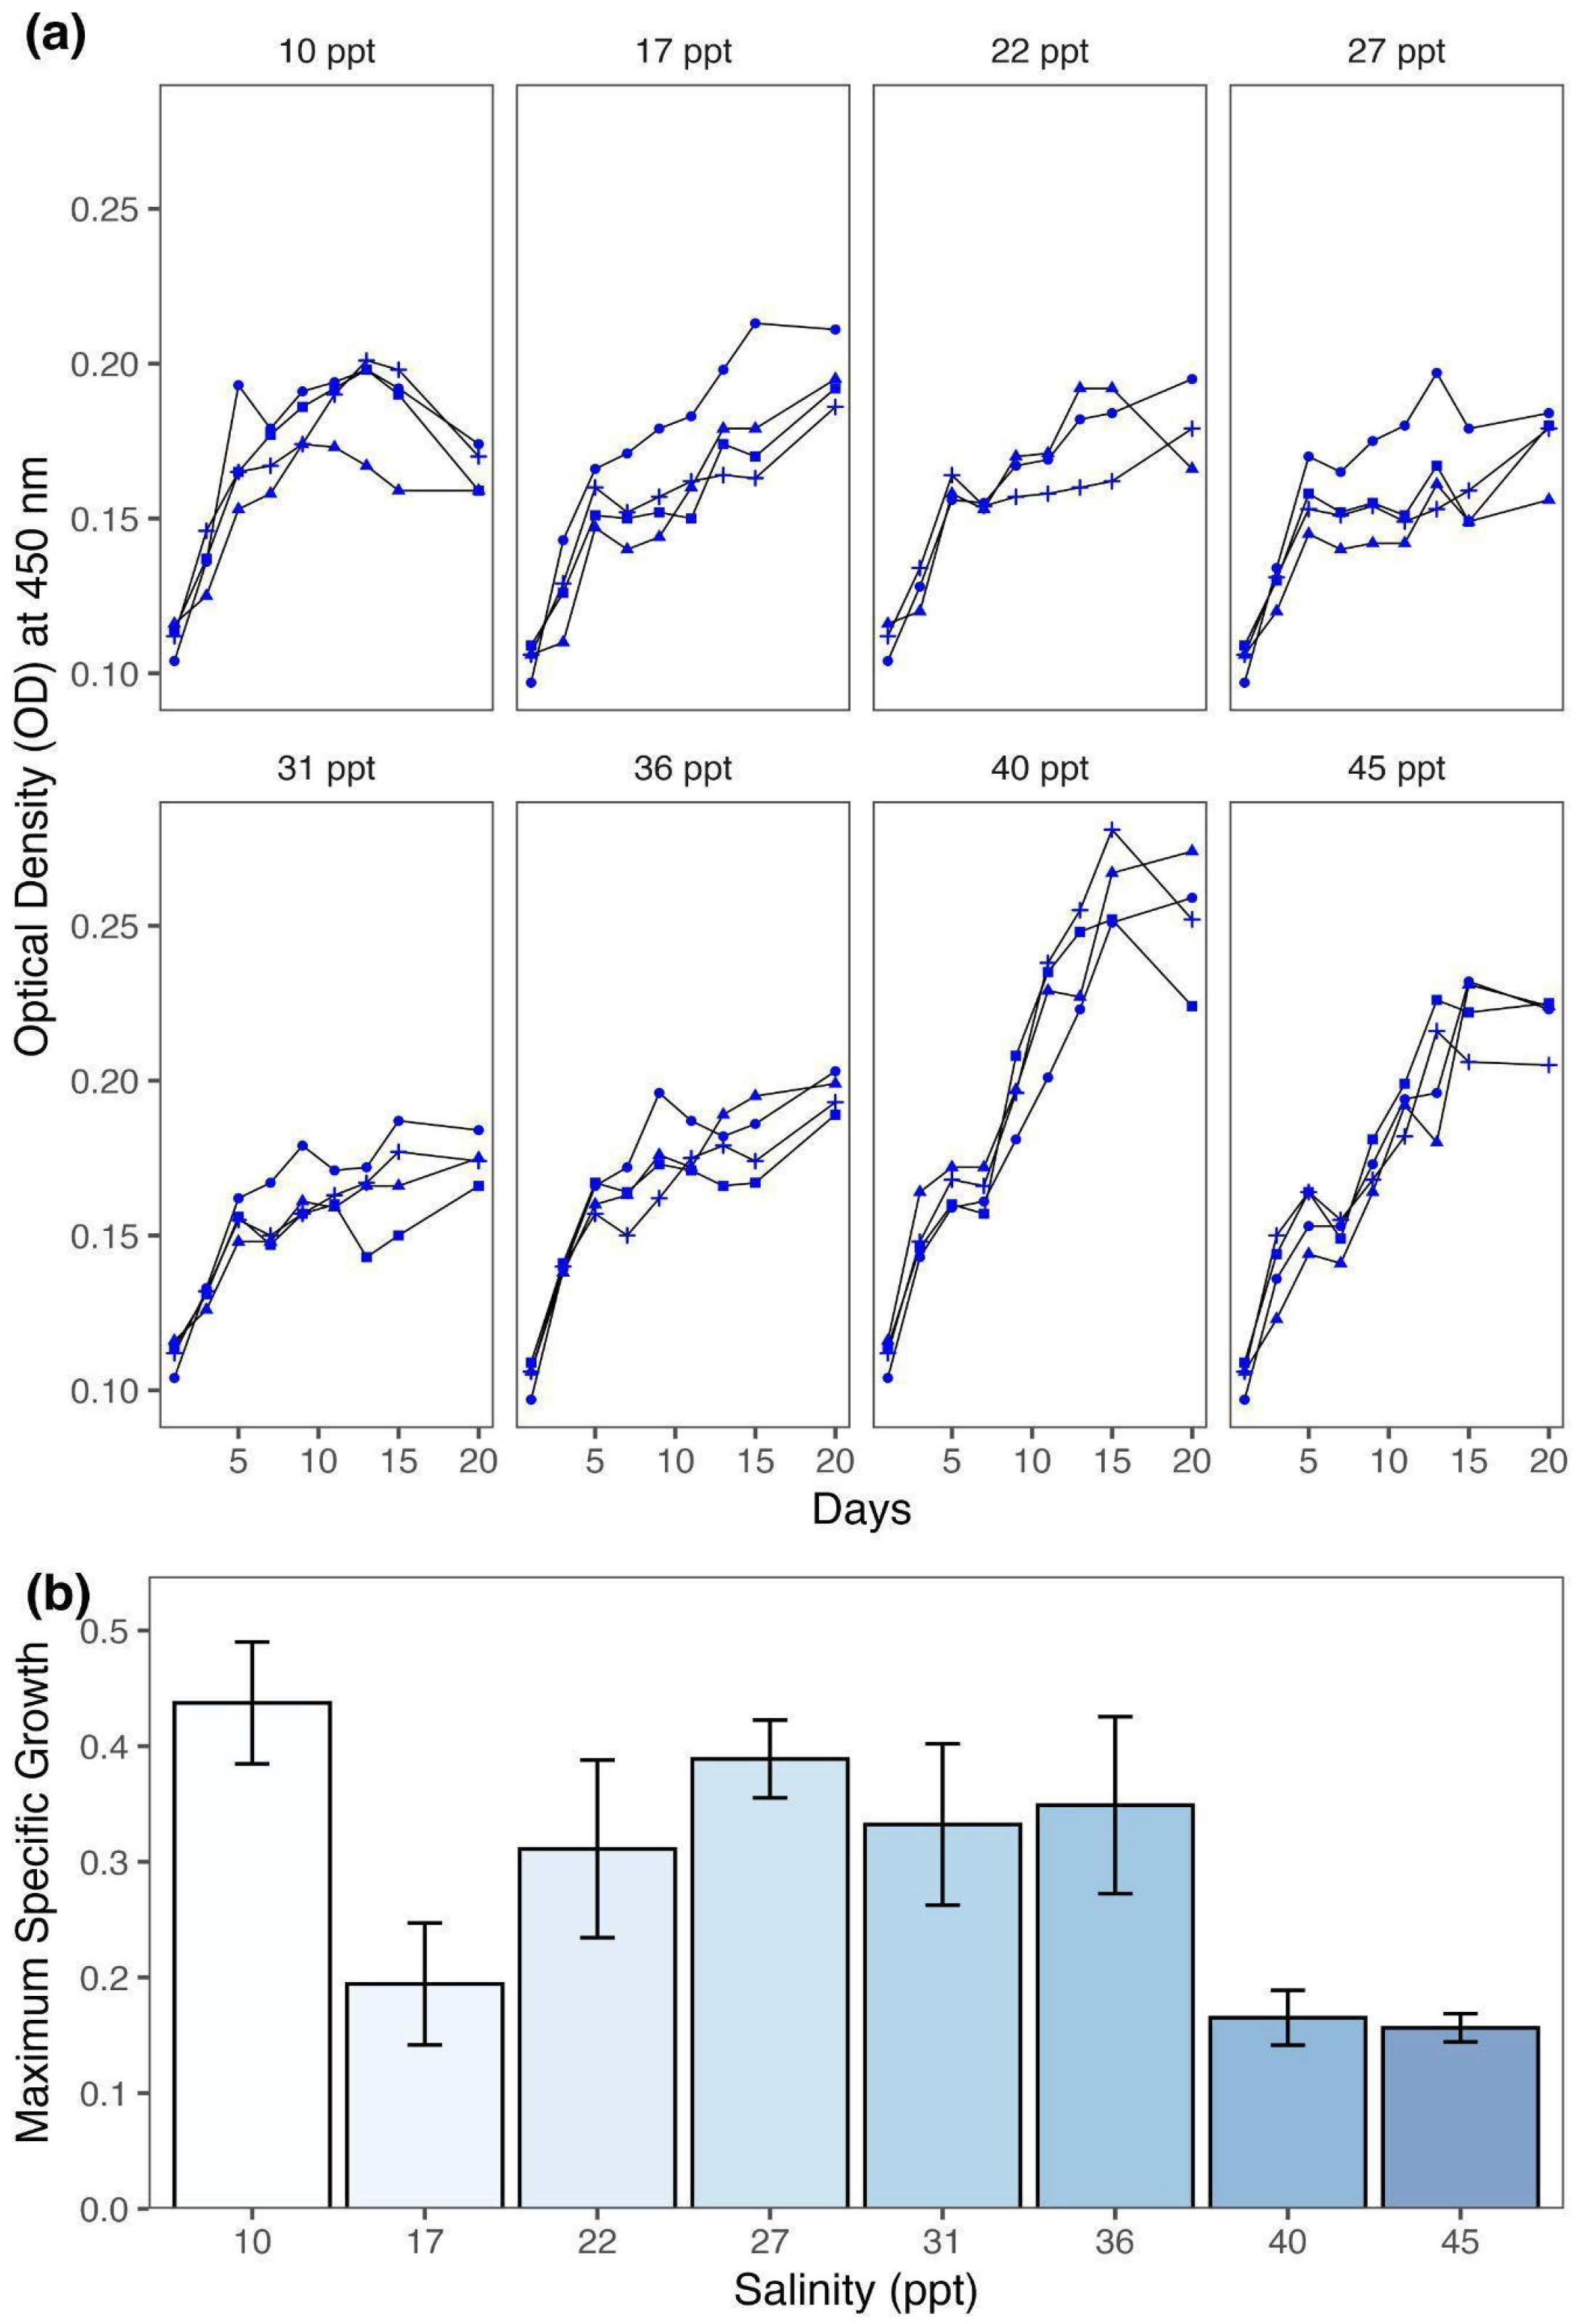
3.1. Variation in Growth

The results showed that the Spirulina strain exhibited distinct growth patterns in response to different salinity treatments (Figure 1a; Table 1). The growth at lower and moderate salinity levels (10–36 ppt) increased initially and started to slow down after Days 8–10. In contrast, growth at higher salinities (40–45 ppt) increased steadily, reaching its peak by Day 14.
A Generalized Linear Model (GLM) employing a Gaussian distribution and identity link function was applied to investigate how salinity treatment affected the maximum specific growth rate (r). The analysis of deviance showed that salinity treatment had a statistically significant effect on growth rate (F(7, 23) = 4.14, p < 0.01). Salinity as an independent variable in the model captured a significant portion of the total deviance (ΔDeviance = 0.32), reducing the residual deviance from 0.57 to 0.25.
The post hoc analysis using Tukey’s HSD test demonstrated multiple statistically significant differences in the growth rate between salinity treatments (Figure 1b). The Spirulina strain grown at 10 ppt had the highest growth rate compared to cultures grown at 17 ppt (∆r = 0.24 d−1, p < 0.05), 40 ppt (∆r = 0.27 d−1, p < 0.01), and 45 ppt (∆r = 0.28 d−1, p < 0.01). Also, the growth rate at 27 ppt was significantly higher compared to the rates obtained at 45 ppt (∆r = 0.23, p < 0.05). All other pairwise comparisons were not statistically significant, implying that intermediate salinity treatments (i.e., 22–36 ppt) did not differ significantly in their effects on the Spirulina strain growth rate.

3.2. Variation in Productivity

The relationship between gross primary production (GPP) and light intensity across varying salinity levels showed distinct patterns of photosynthetic responses in the Spirulina strain (Figure 2a). GPP remained almost steady at low salinity (10 ppt) when light intensity increased. On the other hand, GPP increased with increasing light intensity at higher salinity levels (17 ppt to 45 ppt).
GLM was also used to assess the effect of salinity on the photosynthetic efficiency of the Spirulina strain (θ, mg O2·L−1·d−1 per µmol photons·m−2·s−1)—estimated by the slope of the linear relationship between GPP and light intensity. The analysis of deviance showed that salinity produced a statistically significant effect on photosynthetic efficiency (F(7, 16) = 3.08, p < 0.05). The model explained a large part of the deviance (ΔDeviance = 0.0004), reducing the residual deviance by 66.67%.
The results of Tukey’s HSD test for post hoc pairwise comparisons showed significant differences in photosynthetic efficiency (Figure 2b). Significantly higher mean estimates were observed at 27, 40, and 45 ppt, which were ~0.01 mg O2·L−1·d−1 per µmol photons·m−2·s−1 greater than the mean estimates at 10 ppt (p < 0.05). There was no significant difference between treatments in all other pairwise comparisons, showing that photosynthetic efficiency improved most at higher salinity levels.

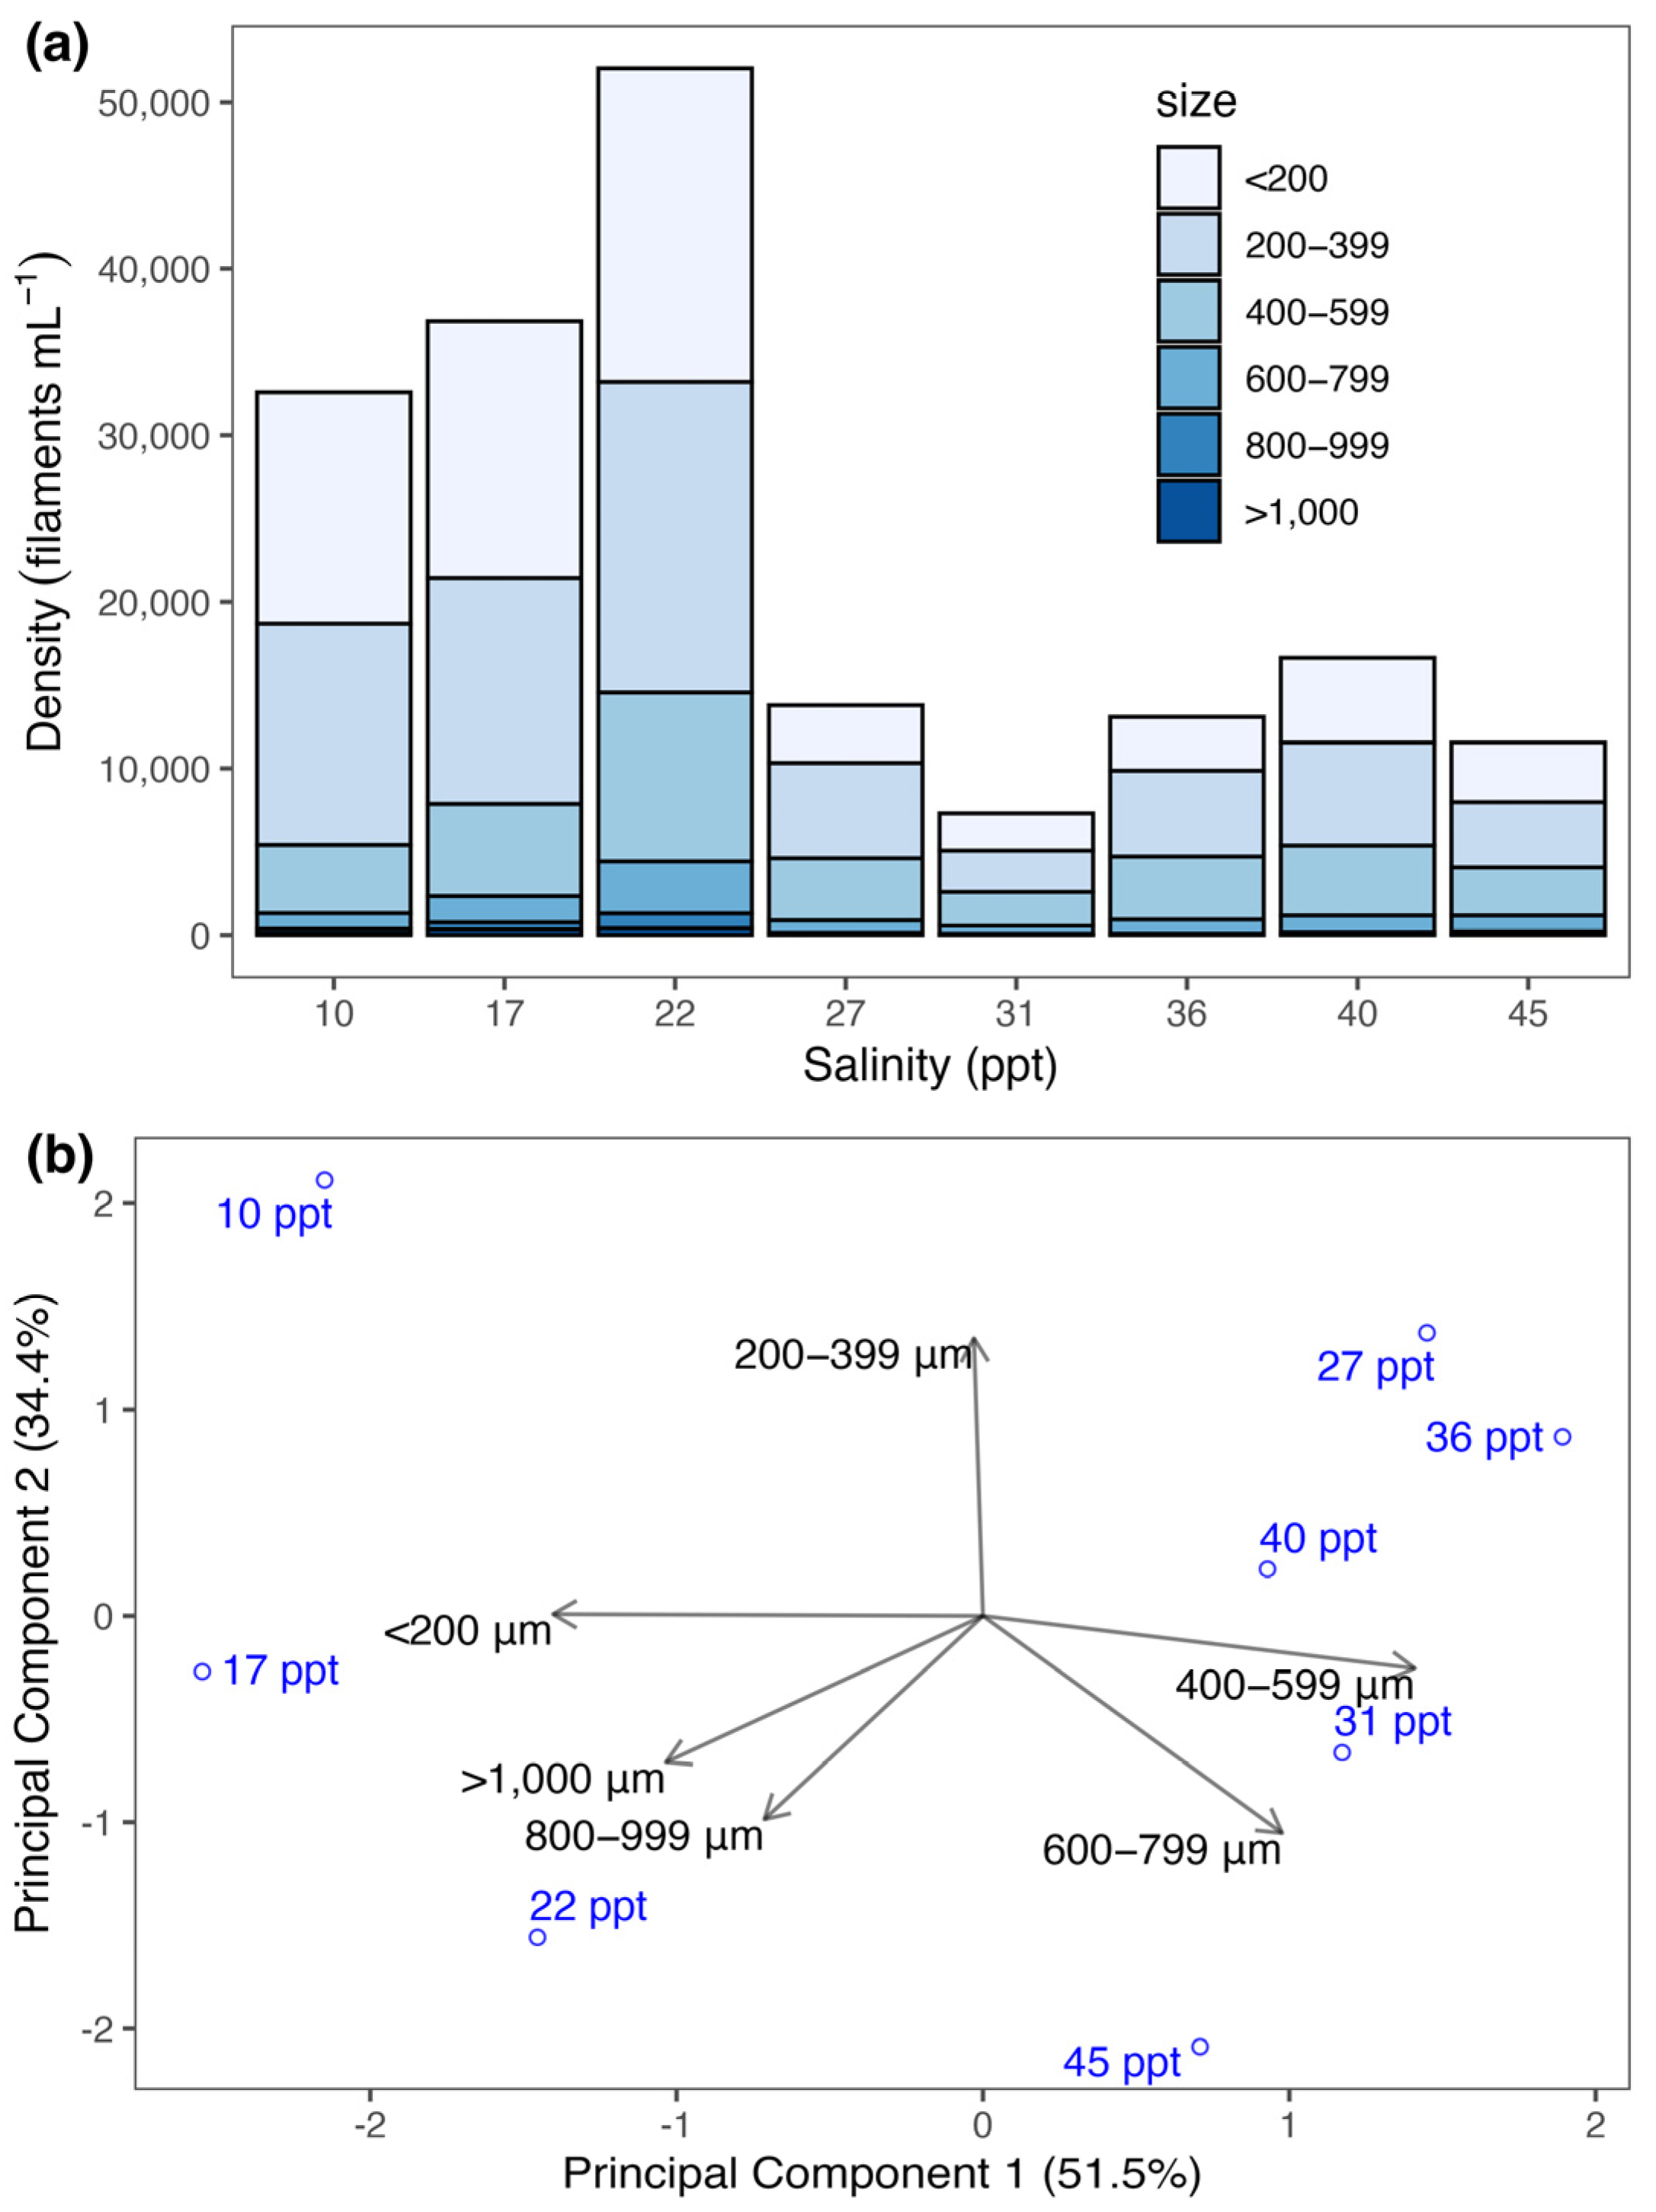
3.3. Change in Size Structure

The size structure of the Spirulina strain varied among salinity treatments (Figure 3a). At lower salinity treatments (10–22 ppt), the densities exceeded 30,000 filaments mL−1, with the majority measuring less than 400 µm. On the other hand, densities at higher salinities (27–45 ppt) had lower densities (<20,000 filaments mL−1), but the composition of medium-sized filaments (400–799 µm) is greater relative to lower salinity treatments.
This shift in size structure is further illustrated through Principal Component Analysis (PCA) (Figure 3b). The first two principal components accounted for 85.9% of the total variance in the size structure. PC1 (51.5%) distinguished the lower salinity treatments (10–22 ppt) with higher relative abundance of small- (<200 µm and 200–399 µm) and large-sized filaments (800–999 µm and >1000 µm) from the higher salinity treatments (27–45 ppt) with greater abundance of medium-sized filaments (400–599 µm and 600–799 µm). PC2 (34.4%) separated treatments by smaller size fractions.
The PERMANOVA analysis revealed a significant effect of salinity on the size structure (F(1, 6) = 8.47, p < 0.01). The model explained 59% (Sum of Squares = 0.03, R2 = 0.59) of the variation in size composition, while the residual accounted for 42% (Sum of Squares = 0.02, R2 = 0.42), indicating that substantial unexplained variation remains.

4. Discussion

4.1. Salinity Modulates Growth of Spirulina

The present study provides evidence of the salinity dependency of the growth of the Spirulina strain. The highest maximum specific growth rate was observed at 10 ppt and then drastically decreased at 17, 40, and 45 ppt. This data shows that although the strain can tolerate hypersaline conditions, growth becomes severely impaired once salinity exceeds the optimal levels [25].
The results are in agreement with earlier studies, which have shown that Spirulina grows well in moderate salinity and is affected by stress when the salinity is above the tolerance range of the organism. In Rai and Rajashekhar’s study [11], Spirulina major had the highest chlorophyll-a content and growth rates at salinities of 9–16 ppt, whereas at salinities of 25–40 ppt, growth rates were very low. Ravelonandro et al. [6] also obtained similar results, as they reported that the protein content of Spirulina platensis was the highest at a low salinity of 13 g/L and decreased at higher salt concentrations, which could be related to the sensitivity of nitrogen metabolism to salt.
The current study showed that Spirulina cultures grown at the intermediate salinities (22–36 ppt) did not have statistically significant differences in specific growth rates. This may indicate a physiological acclimation phase in which osmoregulatory mechanisms, such as the synthesis of compatible solutes or the expression of salt-stress proteins, may help to stabilize the cellular metabolism [26,27]. Indeed, Hongsthong and colleagues [26] observed that morphological variants of Spirulina platensis showed altered protein expression related to energy metabolism and translational machinery under different environmental stresses, including salinity. The molecular responses observed may explain the relatively constant growth rate observed between 22 and 36 ppt.
The lower growth rates observed at 40 and 45 ppt are indicative of the upper limit of salinity that the Spirulina strain can tolerate since, beyond this salinity, ion toxicity and osmotic imbalance will impede metabolic activity. High salinity may cause a reduction in photosynthesis and nutrient absorption and thus lead to reduced biomass production [12]. Furthermore, high salt concentrations can cause damage to the structure and functioning of the thylakoid membrane, which results in decreased light utilization efficiency and reduced cellular performance [14].
However, the fact that the strain can still grow at salinities as high as 45 ppt is a clear indication of its euryhaline nature. This physiological plasticity could be due to the fact that Spirulina is a salt-tolerant, alkaline lake algae that lives in environments with changing ionic conditions [1]. However, the results of this study also indicate that the salinity for the maximum growth rate of the Spirulina strain is at the lower end of the gradient, particularly at 10 ppt.

4.2. Salinity Alters Productivity of Spirulina

Gross primary production (GPP) showed no significant change across varying light intensities at the lowest salinity point of 10 ppt, indicating poor photophysiological responses when salt levels were low. GPP increased linearly with light intensity only in Spirulina cultures maintained at salinity levels greater than or equal to 17 ppt. Under saline stress, the strain enhances its photosynthetic efficiency, which enables it to maximize oxygenic photosynthesis when using available light [28].
The observed change in productivity patterns corresponds with Moisander et al. [12], who proved that Anabaena together with Anabaenopsis and other freshwater and marine cyanobacteria perform better photosynthetically at intermediate to high salinity ranges. The calculated photosynthetic efficiency based on GPP–light response curve slopes showed higher values at 27, 40, and 45 ppt when compared to 10 ppt. The results demonstrate this strain’s ability to adapt its light-harvesting complexes and pigment composition as a photoacclimation response to salt stress to maintain photosynthetic output during osmotic challenges [29,30].
Cyanobacteria that experience salinity stress typically change their metabolic processes to maintain energy flow through their photosynthetic electron transport chain [11]. Cyanobacteria exposed to salty conditions create compatible solutes while turning on ion transport systems that need ATP and reducing power for operation. The enhanced photosynthetic efficiency at increased salinity levels could represent a regulatory response that provides enough energy to sustain stress adaptation mechanisms [28].
The Spirulina strain displayed declining specific growth rates across the same salinity conditions, even though photosynthetic efficiency rose at higher salt concentrations. The separation between photosynthetic capacity and growth indicates that cellular resources moved toward sustaining basic cellular operations and stress defense instead of cell division [31]. The observed growth patterns in cyanobacteria subjected to photooxidative stress or nutrient limitation show that increased photosynthetic rates enable survival instead of promoting biomass growth [6,26].
The effects of salinity and light interactions on primary productivity demonstrate that evaluations of algal performance need to examine multiple environmental factors simultaneously. Light conditions essential for photosynthesis require proper conditions to function effectively because their impact on photosynthesis varies based on the surrounding salinity levels [32]. The research shows that Spirulina cultivation optimization requires integrating both environmental and physiological factors, especially when salinization occurs in regions affected by climate change or human activities.

4.3. Salinity Shifts Size Structure of Spirulina

The exposure to salinity caused significant shifts in the size structure of the Spirulina strain, which demonstrated high flexibility in its morphological response to osmotic stress. Cultures maintained at salinity levels between 10 and 22 ppt contained dense cell populations of small filaments that were under 400 µm in length. The cultures grown at elevated salinity ranges (27–45 ppt) showed lower cell numbers but increased percentages of cells with sizes between 400 and 799 µm. The results show that higher salt concentrations preferentially promote the growth and survival of longer filamentous cell shapes [33].
The Principal Component Analysis (PCA) results showed that size structure variations are directly linked to salinity treatment conditions. The first principal component (PC1) used most of the data to distinguish between lower salinity conditions through their combinations of small and large filament numbers, yet linked larger intermediate filament sizes to higher salinity conditions. The observed cluster pattern reveals distinct size structure patterns across the salinity range, which most likely resulted from salt-triggered morphological adaptations. The results of the PERMANOVA analysis support the hypothesis that salinity has an effect on the filament size of Spirulina. Other environmental and physiological factors, including nutrient levels, light conditions, and genetic characteristics, might also influence filament size [33].
The observed morphological variation is consistent with earlier findings that Spirulina can undergo structural alterations under stress. Previous studies have demonstrated that Spirulina undergoes architectural changes in filaments when exposed to stressors such as high light intensity, nutrient limitations, and temperature fluctuations [13,34]. Hongsthong et al. [26] observed linear Spirulina platensis variants showing altered protein expression patterns that included metabolic energy components and stress responses, as well as translation machinery elements, during stress-induced morphogenesis.
Studies have suggested that stress-induced filament elongation or increased size might serve functional purposes by reducing the membrane ion exchange surface area and improving ionic homeostasis [14]. The larger filament dimensions may result in modifications to buoyancy and motility patterns, which offer survival advantages in salty waters with non-uniform light and nutrient distribution.
These findings support the hypothesis that Spirulina displays adjustable morphological traits through phenotypic plasticity in response to salinity changes. The ability to modify filament structure allows Spirulina to survive in various aquatic ecosystems with changing environmental conditions.

4.4. Putative Physiological Mechanisms Underlying Spirulina’s Response to Salinity

Spirulina demonstrates several physiological responses for adapting to osmotic stress when exposed to changing salinity levels. These responses reflect an intricate relationship between stress detection systems and the adjustment of cells and the distribution of resources.
Spirulina could activate its osmoregulatory pathways to produce compatible solutes like glycine betaine, trehalose, and glucosylglycerol when salinity exceeds the optimal threshold [35]. The organic osmolytes act as protective agents by stabilizing proteins and cell structures, which stops dehydration while keeping enzymes operational in hyperosmotic conditions. The lack of substantial growth impairment between 22 and 36 ppt shows that these solutes effectively preserve cell turgor and metabolic balance under moderate salt stress conditions.
They could also detect changes in stress-responsive protein expression when subjected to salinity stress, which affects energy metabolic and translation processes, as well as redox homeostasis [36]. These changes might help the organism move its metabolic priorities from growth to maintenance and repair functions, which explains why photosynthesis and biomass growth become disconnected at high salinity levels.
The gross primary productivity (GPP) shows a linear rise with increasing light intensity when salinity reaches ≥17 ppt, indicating regulatory changes in photosynthetic machinery operation. The photosynthetic machinery could alter pigment composition while readjusting light-harvesting complexes to enhance light absorption and energy conversion efficiency during stressful conditions [37]. The elevated photosynthetic efficiency under salt stress generates sufficient ATP and NADPH for cellular defense mechanisms such as ion transport and antioxidant production instead of promoting biomass growth.
Salinity stress creates ionic stress by causing excessive Na+ and Cl accumulation, which disrupts enzyme function and membrane electrical stability [38]. Spirulina could activate ion extrusion systems, which include Na+/H+ antiporters and H+-ATPases, but this process requires substantial energy expenditure. High salt concentrations exceeding 40 ppt can damage thylakoid membranes, which impairs photosynthetic electron transfer, thus disrupting energy homeostasis.
Filament size regulation together with morphological plasticity represents a stress-induced adaptation that causes a structural shift between small (<400 µm) and large (400–799 µm) filaments when salinity levels increase. The change in filament size distribution from small to large filaments at higher salinity levels indicates an adaptive response of the organism to stress. Large filaments decrease membrane surface area relative to volume, which leads to reduced ion flux and enhanced ionic regulation [39]. The morphological change provides better buoyancy and light-positioning capabilities that enhance survival rates in environments with variable nutrients and layering.

4.5. Caveats and Limitations

While this study provides new insights into the physiological and morphological responses of a Spirulina strain under varying salinity levels, several limitations should be noted that may affect the generalizability and interpretation of the results.
First, the taxonomic status of the Spirulina strain employed in this study was deduced from morphology alone. The genus Spirulina is polyphyletic, and many morphologically similar strains have been reclassified into Arthrospira, Limnospira, and Glaucospira [40], and we did not use molecular identification (e.g., 16S rRNA gene sequencing) to identify the strain to a specific taxon. We recommend that future studies use genotypic validation to make accurate comparisons between studies and to obtain a better ecological understanding of strain-specific responses.
Second, optical density at 450 nm was used as a surrogate marker for biomass in the experiments. OD is a widely used indicator of growth in microalgal cultures, but may not be as reliable in filamentous cyanobacteria as Spirulina due to differences in filament orientation, coiling, and aggregation. The filaments were mostly linear rather than spiral in this study, which may reduce such variability, but OD may not be a direct measure of biomass in all treatments. Future work should include dry weight measurements, cell volume estimates, or chlorophyll content measurements in addition to OD measurements.
Third, the current study examined growth dynamics, productivity, and filament size structure but did not include direct assessments of cell viability, especially under the extreme salinity treatments (i.e., 40–45 ppt). The assessment of viability (e.g., via live/dead staining or metabolic activity assays) is crucial for understanding whether the observed reductions in growth at extreme salinity levels reflect metabolic slowdown or actual cell mortality. Future work should incorporate such assays to more accurately define the physiological limits and stress tolerance thresholds of Spirulina under hypersaline conditions.
Fourth, important trends in growth, productivity, and filament size under salinity stress were observed, but the molecular mechanisms of adaptation were not investigated. Osmolyte synthesis, changes in protein expression, and metabolic pathway regulation in hypersaline conditions are likely to have a significant effect on the observed physiological and morphological traits. We have acknowledged this limitation and recommend that transcriptomic and proteomic analyses should be integrated into future studies to reveal the regulatory networks of salinity adaptation in Spirulina.
Lastly, salinity tolerance and associated traits may vary significantly among strains. Thus, comparative studies involving multiple, well-characterized strains are required to distinguish generalizable responses from strain-specific adaptations.
Our study provides valuable empirical evidence on the effects of salinity on key biological properties of Spirulina, which can be useful in developing optimized cultivation strategies, especially in salinizing environments.

4.6. Implications for Optimization of Spirulina Cultivation

The integrated physiological and morphological responses of Spirulina across a salinity gradient offer valuable insights for refining cultivation strategies, particularly in the context of maximizing biomass productivity and maintaining culture resilience. The highest specific growth rate was observed at 10 ppt, but the photosynthetic efficiency increased significantly at higher salinities, most notably at 27 ppt. This suggests that under moderately saline conditions, Spirulina may shift its metabolic investment from rapid proliferation toward enhancing energy conversion efficiency and photophysiological performance.
The salinity level of 27 ppt appears to represent a crucial physiological threshold—one that balances acceptable growth rates with superior photosynthetic performance and manageable morphological variation. At this level, cultures maintained substantial productivity while exhibiting intermediate cell sizes and moderate reductions in cell density. These characteristics are advantageous in large-scale cultivation, where consistent oxygen evolution and biomass composition are often prioritized over maximal growth rates alone.
This interpretation is supported by the findings of Ravelonandro et al. [6], who reported that Spirulina platensis exhibited increased protein productivity at lower salinities when supplemented with carbon dioxide but also retained tolerance to higher salinity regimes. Moreover, Moisander et al. [12] demonstrated that salinity tolerance in bloom-forming cyanobacteria is strain-specific, with certain species showing enhanced photosynthetic activity across a broad salinity range. These observations highlight the flexibility of cyanobacteria like Spirulina in modulating productivity under salt stress and emphasize the potential for targeted environmental tuning in cultivation systems.
Importantly, the capacity of Spirulina to survive and maintain photosynthetic efficiency even at 45 ppt underscores its potential for cultivation in non-arable, salt-affected regions. This aligns with the growing interest in utilizing brackish water or wastewater as a cost-effective medium for microalgal production [17]. The organism’s resilience to salinity also opens opportunities for integrating Spirulina cultivation into sustainable aquaculture systems and land reclamation initiatives, where freshwater scarcity or salinization pose significant constraints.
Furthermore, the morphological flexibility of Spirulina—manifested in its ability to alter filament size and structure under environmental stress—may contribute to its adaptive advantage in fluctuating habitats. Studies have shown that such morphological changes are not merely structural but may reflect deeper proteomic and metabolic adjustments [26], enabling the organism to maintain function despite suboptimal conditions. This adaptive plasticity is particularly relevant under climate change scenarios, where the increasing salinization of freshwater and estuarine systems is expected due to sea-level rise and intensified droughts [32].
In conclusion, cultivation at approximately 27 ppt may offer an optimal compromise between growth and productivity, while also taking advantage of Spirulina’s inherent tolerance to salinity-induced stress. Such strategic modulation of salinity could enhance the efficiency, resilience, and scalability of Spirulina production systems, supporting their broader application in food, feed, and environmental biotechnology sectors.

Author Contributions

Conceptualization, I.K.M.L. and B.E.; methodology, I.K.M.L. and B.E.; formal analysis, I.K.M.L. and B.E.; investigation, I.K.M.L.; resources, I.K.M.L. and B.E.; data curation, I.K.M.L. and B.E.; writing—original draft preparation, I.K.M.L. and B.E.; writing—review and editing, I.K.M.L. and B.E.; visualization, B.E.; supervision, B.E. All authors made equal contributions to this study. All authors have read and agreed to the published version of the manuscript.

Funding

This research received no external funding.

Institutional Review Board Statement

Not applicable.

Informed Consent Statement

Not applicable.

Data Availability Statement

The original contributions presented in this study are included in the article. Further inquiries can be directed to the corresponding author.

Acknowledgments

The authors would like to thank the invaluable feedback and suggestions provided by the reviewers, which greatly improved the clarity and quality of this study. Sincere thanks are extended to Judith Silapan and Fleurdeliz Maglangit for their comments and suggestions, which helped improve the thesis manuscript of Imma Krissalina Lao, upon which this paper is based. The author also wishes to express heartfelt appreciation to Samson Go for generously sharing his Spirulina culture. During the preparation of this manuscript, the authors used ChatGPT-4 Mini (high-capacity model) to assist in resolving specific issues related to data analysis and visualization in R. All outputs generated with the tool were critically reviewed, validated, and edited by the authors, who take full responsibility for the content and accuracy of this publication.

Conflicts of Interest

The authors declare no conflicts of interest.

Abbreviations

DODissolved Oxygen
GLMGeneralized Linear Model
GPPGross Primary Productivity
HSDHonestly Significant Difference
KCarrying Capacity
LLength
LDDiagonal Length
ODOptical Density
NPopulation Size
NPPNet Primary Productivity
PCAPrincipal Component Analysis
PERMANOVAPermutational Multivariate Analysis of Variance
RRespiration
WWidth

References

  1. Habib, M.A.B. (Ed.) A Review on Culture, Production and Use of Spirulina as Food for Humans and Feeds for Domestic Animals and Fish; FAO Fisheries and Aquaculture Circular; Food and Agriculture Organization of the United Nations: Rome, Italy, 2008. [Google Scholar]
  2. Vo, T.-S.; Ngo, D.-H.; Kim, S.-K. Nutritional and pharmaceutical properties of microalgal Spirulina. In Handbook of Marine Microalgae; Kim, S.-K., Ed.; Elsevier: Amsterdam, The Netherlands, 2015; pp. 299–308. [Google Scholar] [CrossRef]
  3. Podgórska-Kryszczuk, I. Spirulina—An invaluable source of macro- and micronutrients with broad biological activity and application potential. Molecules 2024, 29, 5387. [Google Scholar] [CrossRef] [PubMed]
  4. Sabine, C.L.; Feely, R.A.; Gruber, N.; Key, R.M.; Lee, K.; Bullister, J.L.; Wanninkhof, R.; Wong, C.S.; Wallace, D.W.R.; Tilbrook, B.; et al. The oceanic sink for anthropogenic CO2. Science 2004, 305, 367–371. [Google Scholar] [CrossRef] [PubMed]
  5. Gavilan-Figari, I.M.; Peña-Urdániga, G.V.; Naka, A.; Castro-Rosas, M.A. The role of Spirulina in food security: Nutritional and ecological implications in the context of climate change. CABI Rev. 2024, 19. [Google Scholar] [CrossRef]
  6. Ravelonandro, P.H.; Ratianarivo, D.H.; Joannis-Cassan, C.; Isambert, A.; Raherimandimby, M. Improvement of the growth of Arthrospira (Spirulina) platensis from Toliara (Madagascar): Effect of agitation, salinity and CO2 addition. Food Bioprod. Process 2011, 89, 209–216. [Google Scholar] [CrossRef]
  7. Mishra, P.; Prasad, S.M. Low dose UV-B radiation induced mild oxidative stress impact on physiological and nutritional competence of Spirulina (Arthrospira) species. Plant Stress 2021, 2, 100039. [Google Scholar] [CrossRef]
  8. González-Portela, R.E.; Romero-Villegas, G.I.; Kapoore, R.V.; Alammari, Z.M.; Malibari, R.A.; Al Shaikhi, A.; Al Hafedh, Y.; Aljahdali, A.H.; Banjar, R.E.; Mhedhbi, E.; et al. Cultivation of Limnospira maxima under extreme environmental conditions in Saudi Arabia: Salinity adaptation and scaling-up from laboratory culture to large-scale production. Bioresour. Technol. 2024, 406, 131089. [Google Scholar] [CrossRef]
  9. Yu, C.; Zheng, J.; Zhang, Y.; Hu, Y.; Luo, W.; Zhang, J.; Yu, J.; Liu, J.; Nixon, P.J.; Zhou, W.; et al. Towards sustainable Spirulina farming: Enhancing productivity and biosafety with a salinity-biostimulants strategy. Bioresour. Technol. 2025, 419, 132043. [Google Scholar] [CrossRef]
  10. Lassiter, A. Rising seas, changing salt lines, and drinking water salinization. Curr. Opin. Environ. Sustain. 2021, 50, 208–214. [Google Scholar] [CrossRef]
  11. Rai, S.V.; Rajashekhar, M. Effect of pH, salinity and temperature on the growth of six species of cyanobacteria isolated from Arabian Sea coast of Karnataka. Int. J. Biosci. Technol. 2016, 9, 1–6. [Google Scholar]
  12. Moisander, P.H.; McClinton, E.; Paerl, H.W. Salinity effects on growth, photosynthetic parameters, and nitrogenase activity in estuarine planktonic cyanobacteria. Microb. Ecol. 2002, 43, 432–442. [Google Scholar] [CrossRef]
  13. van Eykelenburg, C. The ultrastructure of Spirulina platensis in relation to temperature and light intensity. Antonie Van Leeuwenhoek 1979, 45, 369–390. [Google Scholar] [CrossRef] [PubMed]
  14. Wang, Z.P.; Zhao, Y. Morphological reversion of Spirulina (Arthrospira) platensis (Cyanophyta): From linear to helical. J. Phycol. 2005, 41, 622–628. [Google Scholar] [CrossRef]
  15. Shiraishi, H.; Sasase, M.; Nakashima, A.S. Helicoid morphology of Arthrospira platensis NIES-39 confers temperature compensation in the longitudinal movement velocity of its trichomes. Phycology 2024, 4, 104–116. [Google Scholar] [CrossRef]
  16. Zarrouk, C. Contribution à L’étude D’une Cyanophycée: Influence de Divers Facteurs Physiques et Chimiques sur la Croissance et la Photosynthèse de Spirulina Maxima (Setch. et Gardner) Geitler. Ph.D. Thesis, University of Paris, Paris, France, 1966. [Google Scholar]
  17. AlFadhly, N.K.Z.; Alhelfi, N.; Altemimi, A.B.; Verma, D.K.; Cacciola, F. Tendencies affecting the growth and cultivation of genus Spirulina: An investigative review on current trends. Plants 2022, 11, 3063. [Google Scholar] [CrossRef] [PubMed]
  18. Edullantes, B.; Low-Decarie, E.; Steinke, M.; Cameron, T. Comparison of thermal traits between non-toxic and potentially toxic marine phytoplankton: Implications to their responses to ocean warming. J. Exp. Mar. Biol. Ecol. 2023, 562, 151883. [Google Scholar] [CrossRef]
  19. Stevenson, K.; McVey, A.F.; Clark, I.B.N.; Swain, P.S.; Pilizota, T. General calibration of microbial growth in microplate readers. Sci. Rep. 2016, 6, 38828. [Google Scholar] [CrossRef]
  20. Pollina, T.; Larson, A.G.; Lombard, F.; Li, H.; Le Guen, D.; Colin, S.; de Vargas, C.; Prakash, M. PlanktoScope: Affordable modular quantitative imaging platform for citizen oceanography. Front. Mar. Sci. 2022, 9, 949428. [Google Scholar] [CrossRef]
  21. Lombard, F. PlanktoScope Protocol for Plankton Imaging. Protocols.io 2022. Available online: https://www.protocols.io/view/planktoscope-protocol-for-plankton-imaging-bp2l6bq3zgqe/v4 (accessed on 15 January 2023).
  22. Hothorn, T.; Bretz, F.; Westfall, P. Simultaneous inference in general parametric models. Biom. J. 2008, 50, 346–363. [Google Scholar] [CrossRef]
  23. Oksanen, J.; Blanchet, F.G.; Friendly, M.; Kindt, R.; Legendre, P.; McGlinn, D.; Minchin, P.R.; O’Hara, R.B.; Simpson, G.L.; Solymos, P.; et al. Vegan: Community Ecology Package (Version 2.5-7) [R package], 2020. Available online: https://CRAN.R-project.org/package=vegan (accessed on 1 March 2025).
  24. R Core Team. R: A Language and Environment for Statistical Computing; R Foundation for Statistical Computing: Vienna, Austria, 2025; Available online: https://www.R-project.org/ (accessed on 1 March 2025).
  25. Almahrouqi, H.A.; Sukumaran, P.; Naqqiuddin, M.A.; Alsabahi, J.N.; Hishamuddin; Omar, M.E.; Ismail, A. The effect of salinity on growth, biochemical composition and fatty acid profile of Spirulina (Arthrospira platensis) grown in sheltered outdoor conditions in Oman. J. Algal Biomass Util. 2015, 6, 61–67. [Google Scholar]
  26. Hongsthong, A.; Sirijuntarut, M.; Prommeenate, P.; Thammathorn, S.; Bunnag, B.; Cheevadhanarak, S.; Tanticharoen, M. Revealing differentially expressed proteins in two morphological forms of Spirulina platensis by proteomic analysis. Mol. Biotechnol. 2007, 36, 123–130. [Google Scholar] [CrossRef]
  27. Russo, N.P.; Ballotta, M.; Usai, L.; Torre, S.; Giordano, M.; Fais, G.; Casula, M.; Dessì, D.; Nieri, P.; Damergi, E.; et al. Mixotrophic cultivation of Arthrospira platensis (Spirulina) under salt stress: Effect on biomass composition, FAME profile and phycocyanin content. Mar. Drugs 2024, 22, 381. [Google Scholar] [CrossRef] [PubMed]
  28. Lu, C.; Vonshak, A. Effects of salinity stress on photosystem II function in cyanobacterial Spirulina platensis cells. Physiol. Plant. 2002, 114, 405–413. [Google Scholar] [CrossRef]
  29. Vonshak, A.; Kancharaksa, N.; Bunnag, B.; Tanticharoen, M. Role of light and photosynthesis on the acclimation process of the cyanobacterium Spirulina platensis to salinity stress. J. Appl. Phycol. 1996, 8, 119–124. [Google Scholar] [CrossRef]
  30. Sudhir, P.-R.; Pogoryelov, D.; Kovacs, L.; Garab, G.; Murthy, S.D.S. The effects of salt stress on photosynthetic electron transport and thylakoid membrane proteins in the cyanobacterium Spirulina platensis. BMB Rep. 2005, 38, 481–487. [Google Scholar] [CrossRef] [PubMed]
  31. Markou, G.; Kougia, E.; Arapoglou, D.; Chentir, I.; Andreou, V.; Tzovenis, I. Production of Arthrospira platensis: Effects on growth and biochemical composition of long-term acclimatization at different salinities. Bioengineering 2023, 10, 233. [Google Scholar] [CrossRef]
  32. Jeppesen, E.; Beklioğlu, M.; Özkan, K.; Akyürek, Z. Salinization increase due to climate change will have substantial negative effects on inland waters: A call for multifaceted research at the local and global scale. Innovation 2020, 1, 100030. [Google Scholar] [CrossRef]
  33. Nosratimovafagh, A.; Esmaeili Fereidouni, A.; Krujatz, F. Effect of light spectrum, salinity, and glucose levels on Spirulina morphology. J. World Aquacult. Soc. 2023, 54, 1274–1286. [Google Scholar] [CrossRef]
  34. Wu, D.; Wang, S.; Liu, K.; Yu, X.; He, Y.; Wang, Z. Rapid measurement of morphological features of Spirulina microalgae filaments using microscopy and image processing algorithms. Biosyst. Eng. 2012, 112, 35–41. [Google Scholar] [CrossRef]
  35. Welsh, D.T. Ecological significance of compatible solute accumulation by micro-organisms: From single cells to global climate. FEMS Microbiol. Rev. 2000, 24, 263–290. [Google Scholar] [CrossRef]
  36. Hong, D.D.; Hoang, T.M.H.; Le, T.T.; Nguyen, C.H.; Le, A.H.; Ngo, T.H.T.; Nguyen, C.; Tang, D.Y.Y.; Show, P.L. Transcriptome analysis of Spirulina platensis sp. at different salinity and nutrient compositions for sustainable cultivation in Vietnam. Sustainability 2023, 15, 11906. [Google Scholar] [CrossRef]
  37. Vetoshkina, D.; Balashov, N.; Ivanov, B.; Ashikhmin, A.; Borisova-Mubarakshina, M. Light harvesting regulation: A versatile network of key components operating under various stress conditions in higher plants. Plant Physiol. Biochem. 2023, 194, 576–588. [Google Scholar] [CrossRef] [PubMed]
  38. Balasubramaniam, T.; Shen, G.; Esmaeili, N.; Zhang, H. Plants’ response mechanisms to salinity stress. Plants 2023, 12, 2253. [Google Scholar] [CrossRef] [PubMed]
  39. Kim, G.-H.; Lee, Y.J.; Kwon, J.-H. Relationship between harvesting efficiency and filament morphology in Arthrospira platensis Gomont. Microorganisms 2025, 13, 367. [Google Scholar] [CrossRef]
  40. Sinetova, M.A.; Kupriyanova, E.V.; Los, D.A. Spirulina/Arthrospira/Limnospira—Three names of the single organism. Foods 2024, 13, 2762. [Google Scholar] [CrossRef] [PubMed]
Figure 1. Effects of salinity on the growth of the Spirulina strain. (a) Optical density (OD) at 450 nm, a proxy for biomass, was measured every 2 days over a 20-day incubation period. Each panel represents a different salinity treatment (ranging from 10 to 45 ppt), with replicate cultures indicated by different symbols (●, ▲, ■, and +). (b) Bar plots showing the differences in maximum specific growth rate (d−1) across salinity treatments (10–45 ppt). Error bars represent standard errors.
Phycology 05 00031 g001
Figure 2. Effects of salinity on the productivity of the Spirulina strain. (a) Gross primary production (GPP) of Spirulina strain as a function of light intensity under different salinity treatments. Each panel represents a specific salinity level (10–45 ppt), showing the response of GPP (mg O2·L−1·d−1) to increasing light intensity (µmol photons·m−2·s−1). Black symbols (●, ▲, and ■) represent individual observations, while blue lines indicate fitted linear regressions with confidence intervals. (b) Bar plots showing the differences in photosynthetic efficiency of Spirulina strain across salinity treatments. Error bars represent standard errors.
Phycology 05 00031 g002
Figure 3. Effects of salinity on the size structure of the Spirulina strain. (a) Stacked bar plot showing the density (no. of filaments mL−1) classified into six size classes across salinity levels ranging from 10 to 45 ppt. (b) Principal Component Analysis (PCA) biplot illustrating the variation in size class structure across salinity treatments. Arrows represent the contribution of each size class to the principal components, while salinity treatments are projected as scores.
Phycology 05 00031 g003
Table 1. Average maximum specific growth rate (r, d−1) and carrying capacity (K, arbitrary unit) of Spirulina strain across salinity treatments. All values are reported as mean ± standard error (n = 4).
Salinity TreatmentsGrowth Rate (r, d−1)Carrying Capacity (K, a.u. 1)
10 ppt0.44 ± 0.050.18 ± 0.01
17 ppt0.19 ± 0.050.20 ± 0.01
22 ppt0.31 ± 0.080.18 ± 0.01
27 ppt0.39 ± 0.030.16 ± 0.01
31 ppt0.33 ± 0.070.17 ± 0.01
36 ppt0.35 ± 0.080.19 ± 0.01
40 ppt0.17 ± 0.020.29 ± 0.01
45 ppt0.16 ± 0.010.24 ± 0.01
1 arbitrary unit.
Disclaimer/Publisher’s Note: The statements, opinions and data contained in all publications are solely those of the individual author(s) and contributor(s) and not of MDPI and/or the editor(s). MDPI and/or the editor(s) disclaim responsibility for any injury to people or property resulting from any ideas, methods, instructions or products referred to in the content.

