Article

Chemical Characterisation of Sargassum Inundation from the Turks and Caicos: Seasonal and Post Stranding Changes

by
Birthe Vejby Nielsen
1,*,
John James Milledge
1,
Heidi Hertler
2,
Supattra Maneein
1,
Md Mahmud Al Farid
1 and
Debbie Bartlett
1
1
Faculty of Engineering and Science, University of Greenwich, Central Avenue, Chatham Maritime, Kent ME4 4TB, UK
2
Centre for Marine Resource Studies, The School for Field Studies, South Caicos TKCA 1ZZ, Turks and Caicos Islands
*
Author to whom correspondence should be addressed.
Phycology 2021, 1(2), 143-162; https://doi.org/10.3390/phycology1020011
Submission received: 11 November 2021 / Revised: 3 December 2021 / Accepted: 8 December 2021 / Published: 13 December 2021
(This article belongs to the Collection Sargassum Golden Tides, a Global Problem)

Abstract

:
The Turks and Caicos Islands (TCI) have been affected by sargassum inundations, with impacts on the economy and environment. Sargassum removal can be costly, but sargassum use and valorisation may generate income and offset environmental damage. A significant barrier to the valorisation of sargassum is insufficient knowledge of its chemical makeup, as well as its seasonal variation and decay after stranding. The chemical characterisation of mixed sargassum and its constituent species and morphotypes (S. natans I, S.natans VIII and S. fluitans) collected from TCI between September 2020 and May 2021 and changes in the composition of sargassum decaying (over 147 days) were studied. High ash (24.61–51.10% dry weight (DW)) and arsenic (49–217 mg kg−1) could severely hamper the use of this seaweed for food or feed purposes. Although there was some reduction in arsenic levels in decaying sargassum, levels remained high (>49 mg kg−1). Biomethane production by anaerobic digestion (AD) is a potential option. Nevertheless, the exploitation of sargassum for biogas, either fresh or as it decays on the beach, is challenging due to low methane yields (<42% of theoretical potential). Pre-treatment or co-digestion with other waste may be options to improve yield. The metal sorption ability of sargassum, which can be problematic, makes biosorption of pollutants an option for further research.

1. Introduction

Holopelagic sargassum, consisting of the species Sargassum fluitans and S. natans, floating in the open ocean is of extreme ecological importance [1,2,3,4]. Small beach strandings can have negligible negative impacts and can benefit dune stabilisation [1,2,4,5,6]. However, beaches across the Caribbean and the Gulf of Mexico have experienced massive inundations of pelagic sargassum since 2011, known as ‘golden tides’, significantly impacting the environment and the local economies heavily dependent on tourism [5,7,8,9,10,11,12,13]. The breakdown of this material on the beach can lead to offensive odours and can harm human health [9,14,15,16,17]. The removal of sargassum can be costly [2,4,5,18]. In a recent extensive review, Oxenford et al. [1] concluded that addressing this issue solely as a hazard is hugely costly, and attention is turning towards the potential opportunities for sargassum reuse and valorisation. Uses of this biomass are now being sought in order to offset collection and disposal costs and the adverse effects of dumping in landfills [5,18].
Many Caribbean islands are heavily dependent on fossil fuels, and alternative energy sources are being sought [19,20,21]. Sargassum biomass may be a potential source of biogas energy via anaerobic digestion. However, several barriers need to be overcome. One of the most significant identified by Oxenford et al. [1] is insufficient knowledge of the chemical components, including potential toxins and pollutants and their variability.
The Turks and Caicos Islands (TCI) has been affected by sargassum with impacts on the tourist economy and the environment [13]. Sargassum from TCI was previously briefly examined for chemical composition and methane potential. Although this study highlighted the potential problem of high arsenic levels and low methane yield from sargassum as a sole feedstock, it did not examine seasonal and post-stranding changes [22]. This study examines seasonal and post-stranding changes in the chemical composition and methane potential of sargassum collected from TCI.

2. Materials and Methods

2.1. Sample Collection and Preparation

Samples were collected from Shark Bay, South Caicos, the Turks and Caicos Islands (21.491 N, 71.503 W) between September 2020 and May 2021. Samples (sargassum and associated material) were collected nearshore before stranding on the beach. The samples were then allowed to drain in a collection basket with 1 cm × 2.5 cm openings for 5 min. A sample of mixed material (A) was taken. Samples of the three dominant species and morphotypes of sargassum (S. natans VIII (B), S. natans I (C) and S. fluitans (D)) were separated using an identification chart (Figure 1).
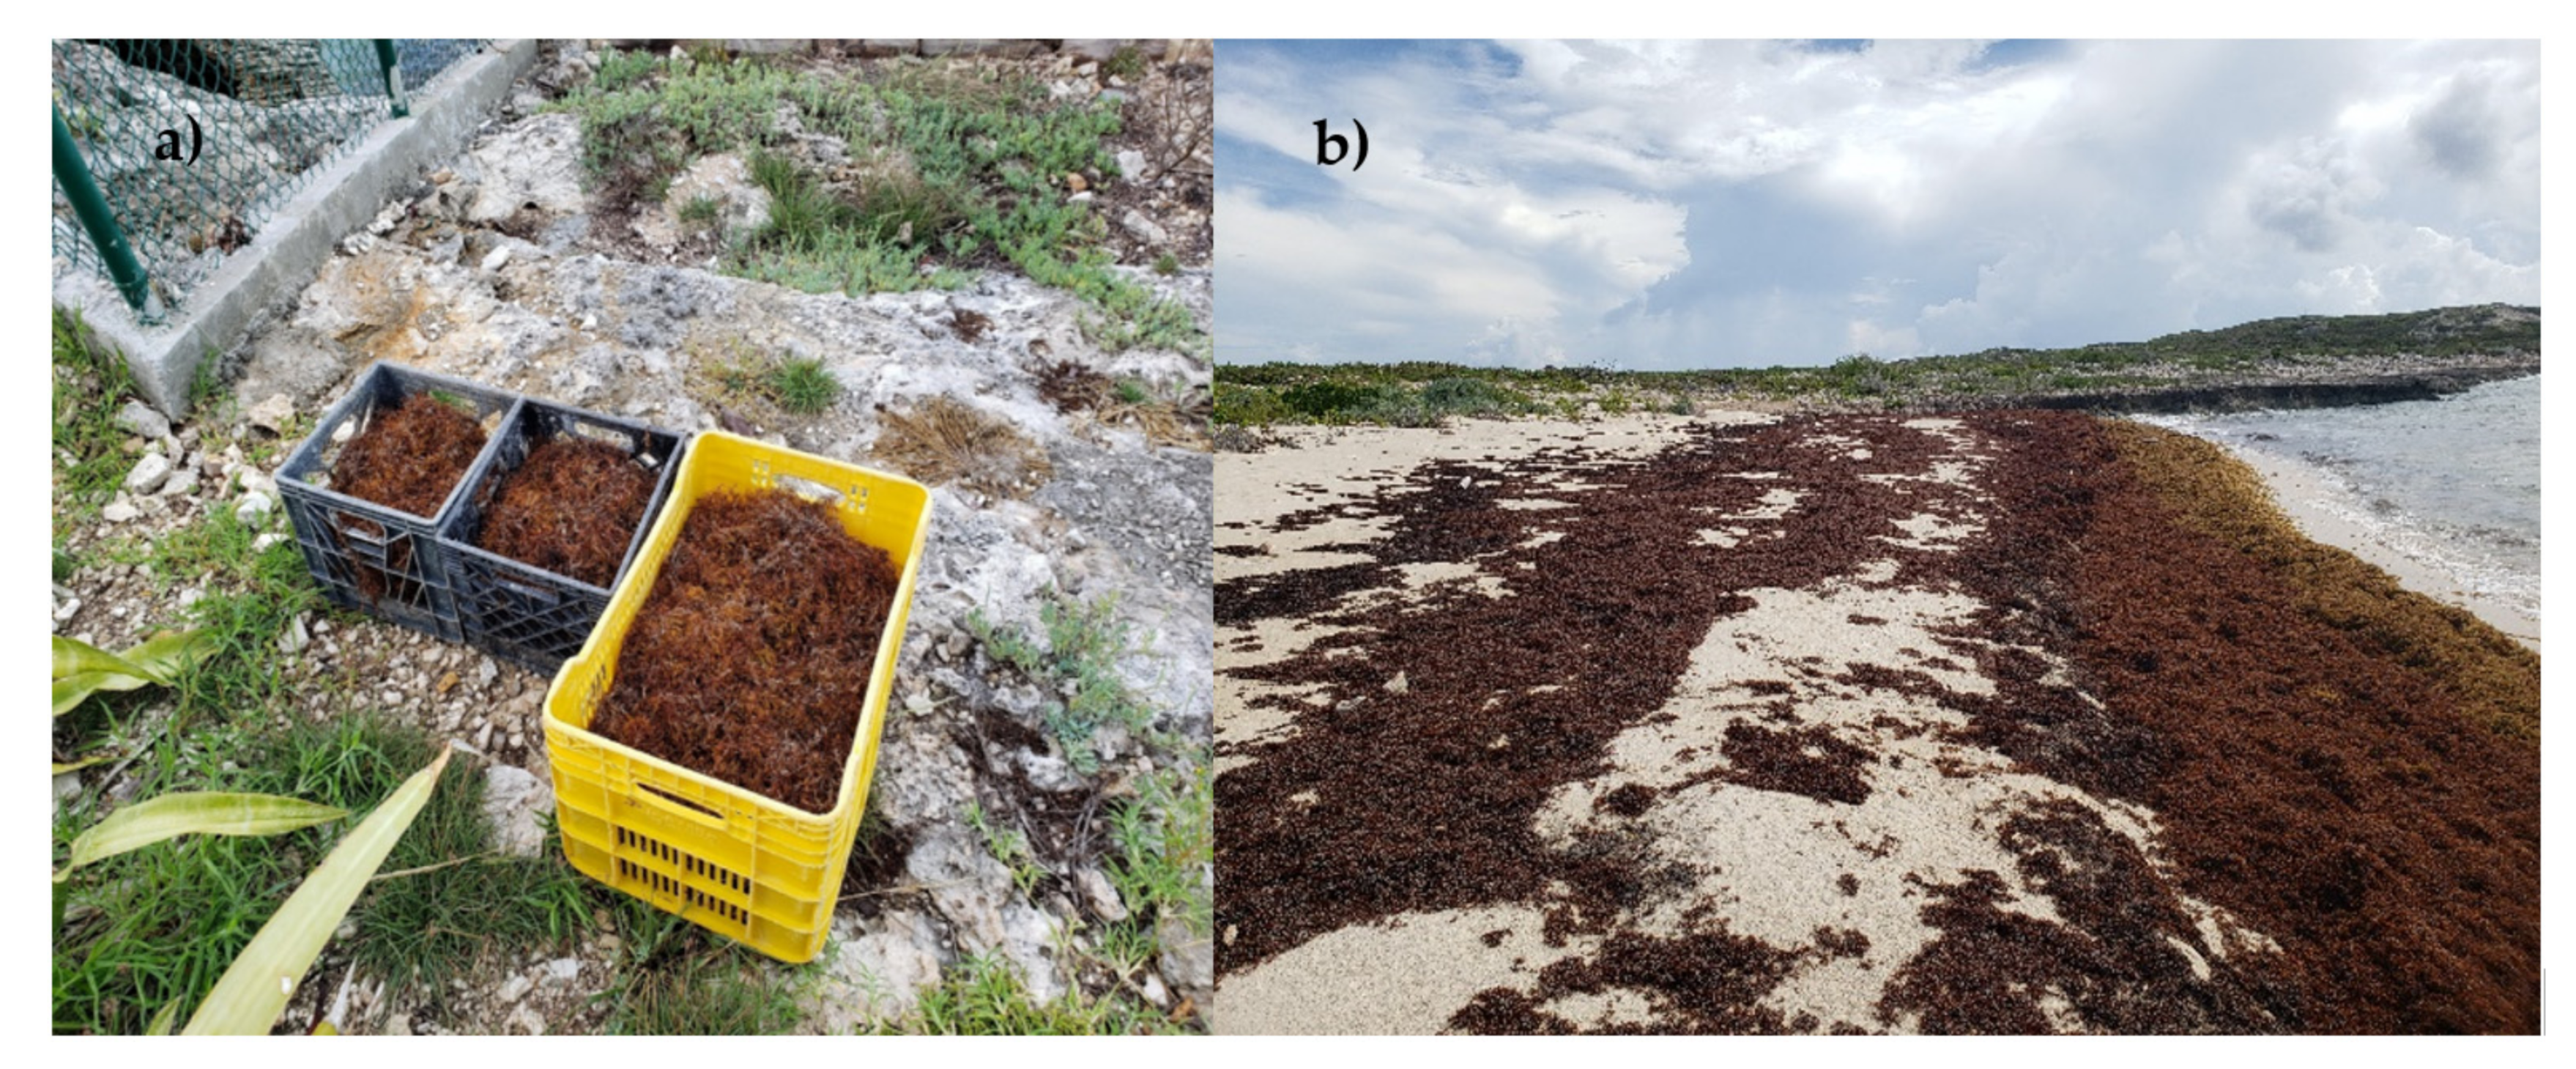
To mimic and monitor the degradation of sargassum stranded on the beach, freshly collected, unsorted sargassum was placed in a perforated, yellow plastic basket (Figure 2) (38 cm × 60 cm) to a 30 cm depth and left exposed to the elements for 147 days. For compositional analysis, samples were taken at 0, 26, 54, 116 and 147 days.
Separated fresh, mixed fresh, and basket samples were freeze-dried (Harvest Right HRFD-PMed-SS, Salt Lake City, UT, USA). Samples were frozen to −40 °C. During the drying phase, trays were warmed to 52 °C at <66 Pa for 26 h. At the end of this process, samples were double-bagged and shipped via air to the University of Greenwich, UK.

2.2. Compositional Analyses

2.2.1. Moisture

Moisture content was assessed following the British Standards simplified oven-drying method (105 °C, 24 h) [23]. All measurements were analysed in triplicate. The moisture content was used to adjust data, where appropriate, to a dry weight (DW) basis.

2.2.2. Ash

The British Standards method (550 °C, 2 h) was used to analyse the ash content of oven-dried samples [24]. All measurements were carried out in triplicate.

2.2.3. Carbon, Hydrogen, Nitrogen (CHN) and Protein Content

The carbon, hydrogen and nitrogen content of the freeze-dried seaweed samples was determined by flash dynamic combustion (Flash EA1112 CHN Elemental Analyser). The oxygen content was calculated by difference. A mean is reported from a minimum of two determinations per sample. The protein content was estimated by multiplying nitrogen percentage by an N-factor of 4.1, previously found to be the most appropriate for sargassum [22,25]. Bladderwrack (Fucus vesiculosus) was used as reference material (Coefficient of variance (%CV) was 1%, H 3.4% and 17% for N).

2.2.4. Higher Heating Value

The HHV was calculated using a modified ‘DuLong equation’ from the elemental analysis [26,27].

2.2.5. Total Lipid Content

Lipid content was determined using the method of Matyash et al. [28]. Briefly, deionised (DI) water methanol (MeOH) and methyl tert-butyl ether (MTBE) were added to 0.1 g of freeze-dried biomass in a ratio of 1:3:10. The mixture was sonicated (1 min) and incubated (1 h, room temperature). Then, DI water (1.5 mL) was added (MeOH:MTBE:H2O ratio of 3:10:2.5 (v/v/v)) to induce the phase separation. Following centrifugation (10 min, 1000× g), the upper organic phase was collected, and the lower phase was re-extracted, repeating the process listed above. The upper phase of the second extraction was collected and combined with the upper phase from the first extraction. Yields were determined gravimetrically. Determinations were performed in biological triplicate, and the results were adjusted for the moisture content. The mean and standard deviation are reported on a dry-weight (DW) basis for each sample.

2.2.6. Phenolic Content

Polyphenolic extractions and quantifications were performed on samples in triplicate using aqueous acetone (60%) as the extracting solvent (solid-solvent ratio 1:200). The extracts were incubated in a shaking incubator (New Brunswick Scientific, Innova®, Edison, NJ, USA) (250 rpm, 1 h, 40 °C), then centrifuged (21,000× g, 4 °C, 20 min). The supernatant was collected, and the extraction process was repeated on the pellet three more times. Polyphenolic quantification was carried out at room temperature following a modified protocol of the Folin–Ciocalteu (FC) method [29]. Briefly, Folin–Ciocalteu reagent (125 µL, 0.2 N) was added to the sample (250 µL, diluted with 375 µL deionised water). A total of 20% Na2CO3 (250 µL) was added after 2 min of incubation. The absorbance was measured at 750 nm (UV-visible spectrophotometer, Jenway 6305, Fisher Scientific, Loughborough, UK) after incubation for 30 min in the dark. Phloroglucinol was used as the standard to generate a calibration curve, and results are expressed as mg phloroglucinol equivalent (PG eq).

2.2.7. Arsenic and Heavy Metals

Aluminium, arsenic, cadmium, chromium and lead content in the freeze-dried biomass was determined by the UKAS laboratory, Premier Analytical Services (Lincoln Road, High Wycombe, Bucks, HP12 3QS, UK) using the UKAS accredited methods previously described by Milledge et al. [22]. Inorganic arsenic (the sum of As(III) and As(V)) content was determined by ICP-MS using a UKAS accredited method, also by Premier Analytical Services.

2.3. Methane Potential

2.3.1. Theoretical Methane Potential

The theoretical methane potential for the mixed samples was calculated from the elemental analysis using the ‘Buswell equation’ [30,31], and gas volumes were normalised (100 kPa, 0 °C, dry gas). The ratio of the MP to the theoretical methane yields, expressed as a percentage, is referred to as the biodegradability index (BI) [32,33].

2.3.2. Methane Potential Determination

The methane potential (MP) of the freeze-dried mixed sargassum samples were analysed using an Automatic Methane Potential Test System II (AMPTS II, Bioprocess Control, Lund, Sweden).
The inoculum was collected from the internal recirculation granular sludge anaerobic digester of Smurfit Kappa Townsend Hook Paper Makers (Mill Street, Snodland, Kent, UK) used to treat liquid waste from the paper industry. After collection, the inoculum was purged with nitrogen gas and left for 24 h at 35 °C.
Three experimental replicates using the equivalent of 1 g of volatile solids at an inoculum-to-substrate VS. ratio of 9:1 were carried out, together with three controls containing no substrate but containing inoculum. Methane volume, pressure and temperature data were recorded continuously, and gas volumes were normalised (100 kPa, 0°, dry gas).

2.3.3. Statistical Analysis

Excel 2021 (Microsoft Office) was used for one-way ANOVAs, t-tests and other statistical analyses. One-way ANOVAs and t-tests were conducted to compare the effect of season on methane potential (MP).
IBM SPSS Statistics 25 SPSS was used to determine the coefficient of correlation (R) between phenolic content and MP; lipid content and MP; the interaction of phenolic and lipid content on MP and lipid content; and theoretical methane yield.

3. Results

3.1. Composition

Proximate and ultimate analyses (October 2020 to May 2021) of sargassum samples are shown in Table 1.
Proximate and ultimate analyses of sargassum samples for the for the sargassum samples stored on the beach are shown in Table 2.
The ash content in the four seaweed samples ranged between 24.61 and 51.10% DW, with the highest ash content for S. fluitans in January 2020. Ash content in the basket samples did not change between day 0 and day 147; however, it was lower in the decaying seaweed at days 26, 54 and 116. The calculated HHV of the sargassum varied between 6.3 and 12.2 MJ kg−1 DW. The HHV of the basket residues appears to increase initially during decay; they then drop back and remain stable.

3.1.1. Protein Content

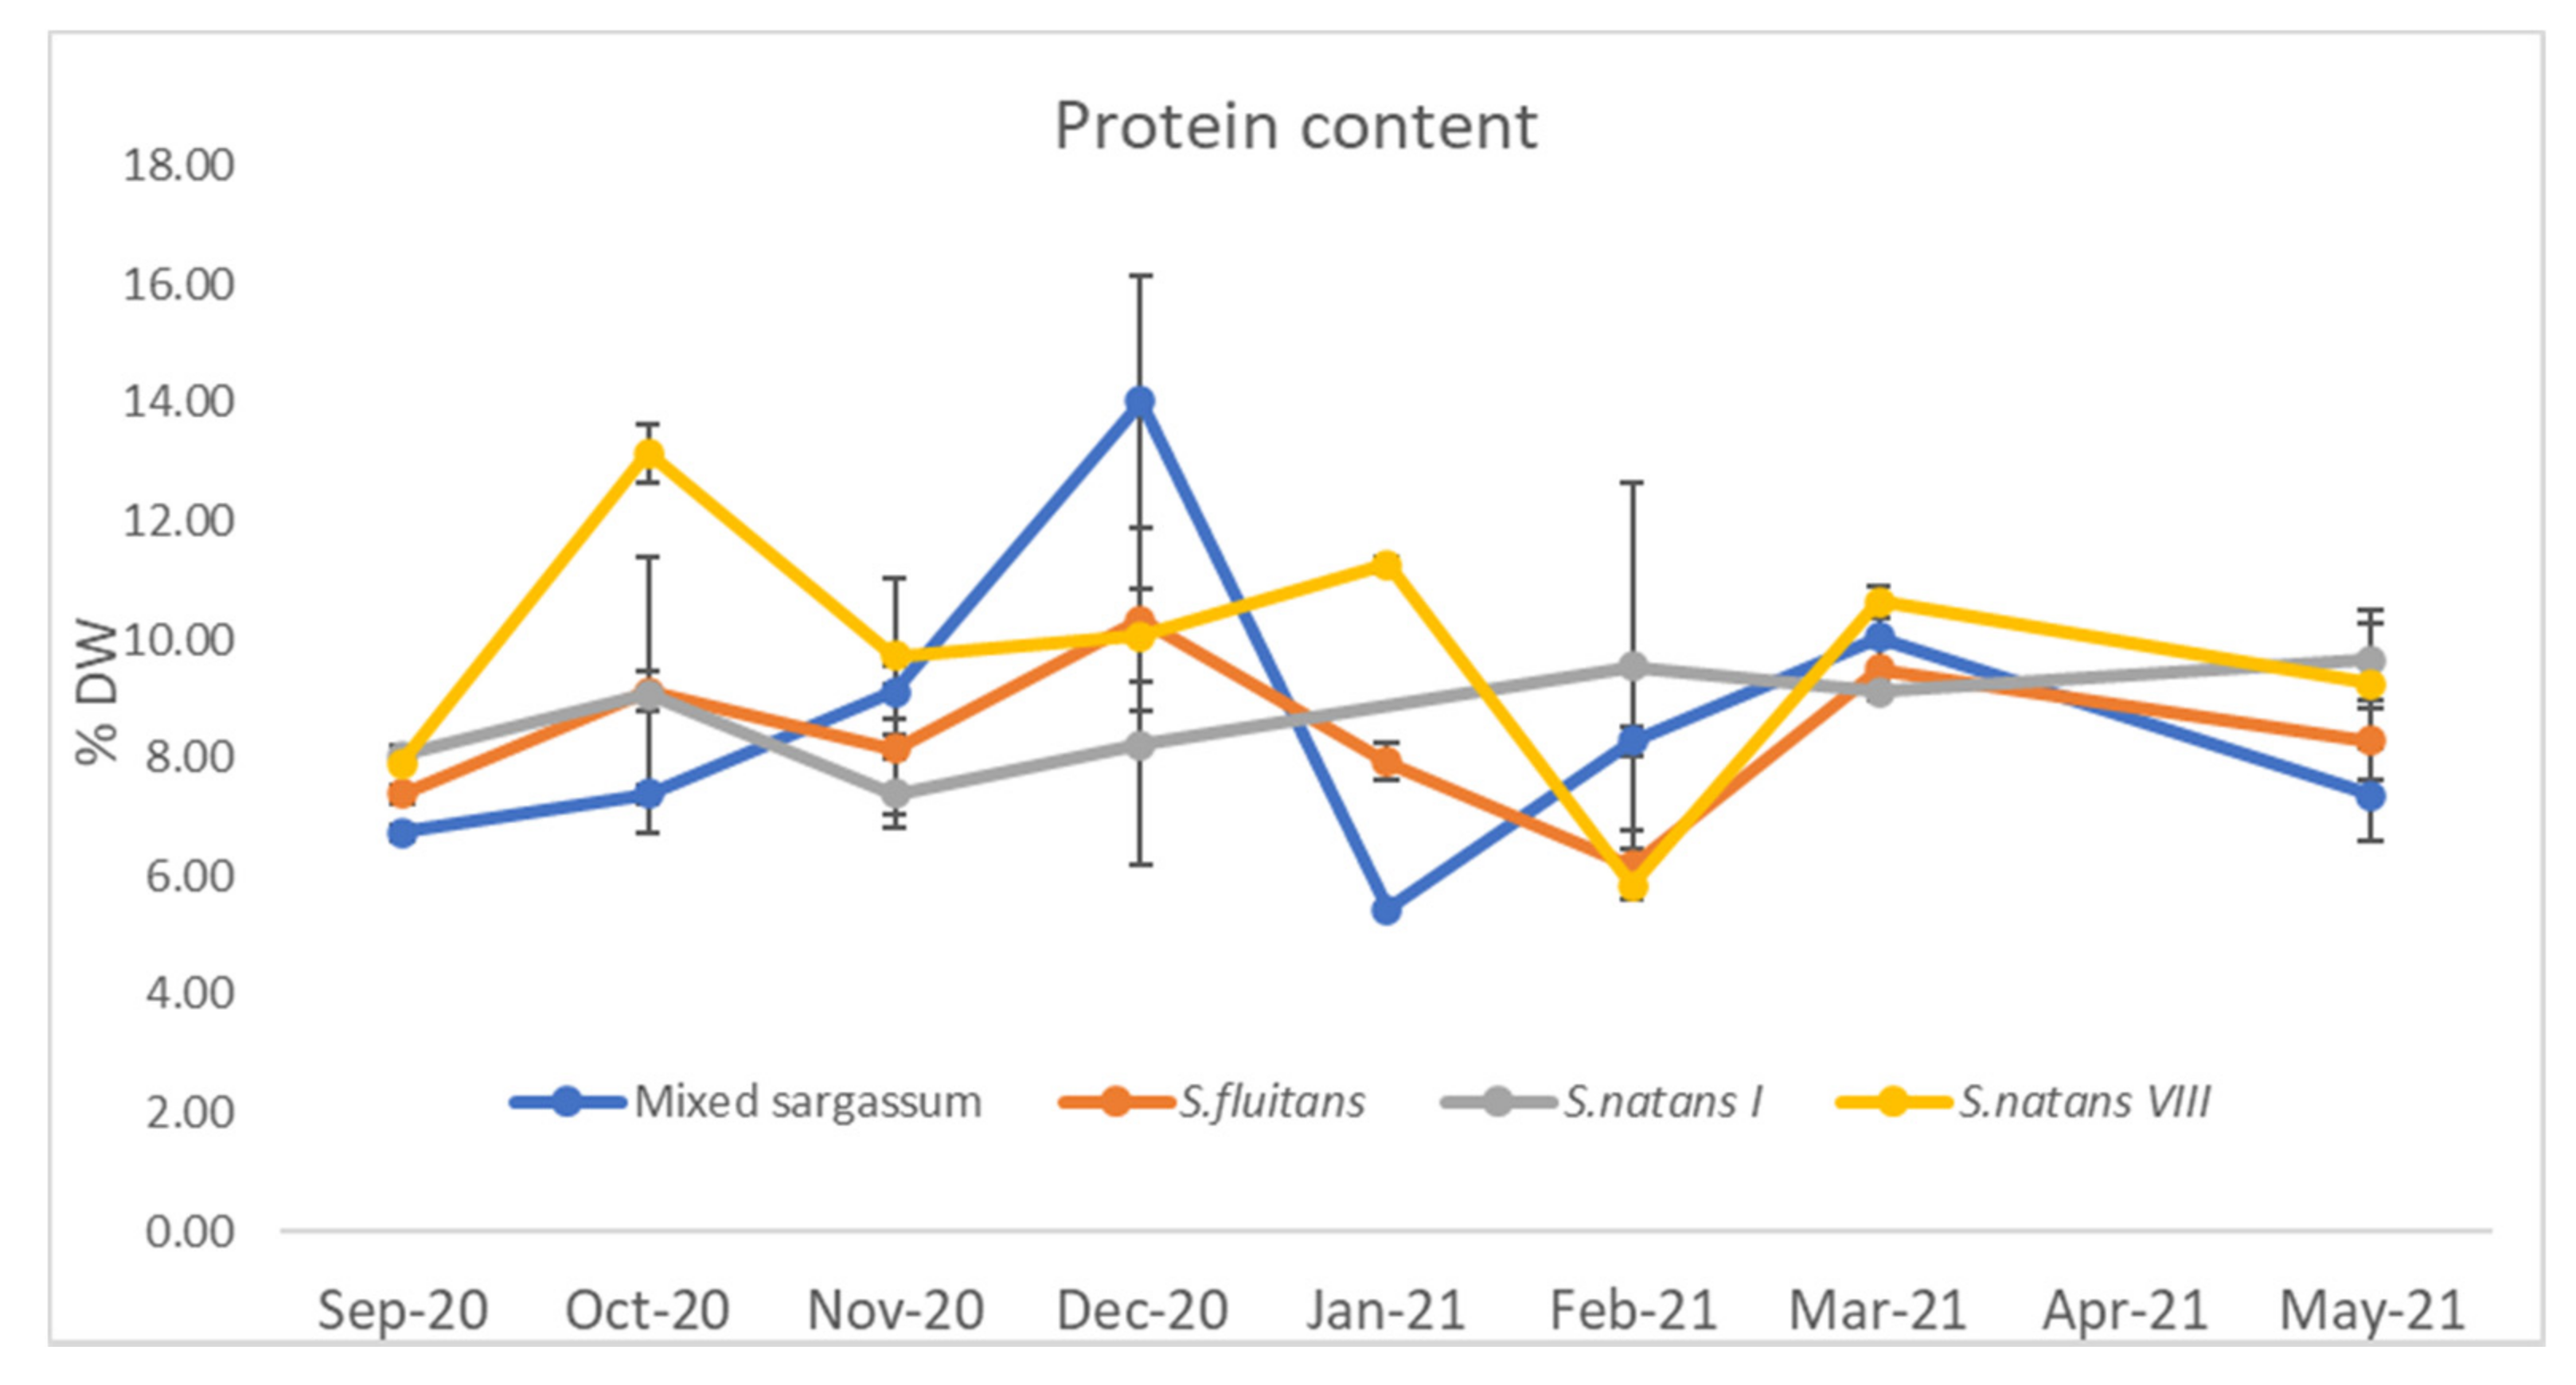
The protein content of the sargassum samples is shown in Figure 3 and ranged, among the species, from 5.2 to 12.7% over the 9 months.

3.1.2. Lipid Content

The lipid content (Figure 4) over 9 months in the four sargassum samples remained somewhat consistent, except for a statistically significant increase in the slightly colder months of January and February for the mixed sample (p < 0.001) and both morphotypes of S. natans (p < 0.001), as well as for S. fluitans between December and February (p < 0.001).

3.1.3. Phenolic Content

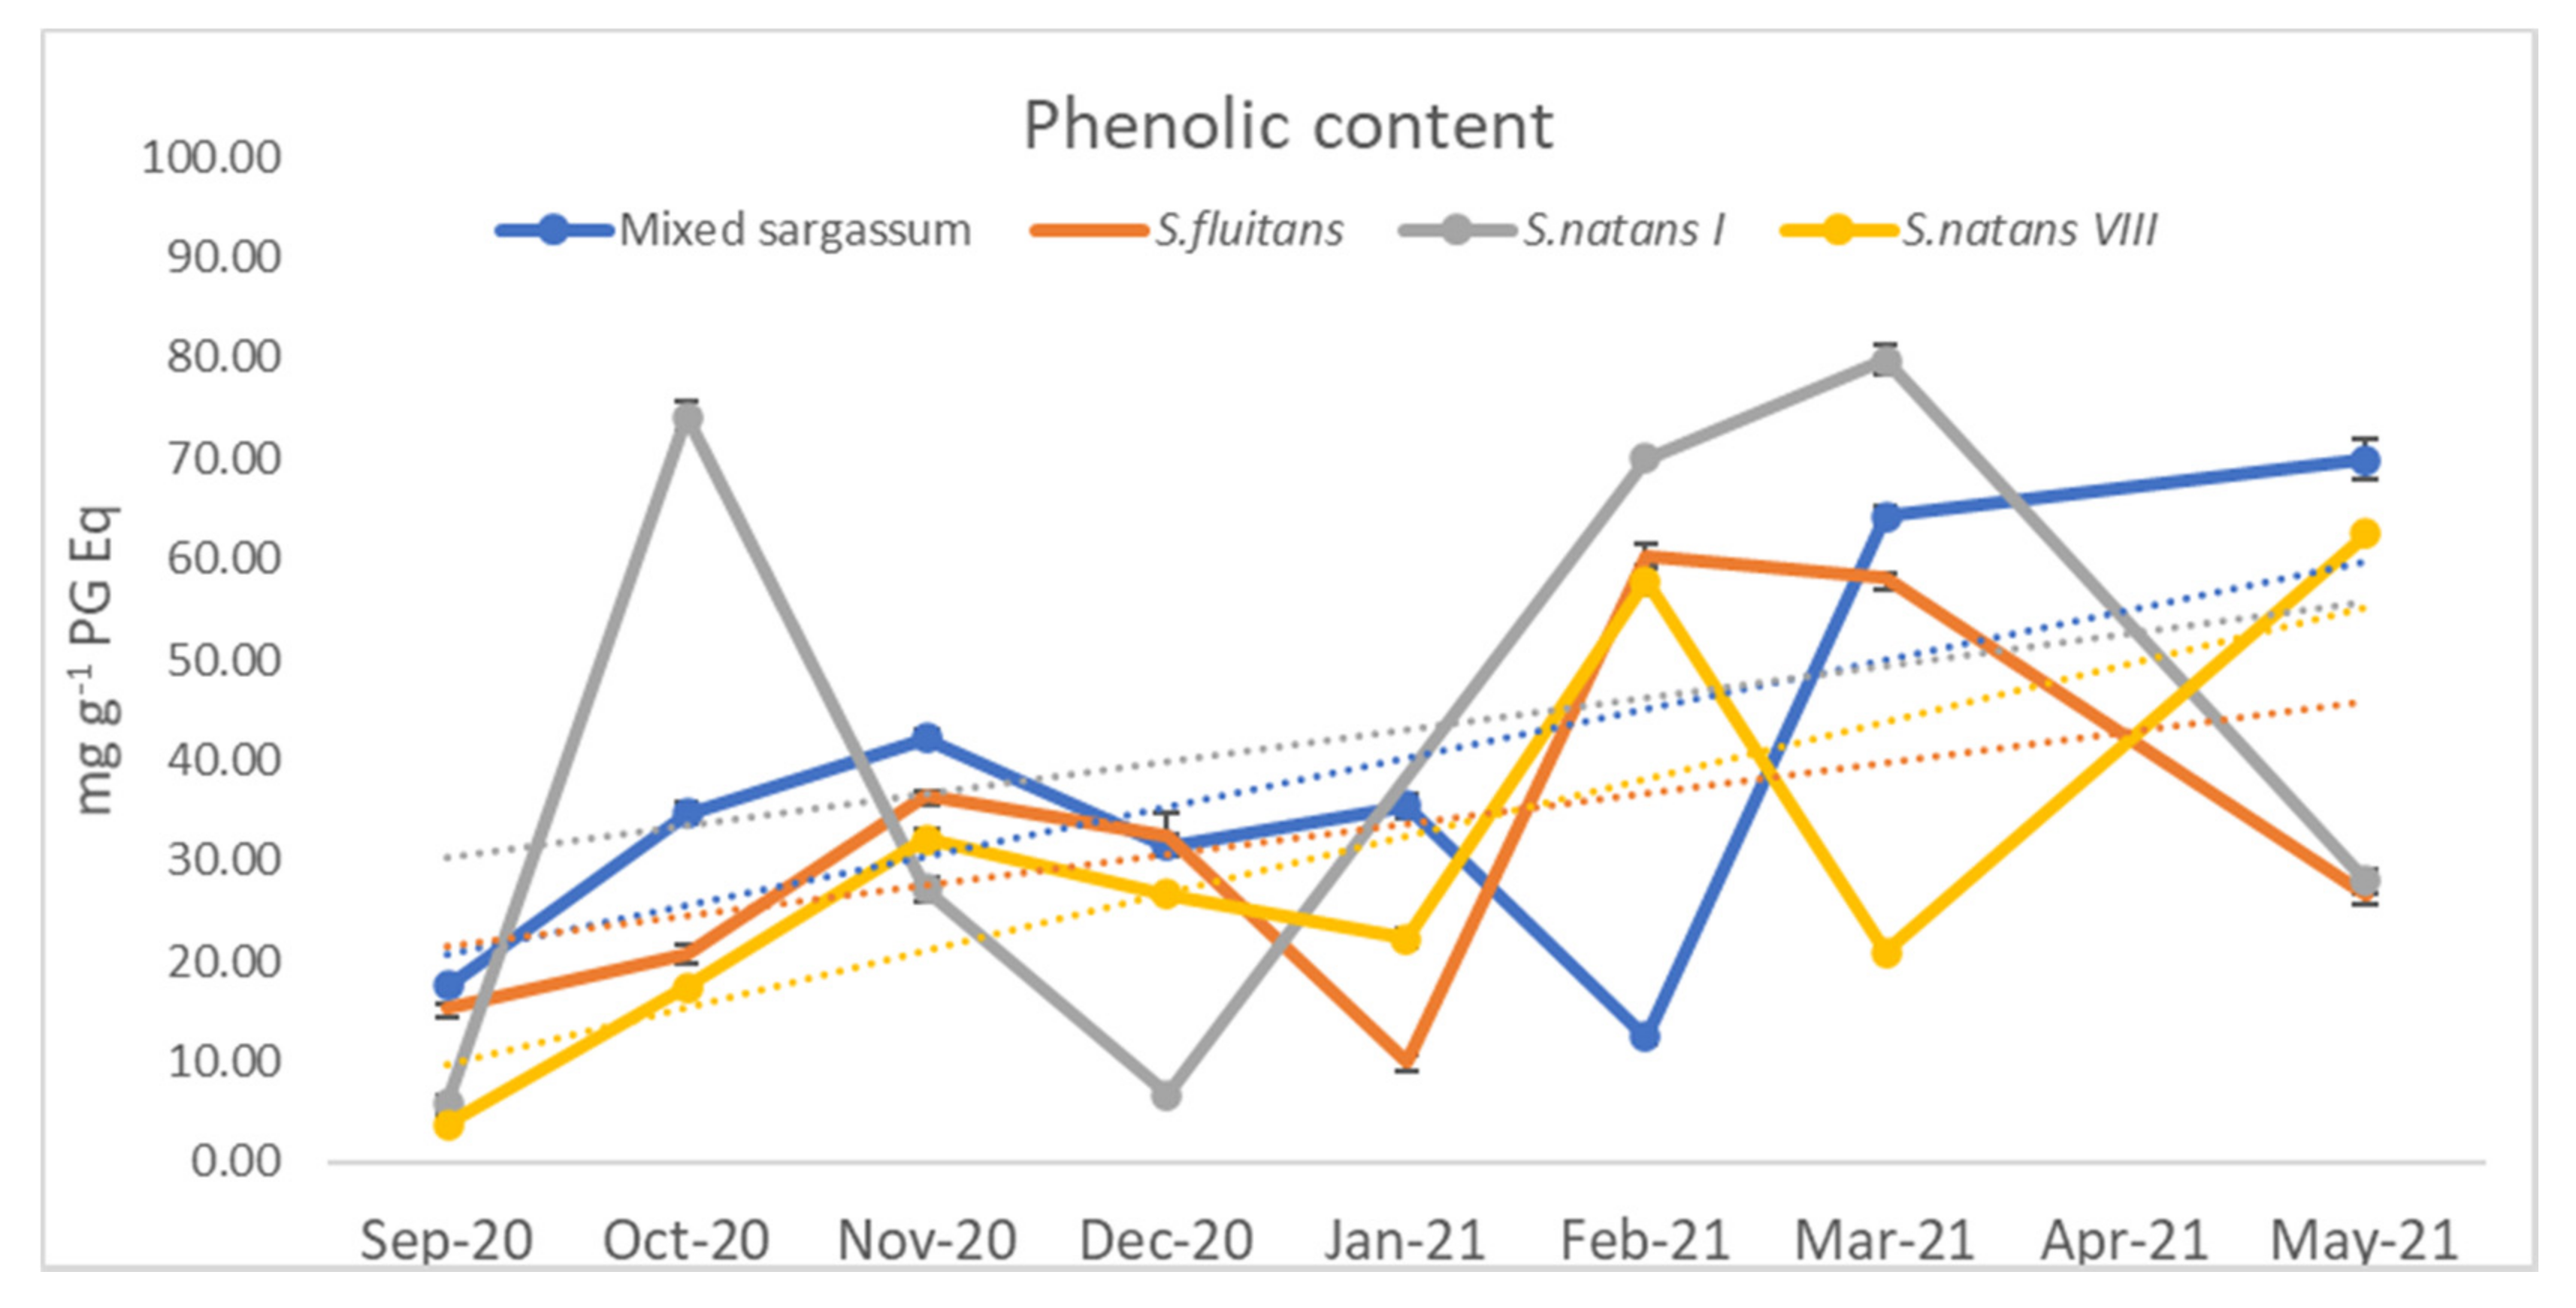
The phenolic content of the sargassum samples is shown in Figure 5. The content ranges from 10.02 to 60.30 mg g−1 PG Eq in the S. fluitans samples and from 5.90 to 74.16 and 3.80 to 62.46 mg g−1 PG Eq in the two S. natans samples.
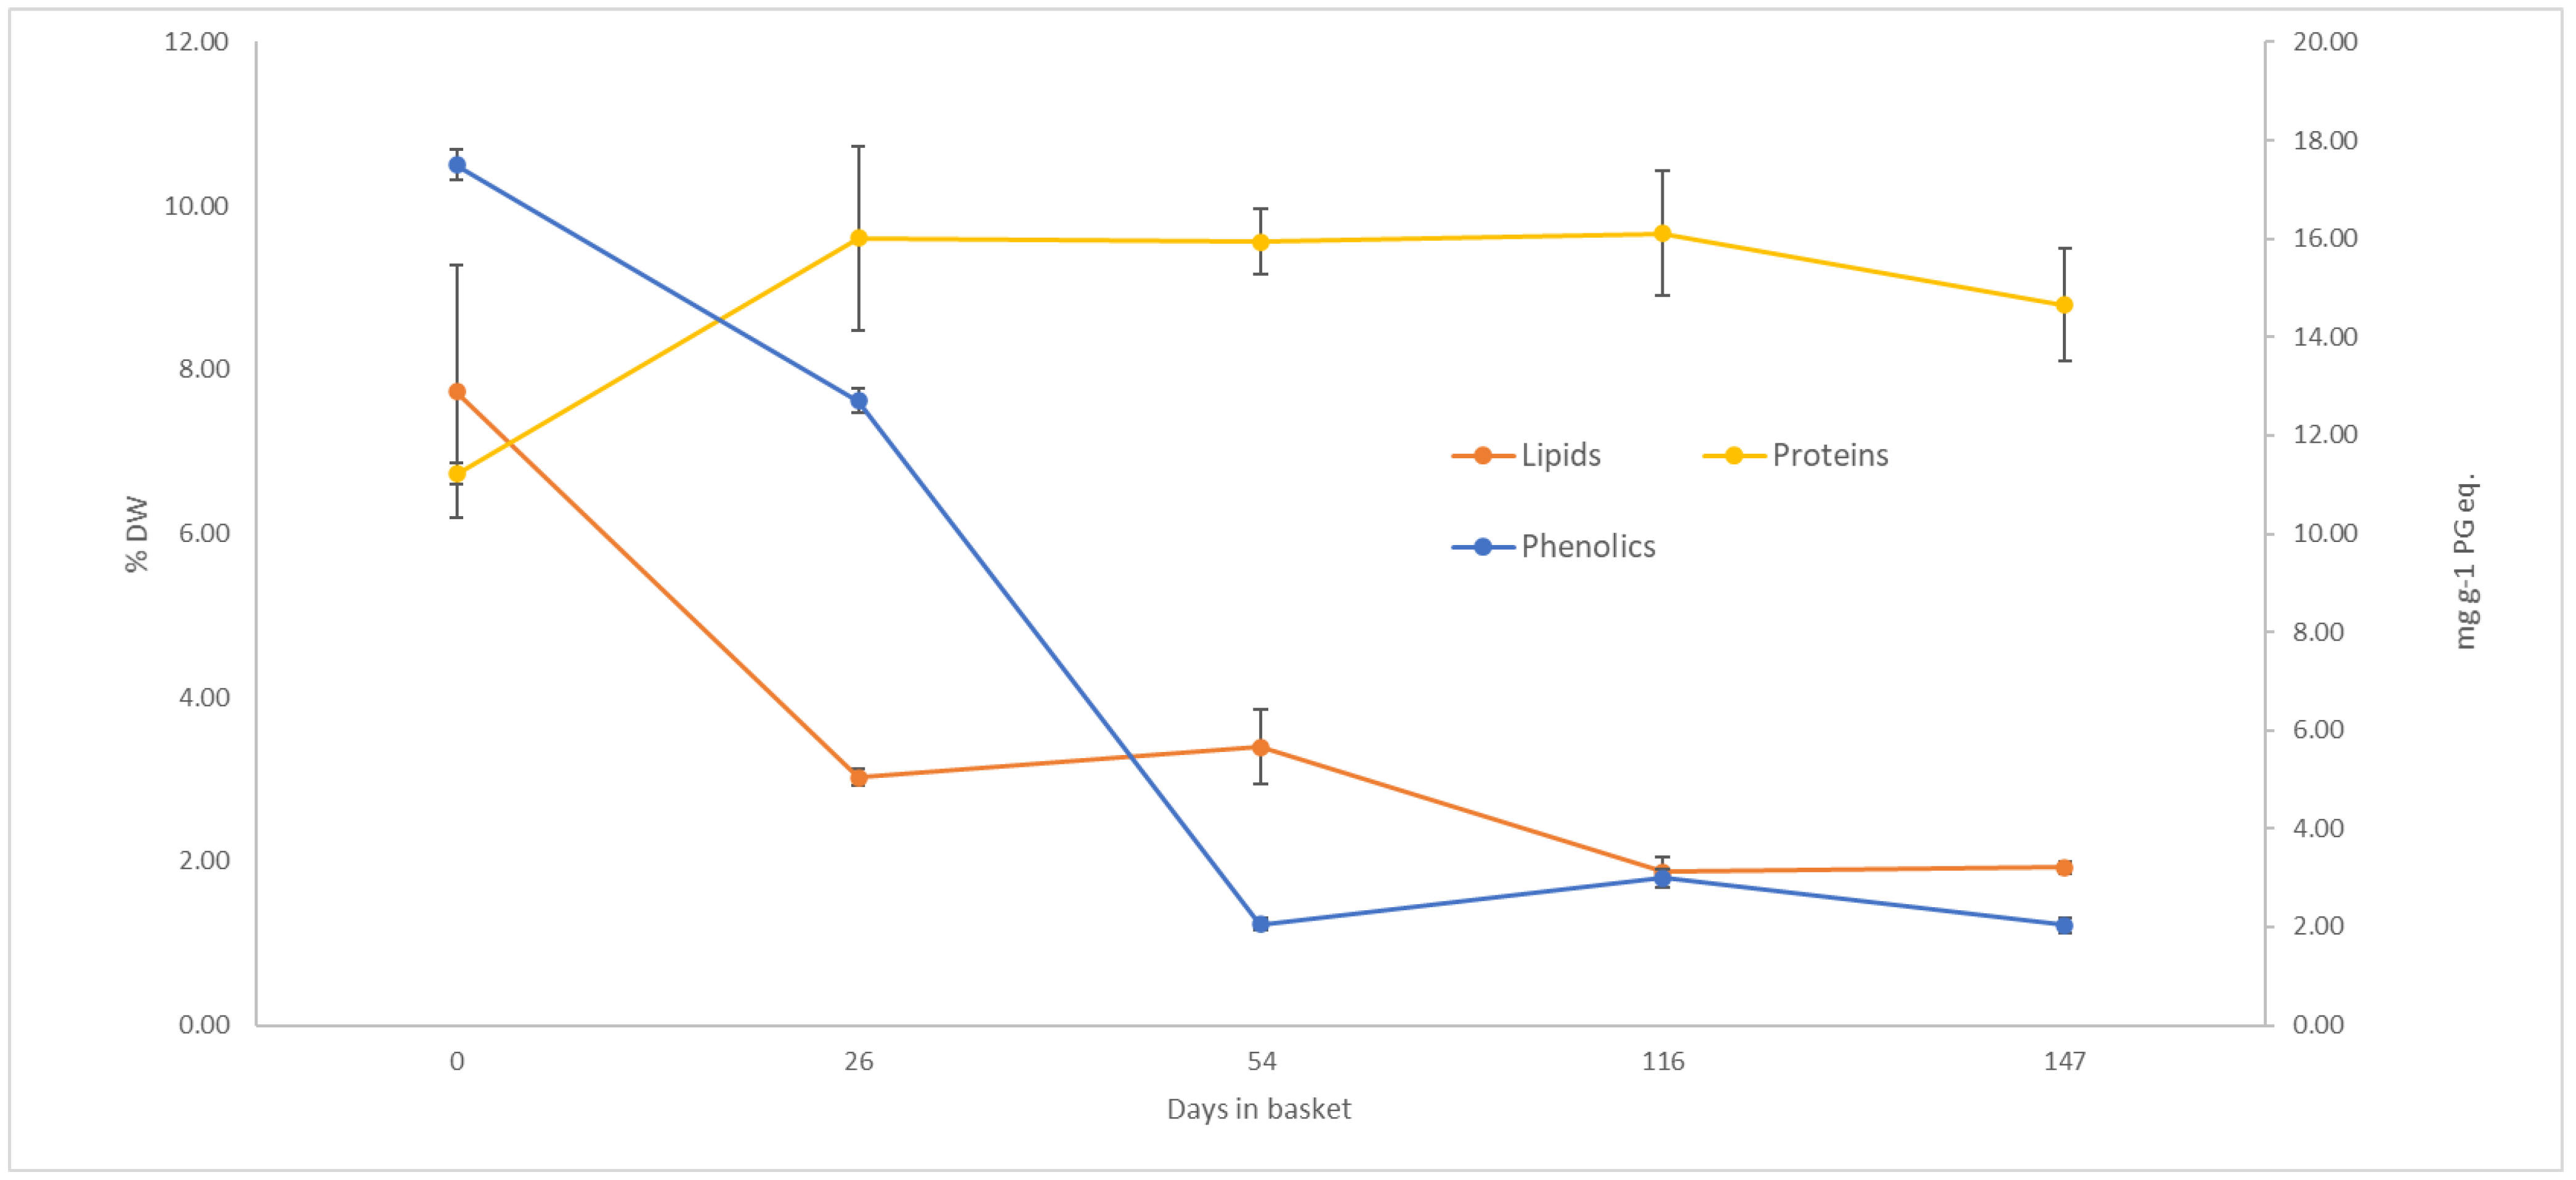
The changes in the phenolic, lipid and protein contents of the ‘decaying’ mixed sargassum samples stored in a basket exposed to the elements are shown in Figure 6. The levels of phenolics and lipid decline with storage time, whilst protein remains at a somewhat constant level.

3.1.4. Arsenic and Heavy Metals

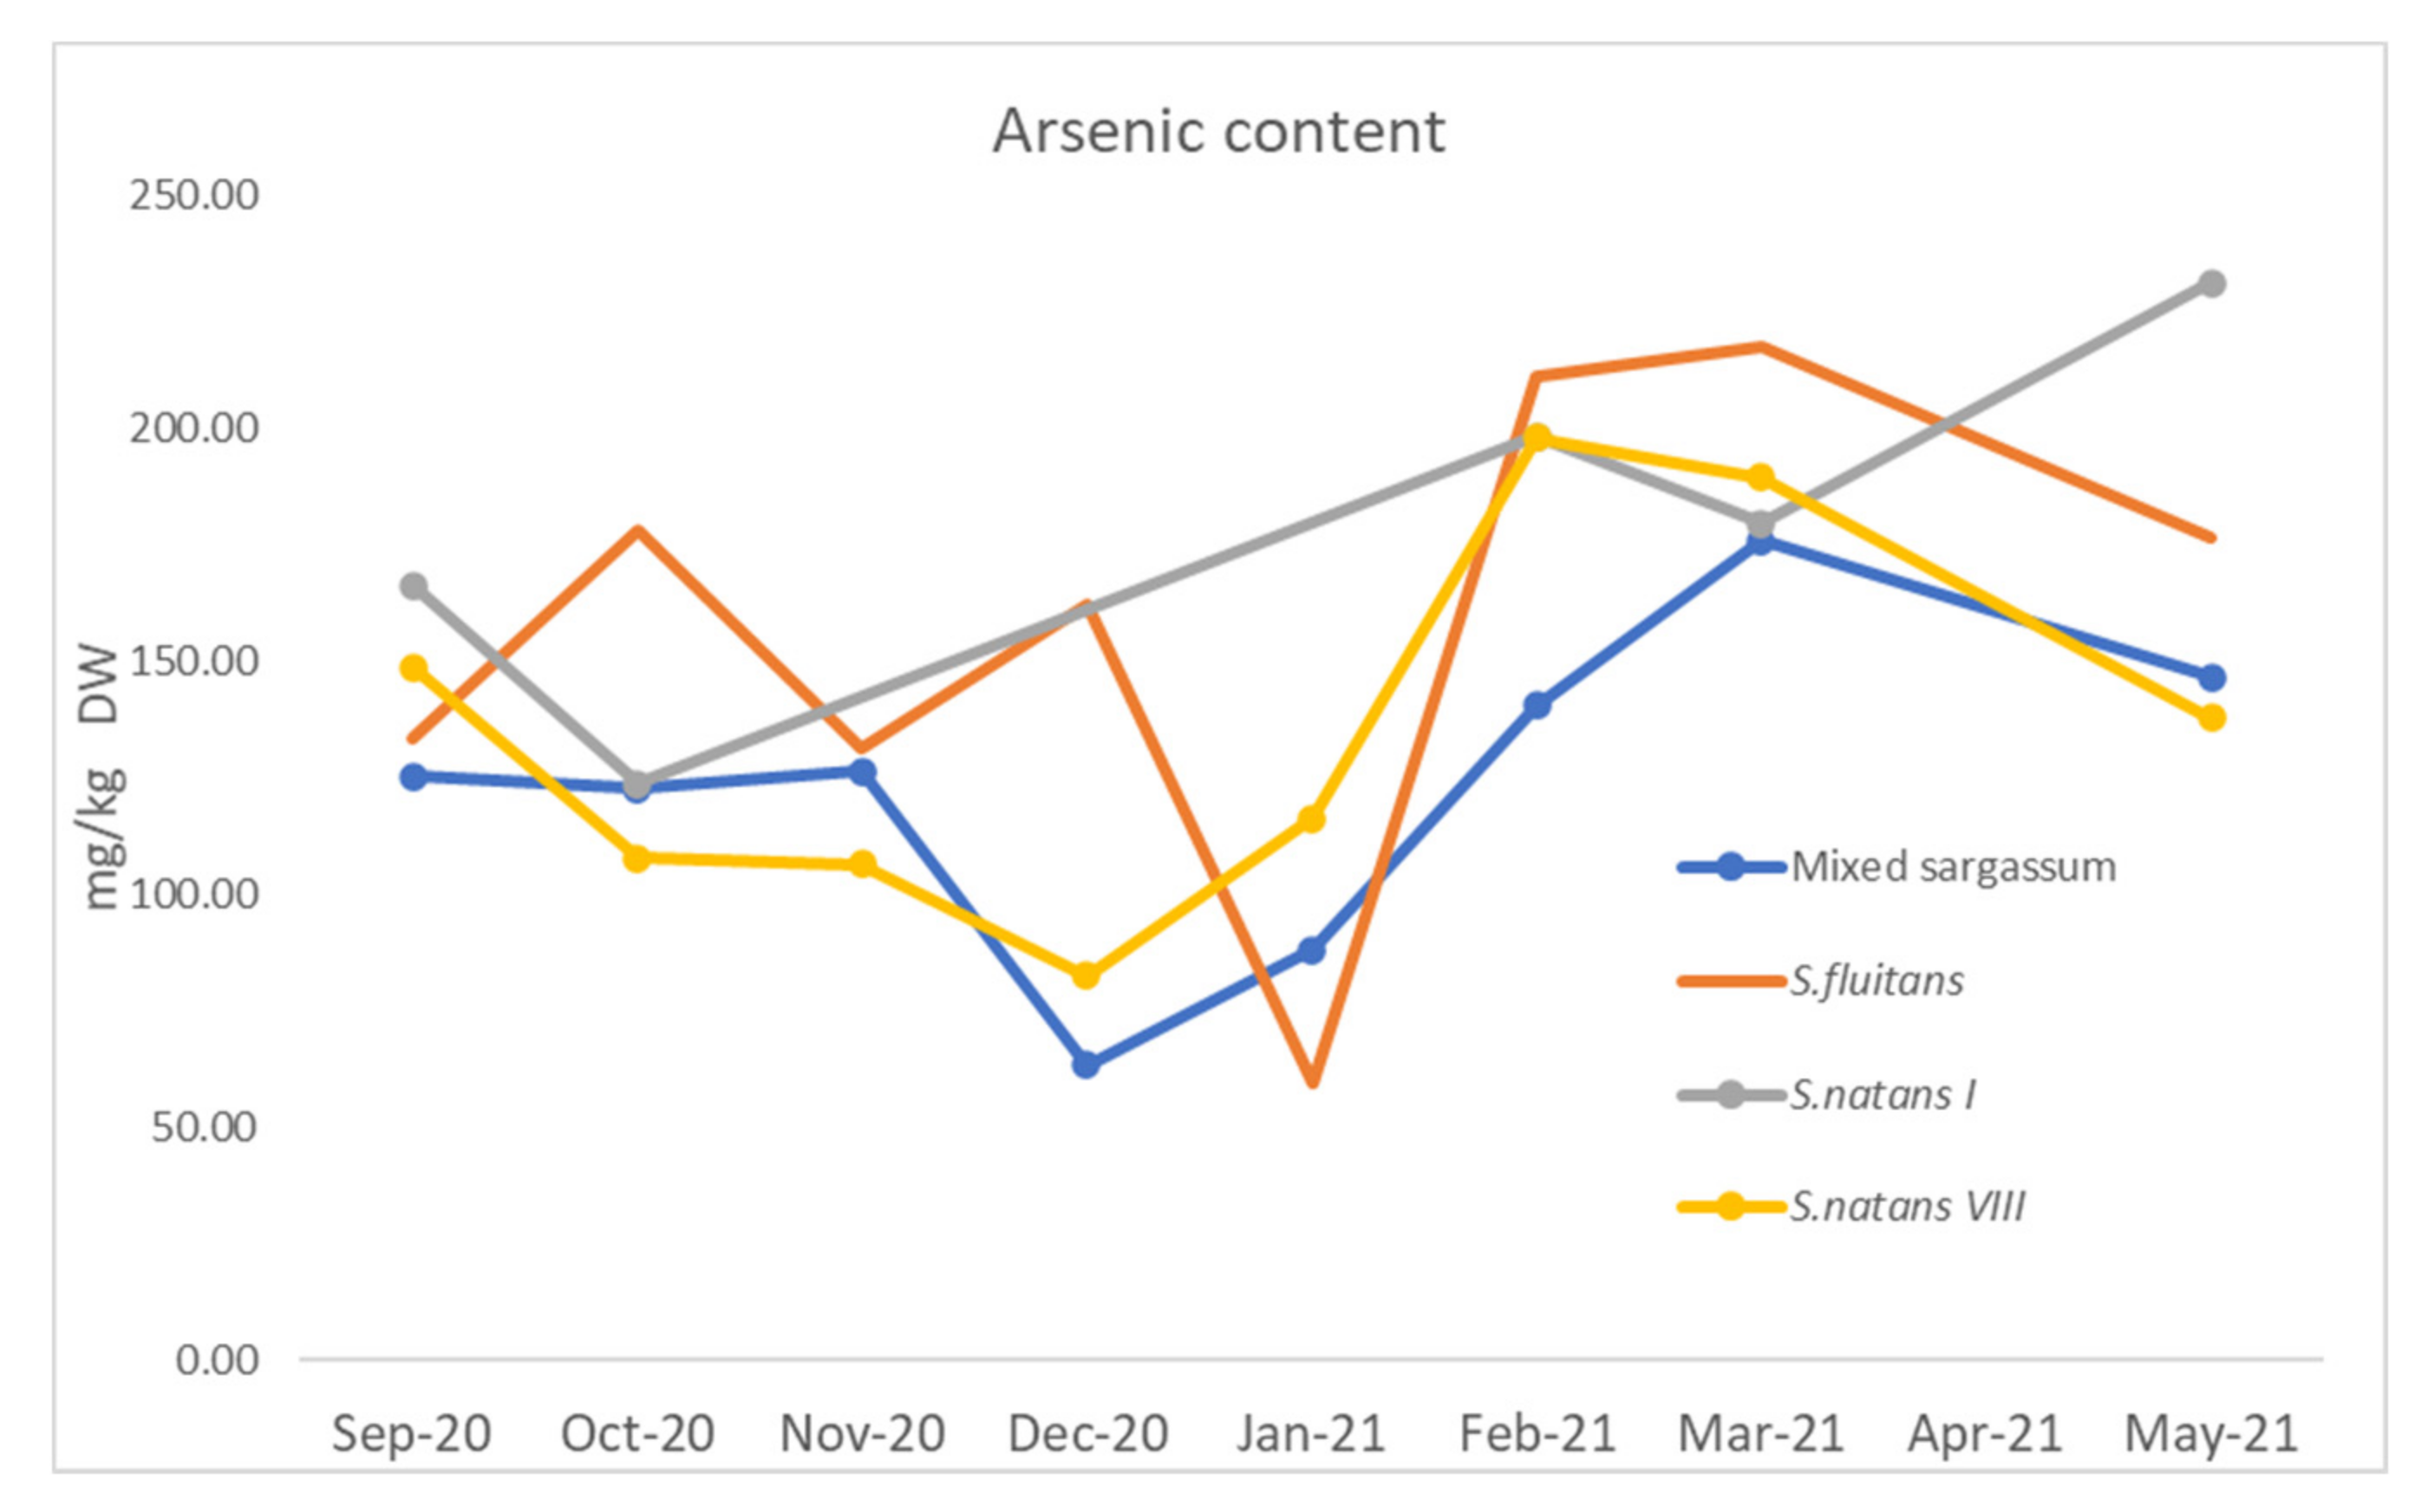
The range of levels of aluminium, arsenic, cadmium, chromium and lead in sargassum over 9 months of sampling are given in Table 3. Levels of cadmium, chromium and lead are below or just above the detection limits (0.05–0.09 mg/kg). Aluminium and arsenic and levels are substantially greater, and the seasonal variations are plotted in Figure 7 and Figure 8.
The levels of aluminium, arsenic, cadmium, chromium and lead in sargassum in the ’decaying’ mixed sargassum samples are shown in Table 4.
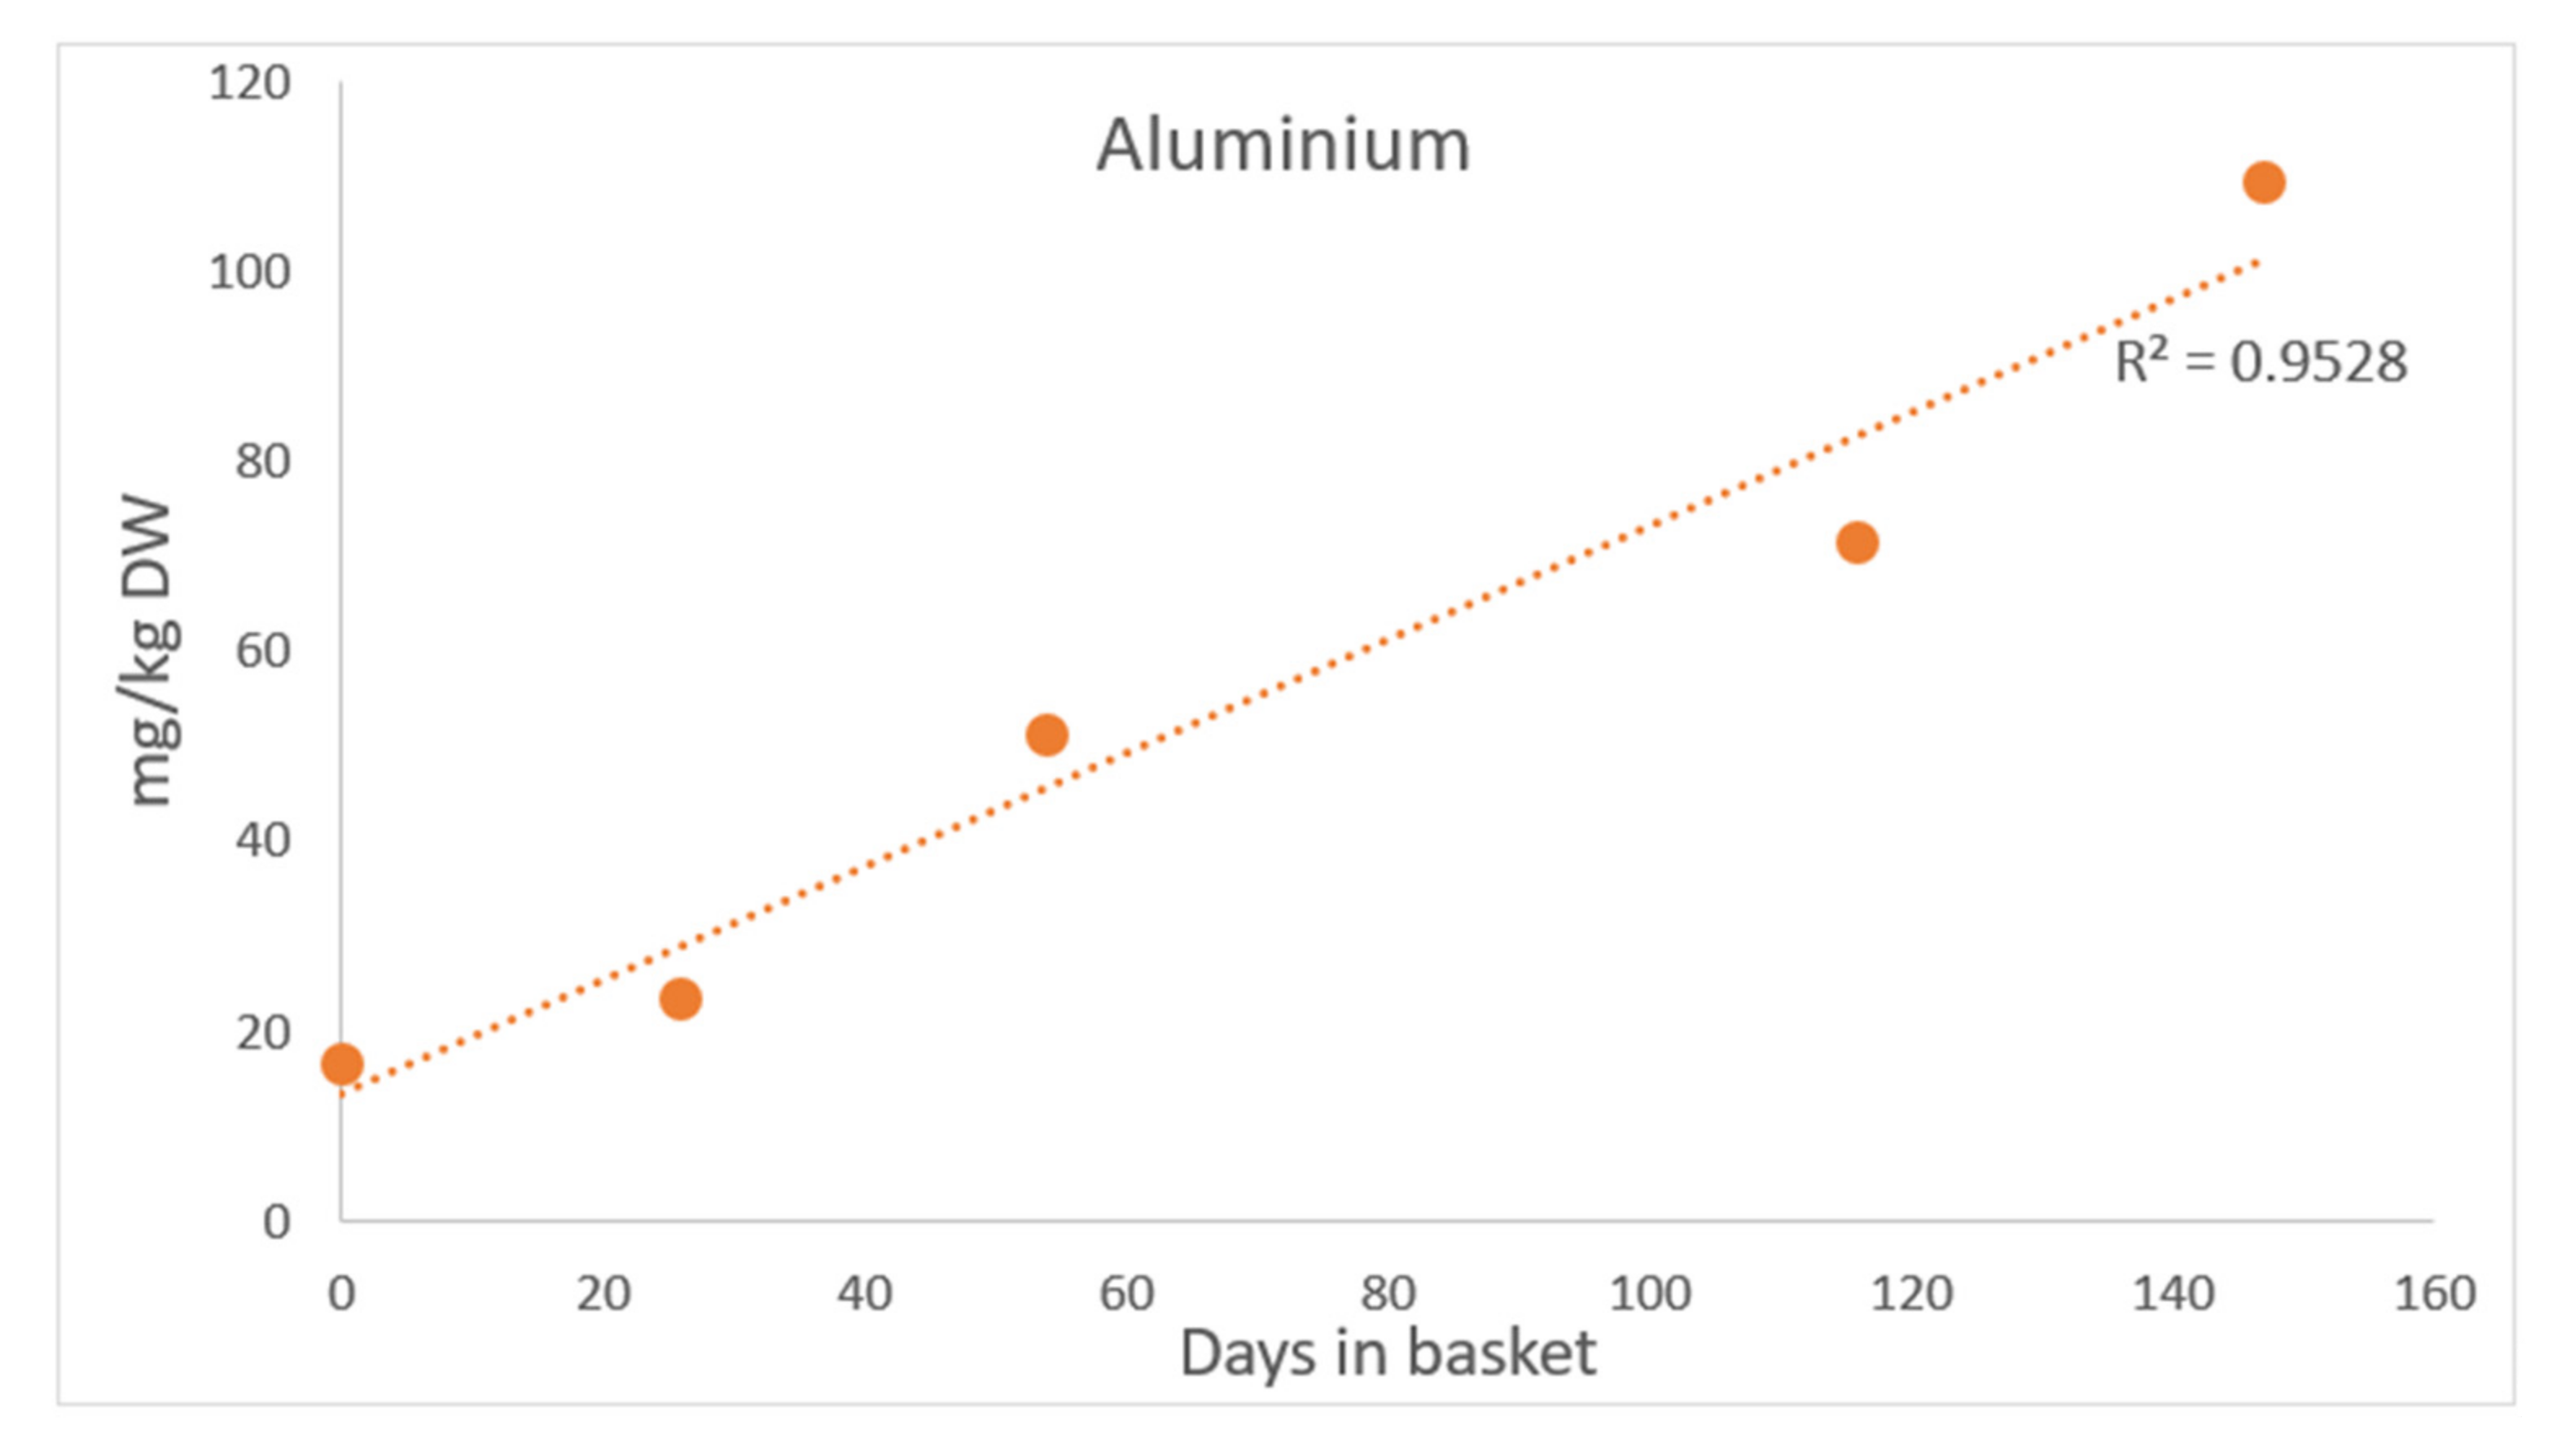
Aluminium content increased in the residual biomass, as it degraded on the beach with a strong positive correlation (R = 0.98) between storage time and aluminium content (Figure 9). Arsenic content decreased over the first 54 days, rising after that but not reaching the initial levels.

3.2. Methane Potential

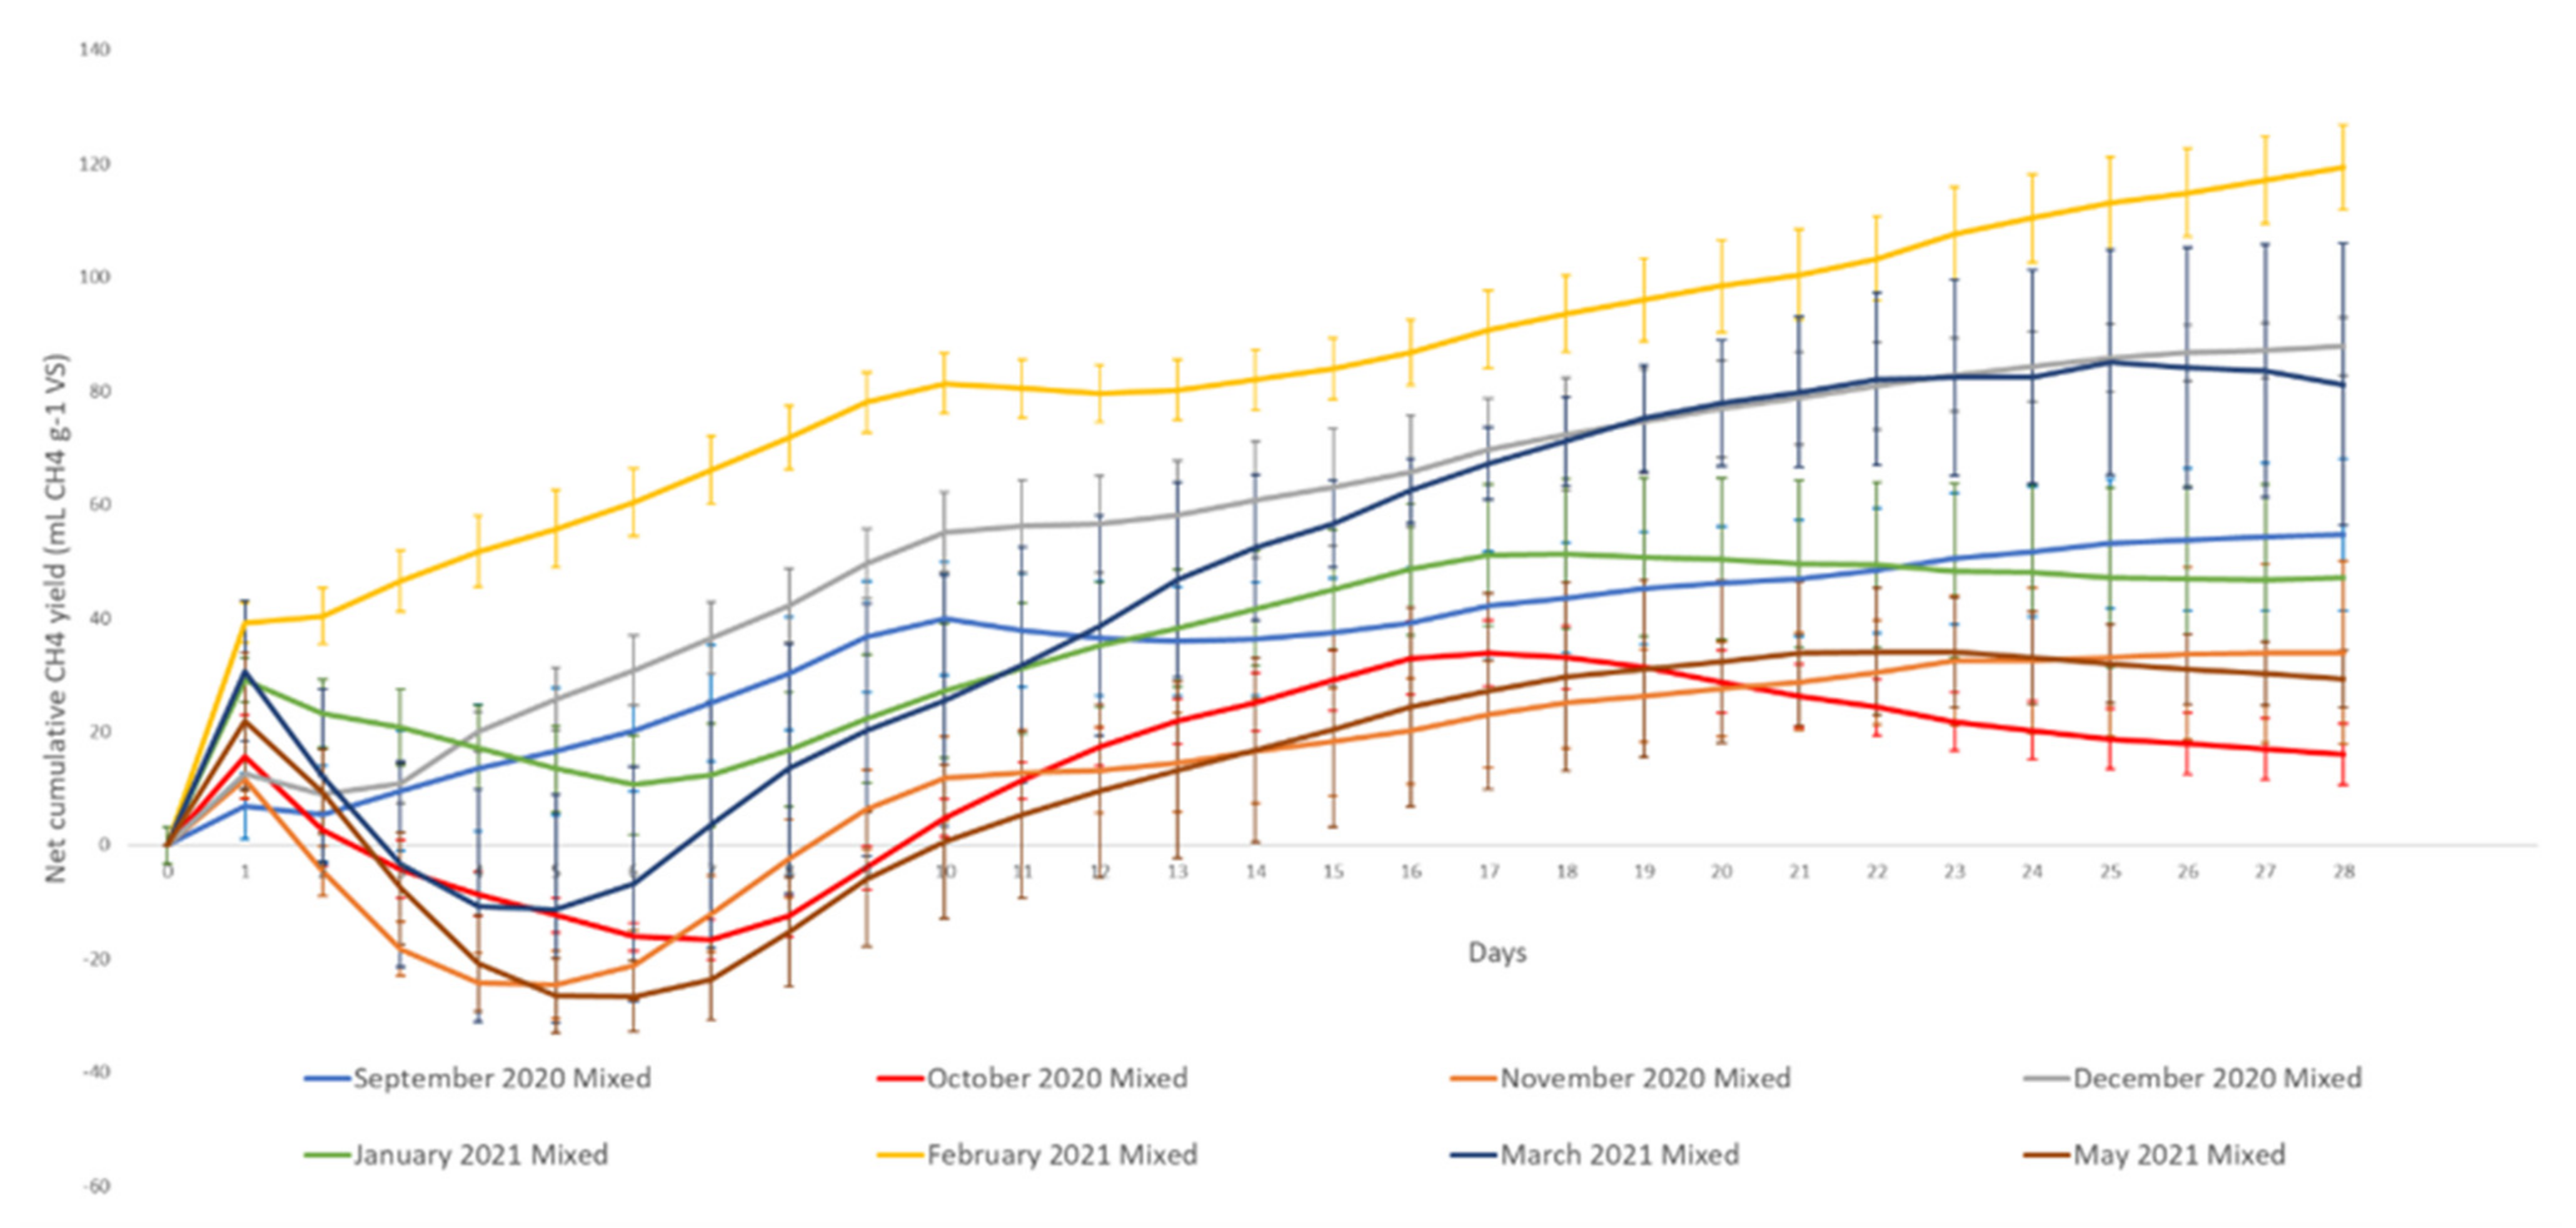
The cumulative methane production from the mixed sargassum sample for the various collection months is shown in Figure 10.
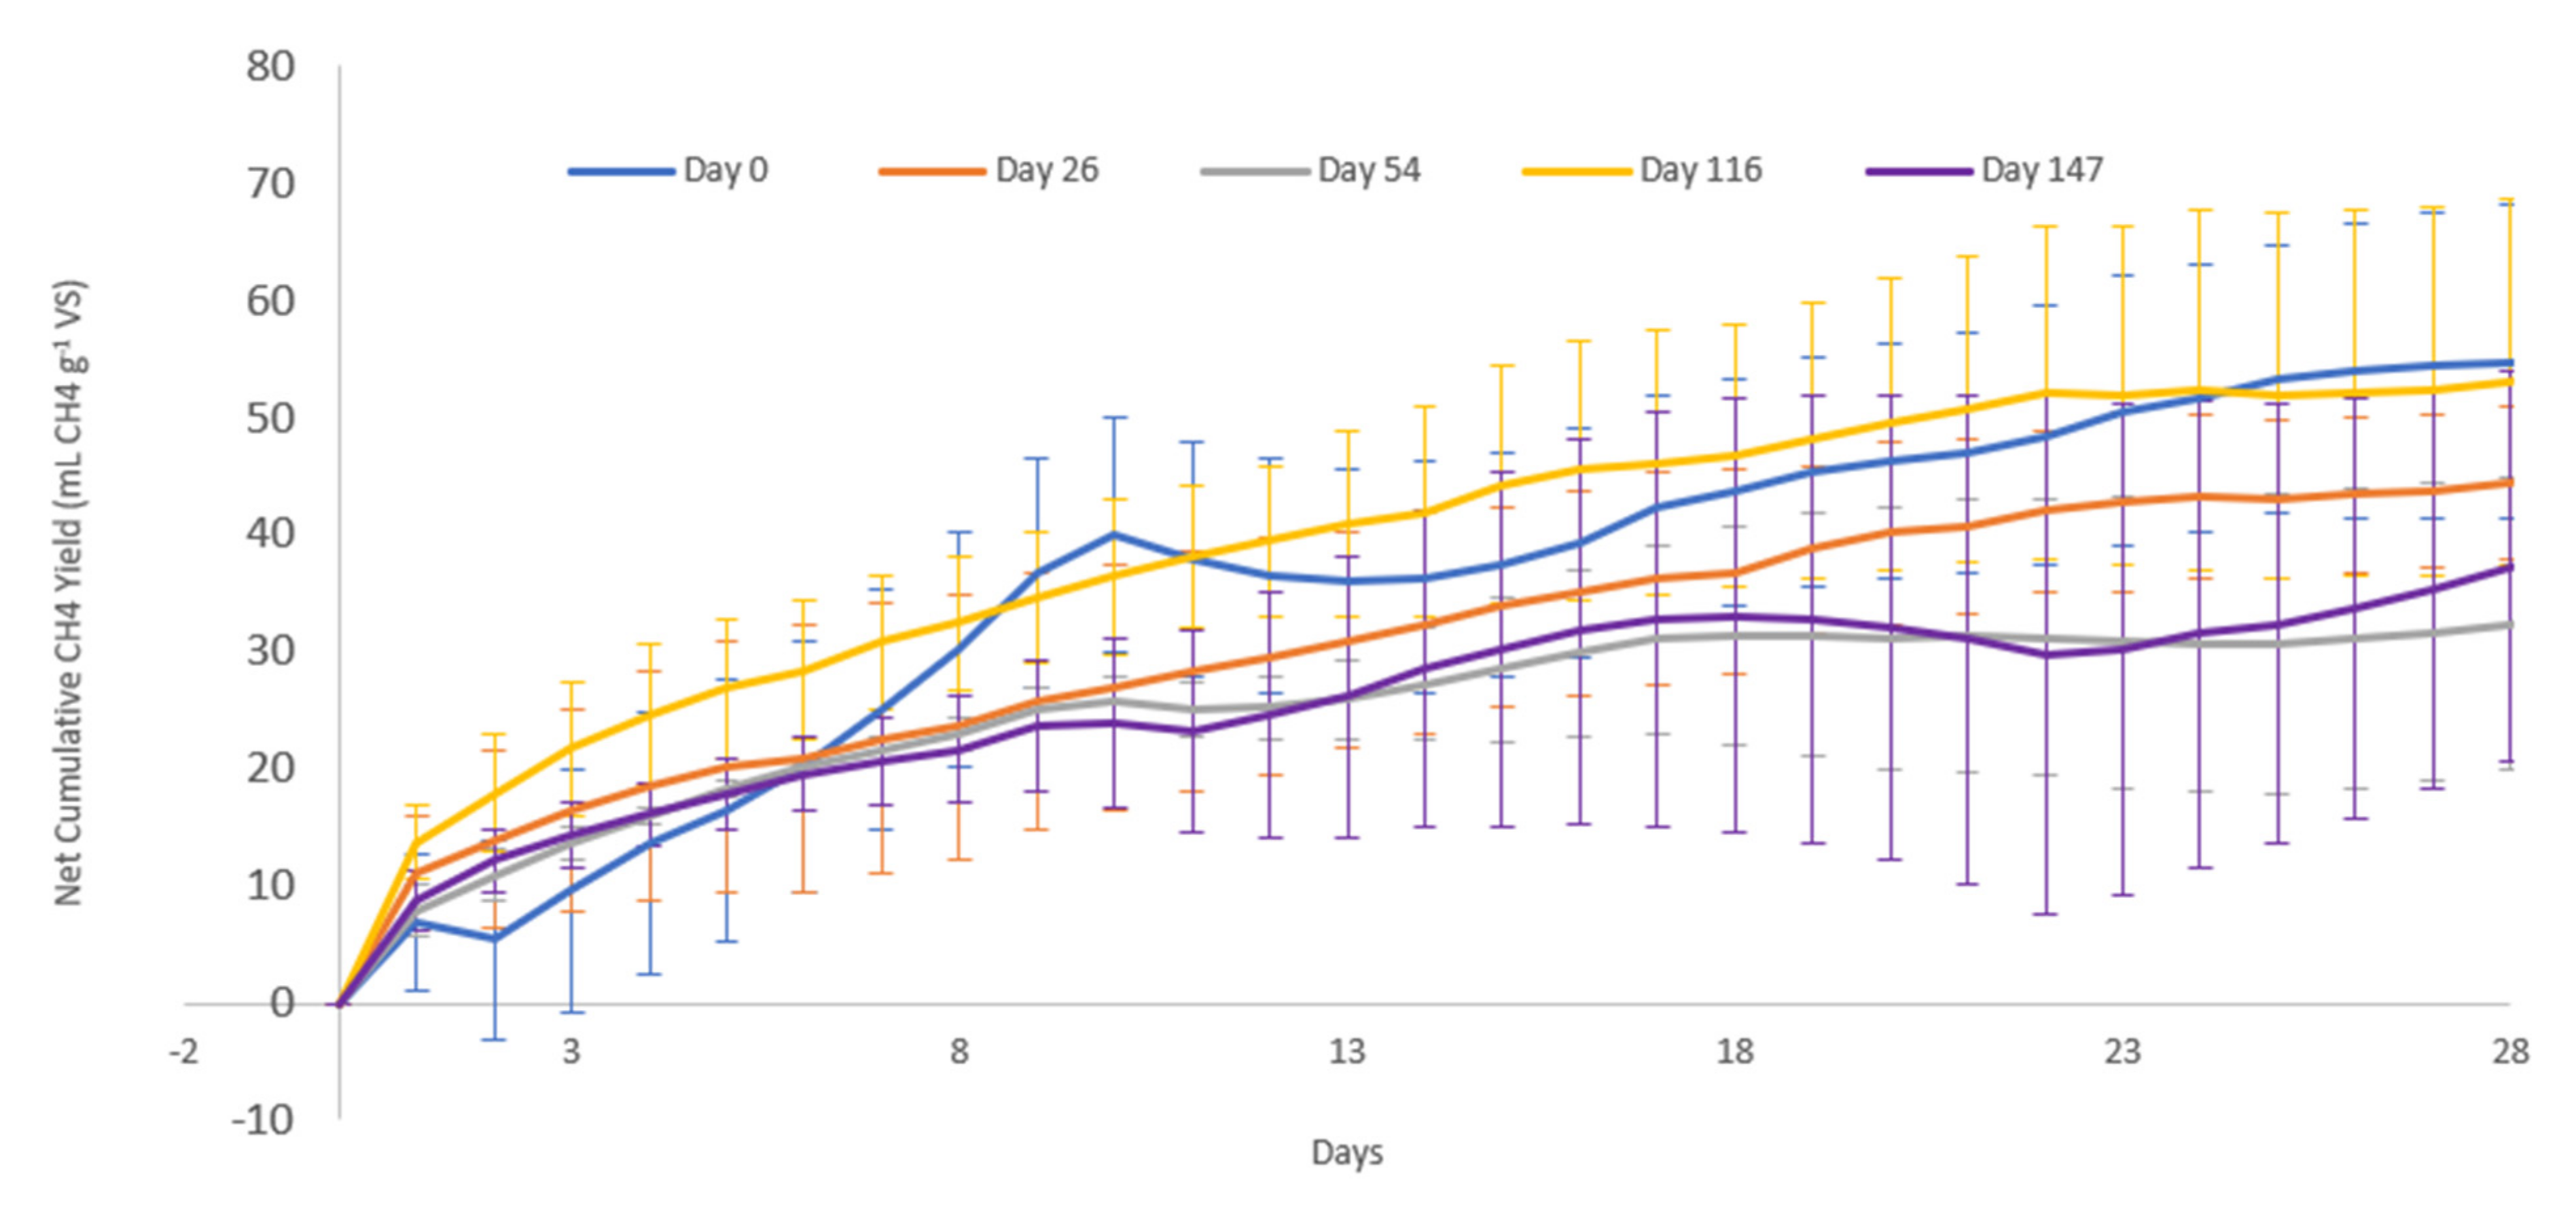
Cumulative methane production of the ‘decaying’ mixed sargassum samples stored in a basket exposed to the elements for 0, 26, 54, 116 and 147 days is shown in Figure 11. Although there is some variation between the methane produced between samples stored for various times in the basket, MP remains low (<54 mL CH4 g −1 VS) and similar to the mixed samples (16–119 mL CH4 g −1 VS).

4. Discussion

4.1. Composition

Ash levels are in line with reported values in brown macroalgae of 15–45% [22,34,35,36] and in Caribbean holopelagic sargassum (19–36% [21,22]). High ash content compared to most vegetables resulting from the seawater environment and the ability of seaweed to passively and actively take up heavy metals [37] could hamper the use of sargassum in food and feed applications. In addition, high ash content is not only a significant challenge for seaweed biorefineries, but the build-up of salts in an anaerobic digester can inhibit microorganisms during anaerobic digestion, lowering methane yields [38].The carbon content increased in the Dec-Feb samples, which could indicate an accumulation of carbohydrate and lipid during this period. Carbohydrates have previously been reported to accumulate in spring and summer to be consumed during the winter months [38]. The C increase was also reflected in the C:N ratio over the 9 months; S. natans VIII ranged from 7.06 in October 2020 to 21.33 February 2021 (an increase of a factor of 3). Lapointe et al. [39] found that the C:N ratio varies greatly with available nutrients, and this could be a major factor contributing to seasonal variation. The C:N ratios in this study were 7:1–23:9, within the range found by previous studies of 7:1–47:1 [21,22,40,41]. C:N ratio can be vitally important to the performance of an anaerobic digester. A low ratio (high nitrogen) can result in the inhibition of methanogens by high ammonia concentrations [42,43,44], and the optimum ratio for seaweed species varies between 14:1 and 30:1 [42,45,46,47].

4.1.1. Protein Content

Protein content in the pelagic samples was estimated from elemental N using a conversion factor of 4.1, as suggested in an extensive review of the nitrogen conversion factor and previous work on sargassum [22,25,48]. This conversion factor is lower than the conventionally used factor of 6.25, which has long been known to overestimate protein content [49,50,51]. The protein levels found in this study, 5.2–12.7%, are in line with previously reported protein content from brown seaweeds (3–16%) [35,48] and other studies on pelagic sargassum (3–18%) [5,35,40,52]. However, it is considerably higher than protein content found in a previous study of sargassum from TCI of 3–4% based on amino-acid analysis [22]. Most methods of protein analysis other than amino-acid analysis tend to overestimate protein content [49]. Seaweed organic nitrogen is not only associated with amino acids but with compounds such as DNA, pigments and non-protein nitrogen, and their relative contents are often higher in plants than in animals [49,50,51]. The N factor of 4.1 may still overestimate protein content [22].
Interestingly, protein content did not decrease over the 147 days in the decaying mixed sargassum samples but remained around 8.87% DW. This is encouraging, as this content is on par with crude protein levels in various forages [53], and the long-term storage of seaweed for feed could be explored. However, the high content of not only ash but also arsenic in both the fresh (59.22–217.82 mg kg−1) and the decaying samples (55.01–125.24 mg kg−1) poses a challenge if this biomass is to be considered for animal feed purposes.

4.1.2. Higher Heating Values

The range of calculated HHV (6.3–12.2 MJ kg−1 DW) is similar to that previously reported for sargassum from Turks and Caicos [22] (9.4–10.3 MJ kg−1). Saldarriaga-Hernandez et al. [52] found HHVs of 11–12 MJ kg−1. However, these figures are lower than those typical of brown seaweed (11–18 MJ kg−1) [54,55,56] and other species of sargassum (11–16 MJ kg−1) [35] and could be due to the high ash content. The HHV of the volatile solids (8.4–19.4 MJ kg−1) indicates that the biomass is primarily composed of carbohydrates and fibre (15–17 MJ kg−1) rather than highly calorific lipids (37–39 MJ kg−1) [57,58], which is in agreement with the gross compositional analyses. Storage of the biomass in the baskets over 147 days kept HHV at around 11 MJ kg−1 beyond 54 days of storage.
Although the ‘DuLong equation’ is applicable for use with agricultural waste [59] and in a study of S. muticum [60], it may not always be in agreement with bomb calorimetry values for seaweed [22,55,61]. However, the ‘DuLong equation’ generally gives a valid HHV approximation for various biomasses, including sargassum [22,59].

4.1.3. Lipid Content

The lipid content (7.24−25.87% with average values over the 9 months between 10.55% and 13.12%) is higher than previously found in sargassum from TCI (3.58–4.56%) [22], S. natans (1%) [62], sargassum from the Mexican coast [52] (2.6–3.8%) and floating sargassum mats (2.5%) [41]. However, Kumari et al. [63] found high lipid contents (6–20%) in Sargassum spp. from Gujarat, India. Although the lipid content of brown seaweeds is typically low (0.3–6%) [64,65,66], brown seaweed in colder climates can have higher lipid content [67], and this study also found higher lipid contents in the cooler months of January and February. It appears there are temporal, spatial and species variations in the lipid content of sargassum, and further work is required.

4.1.4. Phenol Content

The profile of the polyphenolic content in the samples shows a general increasing trend over the sampling period. This appears to be concurrent with the general increase in the number of sun hours in TCI from September 2020 to May 2021 [68]. Two-way ANOVA showed that polyphenolic content was significantly influenced by the collection month and the species (p < 0.05). Additionally, there was an interaction between month and species (p < 0.05), indicating that the mean differences in polyphenolic content between different species and the mixed sargassum are influenced by the month of collection. This could be due to a combination of factors known to impact polyphenolic content in seaweeds, such as temperature, UV exposure, salinity, location of harvest, availability of grazers and the reproductive phase of the seaweed [69,70].
These recorded polyphenolic contents are within the range reported in literature, with up to 6.4% DW in S. muticum [71]. Nonetheless, S. muticum can have widely varying phenolic contents, depending on season and location (0.7–6% DW) [72,73,74]. Higher phenolic levels were found in this study than in the previous brief study of pelagic sargassum from TCI (<2.95%) for S. fluitans < 0.1% phenolics [21] and sargassum from the Mexican coast < 0.2 [52]. This may be due to seasonal variation and choice of extraction method. Saldarriaga-Hernandez et al. [52] stated that “the most influential factor on the compositional content of sargassum biomass was the season of the year, followed by the extraction method”. The highest polyphenolic content for each sample type over the 9 months was 69.89 mg PG eq g−1 DW, 62.46 mg PG eq g−1 DW, 79.79 mg PG eq g−1 DW, 60.30 mg PG eq g−1 DW for mixed sargassum, S. natans VII, S. natans I and S. fluitans, respectively. The higher polyphenolic contents for these samples were obtained in February and May 2021.
There was up to an 88% reduction in phenolic content, as the samples were left in the basket over the 147 days. The reduction in phenolic content could be due to the release of components from the macroalgae. Exudates of brown macroalgae can contain phlorotannins and can also be released during tissue and cell damage [75].

4.1.5. Arsenic and Heavy Metals

For sargassum to be allowed for human consumption, it must fulfil the relevant food product regulations, especially concerning heavy metals and arsenic. Whilst cadmium content in Sargassum spp. is of less concern than arsenic, the maximum level obtained was 0.39 ppm, which is below regulatory levels (maximum level of 0.5 ppm recommended by the French High Council for Public Health (CSHPF)) [76]. However, the amount observed was higher than the value proposed by the French Agency for Food, Environmental and Occupational Health & Safety (ANSES) of 0.35 ppm of dry matter in edible seaweed when taking into account the overall cadmium intake from a normal diet [76,77]. Lead content in Sargassum spp. around the world regularly exceeds 10 ppm, above the limits set in most food regulations [78]; however, in this study, levels did not exceed 1 ppm (S. fluitans, Oct 2020).
Aluminium concentrations in the Sargassum spp. samples ranged between 14.86 and 116.13 mg kg−1. Rodríguez-Martínez et al. [79] also found that aluminium contents varied widely in pelagic sargassum, from below the limit of detection of their apparatus to 500 ppm. Sargassum muticum collected (spring 2019) on the Kent coast (UK) was found to have an aluminium content of 432 mg kg−1 (result not shown). This broad variation is in line with data reported by Milinovic et al. [78], showing levels between 5.8 μg g−1 in S. polyschides and 6.0 μg g−1 in U. pinnatifida, as well as 627 μg g−1 in G. gracilis collected in Portugal (2019).
The arsenic levels (60–218 mg kg−1) were similar to those previously reported for sargassum (20–172 mg kg−1) [21,22,52,79,80], although levels of up to 231 mg kg−1 have been recorded for members of the sargassum genus [80]. The finding also confirms the seasonal variability of arsenic [52,79]; nevertheless, total arsenic levels remain at concerning levels in all seasons (>59 mg kg−1) and after decay on the beach (>49 mg kg−1).
Arsenic toxicity varies with its oxidation state: As(III) > As(v) > organoarsenic (MMA and DMA). Inorganic species (arsenite, arsenate) are generally more toxic than organic species (MMS, DMA (Figure 12), and arsenite (AsIII) is 60 times more toxic than arsenate (AsV), which is 70 times more toxic than methylated species, monomethylarsonic acid (MMA) and dimethylarsinic acid (DMA) [80,81].
There is no general agreement on maximum allowable quantities of arsenic in seaweed, the European Commission (through Regulation (EU) 2015/1006) has established maximum permissible levels for inorganic arsenic in rice products of up to 3 mg kg−1 [22,82,83]. Sargassum spp. can contain up to 80% of the more toxic inorganic arsenic as a proportion of total arsenic [80,84]. S. fluitans samples from January 2021 were found to contain 32.67% inorganic arsenic (19.35 mg kg−1), therefore exceeding these levels by more than 10 times (unpublished data, Premier Analytical Services (Lincoln Road, High Wycombe, Bucks, HP12 3QS, UK). Nonetheless, there remains a lack of information on arsenic speciation, particularly in seaweed and pelagic sargassum [1,2,22,85].
The high metal sorption ability of seaweed is attributed to polysaccharide alginate, which is found in the cell wall of brown algae [86]. Brown seaweed is also very porous and easily permeable to small ionic species [77]. Industrial heavy-metal-bearing wastewaters require efficient and cost-effective treatment, and sargassum seaweed could perhaps offer a feasible and economical approach.

4.2. Methane Potential

This study found that the MP of mixed pelagic sargassum is considerably below the maximum potential, with BIs of 4–41%. This low digestibility is in agreement with a previous study on sargassum from TCI (0–37%) and pelagic sargassum from St Lucia [21] and Barbados [11], as well as for S. muticum ≤ 27% [60,87,88].
There was a positive correlation between lipid content and MP (coefficient of correlation (R) = 0.71, p < 0.01)). As lipids increased, MP increased. However, there was also a positive correlation between BI and lipid content (R = 0.88). A high degree of correlation does not confirm causality. Nonetheless, these findings are in agreement with the published literature. Lipids can produce considerably more methane in AD than from protein or carbohydrate [27,89].
Several seaweed studies have shown that phenolics can inhibit the AD of seaweed [22,34,38,89,90,91,92,93]. However, this study found only a weak negative correlation, although statistically significant, between phenolic content and MP (R = −0.39, p < 0.05) and BI (R = −0.49). There was a statistically significant correlation between the interaction of phenolic and lipid content on MP (R = 0.906 p < 0.001). The effect of phenolics has been shown to be reliant on the substrate [90,94,95,96].
Polyphenolic content has been correlated with antioxidant activity, and phenolics have shown antimicrobial properties, suggesting their use as a potential source of high-value products, such as in feeds or pharmaceutical products [29,97]. One strategy to improve the yield of sargassum has been co-digestion with various other waste [1,11,20]. An alternative strategy to co-digestion to improve methane would be a biorefinery strategy to remove high-value bioactive phenolics prior to AD.
A one-way ANOVA found that collection month had a highly statistically significant influence on MP (p < 0.001). The MP for February was statically higher than for other months (p < 0.01). Although the methane yields may be highest in January and February, it may be challenging to exploit this increased MP and favourable composition, as the volume of beach strandings of sargassum tends to be considerably lower in January and February than during the most problematic months of late summer [9,98,99].
Encouragingly, biodegradation of the stored samples appeared to be more efficient in terms of initial methane production (a net negative production is seen in many of the mixed samples during the initial 10 days, whereas this is not observed in the basket samples). During the initial phase of AD, insoluble polymers are degraded into soluble monomers by hydrolytic bacteria. Hydrolysis often acts as a bottleneck in the AD process, and pre-treatment processes are often required [96]. Initial storage could act as a pre-treatment step, where natural hydrolytic bacteria act on the complex substrates present in the cell wall of brown seaweed.
There is a need to examine the storage of sargassum for a year-round biorefinery, as well as co-digestion with other waste for biofuel production. Ensilage may be a suitable method; however, more research is required [1,100].

5. Conclusions

A recent study reported that a faunal mass-mortality event along the Mexican Caribbean coast in 2018 was associated with a massive influx of pelagic sargassum. Its subsequent decay resulted in hypoxia and deterioration of the water quality and was referred to as “sargassum-brown-tides” [33]. The breakdown of this material on the beach can be injurious to human health [9,14,15,16,17]. Management of beached sargassum is therefore vital.
The exploitation of sargassum for biogas, either fresh, as it arrives at the beach, or as it decays on the beach, is challenging with low methane yields. Sargassum may need to be pre-treated prior to AD or co-digested with other waste biomass in order to increase yield. Extraction of high-value compounds as phenolic compounds could be explored. However, the release of stored nutrients from decaying seaweed should be included in nutrient budgets and models when seaweed standing stocks are significant.
Although the methane yields may be highest in February, it may be challenging to exploit this increased MP and favourable composition, as the volume of beach stranding of sargassum tends to be considerably lower in February than the most problematic months of late summer.
Arsenic content exceeded the regulatory thresholds limits/recommendations both in freshly harvested samples and decaying beach samples. Arsenic could severely hamper the prospects of using the pelagic samples for food or feed. Pre-treatments and downstream processing could lower the content but would affect the overall cost-effectiveness of any biorefinery. Many heavy metals are part of the essential enzymes that drive numerous anaerobic reactions. However, high levels of most metals are toxic and pose significant challenges to bacterial communities within an anaerobic digester and could also cause reactor failure. Mitigation of heavy-metal toxicity, such as by precipitation, sorption, and chelation by organic and inorganic ligands can therefore be considered if deemed cost-effective.

Author Contributions

Conceptualisation, J.J.M. and B.V.N.; methodology, J.J.M., B.V.N., H.H., S.M. and M.M.A.F.; data Analysis, J.J.M., B.V.N., S.M. and M.M.A.F.; investigation J.J.M., B.V.N., H.H., S.M. and M.M.A.F.; resources, DEFRA, DARWIN Plus DPLUS100, School for Field Studies; writing—original draft preparation, J.J.M., B.V.N., H.H., S.M. and M.M.A.F.; writing—review and editing, B.V.N., J.J.M. and S.M.; supervision, D.B., J.J.M. and B.V.N.; project administration, D.B. and B.V.N.; funding acquisition, D.B. and J.J.M. All authors have read and agreed to the published version of the manuscript.

Funding

This research was funded by DEFRA Darwin Plus grant number DPR7P\100059.

Institutional Review Board Statement

Not applicable.

Informed Consent Statement

Not applicable.

Data Availability Statement

The data presented in this study are available on request from the corresponding author. The data are not publicly available due to large volume of data.

Acknowledgments

Department of Environment and Coastal Resources (DECR), Turks and Caicos Islands (TCI) Government; the University of Greenwich and the School for Field Studies (SFS), South Caicos.

Conflicts of Interest

There is no conflict of interest.

References

  1. Oxenford, H.A.; Cox, S.-A.; van Tussenbroek, B.I.; Desrochers, A. Challenges of turning the sargassum crisis into gold: Current constraints and implications for the Caribbean. Phycology 2021, 1, 27–48. [Google Scholar] [CrossRef]
  2. Desrochers, A.; Cox, S.-A.; Oxenford, H.A.; van Tussenbroek, B. Sargassum Uses guide: A Resource for Caribbean Researchers, Entrepreneurs and Policy Makers. Report Prepared for the Climate Change Adaptation in the Eastern Caribbean Fisheries Sector (CC4FISH) Project of the Food and Agriculture Organization (FAO) and the Global Environment Facility (GEF); Centre for Resource Management and Environmental Studies (CERMES), University of the West Indies, Cave Hill Campus: Bridgetown, Barbados, 2020. [Google Scholar]
  3. Oxenford, H.A. Sargassum moss: Ecological aspects and source of influx. In Proceedings of the Sargassum Symposium, UWI, Cave Hill, Barbados, 17 August 2018. [Google Scholar]
  4. Laffoley, D.d.A.; Roe, H.S.J.; Angel, M.V.; Ardron, J.; Bates, N.R.; Boyd, L.L.; Brooke, S.; Buck, K.N.; Carlson, C.A.; Causey, B.; et al. The Protection and Management of the Sargasso Sea: The Golden Floating Rainforest of the Atlantic Ocean: Summary Science and Supporting Evidence Case; Sargasso Sea Alliance: Hamilton, Bermuda, 2011; 44p. [Google Scholar]
  5. Milledge, J.J.; Harvey, P. Golden tides: Problem or golden opportunity? The valorisation of sargassum from beach inundations. J. Mar. Sci. Eng. 2016, 4, 60. [Google Scholar] [CrossRef]
  6. Williams, A.; Feagin, R. Sargassum as a natural solution to enhance dune plant growth. Environ. Manag. 2010, 46, 738–747. [Google Scholar] [CrossRef]
  7. Smetacek, V.; Zingone, A. Green and golden seaweed tides on the rise. Nature 2013, 504, 84–88. [Google Scholar] [CrossRef] [PubMed] [Green Version]
  8. Van Tussenbroek, B.I.; Hernandez Arana, H.A.; Rodriguez-Martinez, R.E.; Espinoza-Avalos, J.; Canizales-Flores, H.M.; Gonzalez-Godoy, C.E.; Barba-Santos, M.G.; Vega-Zepeda, A.; Collado-Vides, L. Severe impacts of brown tides caused by Sargassum spp. on near-shore Caribbean seagrass communities. Mar. Pollut. Bull. 2017, 122, 272–281. [Google Scholar] [CrossRef] [PubMed]
  9. Burrowes, R.; Wabnitz, C.; Eyzaguirre, J. The Great Sargassum Disaster of 2018. Available online: https://essa.com/the-great-sargassum-disaster-of-2018/ (accessed on 25 March 2019).
  10. Langin, K. Seaweed masses assault Caribbean islands. Science 2018, 360, 1157–1158. [Google Scholar] [CrossRef]
  11. Thompson, T.M.; Young, B.R.; Baroutian, S. Pelagic Sargassum for energy and fertiliser production in the Caribbean: A case study on Barbados. Renew. Sustain. Energy Rev. 2020, 118, 109564. [Google Scholar] [CrossRef]
  12. Hendy, I.W.; Woolford, K.; Vincent-Piper, A.; Burt, O.; Schaefer, M.; Cragg, S.M.; Sanchez-Navarro, P.; Ragazzola, F. Climate-driven golden tides are reshaping coastal communities in Quintana Roo, Mexico. Clim. Chang. Ecol. 2021, 2, 100033. [Google Scholar] [CrossRef]
  13. Bartlett, D.; Elmer, F. The impact of Sargassum inundations on the Turks and Caicos islands. Phycology 2021, 1, 83–104. [Google Scholar] [CrossRef]
  14. Resiere, D.; Valentino, R.; Nevière, R.; Banydeen, R.; Gueye, P.; Florentin, J.; Cabié, A.; Lebrun, T.; Mégarbane, B.; Guerrier, G.; et al. Sargassum seaweed on Caribbean islands: An international public health concern. Lancet 2018, 392, 2691. [Google Scholar] [CrossRef] [Green Version]
  15. Willoughby, S. Sargassum and the fishing industry. In Proceedings of the Sargassum Symposium, UWI, Cave Hill, Barbados, 17 August 2015. [Google Scholar]
  16. Resiere, D.; Mehdaoui, H.; Florentin, J.; Gueye, P.; Lebrun, T.; Blateau, A.; Viguier, J.; Valentino, R.; Brouste, Y.; Kallel, H.; et al. Sargassum seaweed health menace in the Caribbean: Clinical characteristics of a population exposed to hydrogen sulfide during the 2018 massive stranding. Clin. Toxicol. 2020, 59, 215–223. [Google Scholar] [CrossRef]
  17. Pan American Health Organisation. Potential health effects of Sargassum. In Proceedings of the 71st Session of the Regional Committee of WHO for the Americas, Washington, DC, USA, 30 September–4 October 2019. [Google Scholar]
  18. Chávez, V.; Uribe-Martínez, A.; Cuevas, E.; Rodríguez-Martínez, R.E.; van Tussenbroek, B.I.; Francisco, V.; Estévez, M.; Celis, L.B.; Monroy-Velázquez, L.V.; Leal-Bautista, R.; et al. Massive influx of pelagic Sargassum spp. on the coasts of the Mexican Caribbean 2014–2020: Challenges and opportunities. Water 2020, 12, 2908. [Google Scholar] [CrossRef]
  19. Thompson, T.M.; Ramin, P.; Udugama, I.; Young, B.R.; Gernaey, K.V.; Baroutian, S. Techno-economic and environmental impact assessment of biogas production and fertiliser recovery from pelagic Sargassum: A biorefinery concept for Barbados. Energy Conv. Manag. 2021, 245, 114605. [Google Scholar] [CrossRef]
  20. Henry, L.; McKenzie, B.; Goodridge, A.; Pivott, K.; Austin, J.; Lynch, K.; Spencer, S.; Cox, F.; Holder, N.; Murray, R.; et al. Experimental Evidence on the Use of Biomethane from Rum Distillery Waste and Sargassum Seaweed as an Alternative Fuel for Transportation in Barbados; Energy Division/Infrastructure and Energy Department: Washington, DC, USA, 2021. [Google Scholar]
  21. Morrison, M.; Gray, D. Anaerobic Digestion Economic Feasibility Study: Generating Energy from Waste, Sewage and Sargassum Seaweed in the OECS; The Caribbean Council: London, UK, 2017. [Google Scholar]
  22. Milledge, J.J.; Maneein, S.; Arribas López, E.; Bartlett, D. Sargassum inundations in Turks and Caicos: Methane potential and proximate, ultimate, lipid, amino acid, metal and metalloid analyses. Energies 2020, 13, 1523. [Google Scholar] [CrossRef] [Green Version]
  23. BSI. Solid biofuels. Determination of moisture content. Oven dry method. Total moisture. Simplified method. In BS EN 14774-2:2009; BSI: London, UK, 2009. [Google Scholar]
  24. BSI. Solid biofuels-determination of ash content. In BS EN 14775:2009; BSI: London, UK, 2009. [Google Scholar]
  25. Milledge, J.; Nielsen, B.; Sadek, M.; Harvey, P. Effect of freshwater washing pretreatment on Sargassum muticum as a feedstock for biogas production. Energies 2018, 11, 1771. [Google Scholar] [CrossRef] [Green Version]
  26. IFRF—International Flame Research Foundation. Online Combustion Handbook. Method from Combustion File 24. 2004. Available online: https://ifrf.net/ (accessed on 10 December 2021).
  27. Heaven, S.; Milledge, J.; Zhang, Y. Comments on ‘Anaerobic digestion of microalgae as a necessary step to make microalgal biodiesel sustainable’. Biotechnol. Adv. 2011, 29, 164–167. [Google Scholar] [CrossRef] [Green Version]
  28. Matyash, V.; Liebisch, G.; Kurzchalia, T.V.; Shevchenko, A.; Schwudke, D. Lipid extraction by methyl-tert-butyl ether for high-throughput lipidomics. J. Lipid Res. 2008, 49, 1137–1146. [Google Scholar] [CrossRef] [PubMed] [Green Version]
  29. Matanjun, P.; Mohamed, S.; Mustapha, N.M.; Muhammad, K.; Ming, C.H. Antioxidant activities and phenolics content of eight species of seaweeds from north Borneo. J. Appl. Phycol. 2008, 20, 367. [Google Scholar] [CrossRef]
  30. Symons, G.E.; Buswell, A.M. The methane fermentation of carbohydrates. J. Am. Chem. Soc. 1933, 55, 2028–2036. [Google Scholar] [CrossRef]
  31. Buswell, A.M.; Mueller, H.F. Mechanism of methane fermentation. Ind. Eng. Chem. 1952, 44, 550–552. [Google Scholar] [CrossRef]
  32. Tabassum, M.R.; Xia, A.; Murphy, J.D. Potential of seaweed as a feedstock for renewable gaseous fuel production in Ireland. Renew. Sustain. Energy Rev. 2017, 68, 136–146. [Google Scholar] [CrossRef]
  33. Maneein, S.; Milledge, J.J.; Harvey, P.J.; Nielsen, B.V. Methane production from Sargassum muticum: Effects of seasonality and of freshwater washes. Energy Built Environ. 2021, 2, 235–242. [Google Scholar] [CrossRef]
  34. Barbot, Y.; Al-Ghaili, H.; Benz, R. A review on the valorization of macroalgal wastes for biomethane production. Mar. Drugs 2016, 14, 120. [Google Scholar] [CrossRef] [Green Version]
  35. Peng, Y.; Hu, J.; Yang, B.; Lin, X.-P.; Zhou, X.-F.; Yang, X.-W.; Liu, Y. Chemical composition of seaweeds. In Seaweed Sustainability: Food and Non-Food Applications, 1st ed.; Tiwari, B., Troy, D., Eds.; Academic Press: Amsterdam, The Netherlands, 2015. [Google Scholar]
  36. Pereira, L. A review of the nutrient composition of selected edible seaweeds. In Seaweed; Pomin, V.H., Ed.; Nova Science Publishers: Hauppauge, NY, USA, 2011. [Google Scholar]
  37. Hurd, C.L.; Harrison, P.; Bischof, K.; Lobban, C.S. Pollution. In Seaweed Ecology and Physiology, 2nd ed.; Hurd, C.L., Lobban, C.S., Bischof, K., Harrison, P.J., Eds.; Cambridge University Press: Cambridge, UK, 2014; pp. 374–412. [Google Scholar] [CrossRef]
  38. Tabassum, M.R.; Xia, A.; Murphy, J.D. The effect of seasonal variation on biomethane production from seaweed and on application as a gaseous transport biofuel. Bioresour. Technol. 2016, 209, 213–219. [Google Scholar] [CrossRef] [PubMed]
  39. Lapointe, B.E.; West, L.E.; Sutton, T.T.; Hu, C. Ryther revisited: Nutrient excretions by fishes enhance productivity of pelagic Sargassum in the western North Atlantic Ocean. J. Exp. Mar. Biol. Ecol. 2014, 458, 46–56. [Google Scholar] [CrossRef]
  40. Wang, S.; Wang, Q.; Jiang, X.M.; Han, X.X.; Ji, H.S. Compositional analysis of bio-oil derived from pyrolysis of seaweed. Energy Conv. Manag. 2013, 68, 273–280. [Google Scholar] [CrossRef]
  41. Oyesiku, O.O.; Egunyomi, A. Identification and chemical studies of pelagic masses of Sargassum natans (Linnaeus) Gaillon and S. fluitans (Borgessen) Borgesen (brown algae), found offshore in Ondo State, Nigeria. Afr. J. Biotechnol. 2014, 13, 1188–1193. [Google Scholar] [CrossRef] [Green Version]
  42. McKennedy, J.; Sherlock, O. Anaerobic digestion of marine macroalgae: A review. Renew. Sustain. Energy Rev. 2015, 52, 1781–1790. [Google Scholar] [CrossRef]
  43. Mao, C.; Feng, Y.; Wang, X.; Ren, G. Review on research achievements of biogas from anaerobic digestion. Renew. Sustain. Energy Rev. 2015, 45, 540–555. [Google Scholar] [CrossRef]
  44. Milledge, J.J.; Harvey, P.J. Anaerobic digestion and gasification of seaweed. In Grand Challenges in Marine Biotechnology; Rampelotto, P.H., Trincone, A., Eds.; Spinger: Cham, Switzerland, 2018. [Google Scholar]
  45. D’Este, M.; Angelidaki, I.; Alvarado-Morales, M. Algal Biomass for Bioenergy and Bioproducts Production in Biorefinery Concepts.; Department of Environmental Engineering, Technical University of Denmark (DTU): Lyngby, Denmark, 2017. [Google Scholar]
  46. Chynoweth, D.P.; Ghosh, S.; Klass, D.L. Anaerobic digestion of kelp. In Biomass Conversion Processes for Energy and Fuels; Sofer, S.S., Zaborsky, O.R., Eds.; Springer: Boston, MA, USA, 1981. [Google Scholar]
  47. Chynoweth, D.P. Review of Biomethane from Marine Biomass; Department of Agricultural and Biological Engineering, University of Florida: Gainesville, FL, USA, 2002. Available online: https://arpa-e.energy.gov/sites/default/files/Review%20of%20Biomethane%20from%20Marine%20Biomass%202002.pdf (accessed on 10 December 2021).
  48. Angell, A.R.; Mata, L.; Nys, R.; Paul, N.A. The protein content of seaweeds: A universal nitrogen-to-protein conversion factor of five. J. Appl. Phycol. 2015, 28, 511–524. [Google Scholar] [CrossRef]
  49. Mæhre, H.K.; Dalheim, L.; Edvinsen, G.K.; Elvevoll, E.O.; Jensen, I.-J. Protein determination—Method matters. Foods 2018, 7, 5. [Google Scholar] [CrossRef] [PubMed] [Green Version]
  50. González López, C.V.; Garcia, M.D.C.; Fernandez, F.G.A.; Bustos, C.S.; Chisti, Y.; Sevilla, J.M.F. Protein measurements of microalgal and cyanobacterial biomass. Bioresour. Technol. 2010, 101, 7587–7591. [Google Scholar] [CrossRef] [PubMed]
  51. Safi, C.; Charton, M.; Pignolet, O.; Pontalier, P.-Y.; Vaca-Garcia, C. Evaluation of the protein quality of Porphyridium cruentum. J. Appl. Phycol. 2013, 25, 497–501. [Google Scholar] [CrossRef] [Green Version]
  52. Saldarriaga-Hernandez, S.; Melchor-Martínez, E.M.; Carrillo-Nieves, D.; Parra-Saldívar, R.; Iqbal, H.M.N. Seasonal characterization and quantification of biomolecules from sargassum collected from Mexican Caribbean coast—A preliminary study as a step forward to blue economy. J. Environ. Manag. 2021, 298, 113507. [Google Scholar] [CrossRef] [PubMed]
  53. Das, A.; Patel, D.P.; Lal, R.; Kumar, M.; Ramkrushna, G.I.; Layek, J.; Buragohain, J.; Ngachan, S.V.; Ghosh, P.K.; Choudhury, B.U.; et al. Impact of fodder grasses and organic amendments on productivity and soil and crop quality in a subtropical region of eastern Himalayas, India. Agric. Ecosyst. Environ. 2016, 216, 274–282. [Google Scholar] [CrossRef]
  54. Anastasakis, K.; Ross, A.B. Hydrothermal liquefaction of the brown macro-alga Laminaria Saccharina: Effect of reaction conditions on product distribution and composition. Bioresour. Technol. 2011, 102, 4876–4883. [Google Scholar] [CrossRef]
  55. Ross, A.B.; Jones, J.M.; Kubacki, M.L.; Bridgeman, T. Classification of macroalgae as fuel and its thermochemical behaviour. Bioresour. Technol. 2008, 99, 6494–6504. [Google Scholar] [CrossRef]
  56. Zhou, D.; Zhang, L.; Zhang, S.; Fu, H.; Chen, J. Hydrothermal liquefaction of macroalgae Enteromorpha prolifera to bio-oil. Energy Fuels 2010, 24, 4054–4061. [Google Scholar] [CrossRef]
  57. Merrill, A.L.; Watts, B.K. Energy Values of Foods: Basis & Duration. Slight Revised February 1973; US Department of Agriculture: Washington, DC, USA, 1955. [Google Scholar]
  58. Milledge, J.J. The potential yield of microalgal oil. Biofuels Int. 2010, 4, 44–45. [Google Scholar]
  59. Vargas-Moreno, J.M.; Callejón-Ferre, A.J.; Pérez-Alonso, J.; Velázquez-Martí, B. A review of the mathematical models for predicting the heating value of biomass materials. Renew. Sustain. Energy Rev. 2012, 16, 3065–3083. [Google Scholar] [CrossRef]
  60. Milledge, J.J.; Harvey, P.J. Ensilage and anaerobic digestion of Sargassum muticum. J. Appl. Phycol. 2016, 28, 3021–3030. [Google Scholar] [CrossRef]
  61. Milledge, J.J.; Staple, A.; Harvey, P. Slow pyrolysis as a method for the destruction of Japanese Wireweed, Sargassum muticum. Environ. Nat. Resour. Res. 2015, 5, 28–36. [Google Scholar] [CrossRef] [Green Version]
  62. Van Ginneken, V.J.T.; Helsper, J.; de Visser, W.; van Keulen, H.; Brandenburg, W.A. Polyunsaturated fatty acids in various macroalgal species from north Atlantic and tropical seas. Lipids Health Dis. 2011, 10, 8. [Google Scholar] [CrossRef] [Green Version]
  63. Kumari, P.; Bijo, A.J.; Mantri, V.A.; Reddy, C.R.K.; Jha, B. Fatty acid profiling of tropical marine macroalgae: An analysis from chemotaxonomic and nutritional perspectives. Phytochemistry 2013, 86, 44–56. [Google Scholar] [CrossRef]
  64. Streefland, M. Algae and Aquatic Biomass for a Sustainable Production of 2nd Generation Biofuels-Deliverable 1.5-Report on Biofuel Production Processes from Micro, Macroalgae and Other Aquatic Biomass; AquaFUELs: Brussels, Belgium, 2010. [Google Scholar]
  65. Lenstra, W.J.; Hal, J.W.v.; Reith, J.H. Economic aspects of open ocean seaweed cultivation. In Proceedings of the Alg’n Chem 2011, Algae, New Resources for Industry, Montpellier, France, 10 November 2011. [Google Scholar]
  66. Milledge, J.J.; Smith, B.; Dyer, P.; Harvey, P. Macroalgae-derived biofuel: A review of methods of energy extraction from seaweed biomass. Energies 2014, 7, 7194–7222. [Google Scholar] [CrossRef]
  67. Susanto, E.; Fahmi, A.S.; Abe, M.; Hosokawa, M.; Miyashita, K. Lipids, fatty acids, and fucoxanthin content from temperate and tropical Brown seaweeds. Aquat. Procedia 2016, 7, 66–75. [Google Scholar] [CrossRef]
  68. World Weather Online. Cockburn Town Monthly Climate Averages, TC. Available online: https://www.worldweatheronline.com/cockburn-town-weather-averages/tc.aspx (accessed on 26 September 2021).
  69. Plouguerne, E.; Le Lann, K.; Connan, S.; Jechoux, G.; Deslandes, E.; Stiger-Pouvreau, V. Spatial and seasonal variation in density, reproductive status, length and phenolic content of the invasive brown macroalga Sargassum muticum (Yendo) Fensholt along the coast of Western Brittany (France). Aquat. Bot. 2006, 85, 337–344. [Google Scholar] [CrossRef]
  70. Lann, K.L.; Ferret, C.; VanMee, E.; Spagnol, C.; Lhuillery, M.; Payri, C.; Stiger-Pouvreau, V. Total phenolic, size-fractionated phenolics and fucoxanthin content of tropical Sargassaceae (Fucales, Phaeophyceae) from the South Pacific Ocean: Spatial and specific variability. Phycol. Res. 2012, 60, 37–50. [Google Scholar] [CrossRef]
  71. Puspita, M.; Déniel, M.; Widowati, I.; Radjasa, O.K.; Douzenel, P.; Marty, C.; Vandanjon, L.; Bedoux, G.; Bourgougnon, N. Total phenolic content and biological activities of enzymatic extracts from Sargassum muticum (Yendo) Fensholt. J. Appl. Phycol. 2017, 29, 2521–2537. [Google Scholar] [CrossRef]
  72. Gorham, J.; Lewey, S.A. Seasonal changes in the chemical composition of Sargassum muticum. Mar. Biol. 1984, 80, 103–107. [Google Scholar] [CrossRef]
  73. Connan, S.; Delisle, F.; Deslandes, E.; Gall, E.A. Intra-thallus phlorotannin content and antioxidant activity in Phaeophyceae of temperate waters. Bot. Mar. 2006, 49, 39–46. [Google Scholar] [CrossRef]
  74. Tanniou, A.; Vandanjon, L.; Incera, M.; Leon, E.S.; Husa, V.; Le Grand, J.; Nicolas, J.L.; Poupart, N.; Kervarec, N.; Engelen, A.; et al. Assessment of the spatial variability of phenolic contents and associated bioactivities in the invasive alga Sargassum muticum sampled along its European range from Norway to Portugal. J. Appl. Phycol. 2014, 26, 1215–1230. [Google Scholar] [CrossRef] [Green Version]
  75. Swanson, A.K.; Druehl, L.D. Induction, exudation and the UV protective role of kelp phlorotannins. Aquat. Bot. 2002, 73, 241–253. [Google Scholar] [CrossRef]
  76. ANSES. ANSES Makes Recommendations to Limit Cadmium Exposure from Consumption of Edible Seaweed. Available online: https://www.anses.fr/en/content/anses-makes-recommendations-limit-cadmium-exposure-consumption-edible-seaweed (accessed on 4 November 2021).
  77. Dodge, J.D. The Fine Structure of Algal Cells; Academic Press: London, UK, 1973. [Google Scholar] [CrossRef]
  78. Milinovic, J.; Vale, C.; Botelho, M.J.; Pereira, E.; Sardinha, J.; Murton, B.J.; Noronha, J.P. Selective incorporation of rare earth elements by seaweeds from Cape Mondego, western Portuguese coast. Sci. Total Environ. 2021, 795, 148860. [Google Scholar] [CrossRef]
  79. Rodríguez-Martínez, R.E.; Roy, P.D.; Torrescano-Valle, N.; Cabanillas-Terán, N.; Carrillo-Domínguez, S.; Collado-Vides, L.; García-Sánchez, M.; van Tussenbroek, B.I. Element concentrations in pelagic Sargassum along the Mexican Caribbean coast in 2018-2019. PeerJ 2020, 8, e8667. [Google Scholar] [CrossRef] [Green Version]
  80. Yokoi, K.; Konomi, A. Toxicity of so-called edible hijiki seaweed (Sargassum fusiforme) containing inorganic arsenic. Regul. Toxicol. Pharmacol. 2012, 63, 291–297. [Google Scholar] [CrossRef]
  81. Neff, J.M. Ecotoxicology of arsenic in the marine environment. Environ. Toxicol. Chem. 1997, 16, 917–927. [Google Scholar] [CrossRef]
  82. European Commission. Amending Regulation (EC) No 1881/2006 as Regards Maximum Levels of Inorganic Arsenic in Foodstuffs; European Commission: Brussels, Belgium, 2015; Available online: https://eur-lex.europa.eu/ (accessed on 10 November 2021).
  83. Rose, M.; Lewis, J.; Langford, N.; Baxter, M.; Origgi, S.; Barber, M.; MacBain, H.; Thomas, K. Arsenic in seaweed—Forms, concentration and dietary exposure. Food Chem. Toxicol. 2007, 45, 1263–1267. [Google Scholar] [CrossRef] [PubMed]
  84. Chen, Q.; Pan, X.-D.; Huang, B.-F.; Han, J.-L. Distribution of metals and metalloids in dried seaweeds and health risk to population in southeastern China. Sci. Rep. 2018, 8, 3578. [Google Scholar] [CrossRef] [Green Version]
  85. Taylor, V.F.; Li, Z.; Sayarath, V.; Palys, T.J.; Morse, K.R.; Scholz-Bright, R.A.; Karagas, M.R. Distinct arsenic metabolites following seaweed consumption in humans. Sci. Rep. 2017, 7, 3920. [Google Scholar] [CrossRef] [PubMed]
  86. Fourest, E.; Volesky, B. Alginate properties and heavy metal biosorption by marine algae. Appl. Biochem. Biotechnol. 1997, 67, 215–226. [Google Scholar] [CrossRef]
  87. Jard, G.; Marfaing, H.; Carrere, H.; Delgenes, J.P.; Steyer, J.P.; Dumas, C. French Brittany macroalgae screening: Composition and methane potential for potential alternative sources of energy and products. Bioresour. Technol. 2013, 144, 492–498. [Google Scholar] [CrossRef]
  88. Soto, M.; Vazquez, M.A.; de Vega, A.; Vilarino, J.M.; Fernandez, G.; de Vicente, M.E. Methane potential and anaerobic treatment feasibility of Sargassum muticum. Bioresour. Technol. 2015, 189, 53–61. [Google Scholar] [CrossRef]
  89. Milledge, J.J.; Nielsen, B.V.; Maneein, S.; Harvey, P.J. A brief review of anaerobic digestion of algae for bioenergy. Energies 2019, 12, 1166. [Google Scholar] [CrossRef] [Green Version]
  90. Milledge, J.J.; Nielsen, B.V.; Harvey, P.J. The inhibition of anaerobic digestion by model phenolic compounds representative of those from Sargassum muticum. J. Appl. Phycol. 2018, 31, 779–786. [Google Scholar] [CrossRef]
  91. Hierholtzer, A.; Chatellard, L.; Kierans, M.; Akunna, J.C.; Collier, P.J. The impact and mode of action of phenolic compounds extracted from brown seaweed on mixed anaerobic microbial cultures. J. Appl. Microbiol. 2013, 114, 964–973. [Google Scholar] [CrossRef] [PubMed]
  92. Pérez, M.J.; Falqué, E.; Domínguez, H. Antimicrobial action of compounds from marine seaweed. Mar. Drugs 2016, 14, 52. [Google Scholar] [CrossRef] [Green Version]
  93. Ward, A.J.; Lewis, D.M.; Green, B. Anaerobic digestion of algae biomass: A review. Algal Res. Biomass Biofuels Bioprod. 2014, 5, 204–214. [Google Scholar] [CrossRef]
  94. Wang, Y.; Xu, Z.; Bach, S.J.; McAllister, T.A. Effects of phlorotannins from Ascophyllum nodosum (brown seaweed) on in vitro ruminal digestion of mixed forage or barley grain. Anim. Feed Sci. Technol. 2008, 145, 375–395. [Google Scholar] [CrossRef]
  95. Monlau, F.; Sambusiti, C.; Barakat, A.; Quéméneur, M.; Trably, E.; Steyer, J.P.; Carrère, H. Do furanic and phenolic compounds of lignocellulosic and algae biomass hydrolyzate inhibit anaerobic mixed cultures? A comprehensive review. Biotechnol. Adv. 2014, 32, 934–951. [Google Scholar] [CrossRef]
  96. Maneein, S.; Milledge, J.J.; Nielsen, B.V.; Harvey, P.J. A review of seaweed pre-treatment methods for enhanced biofuel production by anaerobic digestion or fermentation. Fermentation 2018, 4, 100. [Google Scholar] [CrossRef] [Green Version]
  97. Farvin, K.H.S.; Jacobsen, C. Phenolic compounds and antioxidant activities of selected species of seaweeds from Danish coast. Food Chem. 2013, 138, 1670–1681. [Google Scholar] [CrossRef] [PubMed]
  98. Johns, E.M.; Lumpkin, R.; Putman, N.F.; Smith, R.H.; Muller-Karger, F.E.; Rueda-Roa, D.T.; Hu, C.; Wang, M.; Brooks, M.T.; Gramer, L.J.; et al. The establishment of a pelagic Sargassum population in the tropical Atlantic: Biological consequences of a basin-scale long distance dispersal event. Prog. Oceanogr. 2020, 182, 102269. [Google Scholar] [CrossRef]
  99. UNEP. Sargassum White Paper-Sargassum Outbreak in the Caribbean: Challenges, Opportunities and Regional Situation; Scientific and Technical Advisory Committee (STAC) to the Protocol Concerning Specially Protected Areas and Wildlife (SPAW) in the Wider Caribbean Region: Panama City, Panama, 2018. [Google Scholar]
  100. Milledge, J.J.; Maneein, S. Chapter 6—Storage of seaweed for biofuel production: Ensilage. In Sustainable Seaweed Technologies; Torres, M.D., Kraan, S., Dominguez, H., Eds.; Elsevier: Amsterdam, The Netherlands, 2020; pp. 155–167. [Google Scholar] [CrossRef]
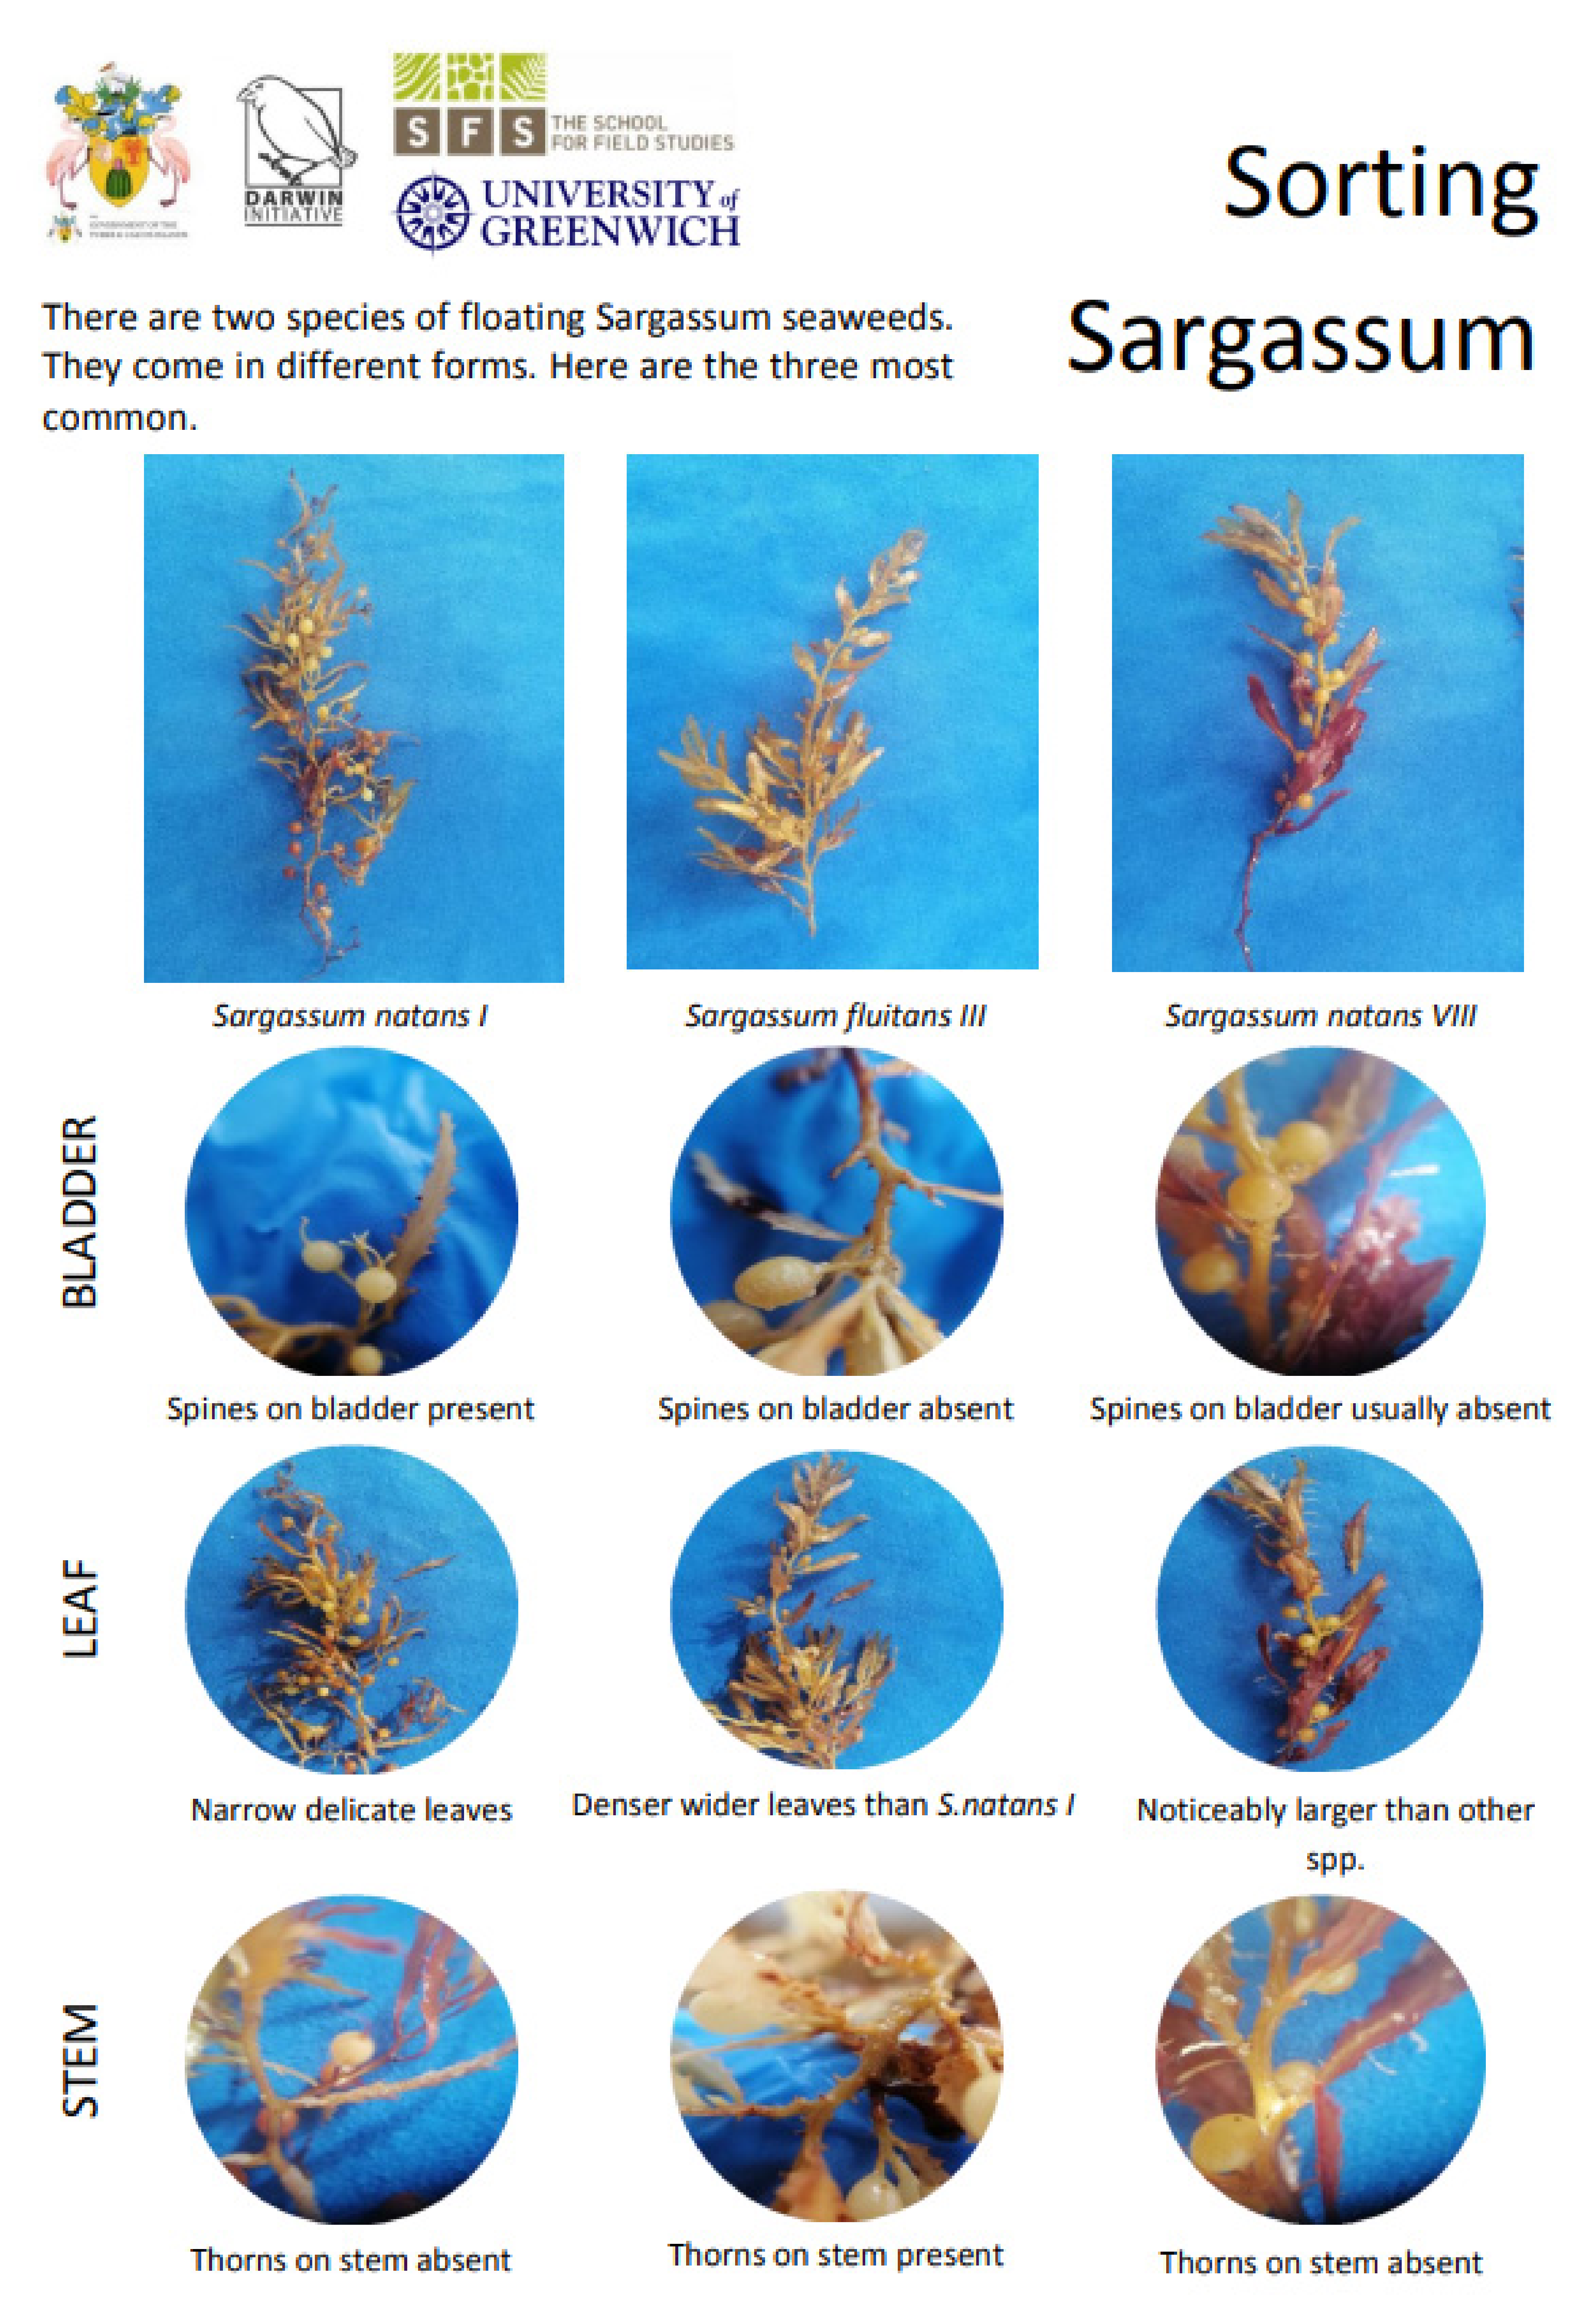
Figure 1. Sample-identification sheet used to identify and separate the three dominant species of sargassum (S. natans VIII, S. natans I and S. fluitans).
Phycology 01 00011 g001
Figure 2. (a) Perforated baskets of sargassum were used to mimic beach strandings and examine compositional changes over time. (b) sargassum beach inundations TCI.
Phycology 01 00011 g002
Figure 3. Protein content of sargassum samples collected from TCI between October 2020 and May 2021. SD represents n = 3.
Phycology 01 00011 g003
Figure 4. Lipid content of sargassum samples collected from TCI between October 2020 and May 2021. SD represent n = 3.
Phycology 01 00011 g004
Figure 5. Phenolic content of sargassum samples collected from TCI between October 2020 and May 2021. SD represents n = 3.
Phycology 01 00011 g005
Figure 6. The changes in the phenolic (secondary axis), lipid and protein contents of the ‘decaying’ mixed sargassum samples stored in a basket exposed to the elements. SD represents n = 3.
Phycology 01 00011 g006
Figure 7. Aluminium content of sargassum samples collected from TCI between October 2020 and May 2021.
Phycology 01 00011 g007
Figure 8. Arsenic content of sargassum samples collected from TCI between October 2020 and May 2021.
Phycology 01 00011 g008
Figure 9. Correlation between aluminium content and days stored in basket.
Phycology 01 00011 g009
Figure 10. Cumulative methane production from the mixed sargassum sample for the various collection months. The theoretical methane yields, measured methane potential (MP) and biodegradability index (BI) for the various collection months are given in Table 5.
Phycology 01 00011 g010
Figure 11. Cumulative methane production of the ‘decaying’ mixed sargassum samples stored in a basket exposed to the elements for 0, 26, 54, 116 and 147 days. SD represents n = 3.
Phycology 01 00011 g011
Figure 12. Inorganic species (arsenite, arsenate) are more toxic than the organic species s monomethylarsonic acid and Dimethylarsinic acid (MMS, DMA).
Phycology 01 00011 g012
Table 1. Ash, volatile solids (VS), mean result of CHN analysis and higher heating value (HHV) of sargassum samples from TCI, calculated using the ‘DuLong’ equation.
Ash%VSCHNOElemental RatiosHHV
% Dry Weight (DW)C:NC:OMJ kg−1 DWMJ kg−1 VS
20 September
Mixed sargassum41.7558.2527.682.721.6426.2116.881.069.716.7
S. natans VIII41.6358.3723.552.081.9330.8112.20.767.212.3
S. natans I41.0858.9223.961.881.9631.1212.220.777.112.1
S. fluitans39.6260.3824.92.131.831.5513.830.797.712.8
20 October
Mixed sargassum39.8560.1527.332.652.1827.9912.520.989.415.6
S. natans VIII42.0157.9922.642.323.2129.827.060.767.412.8
S. natans I39.8860.1229.522.712.2125.6814.11.1510.417.3
S. fluitans41.0558.9529.063.22.2224.4613.061.1910.918.5
20 November
Mixed sargassum40.9559.0526.762.92.2227.1711.30.989.516.1
S. natans VIII24.6175.3923.952.532.3746.559.920.516.38.4
S. natans I41.3658.6425.42.191.829.2514.110.878.113.8
S. fluitans37.8962.1128.953.411.9927.7714.891.0410.717.2
20 December
Mixed Ssargassum34.265.830.993.683.4227.718.191.1211.817.9
S. natans VIII38.5161.4928.673.862.4526.5111.691.0811.318.4
S. natans I28.4571.5533.534.442.0131.5816.731.061318.2
S. fluitans44.3455.6625.672.872.5224.610.191.049.416.9
21 January
Mixed sargassum37.9662.0431.623.791.3225.3123.951.2512.219.7
S. natans VIII32.4467.5628.613.122.7433.0810.440.869.914.7
S. fluitans51.148.926.873.021.9317.0713.921.5710.721.9
21 February
Mixed sargassum32.7367.2724.112.312.0238.8311.940.626.910.3
S. natans VIII33.8466.1630.333.71.4330.7121.330.9911.216.9
S. natans I32.0367.9722.82.582.3340.279.760.576.69.7
S. fluitans34.4465.5628.73.421.531.9419.110.910.215.6
21 March
Mixed sargassum40.0359.9727.183.922.4526.4211.1110.818.0
S. natans VIII39.3360.6726.322.662.5929.110.160.9914.8
S. natans I34.0265.9827.912.972.2232.8712.570.859.414.2
S. fluitans36.4963.5126.972.852.3231.3811.620.869.214.5
21 May
Mixed sargassum38.161.924.872.691.832.5415.480.768.113.1
S. natans VIII39.2660.7424.552.462.2631.4610.910.787.913.0
S. natans I45.4454.5625.823.192.3523.1911.021.119.918.1
S. fluitans45.9554.0523.592.392.0226.0611.650.91814.8
Table 2. Ash, volatile solids (VS), mean result of CHN analysis, and higher heating value (HHV) of decaying (basket) mixed sargassum samples from TCI, calculated using the ‘DuLong’ equation.
Ash%VSCHNOElemental RatiosHHV
% Dry Weight C:NC:OMJ kg−1 DWMJ kg−1 VS
Day 041.7558.2527.682.721.6426.2116.881.069.716.7
Day 2628.8771.1337.55.62.3325.716.191.2616.122.7
Day 5421.5678.4432.743.962.3339.414.050.8311.514.6
Day 11630.0569.9532.33.222.3632.0713.691.0111.316.1
Day 14743.1656.8431.452.862.1420.3814.71.5411.820.7
Table 3. Heavy metal content (mg kg−1 DW) in sargassum samples collected from TCI between October 2020 and May 2021. * ND = below detection limit (0.05–0.09 mg kg−1).
AluminiumArsenicCadmiumChromiumLead
Mixed sargassum15.78–50.1163.14–175.880.11–0.220.0043–1.04ND * –0.52
S. fluitans21.62–50.1159.22–217.82ND *–0.230.004–5.15ND *–0.996
S. natans I22.20–45.02123.81–198.36ND *–0.392ND *–0.399ND *–0.499
S. natans VIII26.72–124.1382.44–197.95ND *–0.220.004–2.82ND *–0.66
Table 4. Heavy metal (mg kg−1 DW) content of decaying (basket) mixed sargassum samples from TCI.
ArsenicAluminiumCadmiumChromiumLead
Basket Day 0125.2416.630.180.280.09
Basket Day 2699.1823.290.270.290.37
Basket Day 5449.3051.240.350.510.83
Basket Day 11655.0171.310.330.691.59
Basket Day 14785.06109.400.280.00981.69
Table 5. Theoretical methane yields, measured methane potential (MP) and biodegradability index (BI) for sargassum collected from TCI.
Theoretical CH4Methane Potential (MP)BI
mL CH4 g−1 VSmL CH4 g−1 VS
Sep-2045154.6612%
Oct-2043416.034%
Nov-2042933.908%
Dec-2047587.7818%
Jan-2151747.139%
Feb-21285119.3542%
Mar-2143281.1319%
May-2145329.326%
Publisher’s Note: MDPI stays neutral with regard to jurisdictional claims in published maps and institutional affiliations.