1. Introduction
The global population is ageing, while exposure to high ambient temperatures is increasing because of climate change. Older age has consistently been identified as one of the strongest non-modifiable determinants of vulnerability to heat, outweighing the influence of most other individual risk factors. Physiological changes associated with ageing, a higher prevalence of chronic diseases, the use of multiple medications, and reduced thermoregulatory capacity contribute to an increased susceptibility to heat-related adverse health outcomes among older adults [
1].
Epidemiological evidence has consistently shown a robust association between temperature extremes and adverse health outcomes in this population. A meta-analysis reported that heat-related mortality among older adults (≥65 years) increases by approximately 2–5% for each 1 °C rise in temperature, an effect magnitude greater than that observed for cold-related mortality in individuals aged ≥ 50 years [
2]. Complementing these findings, Åström and colleagues showed that people aged 65 years and older experience significantly higher risks of both mortality and morbidity during heat waves compared with younger age groups [
3].
Recent systematic reviews consistently show that exposure to high ambient temperatures increases cardiovascular and respiratory risks, particularly among older adults. Across climate zones, heat exposure has been strongly associated with higher cardiovascular mortality, with population ageing and widespread heat exposure expected to further amplify the burden of heat-related cardiovascular disease under climate warming [
4].
Large multi-country reviews also report significant associations between heat waves and cardiovascular and respiratory mortality—especially for ischemic heart disease, stroke, heart failure, and chronic obstructive pulmonary disease—while associations with morbidity outcomes are weaker and more heterogeneous, suggesting that mortality may be a more sensitive indicator of heat-related health impacts in older populations [
5].
Beyond these well-established physiological and epidemiological mechanisms, the recent literature emphasizes that the clinical management of heat exposure among older adults requires tailored protocols, including objective monitoring of core temperature and hydration status, as well as preventive strategies such as intermittent cooling. However, such measures may offer only temporary protection if exposure persists. Moreover, effective risk mitigation must extend beyond clinical management to include broader structural interventions, such as air pollution control and urban planning strategies aimed at reducing urban heat island effects [
6]. These findings reinforce the need to understand heat vulnerability not only at the individual level but also within broader social and environmental contexts.
Despite this growing body of evidence, the magnitude of heat-related impacts varies substantially across settings, suggesting that contextual factors—such as social conditions, healthcare system capacity, and territorial inequalities—play a fundamental role in shaping heat vulnerability among older adults. These factors are central components of climate vulnerability, as defined by the dimensions of exposure, sensitivity, and adaptive capacity [
7].
In particular, a substantial knowledge gap persists regarding how heat-related health impacts among older adults are spatially distributed and which social and structural determinants intensify vulnerability. Although several Brazilian studies have investigated the effects of extreme temperatures on health outcomes, most have focused on large metropolitan areas or broad geographic regions, with limited consideration of territorial inequalities, age-specific risks, or the integration of social vulnerability and health system characteristics [
8,
9].
Moreover, few studies have employed spatial analytic approaches or composite indices capable of capturing the complex interplay between environmental exposure, social conditions, and health system capacity.
Brazil’s Unified Health System (Sistema Único de Saúde—SUS) is organized through a decentralized and regionally structured governance model in which health planning and service provision are coordinated across defined health regions. In the state of São Paulo, these regions are operationalized through Regional Health Departments (RHDs), which function as meso-level administrative units responsible for coordinating primary care, hospital services, and health surveillance across groups of municipalities [
10]. This regional scale represents a relevant analytical level for examining territorial inequalities in health system capacity and population vulnerability, particularly in the context of climate-related risks that require coordinated public health responses.
This regional analytical framework also enables the integration of contextual social and health-system indicators into composite vulnerability measures, supporting the assessment of differential population sensitivity to heat-wave events under relatively homogeneous climatic exposure.
Against this background, this ecological time-series study aims to assess the impact of heat waves on cardiovascular and respiratory hospitalizations and mortality among older adults in Brazil using distributed lag non-linear models (DLNM) within a regional analytical framework based on the Regional Health Departments (RHDs) of the state of São Paulo.
By integrating social and health system determinants into composite vulnerability measures, this study seeks to provide a more comprehensive understanding of territorial inequalities in heat-related health risks. We hypothesize that heat waves are associated with increased cardiorespiratory morbidity and mortality among older adults, with disproportionately higher impacts in more socially and structurally vulnerable health regions.
The findings are intended to inform how regional differences in demographic composition, socioeconomic conditions, and health system capacity may contribute to unequal population responses to heat-wave events, underscoring the importance of regionally tailored adaptation and health system strengthening strategies in the context of climate change.
2. Materials and Methods
2.1. Study Design and Ethical Approval
This ecological time-series study examined the short-term association between heat waves and cardiorespiratory morbidity and mortality among older adults (≥60 years) in the state of São Paulo, Brazil, using data from 2010 to 2019 and from 2023 to 2024. In Brazil, individuals aged ≥ 60 years are officially classified as older adults within public health policies. The years 2020–2022 were excluded from all analyses (morbidity and mortality) to minimize potential distortions related to the COVID-19 pandemic. For mortality outcomes, complete historical data were available up to 2023, but the years 2020–2022 were likewise excluded.
This study used publicly available, anonymized secondary data obtained from the Brazilian Unified Health System (DATASUS). The project was submitted to the Research Ethics Committee of Botucatu Medical School, São Paulo State University (UNESP), which determined that formal ethical approval was not required.
The reporting of this observational study followed the STROBE (Strengthening the Reporting of Observational Studies in Epidemiology) recommendations.
2.2. Study Area and RHDs
The state of São Paulo is the most populous in Brazil and comprises 645 municipalities organized into 17 RHDs, which coordinate healthcare planning and service provision under the State Health Secretariat. Each RHD includes a headquarters municipality and a group of reference municipalities concentrating specialized health services. Analyses at the RHD level allow the assessment of regional inequalities in health outcomes and system capacity. Detailed information on RHD composition is provided in the
Supplementary Material.
2.3. Sociodemographic, Sanitation, and Health System Variables
To characterize contextual vulnerability and support the construction of the Climate Vulnerability Index, sociodemographic, sanitation, and health system indicators were compiled at the RHD level. Sociodemographic variables included the number and proportion of older adults (≥60 years) and the mean Human Development Index (HDI), obtained from the Brazilian Institute of Geography and Statistics (IBGE). Sanitation indicators comprised population coverage of piped water supply and sewerage, also retrieved from IBGE. Health system structure and performance indicators included measures of health service infrastructure, human resources (composite human resources index), primary healthcare coverage, and public health financing (per capita expenditure index). These data were obtained from Fundação SEADE, the Information System on Public Health Budgets (SIOPS), and DATASUS, the national health information system of the Brazilian Unified Health System, and complemented by regional performance indicators described by Paschoalotto et al. (2018) [
10]. These indicators were used to compose the adaptive capacity dimension of the vulnerability index and are summarized in
Table 1 (with additional details in
Supplementary Table S2).
2.4. Climate Data and Definition of Heat Waves
Daily air temperature data were obtained from the ERA5 reanalysis dataset produced by the European Centre for Medium-Range Weather Forecasts (ECMWF) and made available through the Copernicus Climate Data Store. ERA5 provides hourly meteorological data at a spatial resolution of 0.25° with global coverage and has been evaluated against independent observational datasets, demonstrating good agreement for near-surface temperature estimates across a range of climatic conditions [
11]. In addition, previous studies comparing ERA5-derived climatic variables with ground-based meteorological observations in the state of São Paulo have reported moderate agreement in temperature-based indices under local climatic conditions [
12]. Similar evaluations conducted in other Brazilian climatic regions, such as the Caatinga biome, have also demonstrated satisfactory performance of ERA5 for temperature-based analyses [
13].
Original GRIB files were processed using Python (version 3.11) scripts to extract daily temperature series, convert units to degrees Celsius (°C), and export cleaned datasets in comma-separated values (CSV) format for statistical analysis.
To assess potential spatial variability in exposure across Regional Health Departments (RHDs), daily mean temperature time series were initially extracted using region-specific geographic coordinates. Heat-wave occurrence was then evaluated separately for each RHD. This exploratory assessment indicated that the temporal distribution and frequency of heat-wave events were highly synchronous across regions, resulting in minimal inter-regional variability in exposure. Consequently, heat-wave events were operationalized using a spatially aggregated statewide temperature series.
Heat waves were identified based on the historical temperature climatology of the state of São Paulo. A heat wave was defined as a period in which daily air temperatures exceeded the seasonal climatological mean (calculated for the 1991–2020 reference period) by ≥3 °C for at least three consecutive days, in accordance with definitions adopted in Brazilian national studies and public health surveillance frameworks [
14,
15]. Heat-wave exposure was modelled as a binary variable (1 = heat-wave day; 0 = non–heat-wave day). Given the minimal inter-regional variability identified in the preliminary RHD-specific assessment, exposure was treated as a common statewide hazard in subsequent analyses, precluding its inclusion as a spatially discriminating component in the composite vulnerability index.
2.5. Mortality and Hospitalization Data
Daily counts of morbidity and mortality among older adults (≥60 years) were obtained from national health information systems maintained by the DATASUS. Hospital admissions were extracted from the Hospital Information System (SIH/SUS), while mortality data were obtained from the Mortality Information System (SIM/SUS). Microdata were downloaded and pre-processed in R (version 4.5.2) using the microdatasus package [
16], which enables automated extraction, decoding, and standardization of DATASUS records.
The primary outcomes were daily counts of hospital admissions and deaths with a principal diagnosis of cardiovascular or respiratory diseases. Diagnoses were coded according to the International Classification of Diseases, 10th Revision (ICD-10: I00–I99 for cardiovascular diseases and J00–J99 for respiratory diseases), which are recognized as highly sensitive to extreme temperature exposure among older populations. Individual records included the municipality of residence, allowing aggregation at the municipal level and subsequently at the RHD level. Mortality data from the Mortality Information System (SIM) were available through 2023 at the time of analysis, as data for 2024 had not yet been fully consolidated in DATASUS. To avoid potential bias arising from incomplete registration of deaths, mortality analyses were restricted to the period 2010–2023. In contrast, hospitalization data from the Hospital Information System (SIH-SUS) were available through 2024 and were analysed accordingly.
2.6. Statistical Analysis
Analyses were initially conducted separately for cardiovascular and respiratory causes, considering both hospital admissions and deaths (
Supplementary Tables S5 and S6). Given the shared pathophysiological mechanisms underlying heat-related cardiorespiratory decompensation and to enhance statistical precision, cardiovascular and respiratory outcomes were subsequently combined into a single cardiorespiratory category for the primary inferential models. Descriptive statistics were used to characterize temporal and spatial patterns across the 17 RHDs.
The association between heat wave exposure and daily cardiorespiratory outcomes was assessed using a Distributed Lag Non-Linear Model (DLNM) framework [
17], which allows simultaneous estimation of non-linear exposure–response relationships and delayed effects across multiple lag days. Time-series regression models were fitted using Generalized Additive Models (GAM) with a quasi-Poisson distribution to account for overdispersion in count data. Long-term trends and seasonality were controlled using smooth functions of time.
Heatwave exposure was modelled as a binary variable (1 = heatwave day; 0 = non–heatwave day). Accordingly, the exposure–response dimension of the DLNM was specified using a linear function, with flexibility applied exclusively to the lag dimension through a natural cubic spline with 3 degrees of freedom over a lag period of 0–15 days. Long-term trends and seasonality were modelled using a penalized smooth function of time, with approximately 8 degrees of freedom per year of observation (k = 88), and day-of-week effects were included as a categorical variable.
Overdispersion was assessed by comparing residual deviance to model degrees of freedom, and sensitivity analyses using standard Poisson and negative binomial specifications were conducted to verify the stability of cumulative relative risk estimates. Residual autocorrelation was evaluated through inspection of autocorrelation function (ACF) plots.
To assess potential mortality displacement (harvesting), a sensitivity analysis was performed by extending the cumulative lag window from 0–15 days (main model) to 0–30 days within the DLNM framework, allowing evaluation of whether cumulative relative risks attenuated or reversed over longer lag periods (
Supplementary Table S7).
All analyses were conducted in R (version 4.5.2) using the packages dlnm, mgcv, splines, and ggplot2. A two-sided significance level of 5% (p < 0.05) was adopted.
2.7. Heat Wave–Health Linkage
Dates of heat wave events were linked to the daily time series of hospital admissions and deaths among older adults to estimate both immediate and delayed effects. Model results were expressed as relative risks (RR) with corresponding 95% confidence intervals (95% CI). Cumulative effects were estimated from the distributed lag non-linear models to capture the total delayed impact of heat wave exposure over the defined lag period. Heat-wave exposure was implemented as a binary state-level indicator, so that all RHDs shared the same sequence of heat-wave and non–heat-wave days.
2.8. Construction of the Climate Vulnerability Index
The Climate Vulnerability Index for Older Adults in São Paulo by the Regional Health Department was constructed in accordance with the conceptual framework proposed by the Intergovernmental Panel on Climate Change incorporating the dimensions of exposure, sensitivity, and adaptive capacity [
18].
Because heat-wave exposure, operationalized as the number of heat-wave days, showed minimal variability across RHDs, the exposure dimension was not included in the composite index and was used for descriptive purposes only. Consistent with the revised IPCC vulnerability framework discussed by Estoque et al. (2023) [
19], in which exposure is conceptualized as a contextual hazard distinct from spatially varying components of sensitivity and adaptive capacity, we treat heat waves as a broadly shared climatic stressor across regions. Accordingly, the composite index focuses on spatial differences in vulnerability, reflected in sensitivity and adaptive capacity domains, rather than on largely homogeneous exposure patterns. Consequently, DLNM-derived cumulative relative risks were incorporated into the vulnerability index as empirical indicators of regional sensitivity to heat-wave events under relatively homogeneous exposure conditions and should not be interpreted as reflecting spatial variation in exposure–response relationships.
The sensitivity dimension comprised: (i) the proportion of older adults in the population (weight = 0.15); (ii) relative risk of cardiorespiratory hospitalizations among older adults following heat waves (weight = 0.25); and (iii) relative risk of cardiorespiratory mortality among older adults following heat waves (weight = 0.25).
The adaptive capacity dimension included: (i) mean HDI (weight = 0.08); (ii) coverage of piped water supply and sewerage (weight = 0.10); (iii) primary health care coverage through the Family Health Strategy (weight = 0.09); (iv) density of health human resources (weight = 0.05); and (v) public health financing indicators (weight = 0.03).
Primary care coverage was included as a composite index derived from the “Coverage” thematic dimension of the Regional Synthetic Health Indicator of São Paulo State (ISRS/SP). This dimension comprises two indicators: (i) estimated population coverage by primary care teams and (ii) coverage of health conditionality monitoring under the Bolsa Família Program. These indicators were combined using equal weighting and standardized using z-scores, followed by rescaling through the addition of a constant (+3), resulting in a dimensionless score ranging approximately from 0 to 6, with higher values indicating greater structural coverage of primary care services at the regional level [
10].
The weighting structure was defined according to the conceptual and temporal proximity of each indicator to the risk of acute cardiorespiratory decompensation associated with heat-wave exposure. As the index was designed to capture short-term vulnerability to heat-related health events among older adults, greater weights were assigned to empirically estimated outcome indicators derived from the distributed lag non-linear models—namely, the cumulative relative risks of cardiorespiratory hospitalizations and mortality—given their direct representation of observed population-level responses to heat exposure. Equal weighting was adopted to capture different levels of clinical severity without bias toward either service availability (which may influence hospitalization rates) or fatal outcomes (which may be affected by access to care).
The proportion of older adults was assigned a lower weight as a demographic predisposing factor rather than a direct measure of outcome manifestation.
Within the adaptive capacity domain, sanitation coverage and primary healthcare coverage were weighted more heavily due to their immediate relevance to hydration, behavioural adaptation, early detection of clinical deterioration, and community-based monitoring during heat events. In contrast, HDI, health workforce density, and public health financing were weighted more conservatively, reflecting their more distal relationship with short-term physiological responses to thermal stress and their indirect influence on acute heat-related morbidity and mortality.
Indicator selection and weighting were informed by IPCC and WHO/PAHO [
20] frameworks. Although weighting schemes inherently involve normative choices, weights were assigned based on theoretical relevance and empirical evidence from previous climate–health vulnerability indices, with greater emphasis placed on health outcome indicators that directly reflect observed impacts of heat exposure among older adults.
All indicators were normalized using Min–Max scaling, with inverse normalization applied when higher values corresponded to lower vulnerability. The final index was calculated as a weighted sum of the sensitivity (total weight = 0.65) and adaptive capacity (total weight = 0.35) dimensions.
The normalized composite vulnerability index was classified into three categories (low, moderate, and high vulnerability) using empirically derived terciles based on the distribution of index values across the 17 RHDs. The cut-off points were ≤0.459 for low vulnerability, >0.459 to ≤0.527 for moderate vulnerability, and >0.527 for high vulnerability. A detailed description of indicators, weights, and theoretical justifications is provided in the
Supplementary Material.
A sensitivity analysis was conducted to assess the robustness of the composite vulnerability index to alternative weighting and classification schemes (
Supplementary Table S3). The index was recalculated using equal weights for all nine indicators and reclassified into low, moderate, and high vulnerability using empirically derived terciles of the unweighted scores across the 17 RHDs.
2.9. Data Availability, Code, and Use of Artificial Intelligence
All scripts used for climate data processing (Python version 3.11) and statistical analyses (R 4.5.2) were deposited in GitHub (
https://github.com/rfsaldanha/microdatasus; accessed on 15 October 2024). The microdatasus R package (version 2.4.3) was used for data extraction from the DATASUS platform.
The microdatasus R package was used for mortality data extraction from the DATASUS platform. The GitHub repository cited refers to the source code of the microdatasus package and not to the study-specific analytical scripts. The scripts used for data processing and statistical modelling in this study are available from the corresponding author upon reasonable request.
Health data were obtained from publicly available DATASUS, and climate data were sourced from the Copernicus Climate Data Store (ERA5).
Generative artificial intelligence tools were used exclusively for language editing and minor text refinement and did not influence study design, data collection, analysis, interpretation, or visualization. No generative AI tool was used to generate data, graphics, or analytical code.
4. Discussion
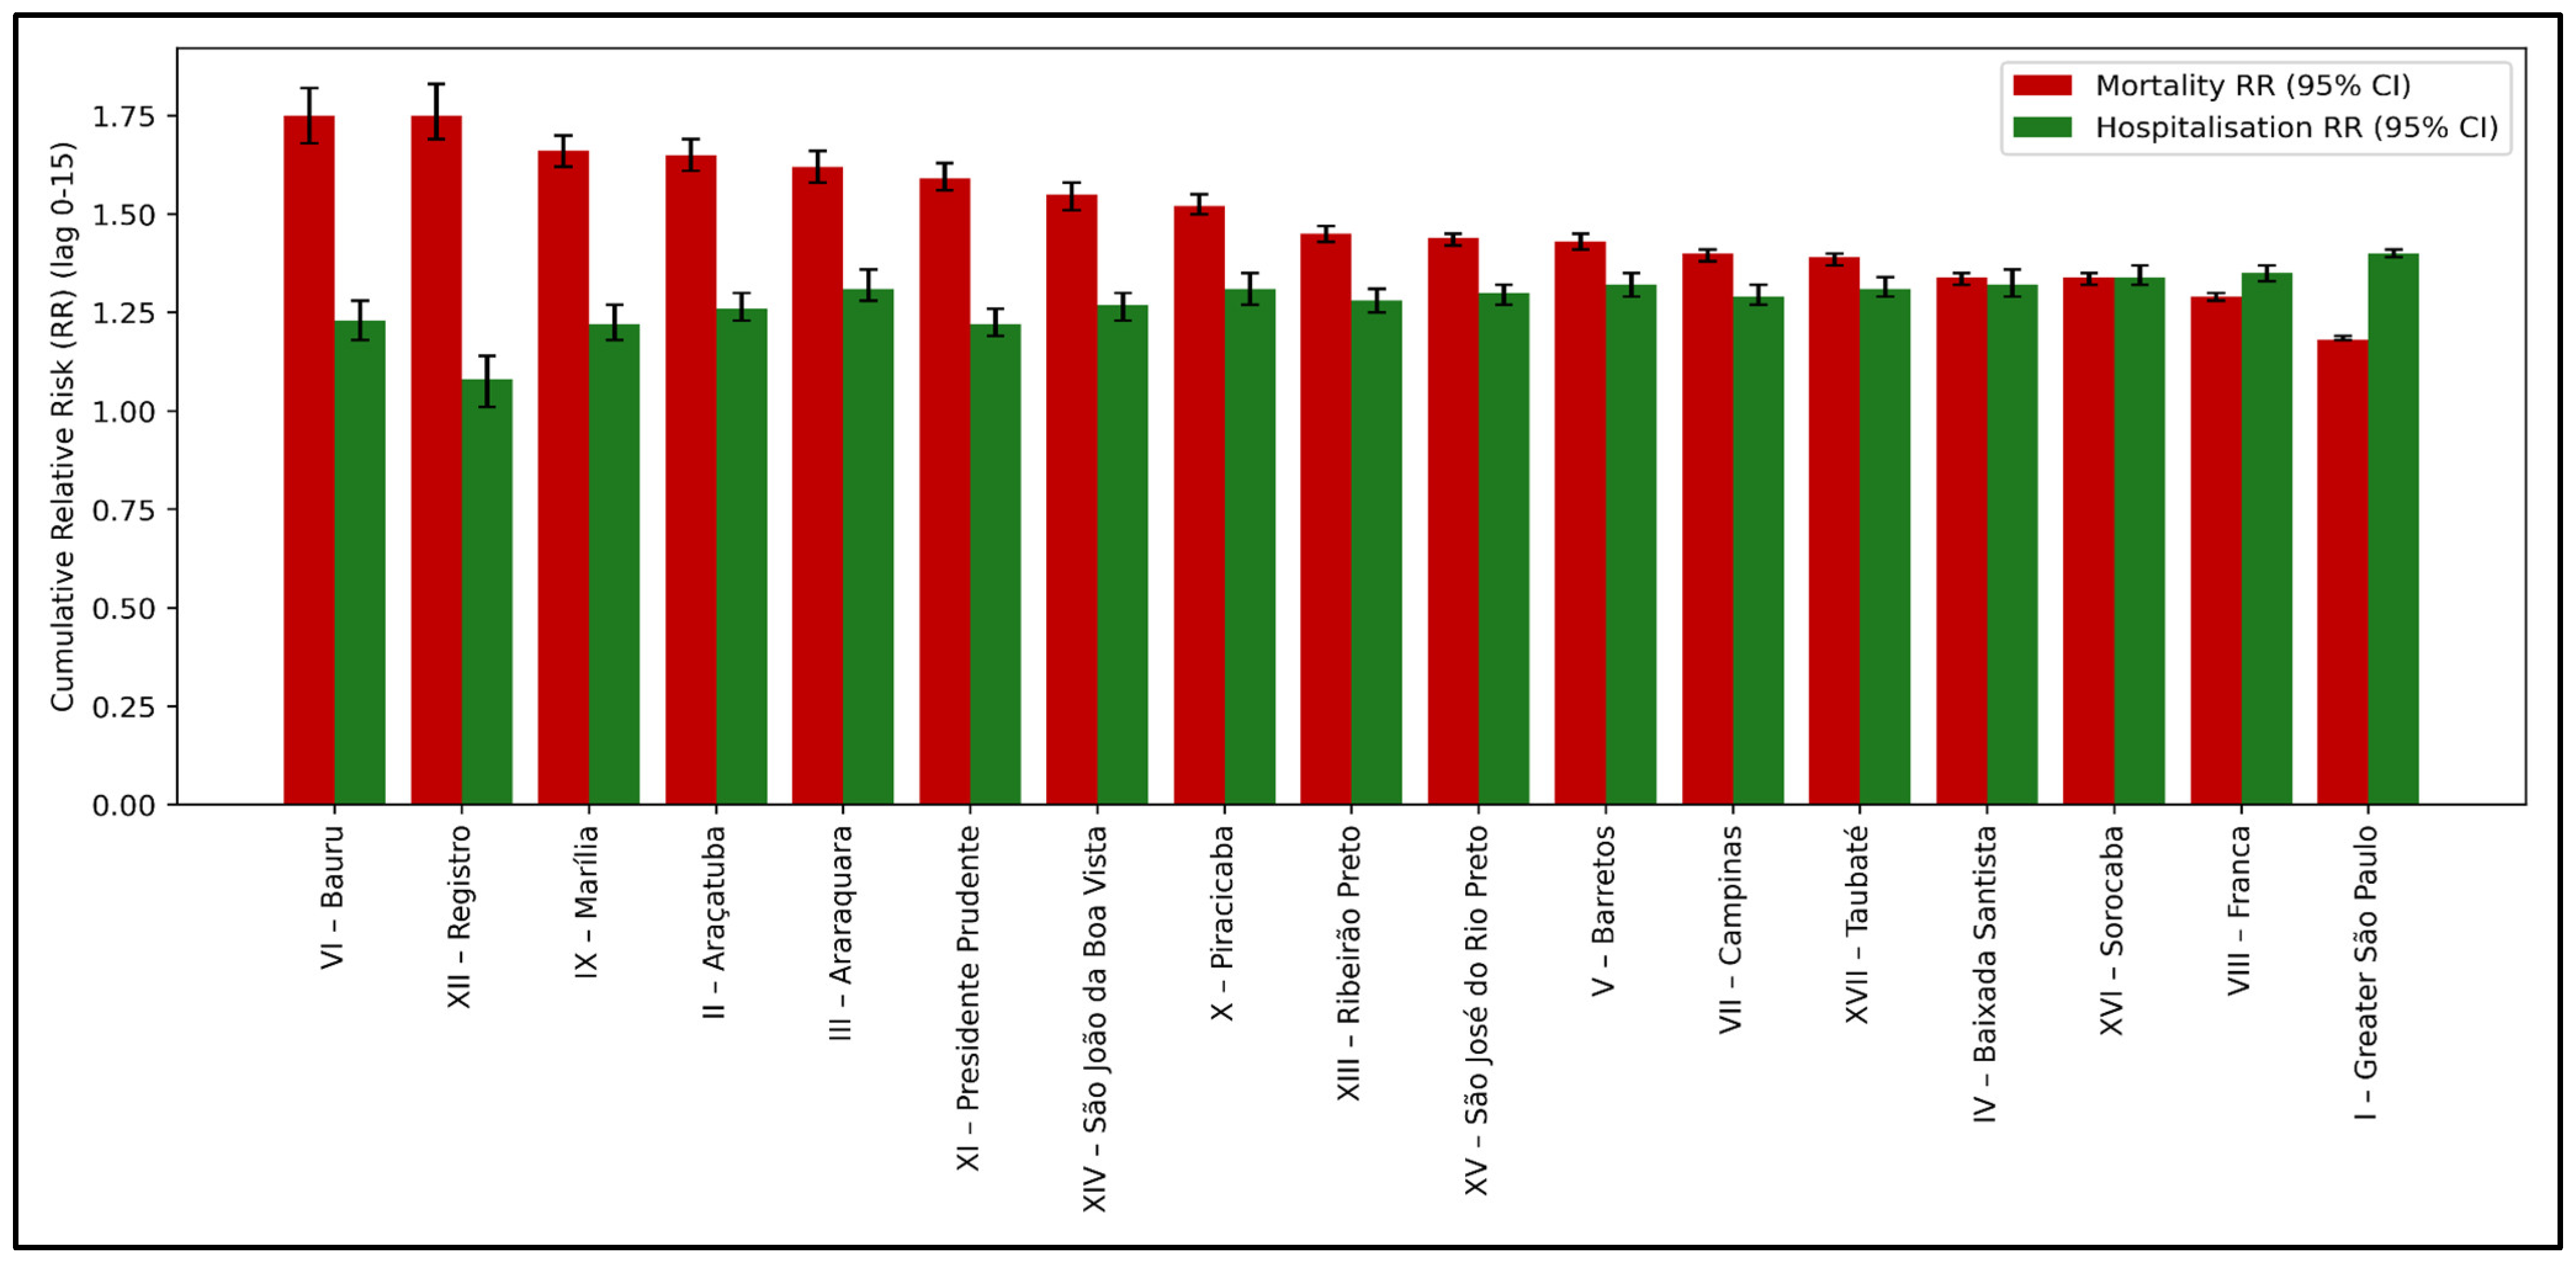
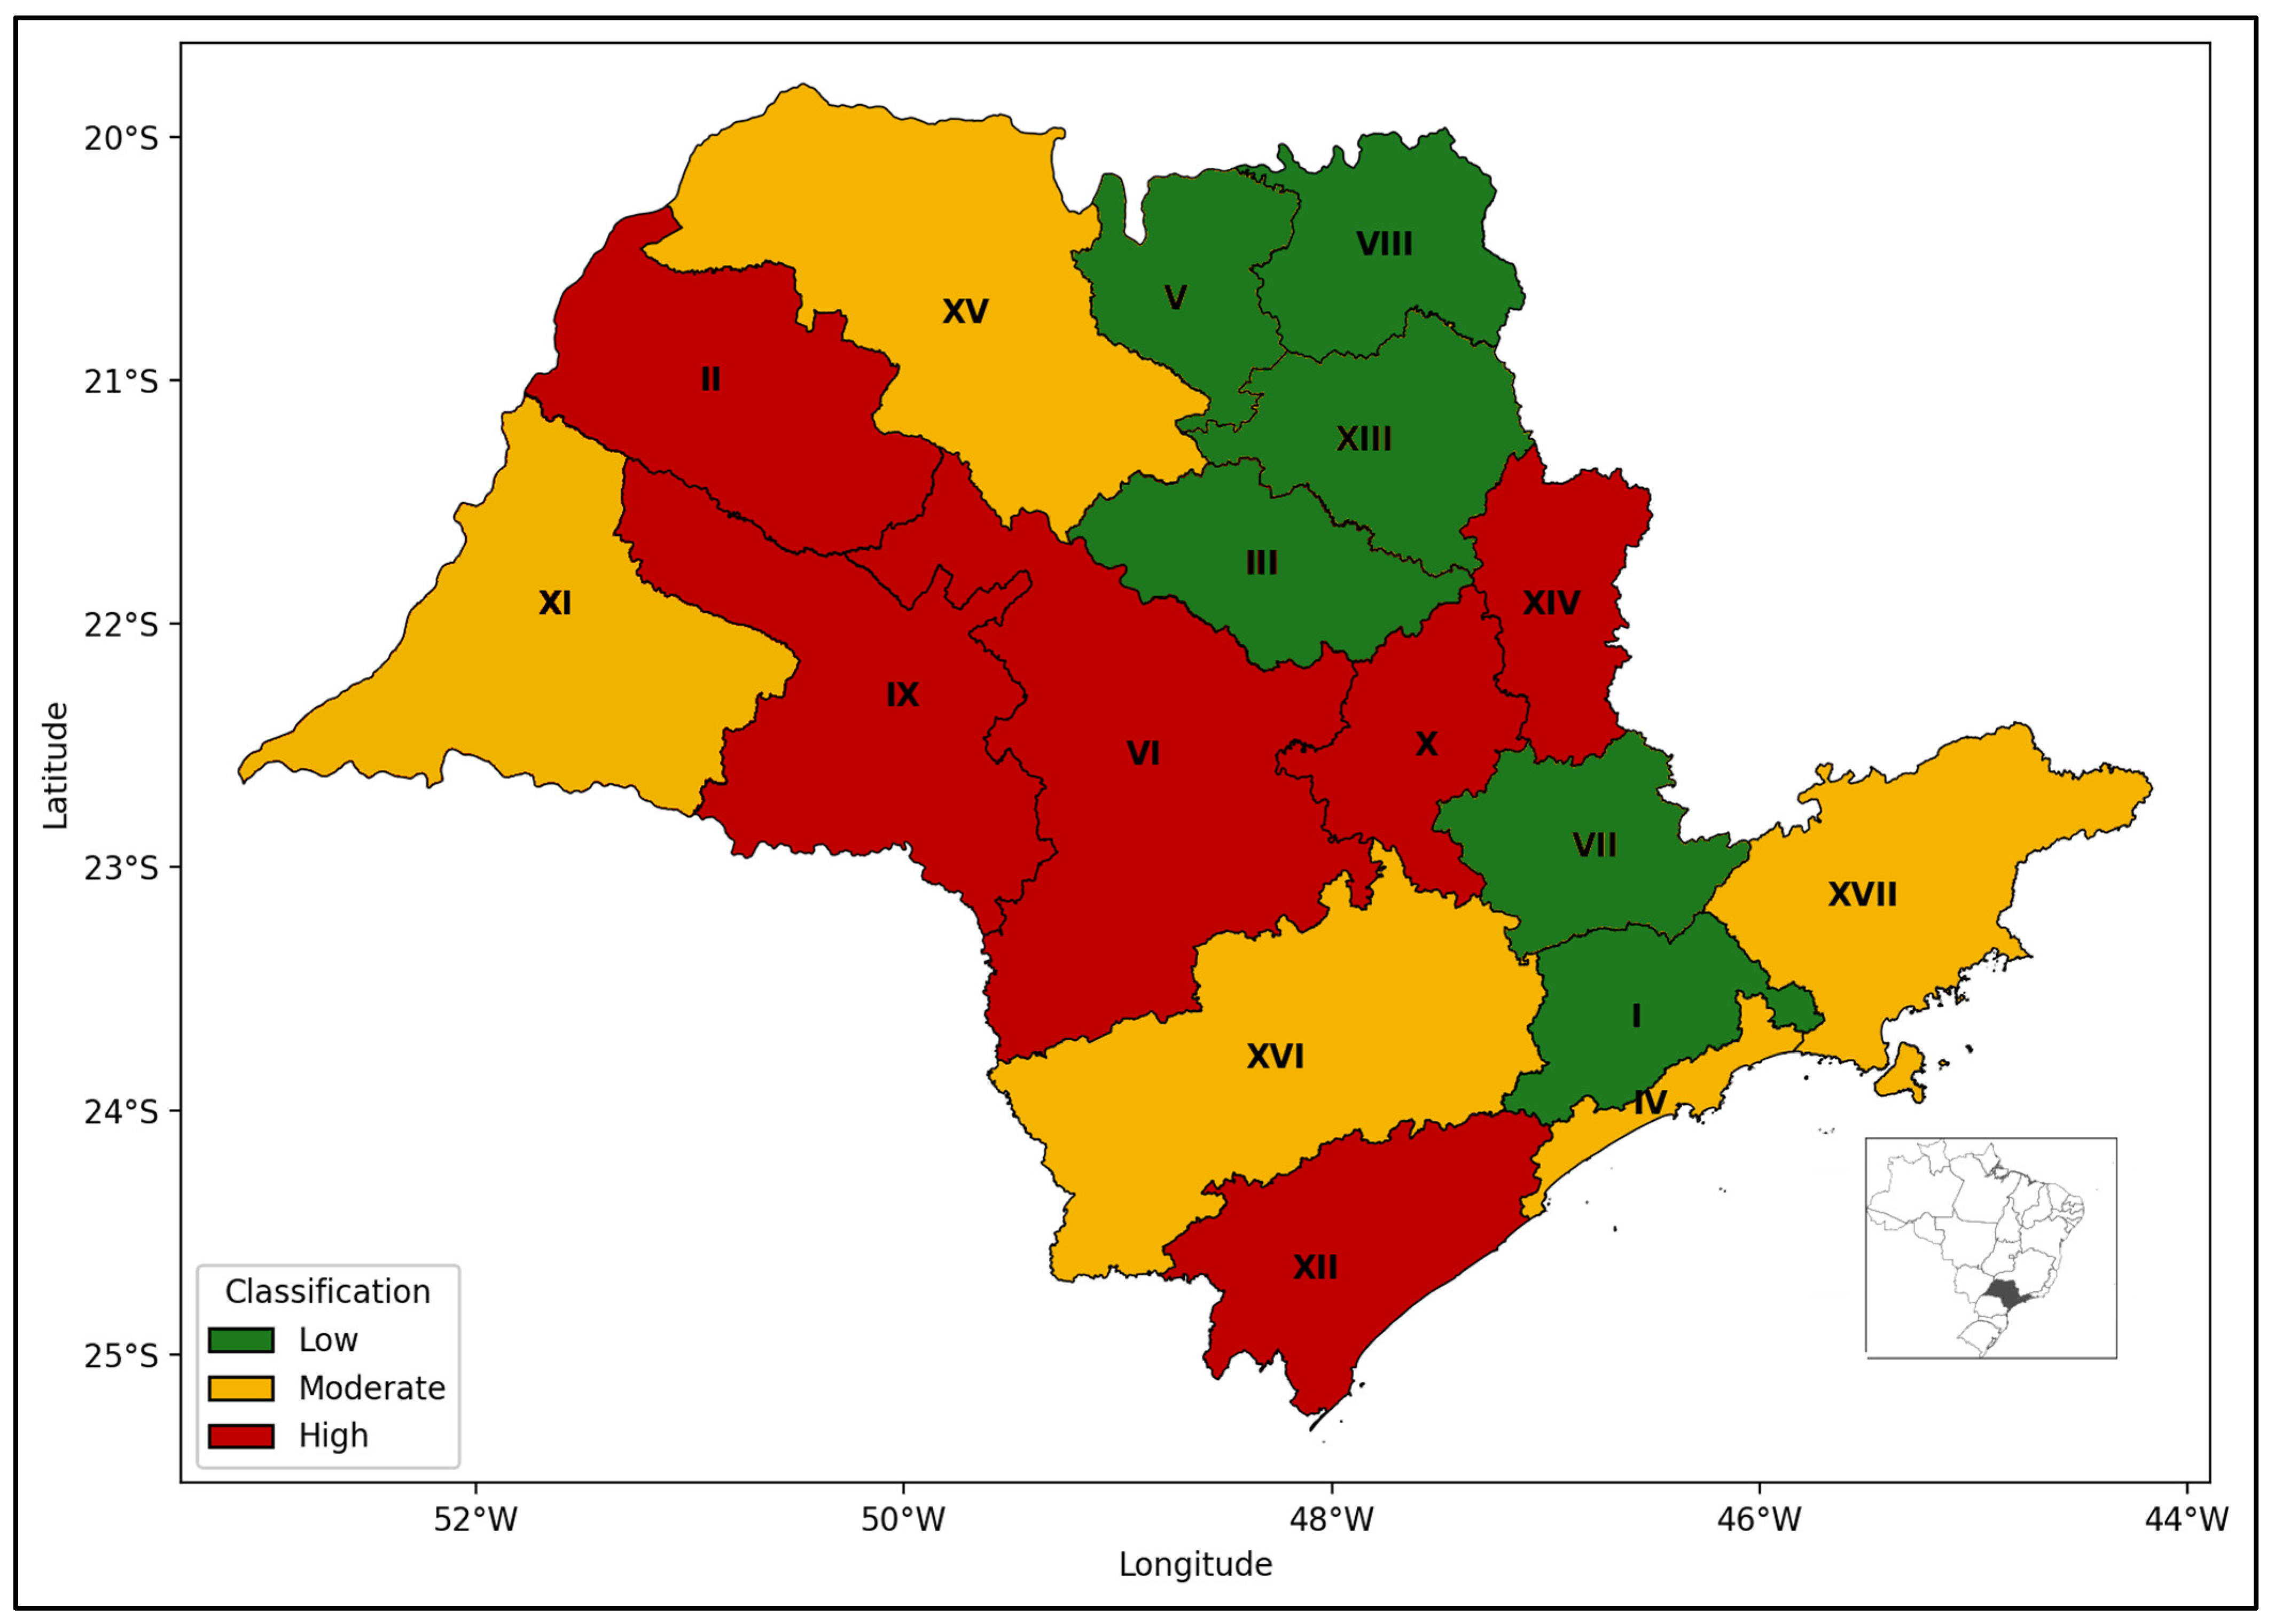
By integrating cumulative relative risk estimates with spatial representations of the Climate Vulnerability Index, this study demonstrates marked spatial heterogeneity in the health impacts of heat waves among older adults in São Paulo State.
Narrow confidence intervals in some RHDs likely reflect not only differences in average daily event counts but also the large number of observations across the full time series and the cumulative estimation structure of the distributed lag model. Because the DLNM uses the entire temporal series and smooths the lag–response relationship through spline functions, relatively precise estimates may be obtained even in regions with lower daily event counts.
The integration of composite vulnerability indices to assess spatial heterogeneity has been widely applied in climate change research in Brazil, particularly in subnational analyses [
21].
Our findings are consistent with nationwide evidence showing a significant association between heat exposure and hospitalizations in Brazil. A large multicity study covering more than 1800 cities between 2000 and 2015 reported that approximately 6% of hospitalizations during hot seasons were attributable to heat exposure, with a disproportionate burden among older adults and marked geographic heterogeneity [
22]. While that study quantified the overall heat-related morbidity burden, our analysis advances this evidence by identifying regional patterns of vulnerability within São Paulo State, highlighting the role of demographic structure, health outcomes, and adaptive capacity in shaping unequal health impacts under relatively homogeneous heat exposure conditions. This finding suggests that regional differences in heat-related health impacts are driven less by climatic variation and more by contrasts in demographic structure, socioeconomic conditions, pre-existing health status, and adaptive capacity, which emerge as central determinants of regional heat-related risk.
The stronger association observed between heat waves and mortality compared with hospitalizations is consistent with known physiological vulnerabilities of older adults to thermal stress. Large multicity evidence from Latin America shows that marginal increases in high temperatures are associated with steep rises in mortality risk, particularly among older adults and for cardiovascular and respiratory causes [
23].
Sensitivity analyses extending the cumulative lag window to 30 days showed attenuation of the estimated effects but no reversal of risk across regions, suggesting that the observed mortality increase cannot be explained solely by short-term mortality displacement, a phenomenon commonly described in studies of heat-related mortality [
24].
Age-related impairments in thermoregulation, reduced sweating capacity, diminished cardiovascular reserve, and a higher prevalence of chronic cardiorespiratory conditions may limit the ability of older adults to compensate for extreme heat exposure. Dehydration, electrolyte imbalance, increased blood viscosity, and heightened cardiovascular strain can precipitate acute events such as arrhythmias, heart failure decompensation and ischemic episodes, potentially leading to death without prior hospital admission, particularly in frail or medically complex individuals. These mechanisms, together with the higher prevalence of chronic cardiopulmonary and metabolic diseases among older adults, are consistent with systematic review evidence showing that heat waves disproportionately increase mortality and morbidity in older adults and medically vulnerable groups [
25].
While these mechanisms highlight the biological susceptibility of older adults to extreme heat, vulnerability is not determined by physiology alone. Biological fragility is often amplified by social and structural conditions, such as poverty, racial inequities, housing quality, and unequal access to cooling and healthcare.
In addition to ambient temperature, environmental co-exposures such as relative humidity and air pollution may influence heat-related health outcomes. High humidity can impair evaporative heat loss and increase thermal strain, particularly among older adults with reduced thermoregulatory capacity [
6,
26]. Likewise, exposure to air pollutants such as particulate matter and ozone may exacerbate cardiovascular and respiratory vulnerability during heat-wave events through inflammatory and oxidative stress pathways. Recent studies have also highlighted that heat-related health risks may be modulated by environmental conditions such as urban air pollution and built-environment characteristics, which may amplify or interact with thermal stress at the population level [
27]. In Brazil, the availability of ground-based air quality monitoring data remains geographically heterogeneous, with monitoring networks concentrated mainly in large metropolitan areas, which limits the incorporation of air pollution variables in regional epidemiological analyses [
28].
Although these environmental co-exposures were not explicitly modelled in the present distributed lag non-linear framework, they may act as mediators or effect modifiers in the pathway between heat exposure and adverse health outcomes. Their interaction with thermal stress may therefore contribute to residual heterogeneity in regional risk estimates.
Beyond biological susceptibility, the heterogeneous distribution of climate vulnerability across regions reflects underlying social, environmental, and health-system inequalities. Recent Brazilian evidence from the 2023 extreme heat wave in Rio de Janeiro illustrates how extreme heat events disproportionately affect socially vulnerable populations [
29].
In the present study, regions classified as highly vulnerable tended to combine greater demographic sensitivity and lower adaptive capacity, including higher proportions of older adults, less favorable socioeconomic conditions, limited access to cooling resources, and a higher burden of chronic diseases. This pattern further supports the usefulness of the index as a tool to identify territories where social, environmental, and health system factors converge to amplify heat-related risks among older adults.
Consistent with these findings, Santos et al. reported that heat-related excess mortality in the 14 most populous Brazilian urban areas was highest among older adults, individuals with low educational attainment and Black and Brown populations, highlighting the intersection between social stratification and climatic risk [
30].
RHDs such as Greater São Paulo, Campinas, and Ribeirão Preto—among the most populous and economically developed areas of the state—were classified as having low climate vulnerability, whereas more peripheral and less affluent regions concentrated the highest vulnerability scores. This pattern, in which metropolitan and economically more developed regions generally exhibit lower vulnerability, likely reflects better housing conditions, greater availability of healthcare services and higher adaptive capacity. These findings align with the climate-vulnerability framework adopted in IPCC assessments, where exposure, sensitivity and adaptive capacity jointly determine climate-related risk [
19,
31], and with empirical studies showing that heat-related mortality and morbidity disproportionately affect socioeconomically deprived or underserved communities through mechanisms involving housing quality, neighborhood context, access to cooling and pre-existing health inequalities [
32].
Taken together, these findings indicate that the observed spatial pattern of climate vulnerability among older adults is primarily driven by differences in sensitivity and adaptive capacity, rather than by substantial spatial variation in heat-wave exposure. Accordingly, the index was conceived to capture regional differences in vulnerability under conditions of relatively homogeneous heat-wave exposure, thereby highlighting how variations in sensitivity and adaptive capacity among older populations lead to unequal health impacts across territories.
In our study, the heat wave definition was implemented as a binary state-level trigger that was invariant across RHDs, meaning that all regions experienced the same sequence of heat-wave and non–heat-wave days. As a result, the between-RHD heterogeneity in DLNM-derived RRs reflects regional differences in health outcomes under a shared exposure pattern rather than truly distinct exposure–response relationships. This should be considered when interpreting these RRs as inputs to the vulnerability index and when describing the analysis as regionally differentiated.
From a public health perspective, the observed regional disparities have important implications for the Unified Health System (SUS). The identification of highly vulnerable RHDs in our study aligns with previous work emphasizing that heat-related health risks in Brazil are strongly shaped by regional socioeconomic and environmental inequalities across Brazilian regions [
33].
Integrating climate- and heat-vulnerability indicators into regional health planning within the SUS could support more efficient allocation of resources and improve preparedness for extreme heat events, especially in territories where older adults are overrepresented. In this context, highly vulnerable regions become priority areas for targeted adaptation strategies, including heat–health early warning systems, active surveillance of older adults during heat waves and strengthening of primary care and emergency response capacity, which are essential to reduce avoidable morbidity and mortality among older adults in an ageing and warming society [
34,
35].
In line with heat vulnerability mapping approaches [
36], the proposed index could be incorporated into the situational analysis phase of Regional Health Plans to identify territories with higher sensitivity to heat-related cardiorespiratory outcomes. At the Regional Health Department level, this information may support preparedness planning within Intermanagement Regional Commissions, such as prioritizing Family Health Strategy team coverage in high-vulnerability areas, implementing targeted heat–health risk communication during forecasted extreme heat events, and strengthening emergency care network readiness during heatwave periods.
Climate change is increasingly recognized as a major stressor to population health and to the health systems that aim to safeguard well-being, particularly in low- and middle-income countries. In this context, climate change and health vulnerability and adaptation assessments are considered an important strategy to inform decision-makers about current weather–health relationships, vulnerable groups, future risks, and priority adaptation options [
37].
Our vulnerability index responds directly to these needs by providing a standardized, operational tool that summarizes multidimensional heat-related vulnerability among older adults across RHDs, thus generating information that is readily usable within routine SUS planning and governance processes.
However, international experience indicates that, despite the growing number of such assessments, their results have not consistently contributed to a cumulative, comparable global evidence base and are often not effectively integrated into adaptation decision-making.
In many settings, this reflects the limited participation of the health sector in national climate policy processes and persistent barriers, including restricted data access, a scarcity of climate–health models, uncertainties in climate projections, and insufficient funding and technical capacity, particularly in developing countries [
33].
By relying on publicly available health, demographic, and socioeconomic data, our study illustrates a feasible pathway to build a heat-vulnerability index in a data- and resource-constrained context, offering a pragmatic template that could be adapted by other health systems facing similar challenges. Although this approach does not overcome structural constraints such as limited funding, data gaps, or modeling capacity, it provides proof of concept that useful decision-support tools can be developed even in resource-constrained settings. Importantly, translating vulnerability assessments into concrete adaptation actions requires explicit integration with climate-resilient health system agendas and multisectoral governance. In this context, the index can facilitate coordination between the health sector and other sectors—such as environment, civil protection, and urban planning—by providing a common territorial metric that can be used to align health priorities with broader climate adaptation and disaster risk reduction strategies.
Finally, previous work has highlighted the need for capacity building and partnerships to enable vulnerability and adaptation assessments from local to national levels and to ensure that the resulting evidence is translated into effective policies and interventions [
32]. In addition, periodically updating the index would allow changes in heat-related vulnerability to be monitored over time, for instance, following expansions in primary care coverage, socioeconomic shifts, or the implementation of adaptation policies. In this sense, the index functions not only as a diagnostic tool, but also as a practical instrument for tracking the effects of health and social interventions on climate-related vulnerability among older adults.
The application and periodic updating of our index within the SUS could be embedded in such capacity-building efforts, for example, through collaborations between health authorities, academia, and meteorological and environmental agencies, and through the development of technical guidance and training for subnational health managers. In this way, the index not only characterizes current spatial patterns of vulnerability but can also serve as a practical entry point for strengthening institutional capacity to plan, implement, and evaluate health adaptation to climate change.
As climate change continues to intensify the frequency and severity of heatwaves, tools capable of identifying territorially differentiated vulnerability become increasingly important to guide equitable and evidence-based public health adaptation strategies. In this context, to our knowledge, this study is the first to integrate distributed lag models with a regional vulnerability index to assess heatwave-related health impacts among older adults in Brazil, providing an operational framework that can support climate–health planning within regional health systems.
5. Limitations
This study has several limitations that should be considered when interpreting the findings. The vulnerability index was constructed using secondary data aggregated at the level of RHDs, which may mask important intra-regional heterogeneities and local micro-environments of risk. The selection and operationalization of indicators were constrained by data availability and quality, meaning that some relevant social, environmental, and health system dimensions (for example, informal housing conditions, micro-urban heat island characteristics, or detailed indicators of primary care performance) could not be incorporated, potentially leading to residual confounding or misclassification of vulnerability.
The analysis did not explicitly model environmental co-exposures such as relative humidity or ambient air pollutants (e.g., PM
2.5 and ozone), which may interact with thermal stress and influence heat-related health outcomes. These variables were not included in the primary models due to the absence of consistent daily monitoring data across all Regional Health Departments for the full study period. In Brazil, the availability of air quality monitoring data remains geographically heterogeneous, with monitoring networks concentrated mainly in large metropolitan areas. In addition, studies evaluating satellite- or model-derived PM2.5 estimates have identified systematic discrepancies when compared with ground monitoring data, indicating the need for local validation before their use in epidemiological analyses [
38]. Their exclusion may introduce residual confounding, particularly in relation to short-term temporal patterns in healthcare utilization.
Furthermore, the index captures structural vulnerability to heat under recent climatic conditions and does not explicitly account for future changes in climate, demographics, or health system capacity, so its values should not be interpreted as fixed characteristics of territories over time. Finally, although the index was developed to be conceptually generalizable, its specific configuration reflects the organization and data infrastructure of the Brazilian Unified Health System and may require adaptation and local validation before being applied in other health system contexts or to other population groups.
In addition, heat-wave exposure was represented by a binary state-level indicator that was invariant across RHDs, so all regions shared the same sequence of heat-wave and non–heat-wave days. As discussed above, this means that between-RHD heterogeneity in DLNM-derived RRs reflects differences in health responses under a common hazard pattern, rather than fully distinct exposure–response relationships, which may affect the validity of incorporating these RRs as sensitivity components within the vulnerability index.
The inclusion of DLNM-derived cumulative relative risks as sensitivity components in the vulnerability index may introduce partial circularity, as these estimates were derived from the same outcome data used in index construction.
Although a sensitivity analysis using equal weighting was conducted, the reclassification of certain RHDs (e.g., Araçatuba and Araraquara from High to Moderate vulnerability) indicates that regional vulnerability rankings may be influenced by weighting choices.
The use of different temporal coverage for hospitalization and mortality outcomes may affect the direct comparability of DLNM-derived relative risks incorporated into the vulnerability index. However, mortality analyses were restricted to the last fully consolidated year available in DATASUS to minimize bias due to delayed death registration in the national mortality information system.
Additionally, the use of aggregated regional-level indicators may introduce the possibility of ecological fallacy, as associations observed at the Regional Health Department level may not necessarily reflect individual-level risk relationships. Therefore, the vulnerability patterns identified should be interpreted as contextual population-level estimates rather than direct predictors of individual susceptibility.




 ,
,