1. Introduction
Workplace design plays a central role in shaping employee well-being, productivity, and organizational effectiveness. Because employees spend a substantial portion of their daily lives indoors, particularly in office settings, the quality of the indoor environment directly affects comfort, health, and work performance [
1,
2]. For this reason, increasing attention has been given to IEQ as a critical component of healthy and supportive workplace design. IEQ refers to the environmental conditions within buildings that influence how occupants experience and perceive indoor spaces. These conditions commonly include thermal comfort, indoor air quality, lighting quality, and the acoustic environment [
3,
4]. Together, these factors shape occupants’ interactions with their surroundings and influence their satisfaction with the workplace environment [
5]. Research also indicates that workplace aesthetics and access to views can positively influence well-being, comfort, contextual performance, time management, and task performance, suggesting that the quality of the visual environment is also important in office settings [
6].
A substantial body of research in environmental psychology and building science shows that the physical environment is closely linked to human behavior and organizational performance. Poor indoor environmental conditions, including inadequate ventilation, excessive noise, uncomfortable temperatures, and poor lighting, have been associated with increased fatigue, reduced concentration, diminished well-being, and lower workplace satisfaction [
1,
2]. In contrast, improvements in environmental conditions can support employee comfort, enhance cognitive functioning, and improve workplace productivity [
3,
4,
7]. Importantly, IEQ is now widely understood as a multidimensional concept rather than a narrow measure of environmental comfort. Contemporary research emphasizes that employees experience multiple environmental domains simultaneously, including thermal conditions, lighting, acoustics, indoor air quality, and spatial characteristics such as layout and furniture [
4,
8,
9]. These domains interact to shape both physical and psychological experiences at work. For example, studies of open-plan and research office environments show that acoustic conditions, especially conversation noise and background sound, can strongly affect concentration and perceived productivity, often more than other IEQ factors [
10]. Workplaces are also undergoing significant transformation as hybrid work models become more common. These models require office environments that support multiple forms of work, including focused individual tasks, collaborative work, informal interaction, and transitions between these modes. In this context, workplace design and IEQ are increasingly recognized as strategic resources that support not only cognitive performance but also social interaction, psychological well-being, and organizational effectiveness [
11,
12,
13]. As a result, improving IEQ has become an important priority in workplace planning, design, and management.
1.1. Studies Linking IEQ to Employee Outcomes
A large body of research has examined the relationship between IEQ and employee outcomes such as health, comfort, productivity, and workplace satisfaction. Across studies, the evidence consistently shows that conditions within office environments influence employees’ physical comfort, psychological well-being, and work effectiveness [
3,
4,
5,
6]. Research on indoor air quality provides particularly strong evidence of this relationship. Experimental studies have shown that higher ventilation rates and improved air quality can enhance perceived air quality and task performance [
2]. Similarly, literature reviews and field studies indicate that elevated exposure to carbon dioxide, particulate matter, ozone, and other pollutants is associated with increased health complaints and reduced productivity [
1,
8,
14]. These findings underscore the importance of maintaining healthy indoor air conditions as part of workplace design and building operation.
Acoustic comfort is another major determinant of employee experience and performance. In office environments, particularly open-plan settings, noise can disrupt concentration, communication, and task execution. Research conducted in university open-plan research offices across nineteen universities in China found that the acoustic environment had the strongest effect on perceived productivity among five major IEQ dimensions, with conversation noise and related disturbances exerting especially strong effects [
10]. Other studies have likewise shown that privacy and communication must be carefully balanced in office design, as excessive openness can undermine satisfaction and performance [
5]. Lighting quality is also a critical dimension of IEQ. Lighting conditions affect visual comfort, alertness, mood, and cognitive functioning. Research has shown that access to daylight and natural views can improve cognitive performance, reduce visual fatigue, and increase workplace satisfaction [
15,
16,
17]. Daylight exposure also plays an important role in circadian regulation and sleep quality, both of which influence employee health and functioning [
16]. In addition, broader visual and aesthetic qualities of the workplace environment contribute to perceived comfort and productivity [
6,
9]. Beyond conventional IEQ domains, studies increasingly highlight the importance of restorative and perceptual features of the workplace. Biophilic design, which incorporates natural elements such as vegetation, natural materials, and views of nature, has been associated with reduced stress, improved mood, and enhanced cognitive performance [
15,
17,
18]. These findings suggest that environmental support for restoration and psychological well-being is a meaningful component of overall workplace quality. Another important factor is personal environmental control. Employees who can adjust aspects of their environment, such as lighting, thermal settings, or ventilation, generally report greater comfort and satisfaction [
4,
5,
19]. Personal control has also been linked to reduced environmental stress and improved psychological well-being, reinforcing the idea that workplace quality is shaped not only by objective conditions but also by how much agency employees have over those conditions. Although the evidence clearly demonstrates that IEQ influences a wide range of employee outcomes, many studies have focused on single environmental variables rather than examining how multiple conditions operate together. This is a meaningful limitation because workplace experience is inherently multisensory and multidimensional. Recent reviews and empirical studies argue that IEQ should be understood as an integrated system in which domains interact and jointly influence satisfaction, comfort, health, and performance [
8,
9]. For example, research has shown that irrelevant speech, temperature, and ventilation rate can simultaneously affect task performance and workplace satisfaction, demonstrating the importance of considering combined environmental exposures rather than isolated factors [
20]. Similarly, studies combining objective environmental monitoring with worker reports show that exposure profiles involving carbon dioxide, particulates, ozone, noise, temperature, and illuminance are associated with health symptoms, productivity complaints, and overall satisfaction [
8].
1.2. Research Gaps, Conceptual Framework, and Research Questions
Despite the growing literature on IEQ, several important gaps remain. Much of the existing research examines environmental variables independently, even though employees experience lighting, acoustics, thermal comfort, air quality, and spatial conditions simultaneously. This fragmented approach limits understanding of how combined environmental conditions shape employee experience and workplace outcomes in real-world settings [
4,
8,
9]. In addition, many studies focus primarily on productivity and environmental satisfaction, overlooking broader psychosocial dimensions such as collaboration, engagement, and social connectivity, which are increasingly critical in hybrid work environments [
3,
5,
21,
22]. These limitations are particularly relevant in hybrid workplaces, where employees move between spaces designed for concentration, interaction, and informal exchange. The effectiveness of these transitions depends not only on spatial availability but also on environmental quality. Factors such as acoustics, lighting, thermal comfort, layout, and personal control influence how well employees can shift between focused and collaborative work modes [
23,
24]. At the same time, public sector workplaces remain underexamined, despite often operating under unique constraints such as aging infrastructure and diverse workforce needs, which may shape both environmental conditions and employee experiences [
8,
25]. At a broader level, growing global concern around mental health, stress, and social disconnection has reinforced the importance of supportive workplace environments. Emerging interdisciplinary frameworks, including Brain Capital, emphasize that environments play a critical role in supporting cognitive functioning, resilience, and social connectedness, extending beyond traditional notions of comfort and efficiency [
26,
27,
28].
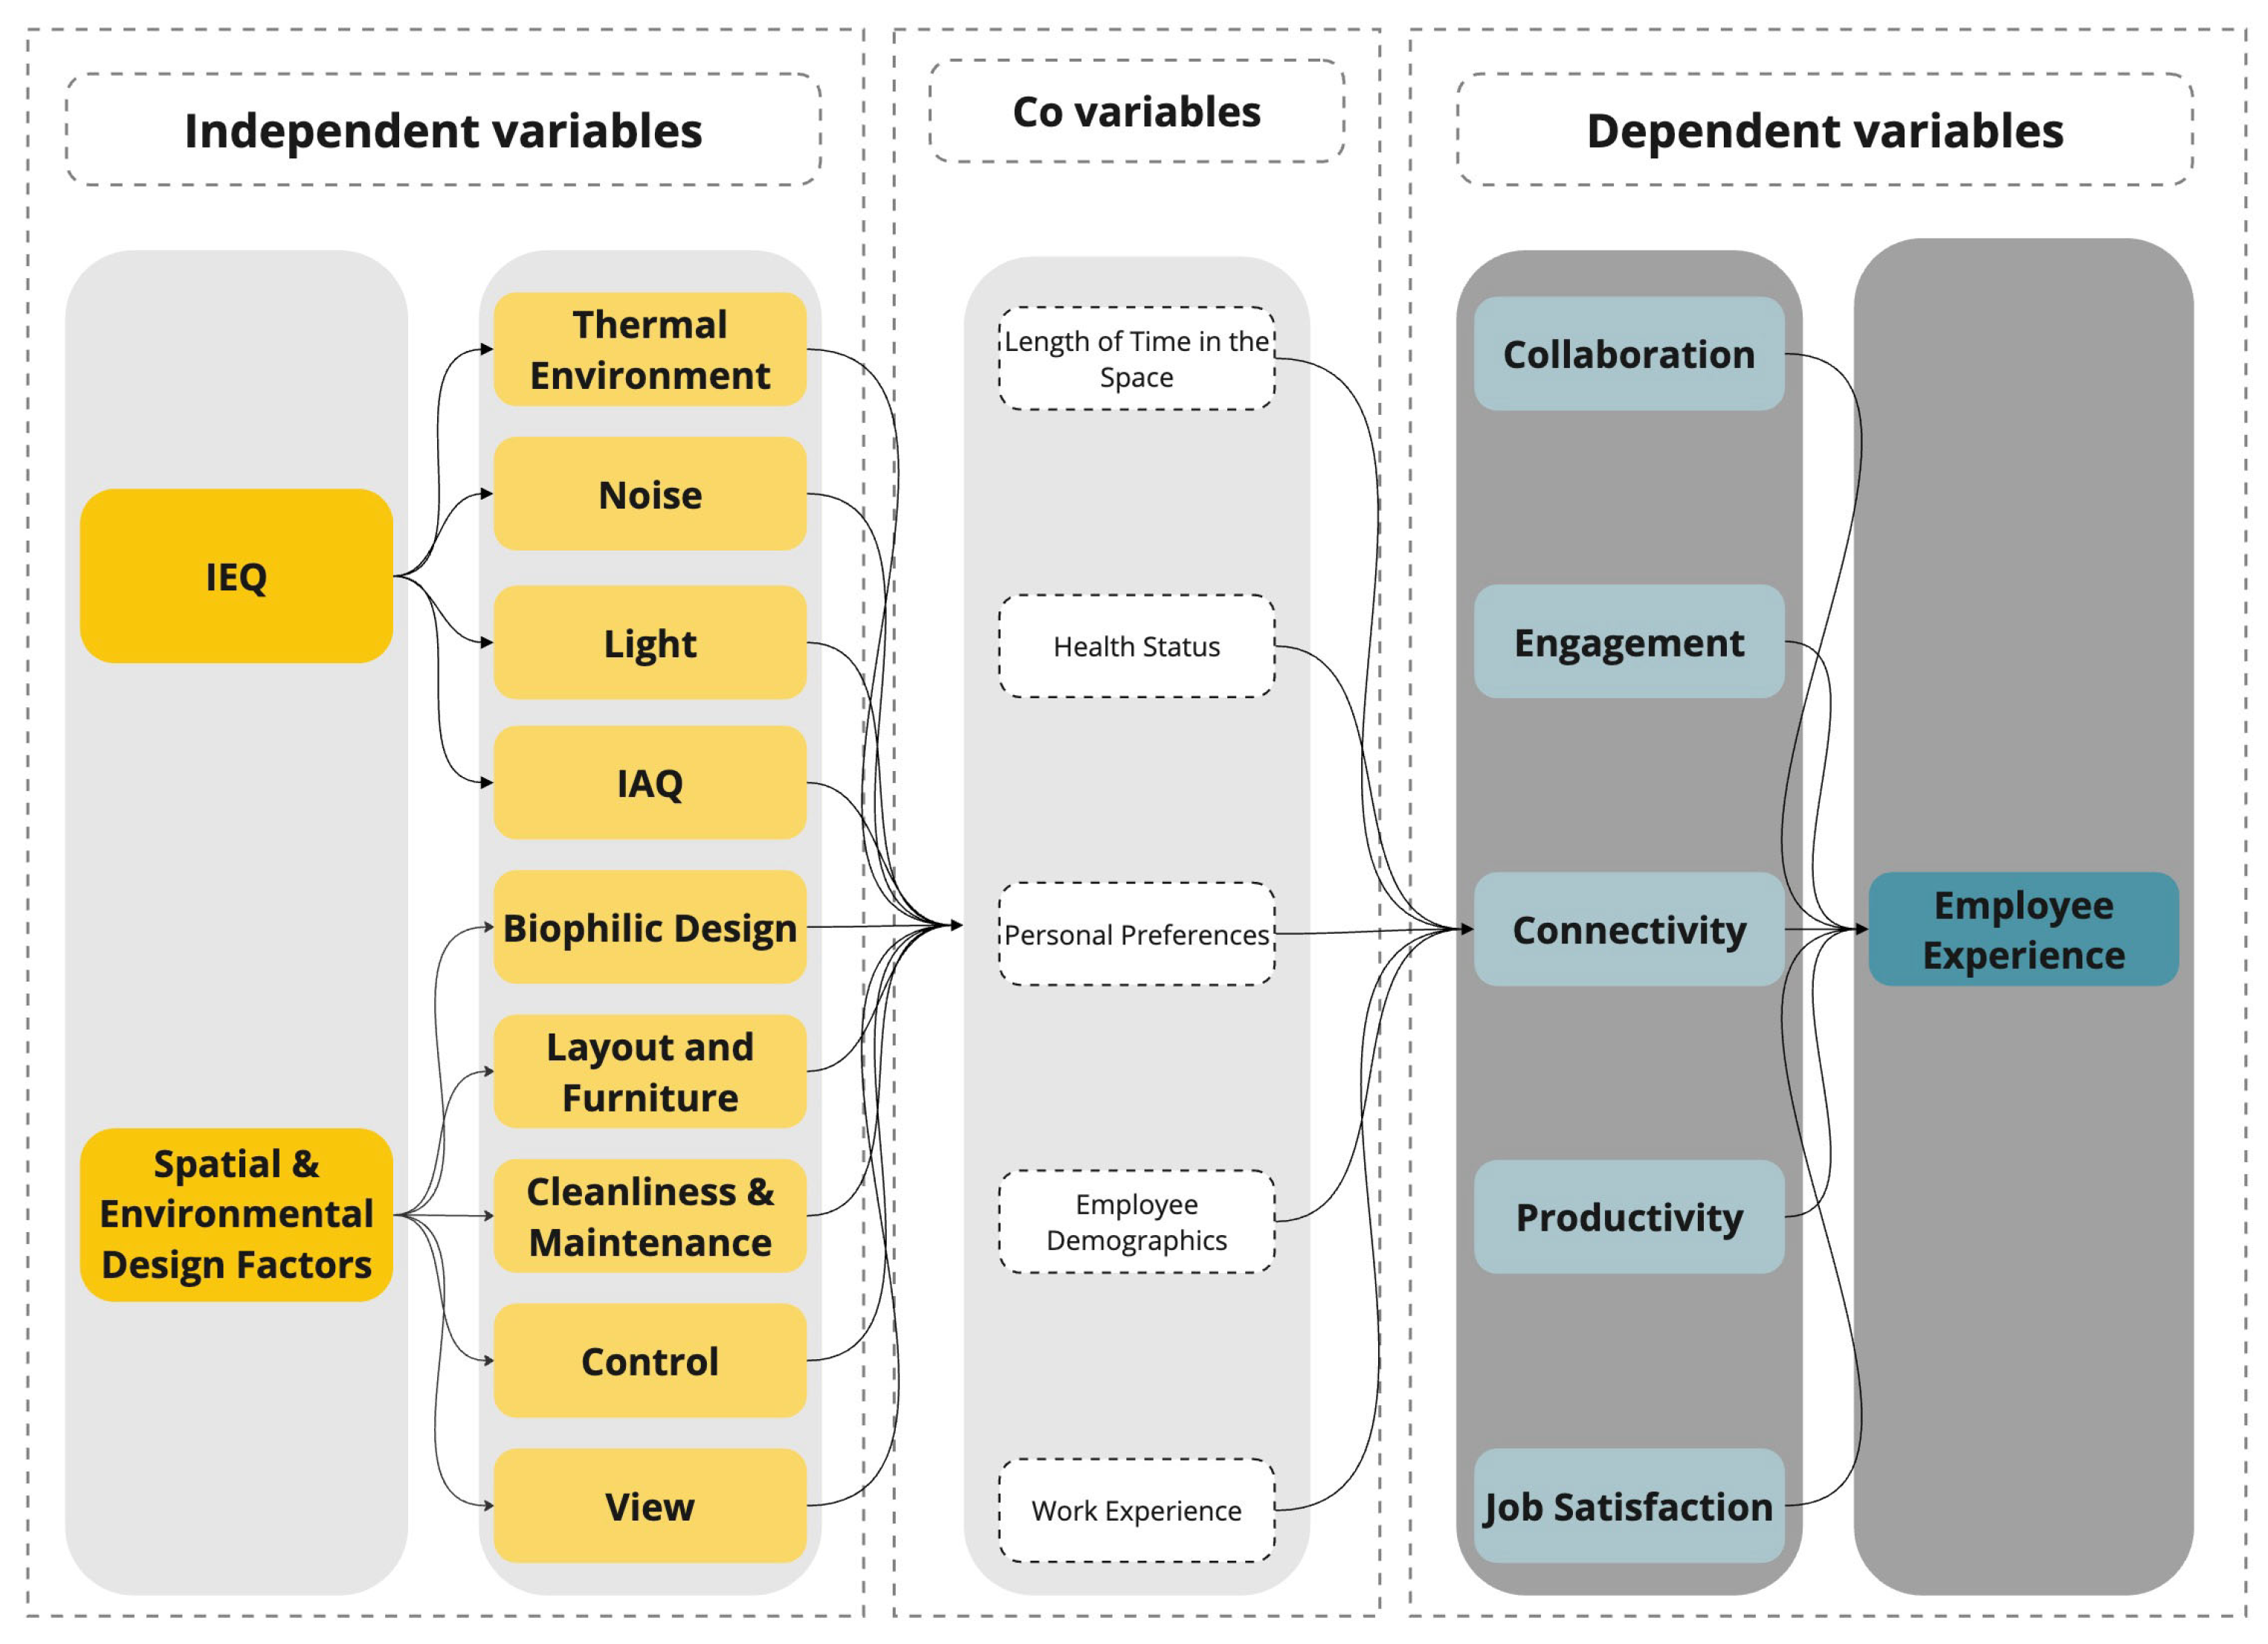
In response to these gaps, this study conceptualizes (
Figure 1) IEQ as a multidimensional and integrated system that includes both traditional environmental factors (e.g., thermal comfort, air quality, lighting, acoustics) and broader workplace design characteristics such as layout, furniture, biophilic design, cleanliness, views, and user control. This perspective reflects the reality that employees experience the workplace as an interconnected environmental and psychosocial setting rather than as isolated variables [
4,
8]. Accordingly, this study addresses three research questions: (1) how employees perceive different dimensions of IEQ in a hybrid workplace, (2) whether WorkHub users report different levels of environmental satisfaction and workplace outcomes compared to non-users, and (3) what environmental strengths, challenges, and improvement opportunities employees identify. By examining IEQ as an integrated system in a real-world public sector setting, this study contributes to a more comprehensive understanding of how environmental conditions influence both employee experience and organizational performance.
2. Materials and Methods
This study employed a mixed-methods, cross-sectional design to examine how IEQ influences employee experience within the WorkHub. Quantitative and qualitative data were collected through a self-reported survey (WESP-Q™) and a participatory think-tank session. The survey captured employees’ perceptions of environmental and spatial conditions, satisfaction, and key outcomes, including collaboration, engagement, connectivity, productivity, and job satisfaction across both WorkHub and conventional office settings. Complementary qualitative insights from the think-tank session enriched the analysis by exploring employees’ perceptions, challenges, and design recommendations for improving hybrid workplace environments. Together, these methods provided a comprehensive understanding of how environmental factors shape well-being and organizational performance in a large public-sector context.
2.1. Partcipants
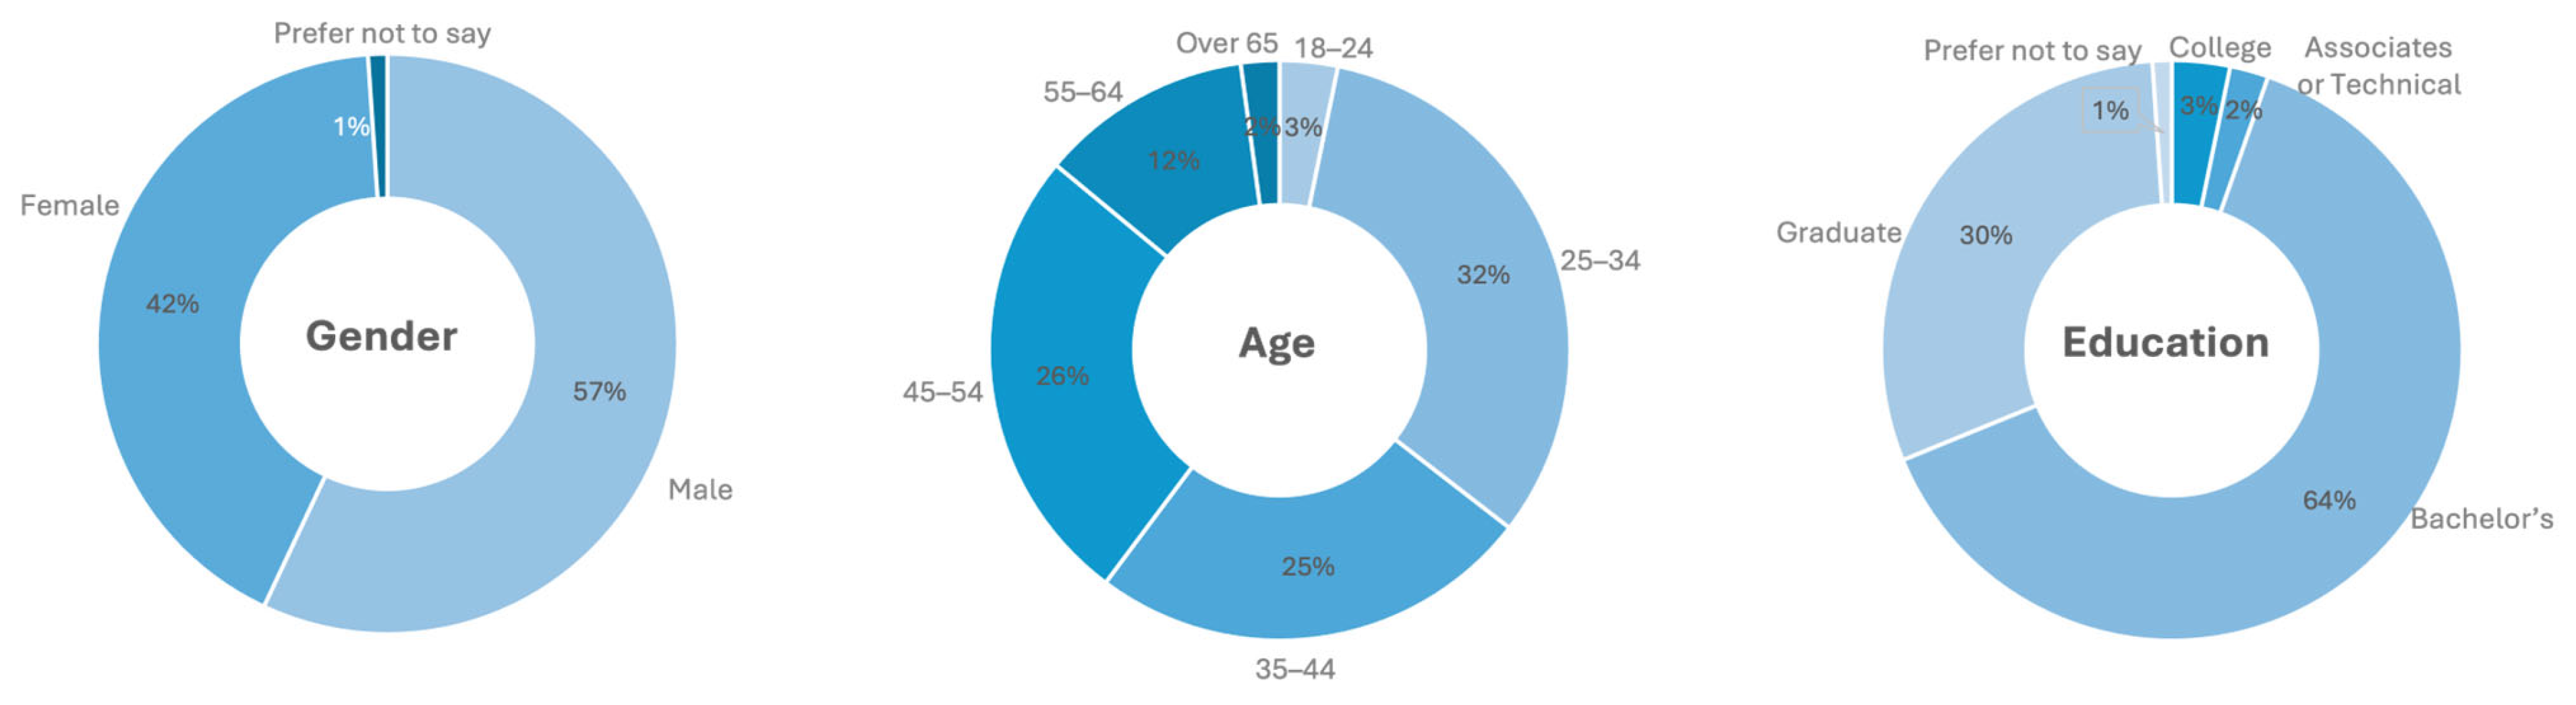
Ninety-eight employees from the organization’s administrative sites completed the survey, of which 93 responses were valid for analysis. The sample represented a diverse demographic profile across age, gender, and education. The largest age group was 25–34 years (32%), followed by 45–54 years (26%) and 35–44 years (25%), indicating balanced participation across career stages. Participants were highly educated, with 64% holding a bachelor’s degree and 30% a graduate or professional qualification. Gender distribution comprised 57% male, 42% female, and 1% preferring not to disclose.
2.2. Procedures and Data Collection
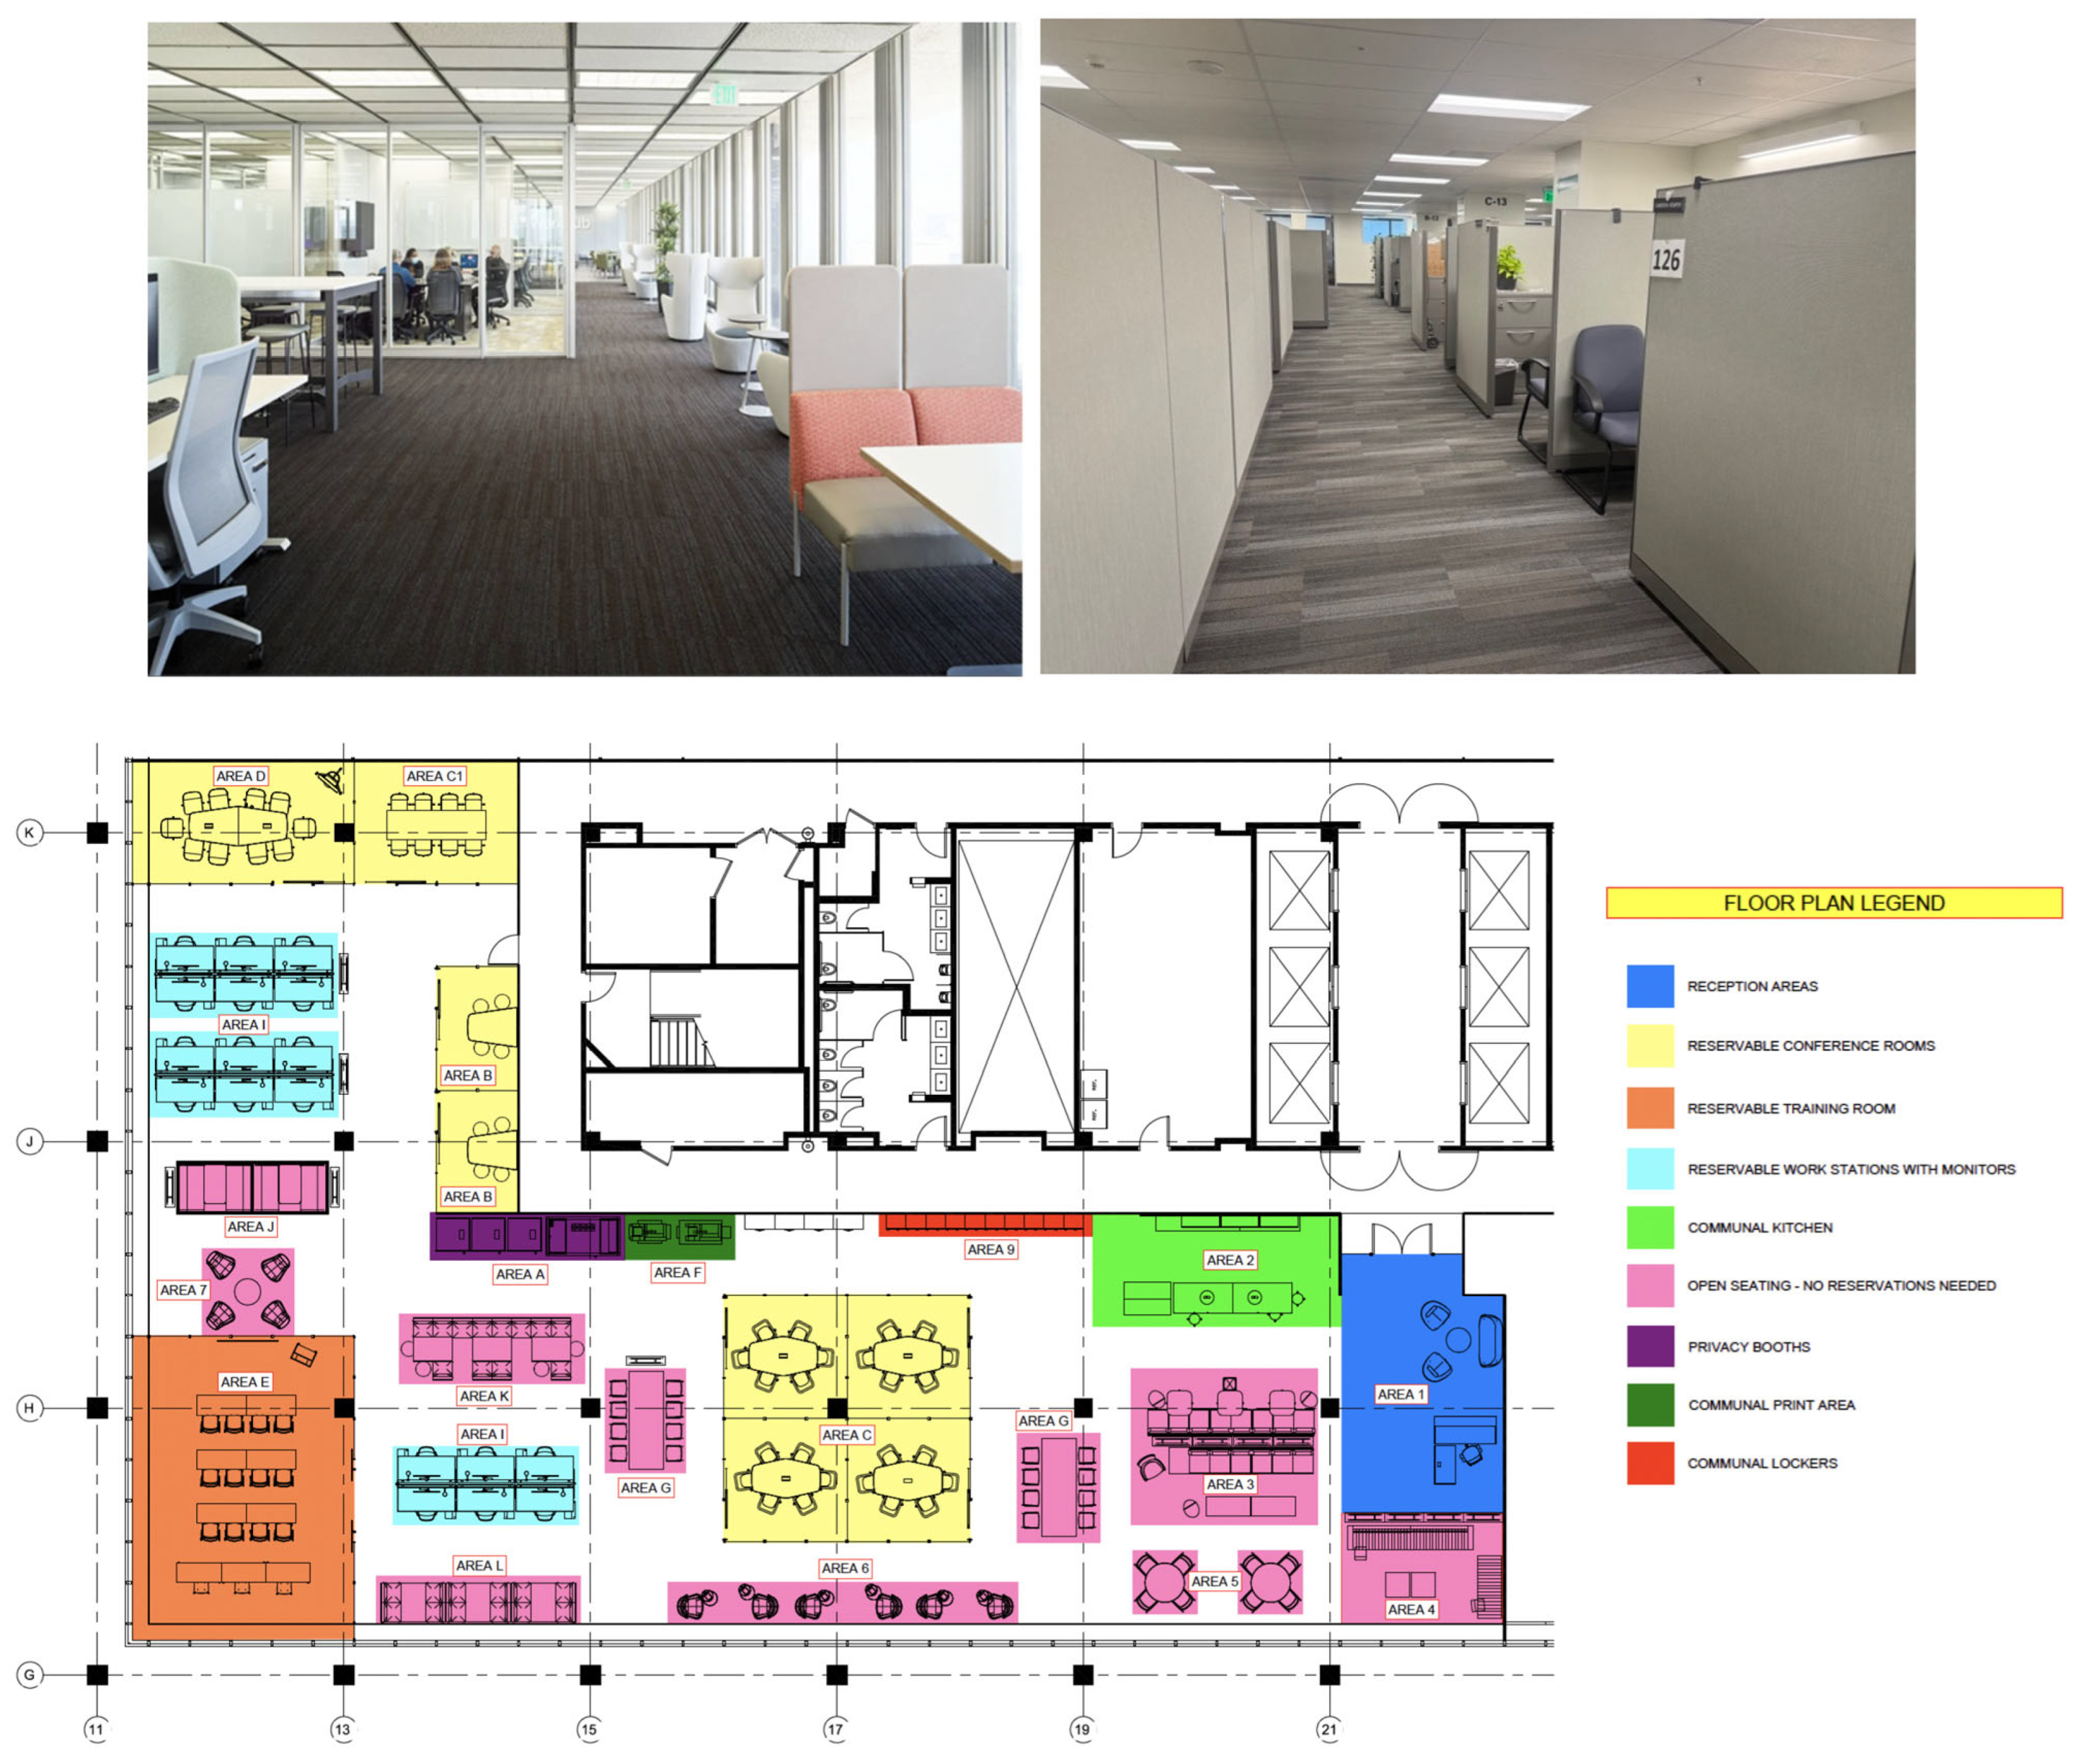
This research was conducted at one of the largest municipal utilities in the United States, with offices distributed across several locations. The primary site, the John Ferraro Building (JFB), houses most administrative operations, while additional offices include the Pacific Stock Exchange (PSE) and Sepulveda Office Building. These conventional settings feature fixed workstations and enclosed offices that provide privacy but limited flexibility for hybrid work. The WorkHub, located on the 6th floor of the JFB, was introduced as a flexible, technology-enabled workspace integrating ergonomic furniture, collaborative zones, enclosed meeting rooms, and hybrid communication tools such as dual monitors and video conferencing systems. This contrast between conventional and supportive environments provided an ideal context for examining how spatial flexibility and environmental quality affect employee experience and performance (
Figure 2).
The John Ferraro Building, LADWP’s 17-story headquarters, incorporates environmental design features such as deep overhangs that reduce solar heat gain and glare while allowing controlled daylight penetration. As a high-rise, it relies on centralized HVAC systems with controlled outside air supply and upgraded LED lighting to maintain indoor air quality, thermal comfort, and energy efficiency. Within this context, the WorkHub on the 6th floor is a flexible, technology-enabled workspace designed for hybrid work, integrating open collaboration areas, enclosed focus rooms, ergonomic furnishings, and digital tools. Specifically, the WorkHub operates at a lower occupancy density (approximately 120–150 ft2/person) compared to the conventional cubicle-based layout (approximately 70–90 ft2/person), reflecting its emphasis on flexibility and shared use. The façade condition also varies significantly: the WorkHub is located along a curtain wall with a high window-to-wall ratio (WWR) of approximately 75–85%, whereas conventional office areas with punched windows exhibit lower WWR values of approximately 25–35%. In addition, the WorkHub allocates a greater proportion of floor area to collaborative and transitional spaces, while the conventional layout prioritizes individually assigned workstations. Although both environments are served by the same HVAC system, the WorkHub benefits from greater perimeter access and daylight exposure, whereas interior cubicle zones rely more heavily on electric lighting and mechanically distributed air. Collectively, these differences represent a shift from a dense, task-oriented office model toward a more spatially open, environmentally responsive, and flexible workplace configuration.
The Workplace Environment Satisfaction and Performance Questionnaire (WESP-Q™) was developed to reflect the study’s integrated IEQ framework and its links to employee outcomes. The questionnaire domains were selected based on prior research showing that workplace experience is shaped by interacting environmental conditions, including thermal comfort, indoor air quality, lighting, acoustics, layout, furnishings, environmental control, cleanliness and maintenance, and access to views and biophilic features [
3,
4,
7,
9,
14]. The outcome domains were informed by workplace and organizational research emphasizing collaboration, engagement, connectivity, productivity, and job satisfaction as key dimensions of employee experience [
5,
29,
30,
31,
32,
33,
34,
35]. Accordingly, the WESP-Q™ was structured to align the study’s measurement approach with the conceptual framework presented in
Figure 1. The questionnaire was developed by adapting items from previously validated instruments rather than creating all items de novo. Satisfaction items related to environmental and spatial conditions were primarily informed by the Center for the Built Environment (CBE) Occupant Survey, which has been widely used to assess occupant perceptions of thermal comfort, air quality, lighting, acoustics, layout, furnishings, cleanliness, and related workplace features [
36,
37]. Outcome-related items were adapted from established measures, including the Utrecht Work Engagement Scale (UWES) for engagement [
30], the Occupant Self-Assessment of Productivity (OSAP) for perceived productivity support [
38], and the Job Satisfaction Survey (JSS) for job satisfaction [
39]. Additional organization-specific items were included to capture WorkHub access, frequency of use, and hybrid-workplace features such as collaboration tools, workspace transition, and connectivity, which were directly relevant to the research questions and case-study context. The final questionnaire included five sections: (1) occupant background, including demographics, workspace characteristics, and WorkHub access/use; (2) benchmarking of the current workspace through general satisfaction ratings; (3) satisfaction with the space through detailed ratings of 18 environmental and spatial attributes; (4) general feedback, including importance ratings for key environmental factors and open-ended responses; and (5) outcome measures assessing collaboration, engagement, connectivity, productivity, and job satisfaction. Most close-ended items used a 7-point Likert-type scale, with anchors ranging from 1 (Very Dissatisfied/Strongly Disagree) to 7 (Very Satisfied/Strongly Agree). The survey recall period encompassed the entire duration of participants’ employment at LADWP, allowing respondents to reflect on their cumulative workplace experiences. The questionnaire was administered over a one-month period, and responses were collected between 1 June and 1 July 2025. To improve transparency, the full questionnaire is provided in the
Appendix A.
Complementing the survey, a 90-min virtual Think Tank session was conducted with 24 LADWP employees to generate in-depth, user-centered insights on workplace experience and future WorkHub development. Participation was voluntary, with recruitment facilitated through posted flyers inviting employees to sign up. The session was hosted by the research team and used Miro, a web-based collaborative digital whiteboard platform, as the primary data collection tool. Miro enabled real-time interaction through virtual sticky notes, visual mapping, thematic clustering, and prioritization exercises, fostering open dialogue and diverse perspectives. Participants reflected on current workplace conditions, identified strengths and challenges, and proposed opportunities for improvement. An icebreaker activity asked participants to select four words describing how their ideal workspace would make them feel. Responses revealed strong consensus around themes of comfort, focus, and creativity, with terms such as comfortable, calm, private, energized, and collaborative highlighting the desire for environments that support well-being, minimize distractions, and enable both individual and group work. The session followed a structured sequence of activities designed to capture both experiential and actionable insights. Participants engaged in a guided workspace reflection exercise, identifying positives, negatives, and opportunities associated with the WorkHub. Responses were organized into IEQ and workplace design categories, including lighting, acoustics, thermal comfort, air quality, cleanliness and maintenance, layout and furniture, biophilic design, views, and environmental control, with additional themes such as technology and amenities incorporated as needed. A prioritization exercise using an impact–effort matrix enabled participants to distinguish between high-impact, low-effort improvements and longer-term strategic interventions, helping translate user feedback into actionable design priorities.
All contributions were exported from Miro and analyzed using thematic coding methods. Responses were categorized by topic and sentiment (positive, negative, or recommendation) and synthesized into broader themes reflecting workplace strengths, performance barriers, and improvement priorities. The Environmental Drivers Deep Dive further examined how specific IEQ factors influence collaboration and performance, with lighting, acoustics, and thermal comfort emerging as persistent challenges. Common concerns included glare, noise, and overly cold conditions, alongside recommendations for increased daylight access, improved zoning strategies, and user-adjustable controls. Qualitative findings were triangulated with open-ended survey responses and quantitative data to strengthen the reliability of conclusions regarding IEQ drivers and employee outcomes.
2.3. Data Analysis
Quantitative data were analyzed using a combination of multivariate and non-parametric statistical tests. A series of Multivariate Analyses of Variance (MANOVA) were conducted to assess the effects of demographic characteristics (age, gender, education) and workspace use patterns (tenure, weekly hours in workspace, office building, space type) on satisfaction across IEQ dimensions. Given violations of normality in group distributions, Mann–Whitney U tests were employed to compare satisfaction and outcome ratings between WorkHub users and non-users. The analysis identified significant differences across 15 of 18 IEQ dimensions and multiple outcome categories, including collaboration access, work transition, productivity, and job satisfaction. Qualitative responses from open-ended survey items were analyzed using inductive thematic coding. Themes were categorized into major workplace challenges (e.g., acoustic disruption, thermal discomfort, lighting quality, cleanliness, and privacy) and strengths (e.g., technology infrastructure, natural light, supportive staff).
Sample size adequacy was evaluated using G*Power software (3.1.9.7). An a priori power analysis for a two-tailed comparison between two independent groups (WorkHub users vs. non-users) with α = 0.05 and statistical power of 0.80 indicated that a minimum sample of approximately 50 participants (25 per group) would be sufficient to detect a large effect size (Cohen’s d = 0.80). The present study included 98 participants (93 valid responses), exceeding this minimum requirement. Therefore, the sample was considered adequate to detect medium-to-large differences between groups in the primary comparisons. Analyses involving demographic and workspace-use variables were treated as exploratory, as subgroup analyses with multiple categories typically require larger samples to reliably detect smaller effects.
3. Results
The following presents the findings of the study based on the collected data.
3.1. Self-Reported Survey (WESP-Q™)
This section presents the quantitative and qualitative findings from the Self-Reported Survey (WESP-Q™), administered to employees working at both WorkHub and non-WorkHub locations. The analysis examines the relationships between IEQ variables and key employee outcomes, including collaboration, engagement, connectivity, productivity, and job satisfaction, and compares differences between user groups based on their level of WorkHub exposure.
3.1.1. Participant Demographics
A total of 98 employees aged 18 to over 65 years completed the survey, with 93 valid responses included in the analysis. Among respondents, 57.0% identified as male, 41.9% as female, and 1.1% preferred not to say. The largest age group was 25–34 years (32%), followed by 45–54 (26%) and 35–44 (25%), representing a balanced distribution across early-, mid-, and late-career stages. Most participants held a bachelor’s (64%) or graduate/professional degree (30%), indicating a highly educated sample (
Figure 3).
A multivariate analysis of variance (MANOVA) examined the effects of age, gender, education, and their interactions on satisfaction with 18 workspace dimensions using a 7-point Likert scale. Age emerged as a significant predictor across several domains, including overall workspace (
p = 0.026), personal space (
p = 0.039), layout (
p = 0.021), sound privacy (
p < 0.001), acoustic quality (
p < 0.001), thermal comfort (
p = 0.004), cleanliness (
p = 0.006), and coworker interaction (
p = 0.002). Older employees consistently reported higher satisfaction, particularly regarding environmental comfort, acoustics, and interpersonal engagement, underscoring the need for age-responsive design strategies. Gender showed no significant effects, though marginal trends appeared for acoustic quality (
p = 0.055) and personal space (
p = 0.079). Education alone did not influence satisfaction, though minor patterns were observed in visual privacy and daylight. However, the three-way interaction of age, gender, and education was significant for overall satisfaction (
p < 0.001), layout (
p < 0.001), thermal comfort (
p = 0.001), and air quality (
p = 0.038), suggesting that satisfaction is shaped by intersecting demographic characteristics. Levene’s Test indicated heterogeneity of variances across several domains, reinforcing the need for user-centered design strategies that account for diverse employee experiences (
Table 1).
3.1.2. Workplace Use Patterns
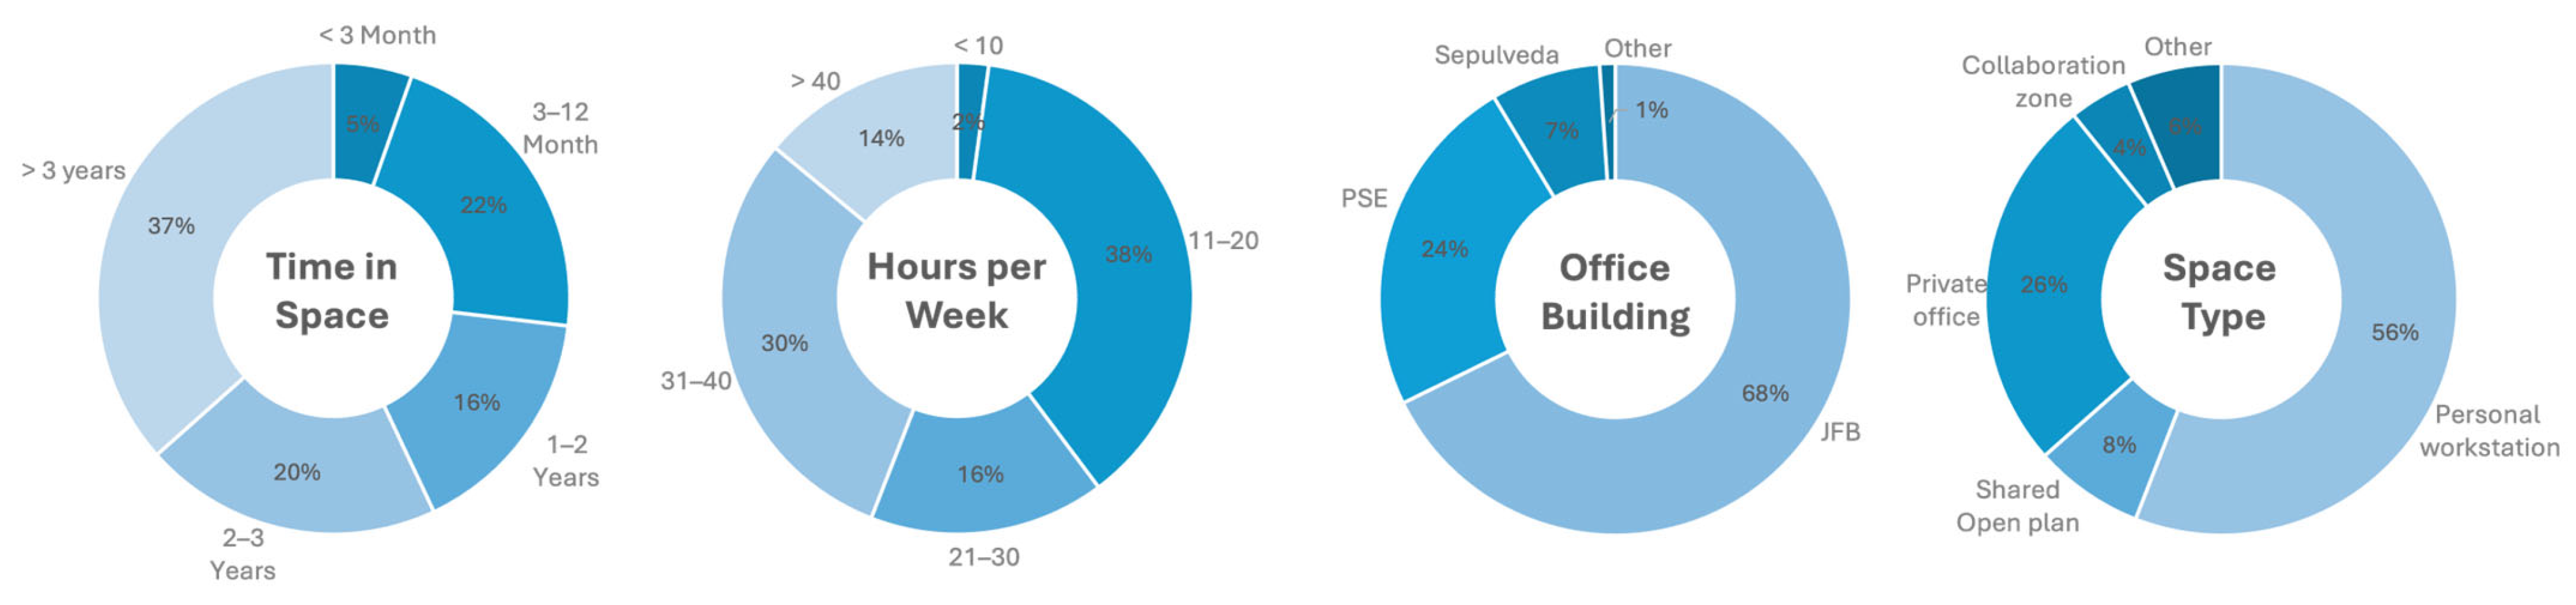
Participants reported their workspace tenure, weekly usage hours, and primary office location. As shown in
Figure 4, most employees worked in the John Ferraro Building and spent between 10 and 40 h per week in their workspace, reflecting varied occupancy patterns consistent with hybrid work models across office types.
A multivariate analysis of variance (MANOVA) examined the effects of Time in Space, Hours per Week, Office Building, Space Type, and their interactions on satisfaction with 18 dimensions of the physical workspace, rated on a seven-point Likert scale. Workspace tenure did not significantly influence satisfaction across any dimension (all
p > 0.05), indicating that longer occupancy or employment duration did not necessarily correspond to higher satisfaction. In contrast, Hours per Week emerged as a consistent predictor, significantly affecting perceptions of personal space (
p = 0.002), visual privacy (
p = 0.013), electric lighting (
p = 0.023), cleanliness (
p = 0.011), and maintenance quality (
p = 0.020). Employees who spent more time in their workspace also reported greater satisfaction with coworker interaction (
p = 0.009) and overall building experience (
p = 0.044), suggesting greater engagement and environmental sensitivity. Office Building significantly affected overall workspace satisfaction (
p = 0.043) and showed a marginal effect for cleanliness (
p = 0.058). Space Type, however, did not significantly predict satisfaction in any domain, suggesting that office configuration alone had limited influence on perceived comfort or performance (
Table 2).
3.1.3. WorkHub Access and Utilization
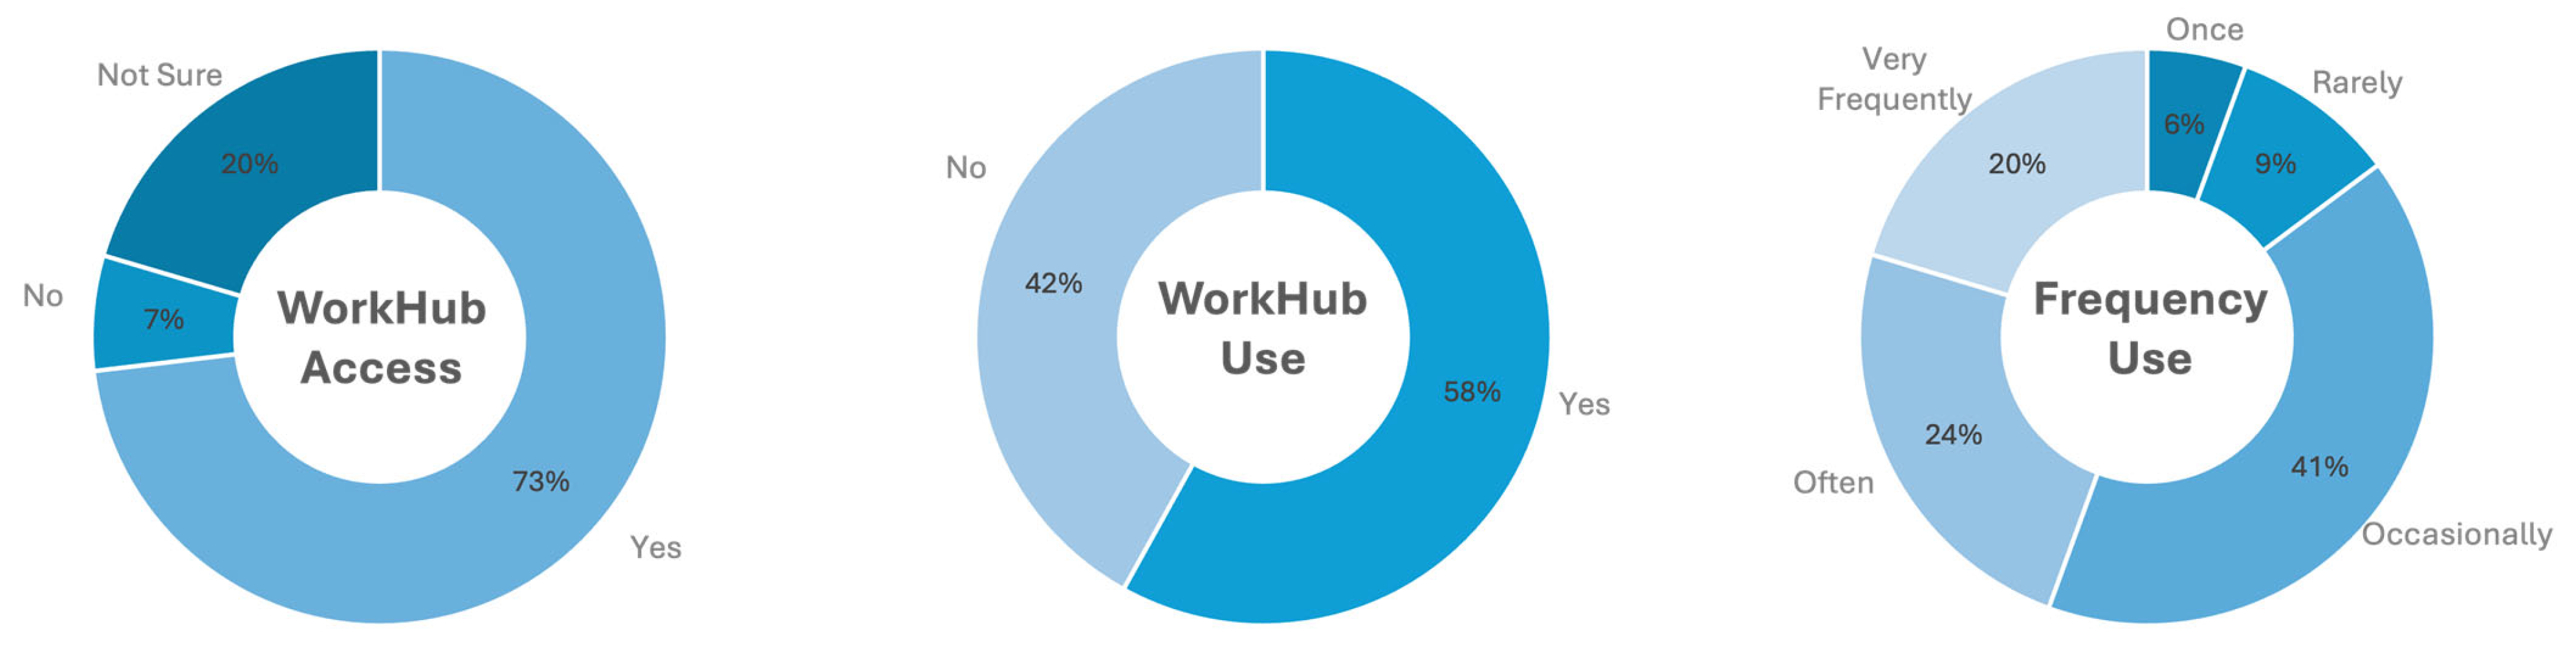
Among the 93 employees who participated in the survey, 73.1% (
n = 68) reported having current access to the WorkHub, 6.5% (
n = 6) indicated they did not have access, and 20.4% (
n = 19) were uncertain about their access status. Regarding actual usage, 58.1% (
n = 54) of respondents reported prior experience working in the WorkHub, whereas 41.9% (
n = 39) indicated they had not utilized the space. Among the 54 participants who reported using the WorkHub, 5.6% (
n = 3) indicated they had used it only once, 9.3% (
n = 5) reported rare use (2–3 times total), and 40.7% (
n = 22) reported occasional use. In contrast, 24.1% (
n = 13) stated they used the WorkHub often as part of their routine, and 20.4% (
n = 11) reported using it very frequently, describing it as their primary workspace or a place they use most weeks (
Figure 5).
3.1.4. Self-Reported Satisfaction and Work Environment
The following section presents the results on self-reported satisfaction with the workplace environment.
- 1.
Descriptive Analysis of Satisfaction Ratings
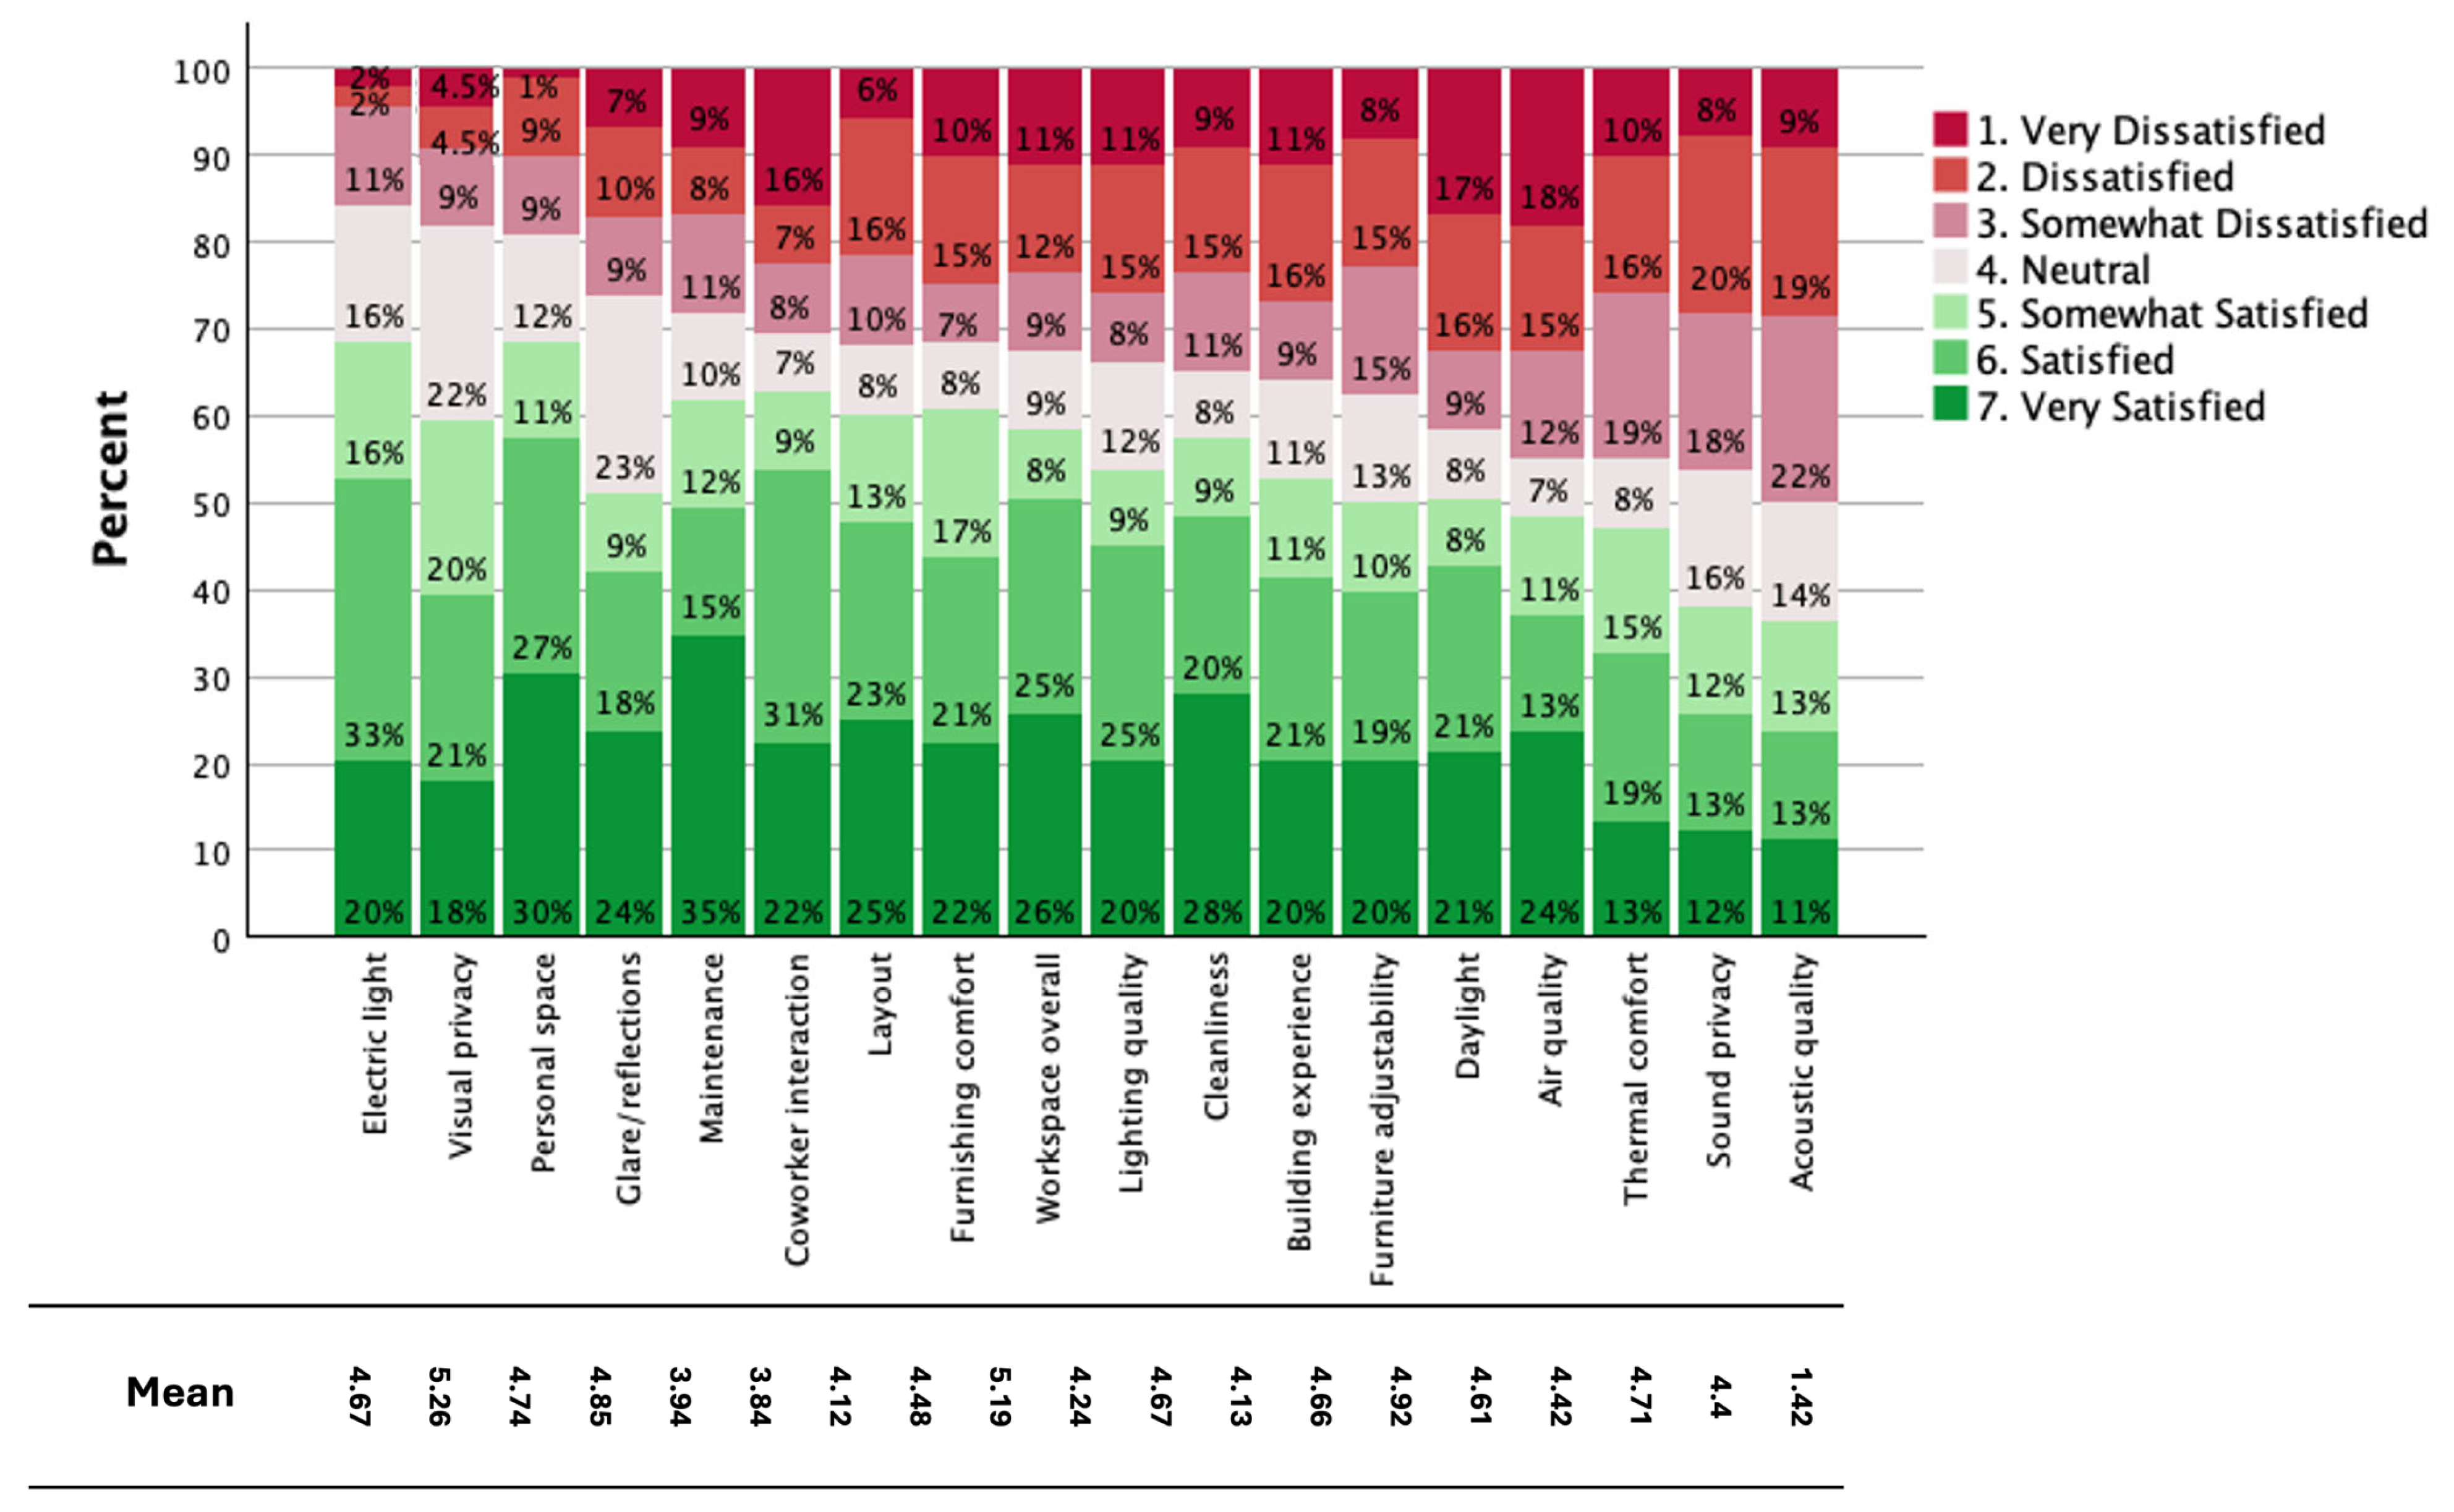
To evaluate key employee outcomes, participants rated 15 items across five categories, anmely collaboration, connectivity, engagement, productivity, and job satisfaction, using a seven-point Likert scale ranging from 1 (Strongly Disagree) to 7 (Strongly Agree). As shown in
Figure 6, the highest satisfaction levels were reported for electric lighting, visual privacy, and personal space (over 60% satisfied), reflecting strengths in illumination and spatial configurations that support comfort and control. In contrast, thermal comfort, sound privacy, and acoustic quality were the most dissatisfying aspects, with more than 40% of respondents dissatisfied, pointing to persistent challenges in managing thermal and acoustic conditions. Mid-ranked features such as furnishing comfort, layout, overall workspace quality, and cleanliness showed more mixed responses, suggesting variability linked to departmental context and personal preferences.
- 2.
Effects of WorkHub Use on Workspace Satisfaction
To assess the impact of WorkHub utilization on occupants’ satisfaction across 18 workspace attributes, normality was evaluated using the Kolmogorov–Smirnov and Shapiro–Wilk tests. These analyses were based on respondents with valid data for the satisfaction items, yielding group sizes of 49 WorkHub users and 35 non-users. The results indicated significant departures from normality for all 18 satisfaction variables in both groups (all Shapiro–Wilk
p-values < 0.05; see
Appendix A Table A1). Accordingly, non-parametric Mann–Whitney U tests were used for the between-group comparisons.
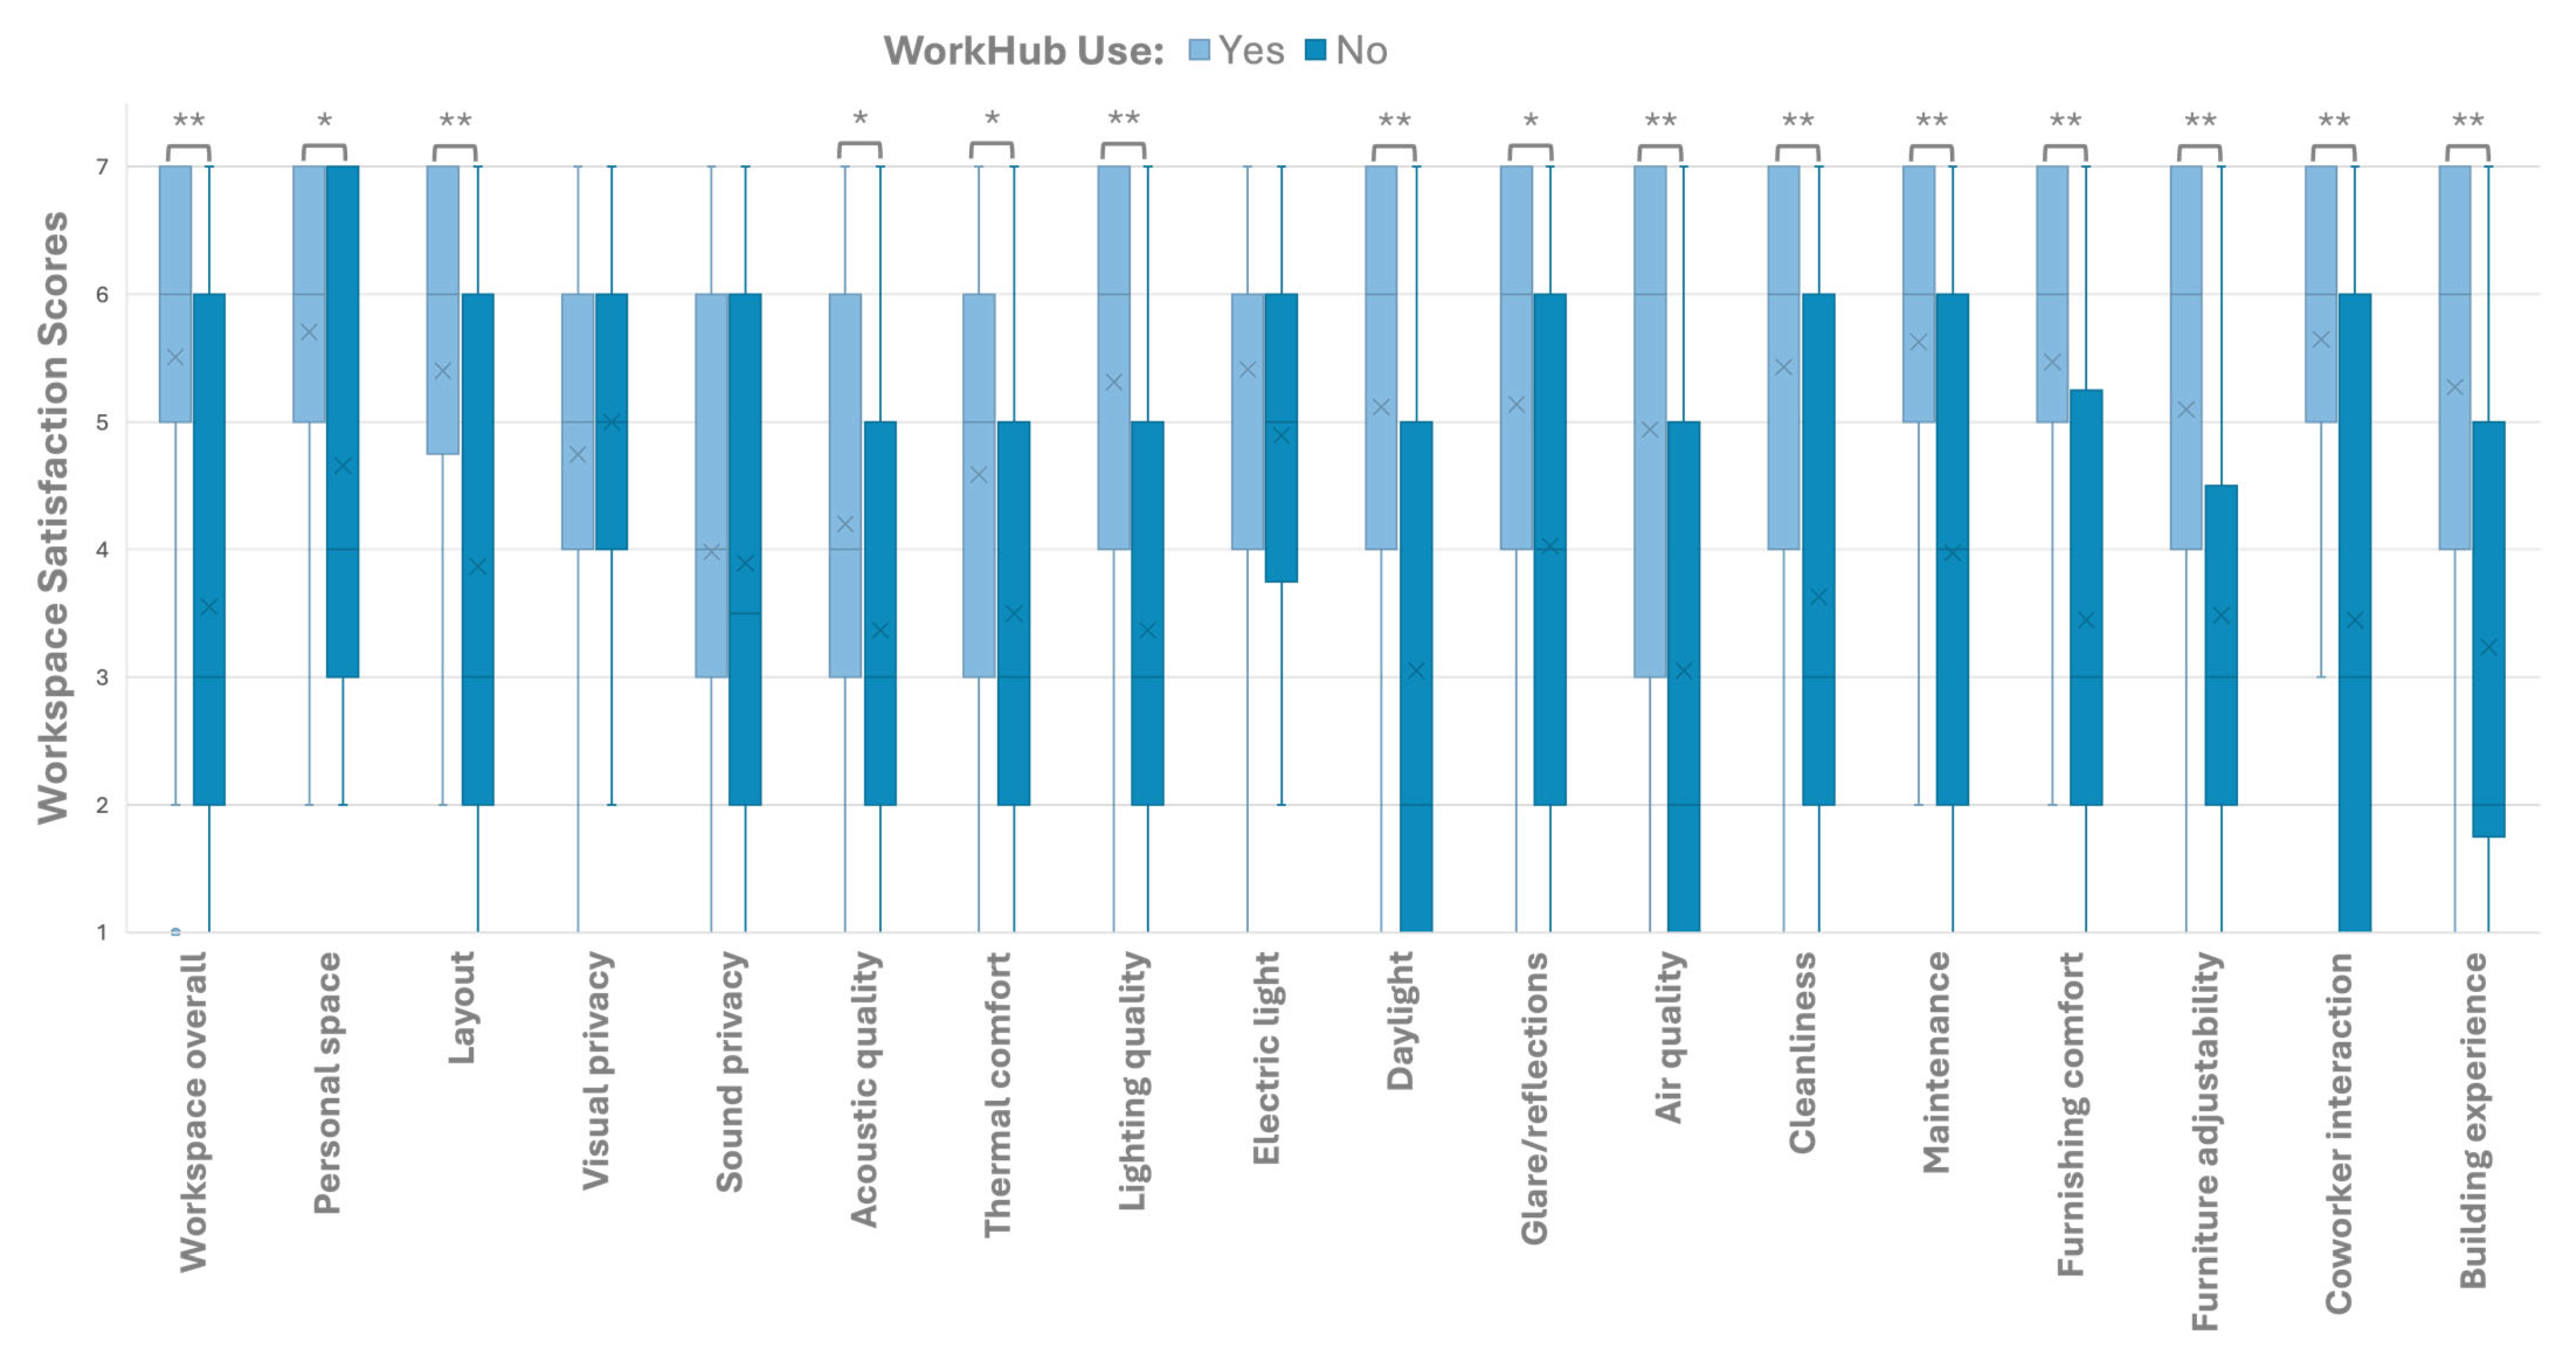
Results showed that participants who had used the WorkHub reported significantly higher satisfaction across most factors compared with non-users. Significant differences were observed for overall workspace satisfaction, layout, thermal comfort, air quality, lighting, cleanliness, furnishings, coworker interaction, and overall building experience (
Table 3). These findings suggest that WorkHub users generally perceived their environment more favorably, though no differences were found in visual privacy, sound privacy, or electric lighting, indicating areas for further design refinement.
Figure 7 illustrates the median satisfaction scores across 18 workspace aspects, comparing employees who had used the WorkHub versus those who had not. Across nearly all categories, WorkHub users reported consistently higher satisfaction levels. These visual trends align with the results of the Mann–Whitney U test, which identified statistically significant differences favoring WorkHub users in 15 of the 18 domains.
3.1.5. Descriptive Analysis of Self-Reported Employee Outcomes
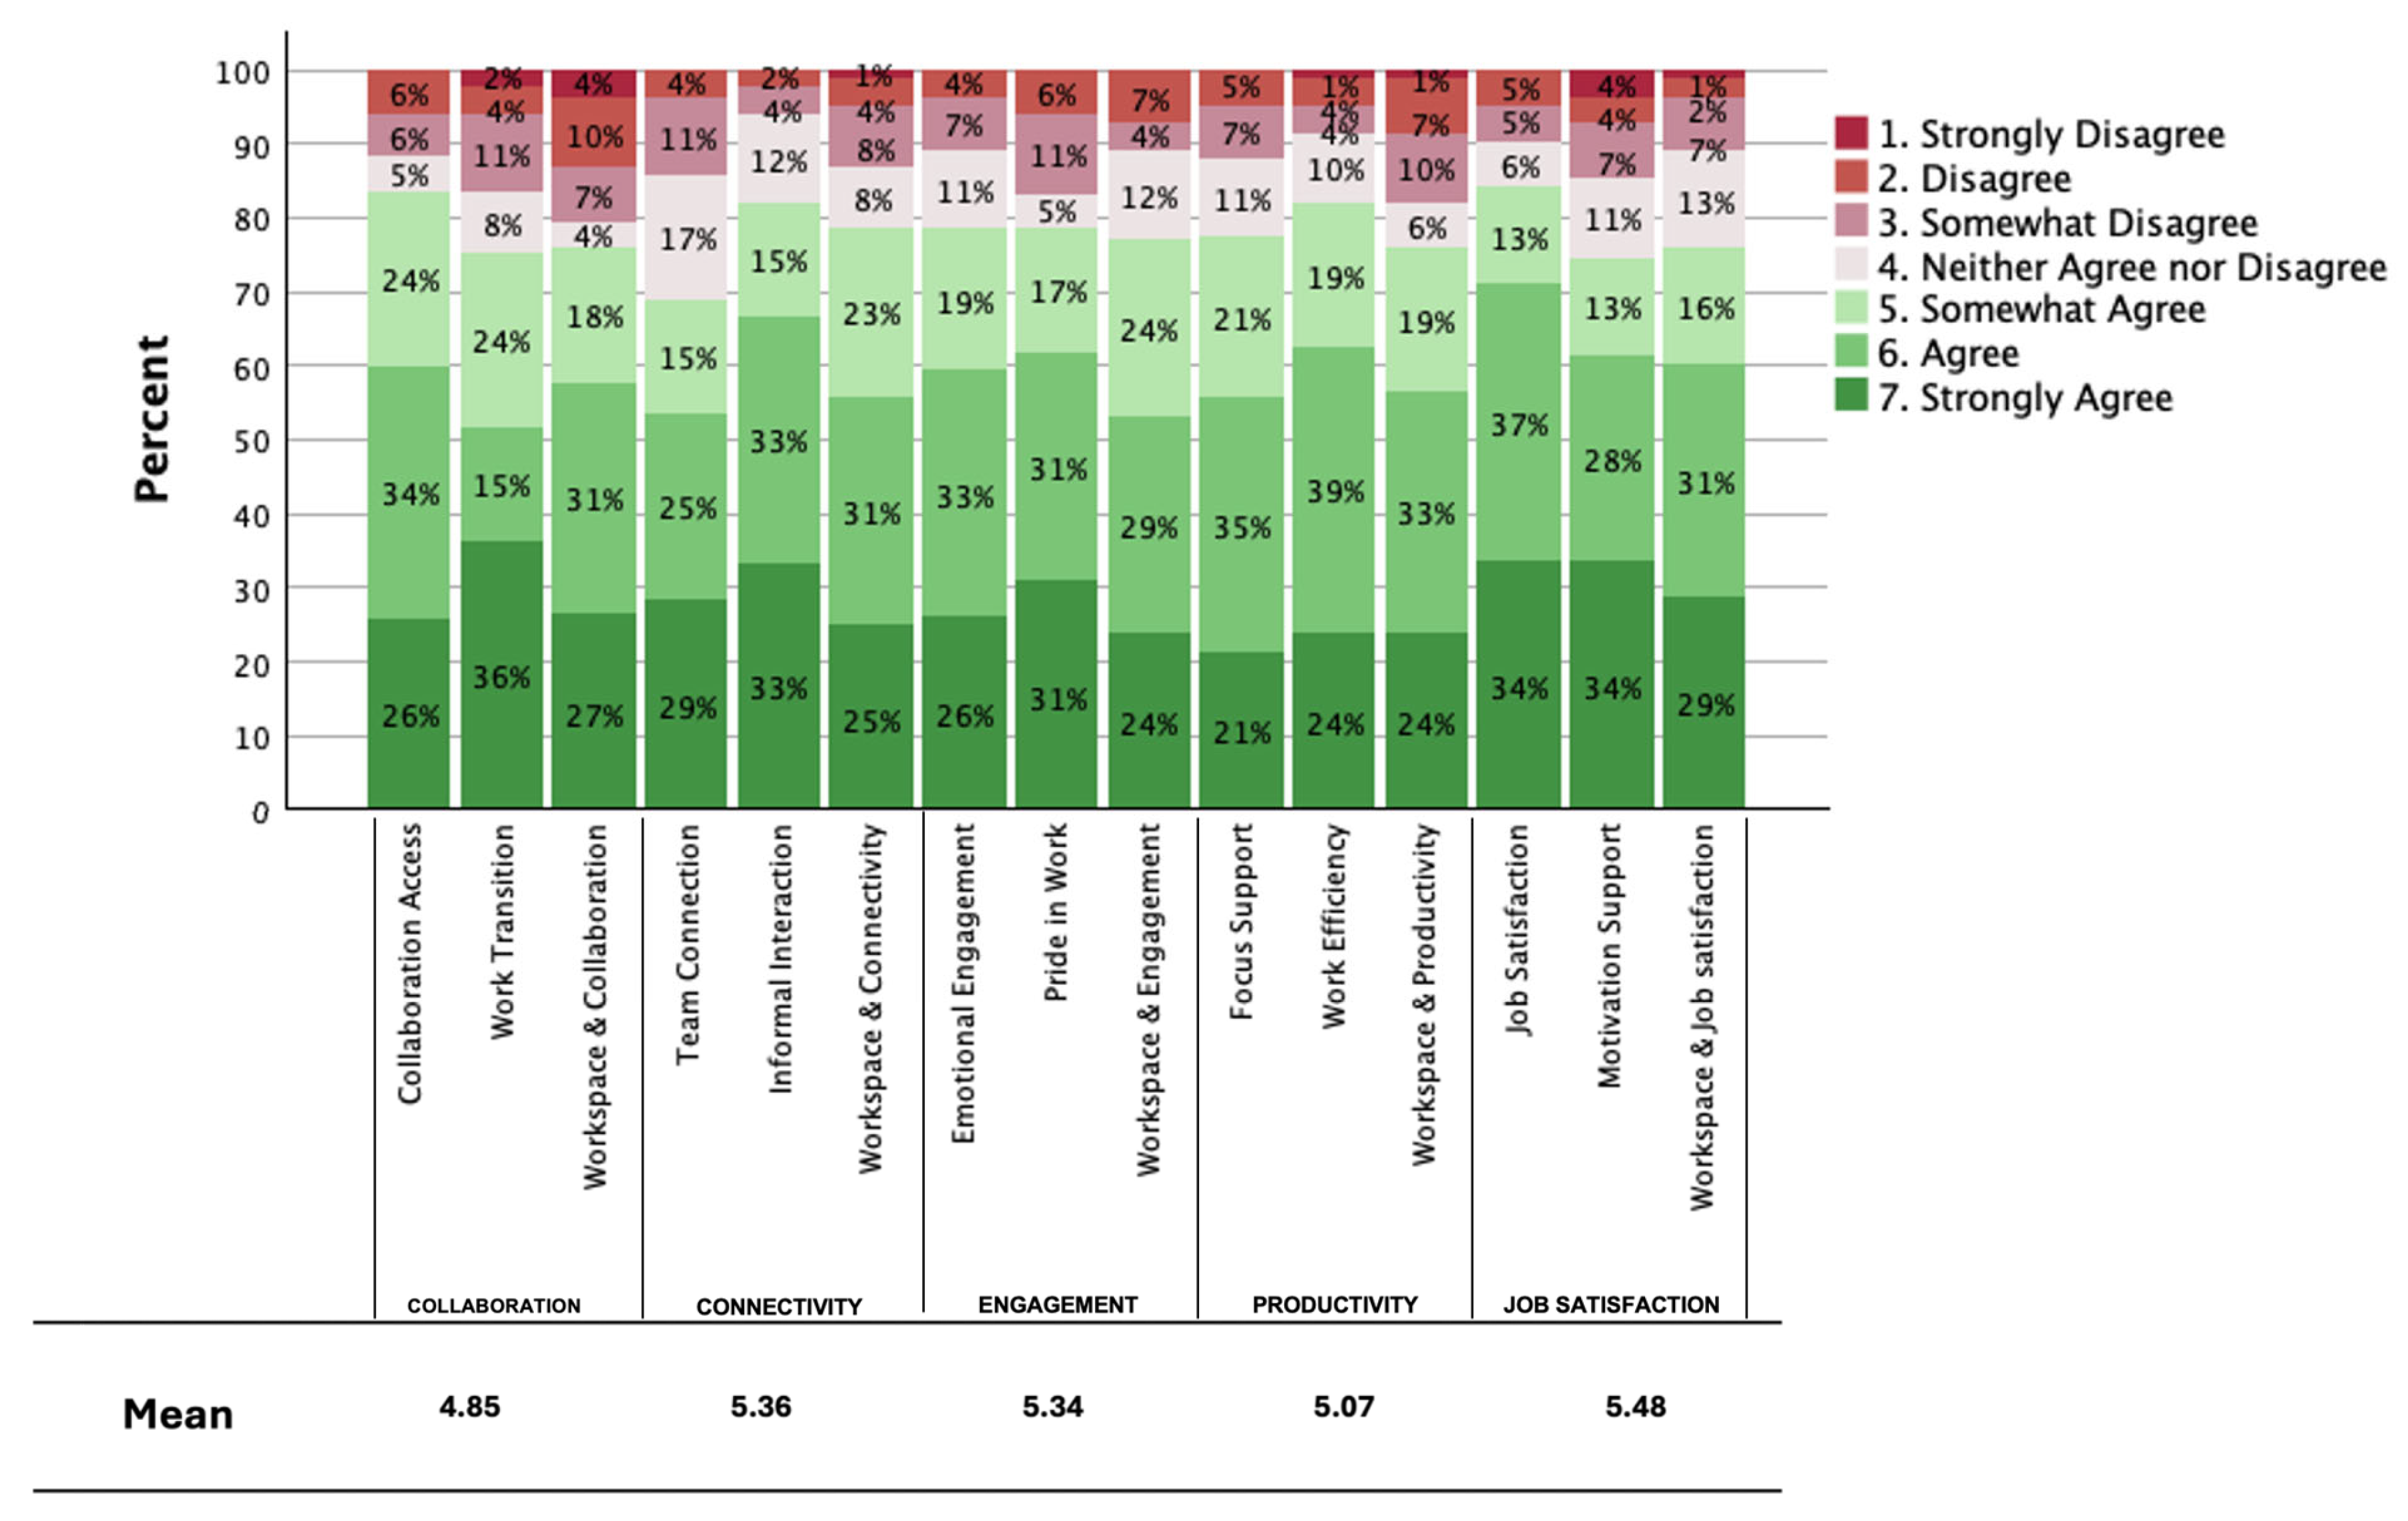
Figure 8 illustrates the median satisfaction scores across 18 workspace aspects, comparing employees who had used the WorkHub versus those who had not. Across nearly all categories, WorkHub users reported consistently higher satisfaction levels. These visual trends align with the results of the Mann–Whitney U test, which identified statistically significant differences favoring WorkHub users in 15 of the 18 domains. To assess employee outcomes, participants rated 15 statements across five categories, namely collaboration, connectivity, engagement, productivity, and job satisfaction, using a 7-point Likert scale.
Figure 8 shows the distribution of responses, with red hues indicating disagreement, light tones neutrality, and green shades agreement. Collaboration items assessed employees’ ability to work with colleagues (Collaboration Access), shift between group and solo tasks (Work Transition), and whether the workspace supported collaboration (Workspace & Collaboration). Connectivity items measured team connection, informal interaction, and how the layout facilitated social interaction. Engagement items included emotional energy, pride in work, and cognitive immersion, while productivity items assessed focus support, efficiency, and spatial support for productivity. Job satisfaction items measured overall satisfaction, motivational support, and the influence of the physical workspace. Overall, responses indicated a favorable perception of the workplace, with most ratings in the agreement range. Job Satisfaction, Informal Interaction, and Team Connection received the highest scores, suggesting employees feel positive about their roles, social ties, and workplace connections. However, some items, particularly those tied to collaboration (Collaboration Access, Work Transition, Workspace & Collaboration), as well as Pride in Work and Workspace & Engagement, showed greater variability, indicating opportunities to strengthen collaboration infrastructure, reinforce pride, and optimize conditions for productivity.
3.1.6. Effects of WorkHub Use on Employees’ Outcomes
To determine whether WorkHub utilization was associated with differences in employee outcomes, tests of normality using the Kolmogorov–Smirnov and Shapiro–Wilk methods were performed for each variable. The results indicated significant deviations from normality across both user groups (p < 0.001), prompting the use of a non-parametric analysis. The Mann–Whitney U test compared outcomes between WorkHub users and non-users, with all items measured on a 7-point Likert scale. Findings revealed statistically significant differences across many outcomes, with WorkHub users reporting more favorable experiences overall.
As shown in
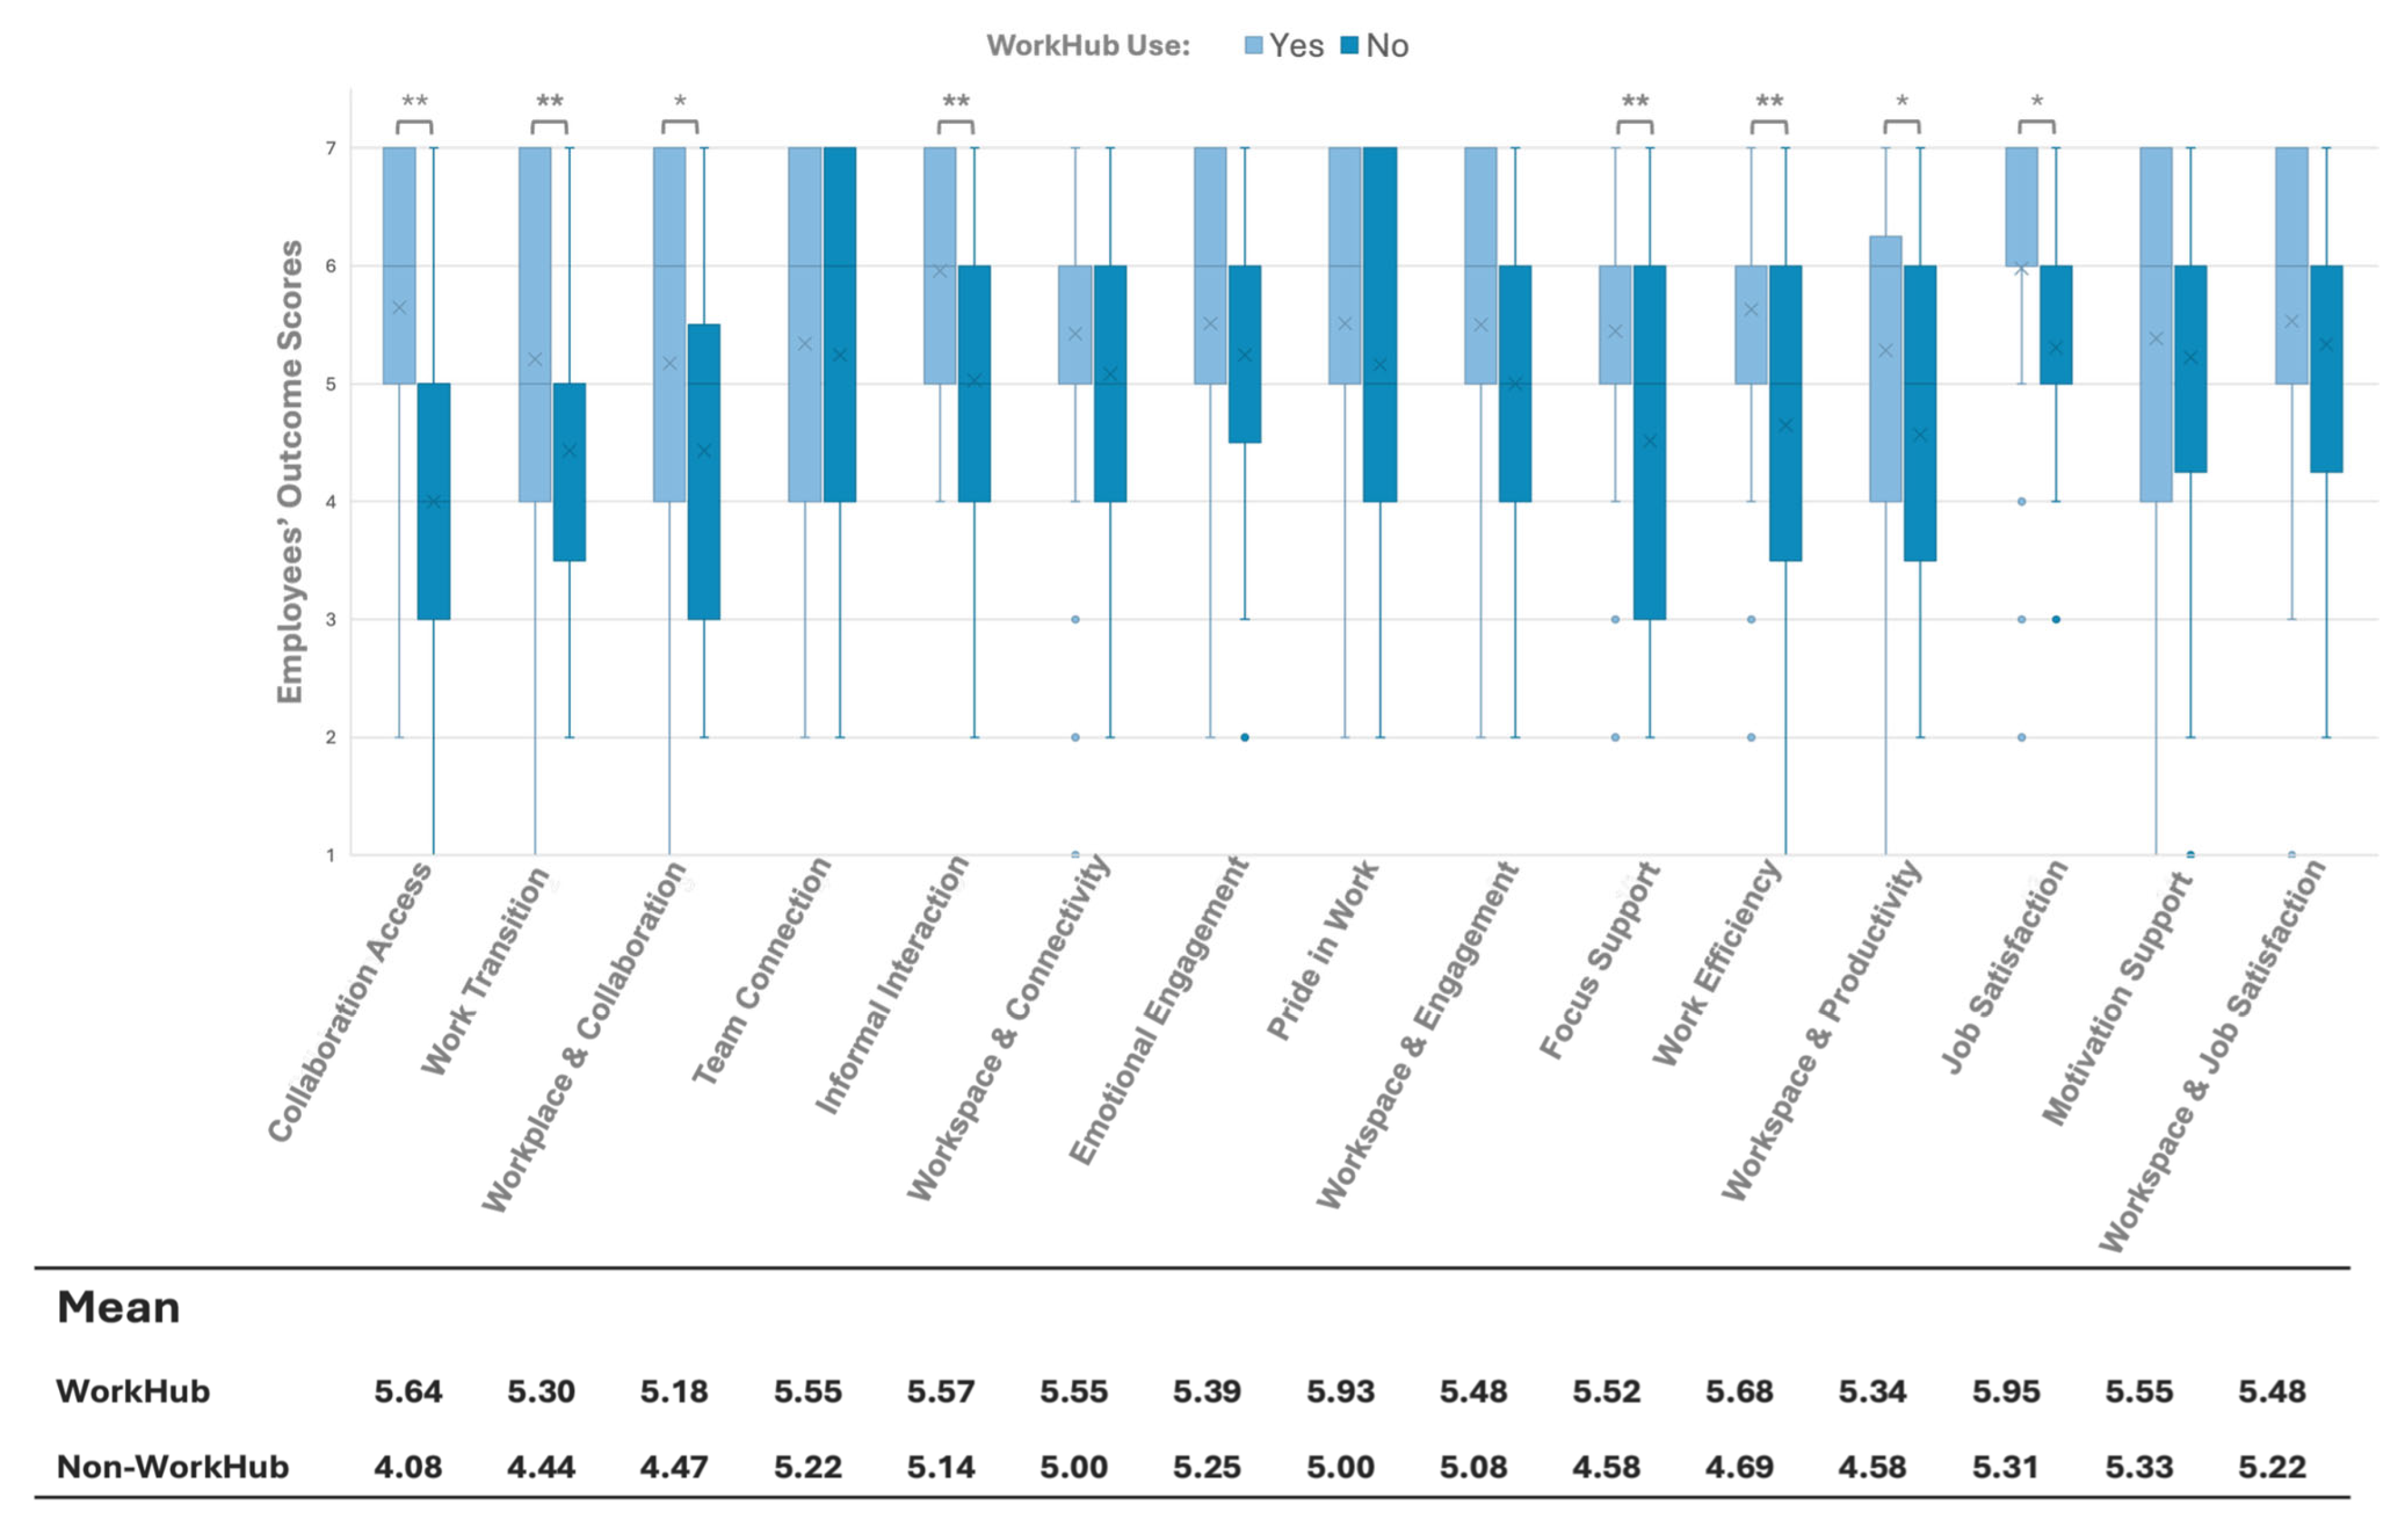
Table 4, the Mann–Whitney U analysis identified several significant differences between employees who used the WorkHub and those who did not. Within the Collaboration category, significant differences were found for Collaboration Access (
p < 0.001), Work Transition (
p = 0.009), and Workspace & Collaboration (
p = 0.016), indicating that the WorkHub environment better supports collaborative work processes. In the Engagement category, Pride in Work was significantly higher among WorkHub users (
p = 0.001). Most notably, within the Productivity category, significant differences were observed for Focus Support (
p = 0.006), Work Efficiency (
p = 0.003), and Workspace & Productivity (
p = 0.023). These findings suggest that employees working in the WorkHub perceive greater ability to concentrate, perform tasks efficiently, and complete work effectively. In contrast, variables within the Connectivity category including Team Connection, Informal Interaction, and Workspace & Connectivity, as well as Emotional Engagement, Workspace & Engagement, Motivation Support, and Workspace & Job Satisfaction, did not show statistically significant differences between groups. Overall, these results provide evidence that the improved environmental and spatial characteristics of the WorkHub, such as flexible layout, dedicated collaboration areas, and integrated technological infrastructure, are associated with higher perceived productivity and more effective work performance.
Figure 9 compares employees’ outcome scores between those who use the WorkHub and those who do not, across 15 different dimensions. Overall, WorkHub users consistently report higher median scores in key areas such as collaboration access, work transition, workplace collaboration, workspace connectivity, focus support, and job satisfaction. Statistically significant differences are marked, with several outcomes (e.g., collaboration access, work transition, focus support, and work efficiency) showing strong significance
(p < 0.01) and others showing moderate significance (
p < 0.05). These results suggest that using the WorkHub is associated with more positive employee experiences related to collaboration, engagement, efficiency, and satisfaction.
3.1.7. Perceived Impact of Environmental Factors on Workplace Satisfaction and Performance
In the final section of the WESP-Q™ survey, employees rated the importance of environmental factors for workplace satisfaction and performance on a 7-point Likert scale. The highest-rated factors were Access to telecommunication and collaboration tools (M = 6.20), Technology (M = 6.05), Privacy (M = 5.95), and Environmental control (M = 5.79), all near or above 6. In contrast, Personalization (M = 5.29) and Design aesthetics (M = 5.46) received lower ratings. These results suggest that employees value functional and operational features, particularly communication, technology, and environmental control, more than visual appeal or personalization. To examine whether there were significant differences in the importance ratings of environmental factors between employees who have used the WorkHub and those who have not, the non-parametric Mann–Whitney U test was conducted. This approach was selected based on the results of the Shapiro–Wilk tests of normality, which indicated significant deviations from normality for all six environmental features across both user and non-user groups (
p < 0.05), thus violating the assumptions required for parametric testing. The Mann–Whitney U tests revealed statistically significant differences between WorkHub users and non-users in their importance ratings for two environmental features. Specifically, employees who had worked in the workhub previously rated Technology (U = 467.000,
p < 0.001) and Aesthetics (U = 452.500,
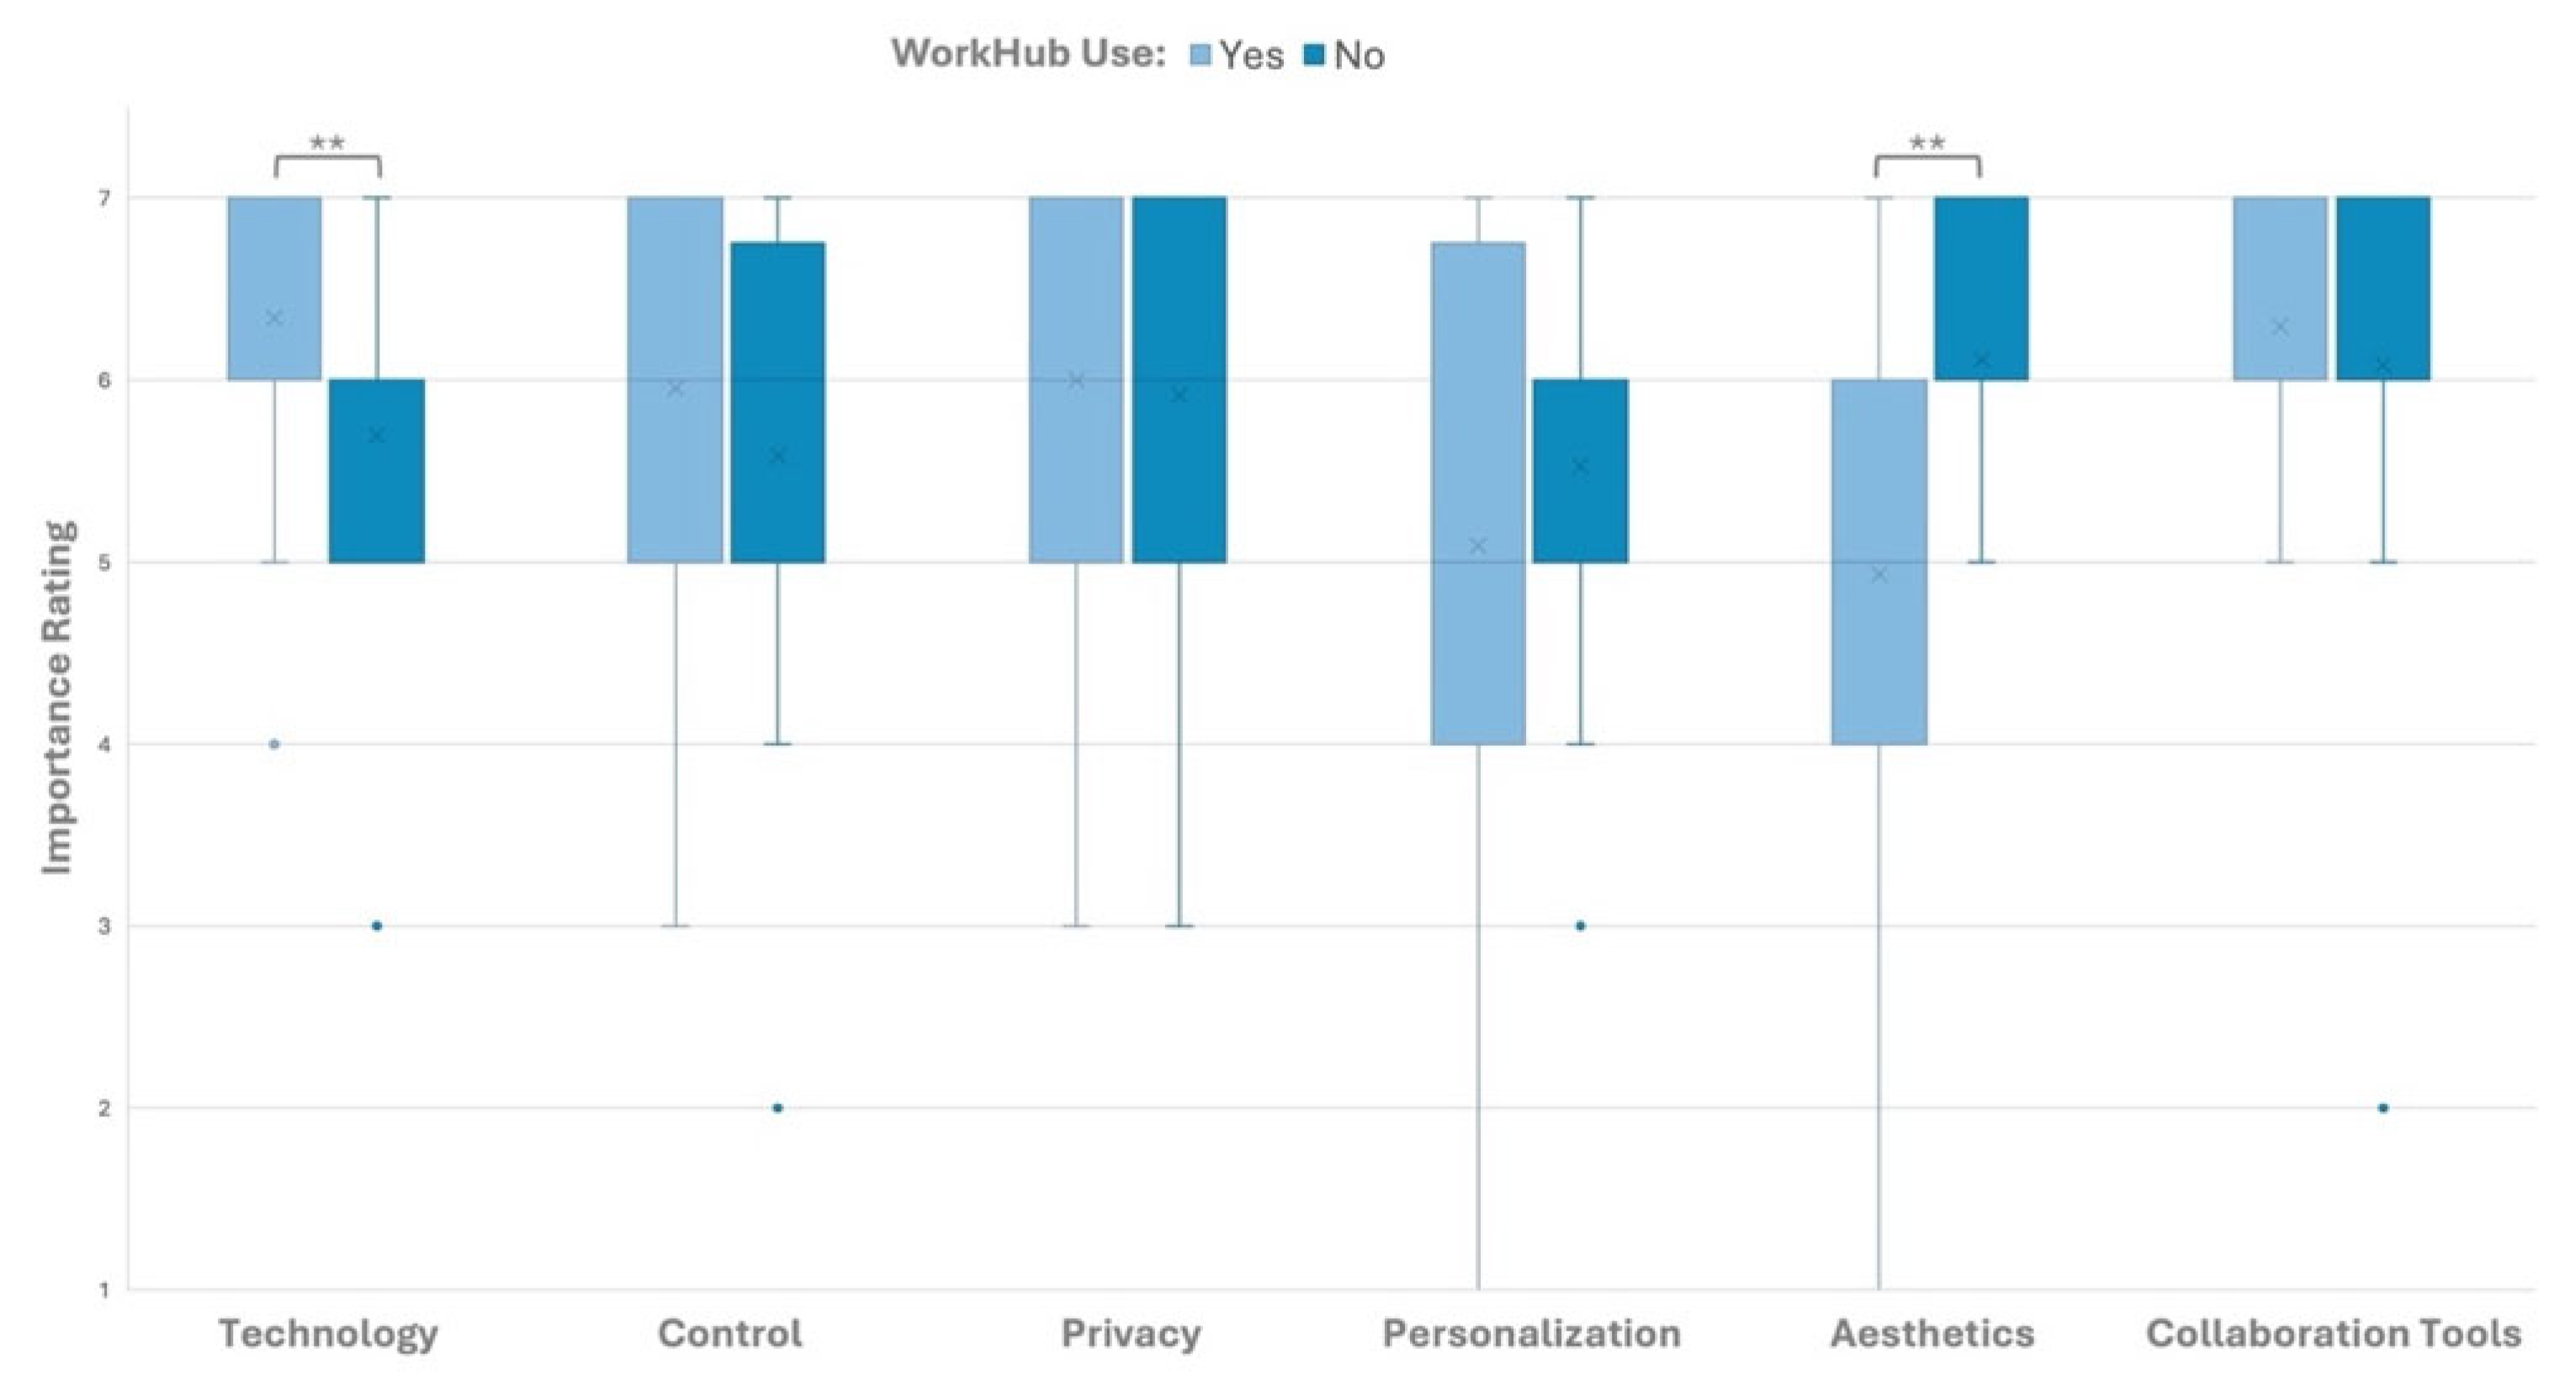
p < 0.001) as significantly more important to their satisfaction and performance in the workspace than people who had never experienced working in the workhub. No significant differences were observed between the groups for Environmental Control, Privacy, Personalization, or Collaboration Tools, suggesting similar perceptions of their importance across both user types. These findings highlight that the WorkHub experience may heighten sensitivity to certain functional and visual elements of the work environment. As illustrated in
Figure 10, the box plots visually reinforce the statistically significant differences identified in the Mann–Whitney U tests. WorkHub users rated Technology significantly higher in importance compared to non-users, indicating a stronger emphasis on technological resources among those engaged with the WorkHub environment. In contrast, non-WorkHub users placed greater importance on Aesthetics, suggesting heightened sensitivity to or unmet needs regarding the visual quality of their current workspace. For the remaining environmental factors, including Control, Privacy, Personalization, and Collaboration Tools, the median scores and overall distributions were comparable between groups, supporting the finding that these aspects are valued similarly regardless of WorkHub use.
3.1.8. Qualitative Feedback on Workplace Experience
Employees provided open-ended feedback on supportive and challenging aspects of their workspaces. Thematic analysis identified key strengths, including access to advanced technology (dual monitors, reliable connectivity), privacy and control (personalization, enclosed offices), proximity for collaboration, and valued physical features such as ergonomic furniture, natural light, plants, and clean, well-maintained spaces. Supportive staff also contributed positively. Collectively, these elements reinforced survey results showing that satisfaction is closely linked to functional tools, environmental comfort, and responsive organizational support (
Table 5).
Challenges centered on acoustics (noise, poor sound containment), thermal discomfort (cold temperatures, HVAC issues), and lighting quality (flickering, insufficient natural light). Employees also noted limited privacy in open-plan areas, concerns with air and water quality, and operational issues such as booking conflicts, outdated furniture, and poor maintenance. Broader frustrations included lack of daylight, cramped layouts, limited amenities, and outdated building infrastructure.
In the final open-ended question, employees with experience in both the WorkHub and conventional offices reflected on key differences between the two environments. The WorkHub was most often praised for supporting collaboration and team interaction, with whiteboards, appropriately sized meeting rooms, and open spaces facilitating meetings, brainstorming, and informal exchanges. Its technological infrastructure—including dual monitors, fast Wi-Fi, and hybrid collaboration tools—was consistently highlighted, along with its brighter, modern design and greater access to natural light. However, participants also noted drawbacks: the open layout reduced visual and acoustic privacy, making it difficult for confidential work, while conventional offices, particularly private cubicles, were preferred for focus, personalization, and routine comfort. Some employees felt the WorkHub was impersonal and too “public,” with limited ability to adjust or personalize their space. Flexibility was valued but often constrained by reservation requirements, as workstations or private booths were not always available. Overall, responses emphasized a tradeoff between the collaborative benefits and modern amenities of the WorkHub and the privacy and control offered by conventional office setups.
3.2. Think Tank Session
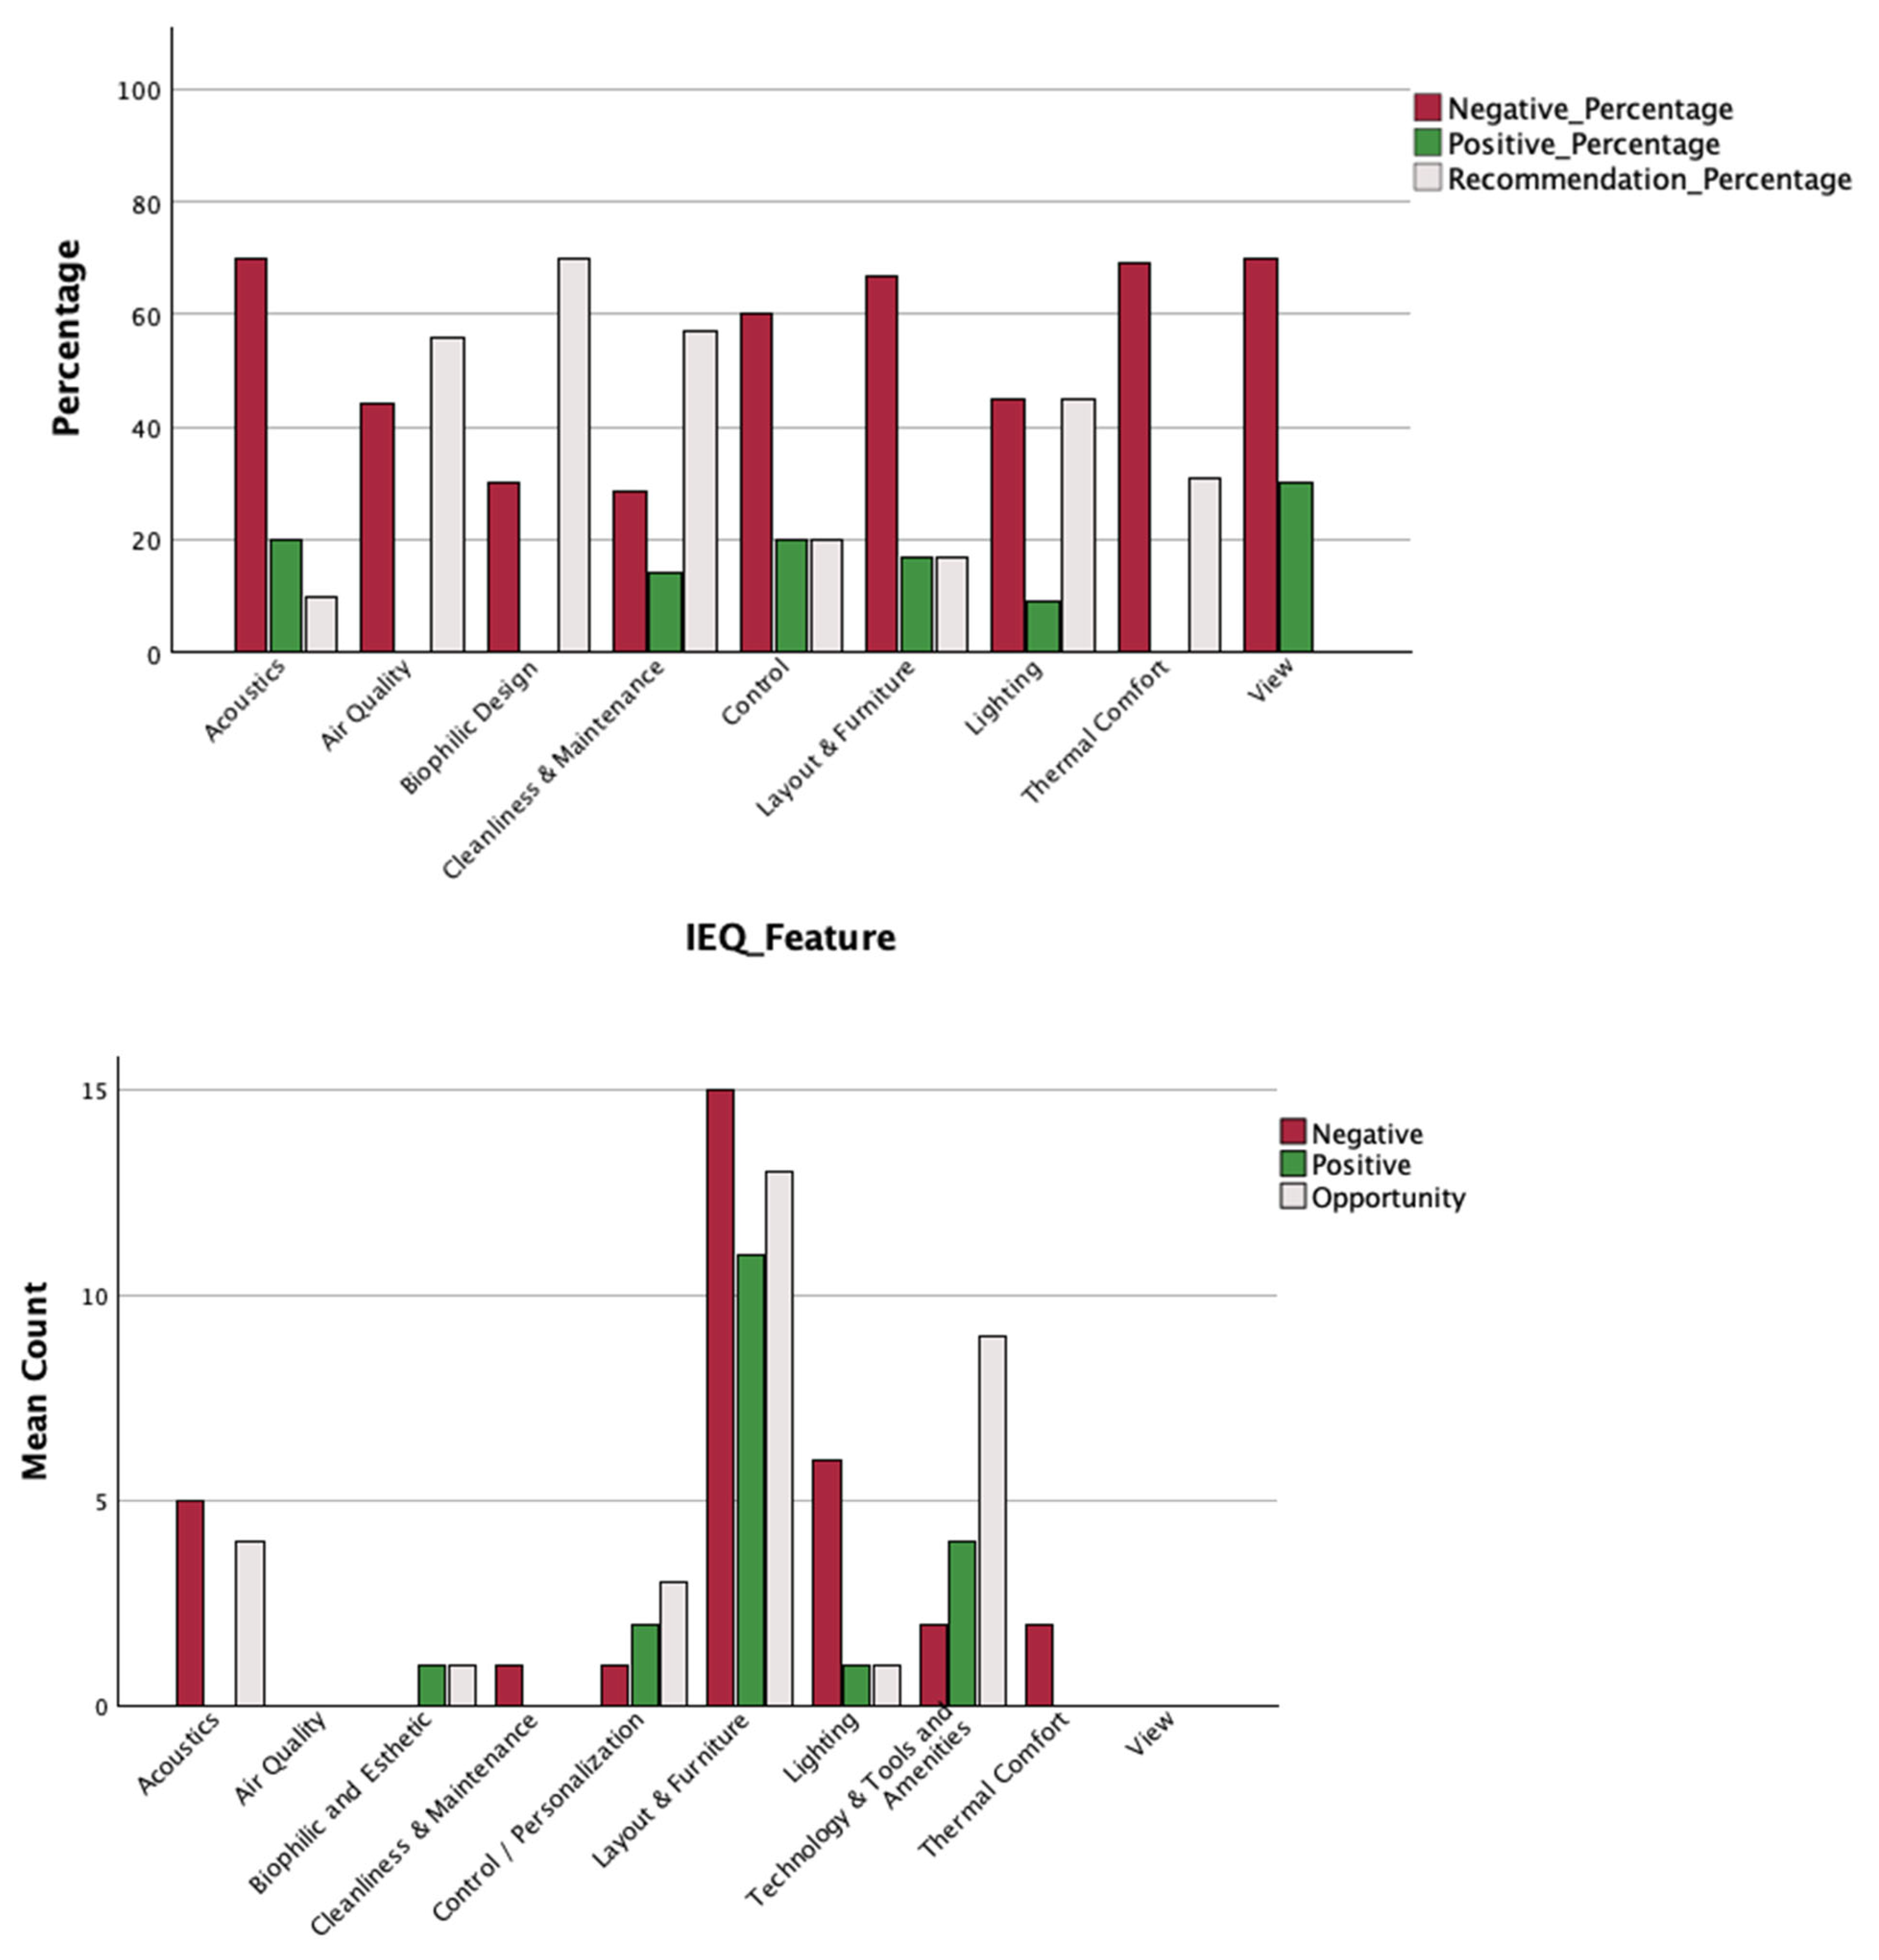
To examine how indoor environmental quality (IEQ) influences employee satisfaction and workplace experience, qualitative data from the Think Tank session were synthesized across two structured activities: Workspace Reflection and Environmental Drivers Deep Dive. Both activities captured participants’ evaluations of current environmental conditions in the work environment, including perceived strengths, limitations, and improvement needs. All responses were inductively coded into nine IEQ categories, namely layout and furniture, lighting, acoustics, thermal comfort, air quality, cleanliness and maintenance, control and personalization, biophilic design, and view, with two additional operational categories (technology/tools and amenities) included where relevant. Each comment was further classified by sentiment (positive, negative, or improvement-oriented). Because responses were generated through open-ended prompts, not all IEQ categories received comments in every activity; therefore, the absence of certain categories (e.g., air quality or view) in specific graphs reflects a lack of responses rather than their exclusion from the evaluation. The aggregated distribution of responses across IEQ categories is presented in
Figure 11, which combines results from both activities into a unified analysis. As the Think Tank session was conducted as an open-ended exercise, responses were not categorized by WorkHub user versus non-user status; accordingly,
Figure 11 presents aggregated results across all participants. Across all categories, layout and furniture generated the highest volume of responses, indicating its central role in shaping workplace experience. Participants reported positive perceptions of collaborative zones and spatial variety, but these were offset by recurring concerns related to limited privacy, inadequate ergonomic support, and constraints in supporting focused work. This dual pattern suggests that spatial configuration simultaneously supports collaboration while constraining concentration.
Lighting and acoustics emerged as the most critical environmental stressors. Lighting-related feedback was predominantly negative, with participants frequently reporting glare, excessive artificial illumination, and insufficient access to daylight. These conditions were associated with visual discomfort, eye strain, and reduced work quality. Similarly, acoustic conditions were consistently identified as problematic, with noise distraction and lack of sound insulation limiting both concentration and speech privacy. Together, these findings indicate that visual and acoustic environments are primary determinants of perceived comfort and task performance. Thermal comfort and air quality were also identified as sources of dissatisfaction, though less frequently than lighting and acoustics. Participants reported uneven temperatures, overcooling, and limited control over thermal conditions, alongside concerns about ventilation and perceived air freshness. These issues were typically framed as persistent background conditions that negatively affected comfort over time rather than immediate disruptions. In contrast, technology and tools were generally evaluated positively, particularly in relation to supporting collaboration and hybrid work. However, participants also emphasized the need for improvements in power access, conferencing infrastructure, and availability of dedicated technology-enabled spaces. Other IEQ dimensions, including cleanliness and maintenance, control and personalization, and biophilic and visual qualities, were mentioned less frequently but revealed consistent themes related to limited environmental control, inconsistent upkeep, and underdeveloped restorative or nature-integrated features. Overall, the combined analysis demonstrates that employee satisfaction in the work environment is most strongly influenced by a set of interrelated IEQ factors, particularly layout, lighting, acoustics, and thermal conditions. These factors directly affect employees’ ability to focus, collaborate, and maintain comfort throughout the workday. The findings reinforce the importance of considering IEQ as an integrated system, where multiple environmental conditions interact to shape overall workplace experience rather than functioning as isolated variables.
The final component of the Think Tank session focused on identifying design priorities for improving the WorkHub and supporting future hybrid workplace needs. Through a structured brainstorming process, participants generated ideas in response to four prompts: what the workplace should be, should offer, should allow, and should avoid. These ideas were subsequently organized into a prioritization matrix based on perceived impact and implementation effort. The analysis highlighted a strong emphasis on high-impact, low-effort interventions, identified as Quick Wins, including improvements to comfort, sensory balance, and spatial flexibility such as ergonomic seating, quiet spaces, natural elements, and adaptable work areas. These findings suggest that relatively modest changes can significantly enhance workplace experience. More resource-intensive strategies, categorized as Distinctive Projects, focused on enhanced privacy, additional enclosed spaces, advanced technologies, and broader ergonomic upgrades, which were viewed as essential for long-term effectiveness. Minor Adjustments included functional improvements such as better access to amenities, dedicated call spaces, and improved organization, supporting daily usability. In contrast, the Not to Do category reflected low-priority interventions with limited impact, emphasizing a preference for practical, performance-driven improvements over purely aesthetic changes.
Overall, the prioritization matrix (
Figure 12) indicates strong consensus around the importance of comfort, flexibility, privacy, and environmental control as key design drivers for future workplace development. Participants consistently emphasized the need for environments that support both focused and collaborative work while allowing adaptation to individual preferences and changing task demands. These findings provide a clear, user-informed framework for aligning short-term improvements with long-term workplace strategy, reinforcing the role of integrated IEQ and human-centered design in enhancing employee experience and organizational performance.
4. Discussion
This study examined how multiple indoor environmental quality (IEQ) factors collectively influence employee outcomes in a public-sector hybrid workplace. The findings indicate that WorkHub use is associated with substantial and practically meaningful improvements in perceived workspace quality. Across most environmental dimensions, median satisfaction scores were 3–4 points higher on a 7-point scale among users than non-users, reflecting a shift from low/moderate satisfaction (medians of 2–3) to consistently high satisfaction (medians of 5–6). The largest gains were observed in overall workspace satisfaction (6 vs. 3), layout (6 vs. 2), air quality (6 vs. 2), and overall building experience (6 vs. 2) (all
p < 0.001). Lighting quality, furnishing comfort, and coworker interaction also improved notably (all 6 vs. 3). These results suggest that the WorkHub delivers more than incremental benefits, representing a meaningful enhancement in how employees experience their work environment. This magnitude of improvement is consistent with prior studies demonstrating that integrated IEQ conditions, including air quality, lighting, and spatial layout, are strongly associated with enhanced occupant satisfaction and perceived productivity in office environments [
3,
4,
8]. However, the lack of significant differences in visual and sound privacy highlights ongoing limitations and the need for targeted design refinements. These findings confirm that workplace experience is shaped by a combination of environmental conditions rather than by single factors alone. In particular, the integration of spatial design, environmental quality, and technology appears to support both individual and collaborative work in hybrid settings. Employees also reported challenges related to acoustics, thermal comfort, and privacy, which were reflected in qualitative feedback highlighting noise, lack of sound control, and temperature discomfort as barriers to concentration. While flexible and open environments support interaction and collaboration, they may reduce privacy and environmental control. Therefore, achieving a balance between openness and focused work conditions remains a critical design challenge in hybrid workplaces. Overall, WorkHub users reported significantly higher satisfaction in 15 of 18 workspace dimensions, with median gains typically ranging from 1 to 4 points on the 7-point scale, and the largest improvements observed for layout, daylight, air quality, overall workspace satisfaction, and overall building experience (
Table 3).
Beyond environmental satisfaction, WorkHub use was associated with distinct improvements in task-related and performance outcomes, while effects on social and intrinsic outcomes were limited. The strongest gains were observed in the collaboration domain, particularly for collaboration access (6 vs. 4, U = 374.5, Z = −4.64,
p < 0.001), along with smaller but significant increases in work transition (5.5 vs. 5,
p = 0.009) and workspace-supported collaboration (6 vs. 5,
p = 0.016). In the productivity domain, consistent improvements were found across focus support (6 vs. 5,
p = 0.006), work efficiency (6 vs. 5,
p = 0.003), and workspace-supported productivity (6 vs. 5,
p = 0.023). Within engagement and satisfaction, pride in work increased (6 vs. 5,
p = 0.001), and job satisfaction showed a significant difference despite equal medians (6 vs. 6,
p = 0.010), indicating distributional shifts. In contrast, connectivity and intrinsic engagement outcomes showed no significant differences, including emotional engagement (6 vs. 6,
p = 0.854), team connection (6 vs. 5.5,
p = 0.309), informal interaction (6 vs. 5,
p = 0.355), motivation support (6 vs. 6,
p = 0.471), and workspace-related engagement and job satisfaction (all
p > 0.05). These results indicate that the WorkHub primarily enhances functional aspects of work, particularly collaboration and productivity, while having minimal measurable impact on socioemotional and relational dimensions of the workplace experience. These findings align with previous research showing that workplace design features and environmental quality are more strongly associated with task-related outcomes such as collaboration and productivity than with social or emotional engagement [
6,
22,
23].
Qualitative findings aligned with the quantitative results, highlighting strengths in technology integration, access to daylight, ergonomic features, and supportive staff, while also revealing persistent challenges related to acoustics, thermal comfort, and limited privacy, particularly in open-plan areas. These findings align with prior research linking IEQ elements such as lighting, air quality, and furnishings with performance and well-being [
3,
4,
33]. Persistent challenges with acoustic and visual privacy highlight the well-known trade-off between openness and concentration [
5,
21]. From a psychosocial standpoint, results reflect the Job Demands–Resources (JD-R) model: environments that enhance resources, comfort, choice, and control promote engagement and related outcomes [
29,
30,
31]. Elevated focus and efficiency ratings likely reflect this resource pathway, where physical affordances (adjustable furniture, spatial variety, reliable technology) reduce demands and support self-regulation. This interpretation is supported by prior work demonstrating that environmental control, comfort, and resource availability function as key job resources that enhance engagement and performance outcomes [
19,
30,
31].
In this study, privacy-related outcomes showed no statistically significant differences between WorkHub users and non-users, despite notable median gaps (visual privacy: 5 vs. 2,
p = 0.648; sound privacy: 4 vs. 2,
p = 0.750). This contrasts with more consistent improvements observed in other environmental factors, such as thermal comfort (5 vs. 2,
p = 0.011) and acoustic quality (4 vs. 3,
p = 0.024). The discrepancy suggests that privacy perceptions were more variable and less consistently improved across users. These findings align with prior research on the privacy–communication trade-off in open and hybrid work environments [
5,
21], which shows that increased openness and interaction often come at the expense of privacy and control. Even when overall workspace conditions improve, privacy remains difficult to enhance due to inherent spatial and social constraints, limiting the extent to which design interventions alone can address these issues. Qualitative themes including noise spillover, thin partitions, and difficulty holding confidential conversations; underscore the need for targeted acoustic strategies. Similarly, thermal discomfort despite higher overall satisfaction highlights the sensitivity of thermal conditions to perceived control and micro-zoning [
24,
40].
The strong emphasis WorkHub users placed on technology suggests that once employees experience reliable digital tools integrated with spatial design, expectations rise and technology becomes essential for effective hybrid work, aligning with the growing centrality of digitally supported, activity-based workplaces. Evidence on integrated IEQ interventions in public agencies remains limited. Most existing evidence has been derived from private-sector or controlled experimental settings, highlighting the importance of real-world studies in complex public-sector environments [
8,
9]. This study demonstrates that even within aging facilities and complex operations, a user-centered retrofit can improve perceived environmental quality, collaboration readiness, efficiency, and satisfaction. The largest improvements were observed in overall workspace satisfaction, layout, daylight, air quality, furnishing comfort, coworker interaction, and overall building experience, each increasing by approximately 3 to 4 points on the 7-point scale. Collaboration access improved by 2 points (6 vs. 4), while productivity-related outcomes, including focus support, work efficiency, and workspace-supported productivity, showed smaller gains of 1 point (6 vs. 5). The results extend IEQ research beyond private-sector and laboratory contexts to a real-world public utility with diverse staff and legacy infrastructure, addressing a key gap in integrated, multivariable evaluations. A key strength of this study lies in its convergent mixed-methods design, which integrated statistical analysis with qualitative insights to capture both measurable outcomes and experiential perspectives. The focus on a large, public-sector organization contributes novel evidence to an underexplored context in workplace research.
Several limitations should be acknowledged. The cross-sectional design and potential self-selection into WorkHub use limit causal inference. The reliance on self-reported measures may introduce perceptual bias; future studies should incorporate objective environmental and behavioral data, such as CO2 concentration, noise levels, illuminance, and occupancy analytics. Although demographic effects were examined, the sample size constrained subgroup analysis. Although the sample size was sufficient to detect medium-to-large effects in the primary comparisons between WorkHub users and non-users, it may not have been large enough to detect small effects, particularly in subgroup analyses involving multiple demographic or workspace variables. Further research should explore issues of equity, accessibility, and long-term organizational impact. Finally, generalizability may be limited to similar urban public-sector environments with comparable workforce diversity and infrastructure. The findings are derived from a case study conducted within a single large municipal utility and therefore reflect a specific organizational, cultural, and infrastructural context. As clarified in the Discussion section, the cross-sectional design, voluntary participation, and building-specific characteristics limit direct generalization to all office types. The John Ferraro Building represents an urban public-sector high-rise with legacy infrastructure, and the WorkHub functions as a pilot hybrid workspace embedded within this setting. Accordingly, the results should be interpreted as contextually grounded evidence rather than universally transferable conclusions. At the same time, although the architectural and operational context is site-specific, the theoretical framework and integrated IEQ approach have broader relevance. The observed relationships between environmental quality, user control, technology integration, and employee outcomes are consistent with established findings across diverse workplace settings. Thus, the transferable contribution of this study lies not in replicating the exact spatial configuration, but in applying a systems-oriented, human-centered IEQ strategy to similar hybrid or public-sector office environments. The revised manuscript now more clearly distinguishes between context-specific results and generalizable design principles.
Future research should adopt quasi-experimental or longitudinal designs to establish stronger causal links between environmental interventions and employee outcomes. Pre- and post-occupancy studies or stepped-wedge designs would enable evaluation of how workspace features influence behavior and well-being over time. Integrating objective environmental data such as air quality, illuminance, temperature, and acoustic levels with behavioral indicators like space utilization and meeting patterns would clarify the mechanisms through which IEQ affects collaboration, focus, and productivity. Given the mixed results for socioemotional outcomes such as team connection, future studies should also examine how leadership practices, workplace culture, and hybrid work policies interact with physical settings to shape engagement and connectivity. Economic evaluations that account for life-cycle costs of maintenance and technology would further inform the scalability of design strategies in resource-constrained public agencies. The findings from this study highlight the potential of a user-centered, integrated approach to workplace design in enhancing environmental quality and employee experience within the public sector. The WorkHub demonstrates that improvements in layout, air quality, cleanliness, furnishings, and coworker interaction can meaningfully enhance collaboration, productivity, and satisfaction.
Persistent challenges in acoustics, thermal comfort, and privacy indicate areas for continued refinement. Overall, the results affirm a systems perspective in which environmental quality, technology, and user control function as interdependent resources that reinforce engagement and organizational performance. For public organizations adapting to hybrid work models, investing in these integrated environmental and psychosocial factors provides a clear pathway to fostering connectivity, well-being, and institutional resilience.
5. Conclusions
This study highlights the critical role of IEQ in shaping employee experience within public-sector hybrid workplaces. The findings indicate that employees using the WorkHub reported higher satisfaction across multiple environmental and spatial dimensions, alongside improved outcomes related to collaboration, concentration, work efficiency, and overall job satisfaction. More specifically, WorkHub use was associated with significantly higher ratings in 15 of 18 workspace satisfaction dimensions and 7 of 15 employee outcome measures, with the largest gains concentrated in layout, daylight, air quality, collaboration access, and work efficiency. These results underscore that workplace performance is not driven by isolated environmental factors, but by the combined effect of spatial configuration, environmental conditions, and technological support systems. A holistic design approach that aligns these elements is therefore essential for creating effective and responsive hybrid work environments.
However, the results also reveal persistent challenges, particularly in relation to acoustics, thermal comfort, and privacy. While open and flexible environments support interaction and collaboration, they may simultaneously constrain individual control and focused work. This tension highlights the need for balanced design strategies that incorporate both shared and enclosed spaces, as well as opportunities for user control and adaptability. Addressing these trade-offs is especially important in hybrid workplace models, where employees engage in a wider range of tasks requiring varying environmental conditions.
Despite its contributions, this study is subject to limitations, including its focus on a single case study and its reliance on cross-sectional, self-reported data. Future research should adopt longitudinal and mixed-methods approaches to better capture causal relationships and evolving workplace behaviors over time. Nevertheless, the findings provide valuable evidence for advancing IEQ-driven, human-centered design in hybrid workplaces. Ultimately, the study demonstrates that thoughtfully designed environments can enhance not only comfort but also collaboration, productivity, and organizational resilience, positioning IEQ as a strategic driver in the future of work.