Abstract
Buildings account for a significant portion of global energy consumption and are increasingly vulnerable to the adverse effects of climate change, including rising greenhouse gas emissions and shifting weather patterns. These disruptions significantly impact energy demand, necessitating proactive measures to ensure buildings remain functional, sustainable, and energy efficient. This study offers a novel contribution by systematically comparing the energy performance of office building prototypes using a simulation-based method across all U.S. climate zones under projected Representative Concentration Pathways (RCPs) 4.5 (moderate emissions) and 8.5 (high emissions) for the years 2050 and 2080. This multi-scale and multi-scenario simulation provides a nationally comprehensive view of how building size and climate conditions interact to influence vulnerability to future energy demand shifts. The findings reveal that medium-sized office buildings are the most vulnerable to climate change, with an average Energy Unit Intensity (EUI) increase of 12.5% by 2080 under RCP 8.5, compared to a 7.4% rise for large office buildings and a slight decline of 2.5% for small office buildings. Hot and humid cities such as Miami, FL, experience the highest increases, with EUI projected to rise by 21.2% for medium offices, while colder regions like Fairbanks, AK, show reductions of up to 18.2% due to decreasing heating demands. These results underscore the urgent need for climate-compatible building design strategies, particularly in high-risk areas. As climate change intensifies, integrating resilience-focused policies will safeguard energy systems and ensure long-term occupant comfort.
1. Introduction
The energy performance of buildings is critical in addressing global energy consumption and mitigating climate change impacts. Buildings, encompassing a variety of typologies such as residential, commercial, and institutional structures, account for a substantial portion of energy use worldwide, with estimates suggesting they contribute nearly 40% of total energy consumption and approximately one-third of greenhouse gas emissions [1,2,3,4]. As climate change exacerbates, the operational energy demands of these buildings are increasingly influenced by rising temperatures, extreme weather events, and changing precipitation patterns [5]. This necessitates a comprehensive understanding of how different building types respond to future climate scenarios, particularly those defined by the Representative Concentration Pathways (RCPs) 4.5 and 8.5, which represent moderate and high greenhouse gas emissions scenarios, respectively [6,7].
The diversity in building typologies significantly affects their energy performance and resilience to climate change. For instance, residential buildings, which include single-family homes and multi-family apartments, exhibit varying energy demands based on their design, materials, and occupancy patterns [8]. Similarly, commercial buildings, which encompass office spaces, retail establishments, and educational facilities, face unique challenges in energy management due to their operational schedules and occupancy behaviors [9]. The integration of advanced energy modeling techniques is essential for accurately predicting the energy performance of these diverse building types under future climate scenarios [10,11].
As climate change continues to pose challenges to building energy performance, it is imperative to employ simulation-based approaches that account for the unique characteristics of different building types across various U.S. climate zones. By utilizing RCP scenarios to model future energy demands, this study aims to provide valuable insights into the long-term implications of climate change on the energy performance of office buildings, while also considering the broader context of diverse building typologies. This research conducted a simulation-based analysis of office building energy performance under RCP scenarios, which reveals significant regional variations in energy demand driven by climate change. The findings offer valuable insights for building designers, urban planners, and policymakers by identifying regional vulnerabilities and informing adaptive energy strategies.
2. Literature Review
Climate change has emerged as a critical factor influencing the energy performance of buildings. Rising global temperatures, shifting weather patterns, and increased occurrences of extreme climate events necessitate adaptive strategies in building design and energy management [12,13,14,15]. The assessment of climate change impacts on energy demand has become an essential aspect of sustainable urban development and energy policy [16,17]. As the built environment accounts for a significant proportion of global energy consumption, understanding the vulnerabilities of buildings to climate-induced stressors is imperative [18].
2.1. Impact of Climate Change on Building Energy Demand
Several studies have analyzed the effects of climate change on buildings’ heating and cooling demands. Increasing ambient temperatures have led to higher cooling energy consumption, while heating demand has shown a declining trend in many regions [19,20,21,22]. Studies such as those by Baba and Ge [23,24] and Xiaoxu et al. [25] have emphasized how regional variations in climate scenarios influence energy consumption patterns across different building typologies. Spinoni et al. [26] discussed changes in heating and cooling degree-days across Europe, while Bass and New [27] analyzed the effects of RCP-based climate scenarios on commercial building energy use across diverse U.S. locations. Beyond direct energy demand shifts, climate change also exacerbates urban heat island (UHI) effects, further increasing cooling loads in metropolitan areas [22]. Additional studies by Geissler et al. [28] and San José et al. [29] have assessed the impact of prolonged heatwaves on residential and commercial energy usage, revealing the growing necessity for climate-resilient urban planning. The effects of climate change are particularly pronounced in regions with extreme temperature variations, where HVAC systems must operate at higher capacities to maintain indoor comfort [30,31].
2.2. Energy Efficiency Strategies and Mitigation Measures
Energy efficiency interventions have been widely studied as potential mitigation strategies to address climate-induced energy challenges. Altan [32] assessed the role of energy efficiency measures in UK higher education institutions, whereas Santos et al. [33] investigated lightweight steel residential buildings’ response to changing climate conditions. Various studies have proposed design modifications, such as the effectiveness of shading devices in improving the energetic performance of buildings by Haghani et al. [34], which shows that a Reversible Daylighting System (RDS) outperformed conventional venetian blinds by adapting to seasonal changes in heating and cooling needs, thereby enhancing overall energy efficiency, and the impact of night ventilation strategies [25], and passive cooling techniques [35]. Karmann et al. [36] analyzed thermal comfort in buildings using radiant versus all-air systems, while Khourchid et al. [30] reviewed building cooling requirements under climate change scenarios.
Building envelope improvements have also been a major area of research, with studies focusing on insulation materials, reflective coatings, and dynamic facades to regulate indoor temperature variations [37,38]. The integration of renewable energy sources such as solar photovoltaics and geothermal systems has been emphasized by researchers as a crucial step in reducing dependency on fossil fuel-based energy [11,39]. Smart grids and demand response mechanisms have been explored to enhance energy flexibility and efficiency [40,41].
2.3. Simulation and Predictive Models
Building performance simulations play a crucial role in predicting the impact of climate change on energy consumption. Duan et al. [42] conducted a systematic review of challenges associated with thermal building performance simulations under future climate scenarios. Tools such as Energy Plus version 22.1.0 and computational fluid dynamics (CFD) models have been widely used to simulate occupant-driven energy variations [9,37,40]. Studies by Dirks et al. [10] and Kneifel et al. [43] emphasize the need for regional calibration of simulation models to improve predictive accuracy. Huang and Gurney [11] discussed the impact of spatiotemporal scales on building energy modeling, while Wang et al. [31] evaluated predictive climate models for office buildings.
Machine learning and artificial intelligence (AI) have been increasingly incorporated into simulation studies to enhance predictive capabilities [38]. AI-driven models have demonstrated greater accuracy in forecasting energy demand fluctuations based on climate variables, occupancy behaviors, and urban heat effects [44]. These advancements highlight the potential for data-driven energy optimization strategies that integrate real-time environmental data into building management systems [45].
2.4. Challenges and Future Research Directions
Despite significant advancements in understanding climate change’s impact on buildings, several challenges remain. The uncertainty of future climate projections, variability in occupant behavior, and regional disparities in climate adaptation strategies necessitate further [8,11,46]. Additionally, integrating smart energy consumption control mechanisms using machine learning and IoT [38] offers promising avenues for optimizing energy efficiency. Geissler et al. [28] discussed the transition towards energy efficiency policies, while Yau and Hasbi [47] analyzed climate change impacts on commercial buildings in tropical regions. A key concern is the balance between energy efficiency and occupant comfort, particularly in retrofitting older buildings with modern climate adaptation technologies [16,17].
More Studies on climate-responsive building design emphasize the need to integrate renewable energy systems and net-zero energy strategies into adaptation planning. Shang et al. [48] showed that greater adoption of renewables substantially reduces national climate risk, particularly in high-emission regions. Robert and Kummert [49] argued that net-zero energy buildings must be designed based on projected climate data to maintain performance over time, as those designed for historical weather often fail to achieve energy balance in warmer futures. Ibrahim et al. [50] further identified that effective retrofitting toward NZEB targets must combine passive, active, and control strategies tailored to climate trajectories. Likewise, Baniya and Giurco [51] emphasized aligning NZEB retrofits—including photovoltaics, HVAC improvements, and battery systems—with broader asset management and resilience goals. These studies reinforce the importance of integrating decarbonization strategies with forward-looking energy modeling to inform sustainable building design under climate change.
As climate change continues to reshape global energy landscapes, buildings must be designed to withstand these transformations. Research has shown that strategic interventions in design, technology, and policy can significantly mitigate the adverse effects of climate change on energy demand [18,44]. Future studies should focus on refining predictive models, incorporating adaptive energy solutions, and implementing region-specific climate-responsive strategies to enhance building resilience. Integrating advanced AI systems, renewable energy adoption, and regulatory frameworks will be essential in future-proofing the built environment against climate uncertainties.
3. Methodology
This study aims to evaluate the impact of future climate conditions on the energy performance of office buildings across different climate zones and building energy simulations are an accurate way to predict the future. The analysis begins with selecting ASHRAE prototype office buildings, categorized into three sizes: small, medium, and large [52] (Table 1). These prototypes serve as representative models for energy performance assessment. Climate conditions are analyzed across three time periods—current, 2050, and 2080—considering two future climate scenarios based on Representative Concentration Pathways (RCP): RCP 4.5, which represents a moderate emissions scenario, and RCP 8.5, which assumes a high-emissions future [53].

Table 1.
ANSI/ASHRAE/IES Standard 90.1 [52] Prototype Building Models [52].
Figure 1 shows geographical variations, climate zones are classified following the ASHRAE climate categorization, covering 16 different zones [54]. Weather data for each zone is generated using METEONORM version 8.0 software [55], producing (.epw) weather files necessary for energy simulations. METEONORM is a widely recognized tool that integrates measured climate data with stochastic weather generation techniques, ensuring accurate and representative future climate projections. It is extensively used in building performance research, renewable energy studies, and climate impact assessments.
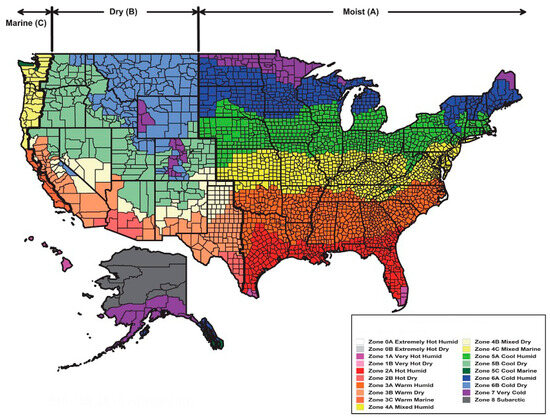
Figure 1.
United States Climate Zone Map. Source [54].
The EnergyPlus simulations were based on the U.S. DOE commercial reference building models, which follow standardized assumptions aligned with ASHRAE 90.1-2022. Each prototype includes default internal load parameters such as occupant density (number of people per square meter), lighting power density (in W/sq ft), and plug load profiles. These are applied through typical weekday and weekend occupancy schedules, with fixed values for occupied and unoccupied periods. HVAC systems operate under predefined heating and cooling. While these standardized schedules ensure comparability, they do not account for seasonal changes, regional cultural variations, or occupant-driven adaptations—factors which may impact real-world energy performance.
The key outputs of these simulations include Energy Use Intensity (EUI), EUI is a critical performance metric that represents the total energy consumption of a building per unit of floor area, typically expressed in kBtu/ft2/per year [56]. It provides a standardized measure to compare energy efficiency across different buildings and climate conditions. Finally, a comparative analysis is conducted to evaluate variations in energy consumption patterns across different building sizes, climate zones, and periods. This analysis helps identify potential challenges in maintaining energy efficiency and thermal comfort in office buildings as climate conditions evolve. By utilizing validated tools such as METEONORM and Energy Plus, the study ensures robust and reliable results, contributing to the broader understanding of climate change impacts on the built environment (Figure 2).
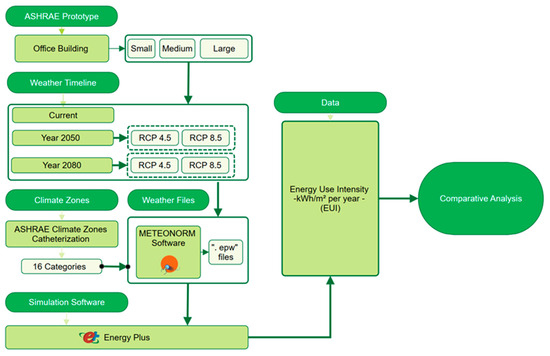
Figure 2.
Research Design Map. (Author 2025).
While this study employed deterministic EnergyPlus simulations using standardized DOE prototypes and METEONORM-generated future weather files, it is important to acknowledge the uncertainties inherent in long-term energy modeling. These include variability in climate projections, internal loads, and building operation assumptions, all of which can significantly influence simulation outcomes. METEONORM, although widely used in building performance analysis, relies on stochastic methods and interpolated data, which may limit spatial resolution and temporal accuracy. Recent studies have shown that different sources and methods for generating future weather files can yield significant variation in simulated performance [57,58]. Therefore, future research should incorporate uncertainty quantification techniques, such as Monte Carlo analysis or parametric variation, and leverage ensemble climate datasets like CMIP6 or regionally downscaled products (e.g., CORDEX or NARCCAP). These additions would improve both the robustness and the geographic specificity of climate resilience assessments in building simulations.
4. Overview of Simulations and Baseline EUI
This research draws on Energy Plus simulations of three ASHRAE office prototypes—small, medium, and large—across 16 diverse climate zones in the United States. By capturing distinct climate characteristics, from hot–humid Florida to cold northern regions in Minnesota, the simulations offer a detailed picture of how EUI may evolve under future climate scenarios. Baseline EUI values were first established under present conditions, reflecting each climate zone’s typical heating and cooling demands. Generally, current EUI levels tend to be highest for larger office buildings, due to their extensive floor areas and longer operational hours. However, medium-sized offices can sometimes approach similar consumption per square-foot because of higher occupant densities and equipment loads. Small offices typically post the lowest total EUI, yet local climate conditions cause notable variations. In regions with severe winters, heating dominates overall energy use, while in warm or humid climates, cooling can represent the largest fraction of consumption. These baseline results set the stage for understanding how different office types might respond to changes in temperature and humidity as projected by RCP 4.5 and RCP 8.5 scenarios for 2050 and 2080.
4.1. Small Office Prototype Results
4.1.1. Changes by 2050
In looking toward 2050, small office buildings show relatively moderate shifts in energy use across the 16 climate zones. Under the RCP 4.5 scenario—considering a middle-range climate pathway—many regions that already experience warm summers, such as cities in the Southeastern United States (e.g., Miami), see a gentle rise in overall EUI (typically 2–8%). This increase stems from more frequent or intense cooling requirements, as even modest temperature rises can push cooling equipment to run longer or start earlier in the year (Table 2).
Table 2.
Small Office Building EUI Result. (Author 2025).
Interestingly, in cold northern zones like Minneapolis or Buffalo, the slight reduction in wintertime heating load often offsets any extra summertime cooling, resulting in net EUI changes that hover around −1% to −4%. In climate zones with comparatively mild temperatures (e.g., parts of the Pacific Northwest), baseline cooling and heating demands are already balanced, so future changes remain modest, often under ±2%. These smaller offices thus exhibit a balancing act, where reductions in one (heating) partially compensate gains in another (cooling) end-use. Under the higher-emissions RCP 8.5 scenario for 2050, the patterns remain similar but tend to be more pronounced. Hotter climates may see EUI jump by 5–12%, while cold regions often land between a slight decrease (around −2%) and a small increase (around +3%). In many temperate locations, overall changes remain near-neutral as heating reductions and cooling increases largely counterbalance each other. Overall, the 2050 projections suggest that small offices are sensitive to warm climates, but the exact magnitude of the shift depends strongly on each zone’s baseline weather profile (Figure 3).
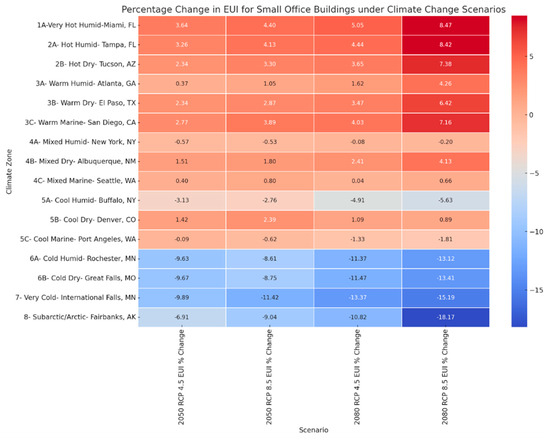
Figure 3.
Projected percentage changes in EUI for small office buildings across 16 U.S. climate zones under RCP 4.5 and RCP 8.5 scenarios for the years 2050 and 2080. (Author 2025).
4.1.2. Changes by 2080
By 2080, small offices under RCP 4.5 show a continued expansion of these trends. For example, hot–humid regions—Florida or coastal Texas—start to exhibit more noticeable spikes, sometimes surpassing a 10% increase in EUI relative to the current baseline. Meanwhile, previously cold areas might see slightly bigger savings on heating, though new or expanded cooling needs can partly offset those gains. The net effect is that northern locations may range from modestly reduced EUI to near baseline levels (within about ±5%). Under RCP 8.5 in 2080, the difference is more dramatic. Many hot climate zones see EUI climb by at least 15%, fueled by pronounced cooling requirements in longer, more intense heat waves. Though benefiting from milder winters, even parts of the northern United States start encountering enough extra summer cooling to end up with near-stable or slightly increased overall EUIs. A handful of coastal or marine cli-mates remain relatively insulated from extreme swings, showing EUI changes of perhaps ±3%. Despite variations, it is clear that small office buildings in hot climates bear the brunt of climate-induced energy demand increases over the next several decades (Figure 3).
4.2. Medium Office Prototype Results
4.2.1. Changes by 2050
Medium-sized offices broadly follow similar patterns, though the magnitude of change is often more noticeable, both absolute and in percentage terms. Under RCP 4.5 in 2050, buildings in very warm climates typically register EUI increases of 3–9%, underscoring the stronger cooling demands for these somewhat larger structures. Meanwhile, cold regions could see a decrease in heating, sometimes bringing net results in the range of −3% to +2%. Cities with moderate or marine climates exhibit relatively minor changes. However, the bigger occupant loads and internal gains in medium-sized offices can still amplify the effect of slight outdoor temperature shifts (Table 3).
Table 3.
Medium Office Building EUI Result. (Author 2025).
Under RCP 8.5 by 2050, the pattern of increased cooling demand intensifies, particularly in locations like Texas, Arizona, or Florida. Some places may see EUI growth creep above 10%, indicating sustained or peak cooling loads during summer months. Nevertheless, in certain parts of the Midwest or Northeast, the net changes can still be limited or near neutral, as milder winters bring heating savings that partially balance out higher summer cooling (Figure 4).
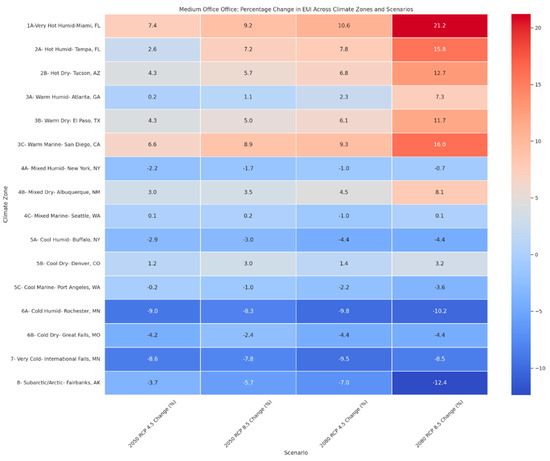
Figure 4.
Projected percentage changes in EUI for medium office buildings across 16 U.S. climate zones under RCP 4.5 and RCP 8.5 scenarios for the years 2050 and 2080. (Author 2025).
4.2.2. Changes by 2080
Moving forward to 2080, RCP 4.5 shows a continued but moderate upward pull in EUI within hot climates, often landing in the 8–12% range compared to current conditions. Zones already accustomed to cold winters record reductions in heating energy, although they may also contend with enough added cooling to temper these gains, resulting in net changes of around −4% to +4%. Marine climates once again tend to remain near baseline values, with fewer temperature extremes. Under the higher RCP 8.5 projections for 2080, medium offices in consistently hot conditions can climb above a 15% boost in EUI, highlighting the strain of more intense or extended cooling seasons. Northern locations see meaningful declines in heating needs, but these are not always sufficient to counterbalance new summer cooling loads. As such, while medium-sized offices often display the largest percentage changes among the three prototype sizes, the specific outcome in each city largely depends on whether climate extremes are more winter-or summer-oriented (Figure 4).
4.3. Large Office Prototype Results
4.3.1. Changes by 2050
Large offices, known for advanced HVAC systems and significant internal equipment loads, present a slightly different picture. In 2050 under RCP 4.5, most hot–humid locations register EUI increases around 2–7%, which may be lower on a percentage basis compared to medium offices. However, in absolute terms, large offices can consume noticeably more energy overall because of their bigger footprint. Colder areas often see net decreases of about −1% to −5% due to cuts in heating demands, though the addition of warmer summers contributes to some variability. In moderate zones, large offices can remain close to current EUI values (within ±2%), suggesting that strong internal loads and efficient centralized systems buffer some of the outdoor climatic changes. Under RCP 8.5 for 2050, large offices in warm climates typically see a somewhat greater jump, often up to 10% above baseline. Winter-driven climates may experience net EUI reductions in the range of −2% to −6%, once again reflecting the shifting balance between heating and cooling. Where summers are becoming substantially warmer, the required cooling can noticeably blunt the wintertime energy savings (Table 4).
Table 4.
Large Office Building EUI Result. (Author 2025).
4.3.2. Changes by 2080
By 2080 under RCP 4.5, large offices in the hottest parts of the country often experience EUI increases of 8–12%, in line with a more demanding cooling season. Meanwhile, places with cold winters stand to reduce heating by a further margin, sometimes generating total EUIs about 3–6% below current levels. Marine or coastal climates remain close to present-day EUI figures, sometimes deviating by less than 3%. Under RCP 8.5, hotter and more humid regions frequently push large office EUIs into a 12–15% increase by 2080. While winter demand continues to drop-in cold locations, the need for extra summer cooling can narrow the net savings. In many instances, large offices show slightly less extreme percentage changes than medium-sized offices, but because of their size, the absolute rise in energy consumption can still be considerable (Figure 5).
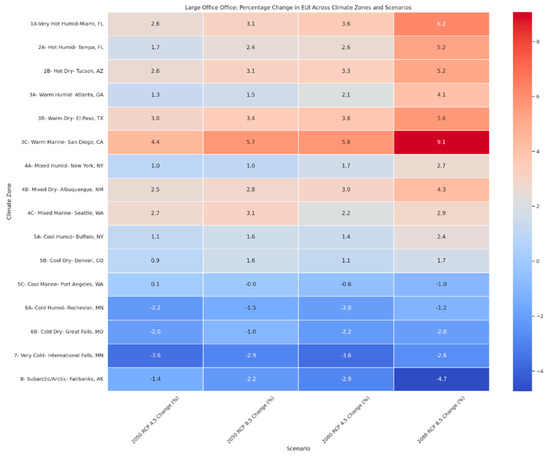
Figure 5.
Projected percentage changes in EUI for large office buildings across 16 U.S. climate zones under RCP 4.5 and RCP 8.5 scenarios for the years 2050 and 2080. (Author 2025).
4.4. Cross-Comparison by Climate Zone
Comparing how climates respond across all office prototypes yields a consistent pattern. Places already experiencing high summer temperatures—such as Florida, Texas, and parts of the Southwest—tend to show the greatest proportional or absolute EUI gains. Colder northern states often enjoy net heating reductions, though any air conditioning surge can limit the extent of these savings. Some coastal or marine climates (e.g., Seattle, San Francisco) keep overall changes modest, typically remaining within 2–4% of baseline levels, even under more aggressive climate projections. Not surprisingly, RCP 8.5 scenarios reveal larger impacts than RCP 4.5, particularly by 2080, when warming patterns become increasingly established. Although the scale differs among building sizes, the direction of the trends remains the same: warmer climates face intensifying cooling demands. At the same time, colder regions see diminishing heating needs, with some balancing effects in temperate areas.
4.5. Comparative Analysis Among Office Types
A key factor in comparing the three office prototypes—small, medium, and large—is the magnitude of change they experience. Small offices typically exhibit moderate percentage increases in hot climates and mild decreases in traditionally cold regions. Their smaller footprint, however, can magnify temperature-driven swings in energy demand, especially in cold areas, although the overall changes remain relatively contained. Medium offices often show the most dramatic percentage increases in warm zones, likely due to higher occupant densities and greater internal loads. Large offices, by contrast, tend to benefit from centralized and sometimes more efficient HVAC systems. As a result, their percentage increases in EUI can appear lower than those in medium offices. Still, the total energy consumption of large buildings is high enough that even small percentage changes translate into significant absolute impacts.
Climate sensitivity across different regions reveals similar trends. In hot–humid or hot-dry environments, all three office sizes see notable increases in cooling demands, but medium and large prototypes generally require a more pronounced capacity shift than their baseline. In cold northern areas, there is typically a substantial drop in heating energy use, producing net EUI savings that can be mitigated, to varying degrees, by additional cooling requirements during ever-warming summers. Meanwhile, with moderate year-round temperatures, marine or coastal climates tend to show smaller overall fluctuations in EUI for any office type. Combining these factors, medium-sized offices emerge as the most reactive in percentage changes, large offices risk the highest absolute increases, and small offices generally fall between the two, with outcomes heavily influenced by local climate characteristics (Figure 6).
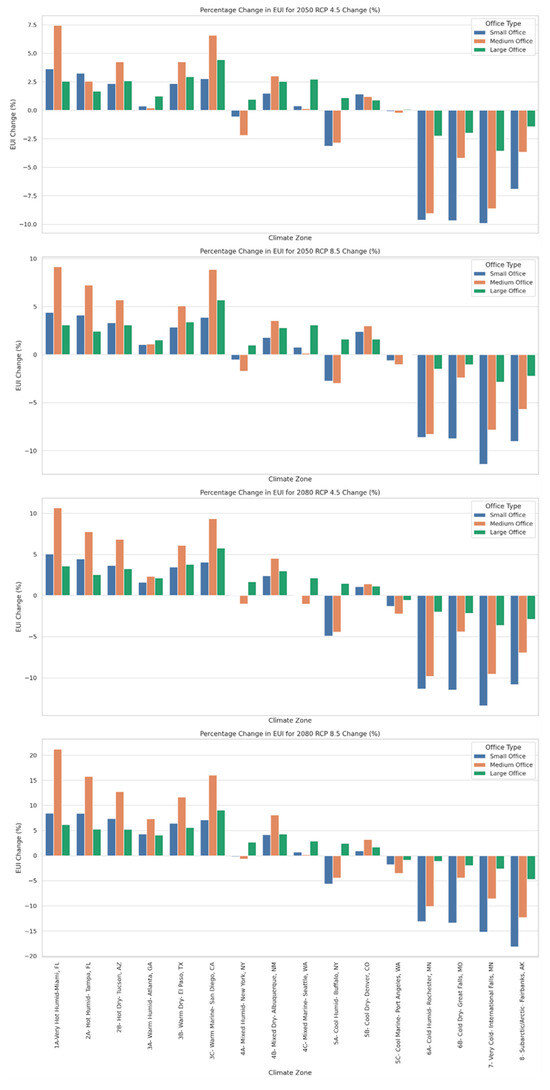
Figure 6.
Comparative EUI changes across all three office building types for each climate zone under RCP 4.5 and RCP 8.5. (Author 2025).
While these results offer valuable insights into projected EUI shifts across building typologies and climate zones, it is important to acknowledge a key limitation: the absence of real-world energy monitoring data for validation. The findings are based solely on simulation using standardized DOE prototypes, which, although reliable, may not capture the variability of real-world operational conditions, occupant behaviors, or maintenance practices.
5. Discussion
Considering energy usage intensity (EUI) for small, medium, and large office buildings under prospective climate scenarios demonstrates considerable disparities among building types, climate zones, and emission trajectories. The results highlight the intricate link between climatic circumstances and building energy efficiency, revealing significant inequality between the RCP 4.5 and RCP 8.5 scenarios. This analysis examines the findings concerning the three principal research inquiries: (1) how climate change scenarios influence energy consumption across various climatic zones, (2) which office type is most significantly affected, and (3) which climate zones are most influenced for each office type.
Climate change forecasts under RCP 4.5 and RCP 8.5 illustrate the impact of future warming on energy consumption trends in office buildings. In all construction categories, the tendency is evident: warmer areas encounter rising cooling energy requirements, whilst colder places see decreases owing to milder winters. The average EUI for small office buildings exhibits a marginal decrease in RCP 4.5 and RCP 8.5 scenarios between 2050 and 2080. This decline signifies an equilibrium between increasing cooling requirements and diminishing heating demands. Nonetheless, geographical disparities are significant. Miami, FL, anticipates the most significant increase, with an 8.5% jump by 2080 under RCP 8.5, attributed to heightened cooling demands. Comparable gains are noted in Tampa, FL (8.4%) and San Diego, CA (7.2%). In contrast, northern areas like Fairbanks, AK, have significant declines, achieving −18.2% by 2080 under RCP 8.5, along with International Falls, MN (−15.2%) and Great Falls, MT (−13.4%). These decreases align with the findings of Isaac and Van Vuuren [59], who emphasized that cold locations benefit from warmer winters due to decreased heating energy requirements.
While this study grouped simulation results by standardized ASHRAE climate zones for national comparability, this approach may overlook local environmental nuances that influence building performance. In particular, dense urban areas are often subject to elevated temperatures due to the urban heat island (UHI) effect, which can significantly increase cooling energy demands [60]. Microclimatic factors—such as surrounding vegetation, building density, albedo, and topography—also shape energy dynamics in specific neighborhoods [61]. To enhance predictive precision, future research should incorporate localized data from high-resolution urban climate models or satellite-derived UHI datasets. Such refinements would support more tailored climate adaptation strategies for buildings situated in vulnerable urban cores.
Medium-sized office buildings have heightened susceptibility to climate change. By 2080, under the RCP 8.5 scenario, the EUI escalates markedly, averaging 12.5%, with Miami, FL, exhibiting the most substantial increase at 21.2%, followed by San Diego, CA (16.0%) and Tucson, AZ (12.7%). The significant increase in these areas indicates the prevalence of cooling energy in warm settings. Colder areas, including Fairbanks, AK (−12.4%), Rochester, MN (−10.2%), and International Falls, MN (−8.5%), exhibit significant decreases, suggesting that future heating requirements will persist in diminishing.
Large office buildings exhibit minor fluctuations compared to small and medium-sized offices. By 2080, under RCP 8.5, the average EUI increase is projected to be 7.4%, with San Diego, CA (9.1%), Miami, FL (6.2%), and El Paso, TX (5.6%) exhibiting the most pronounced increases. The durability of large office buildings is due to their sophisticated HVAC systems, thermal mass, and effective building envelopes. Simultaneously, cold-climate cities such as Fairbanks, AK (−4.7%), International Falls, MN (−2.6%), and Rochester (−1.2%) persist in observing moderate reductions in EUI. While large office buildings demonstrated lower percentage increases in EUI under future scenarios, this resilience is not solely attributed to their advanced HVAC systems, thermal mass, or well-insulated envelopes. Other contributing factors likely include more stable and predictable occupancy schedules, diversified equipment loads across multiple zones, and centralized building management systems that enable fine-tuned operational controls. These characteristics allow for greater load distribution and operational efficiency, particularly in response to external climate stressors.
The box plot study (Figure 7) corroborates this conclusion by depicting EUI variations among RCP scenarios and years. In 2080, under RCP 8.5, medium office buildings in Miami, San Diego, and Tucson exhibit the most substantial increases, whereas Fairbanks and other frigid regions see continuous decreases. This image substantiates the conclusion that the intensity of climate change in high-emission scenarios escalates energy requirements in the warm areas, mainly for medium-sized office buildings. Considering energy usage intensity (EUI) for small, medium, and large office buildings under prospective climate scenarios indicates substantial discrepancies among building categories, climatic regions, and emission trajectories. The results highlight the intricate link between climatic circumstances and building energy efficiency, revealing significant disparities between the RCP 4.5 and RCP 8.5 scenarios. Interestingly, RCP 4.5 projections for 2050 in a few locations resulted in slightly higher EUI values than RCP 8.5. This is attributed to non-linear regional climate variations and load interactions at mid-century timeframes, where differences between emissions scenarios are still modest.
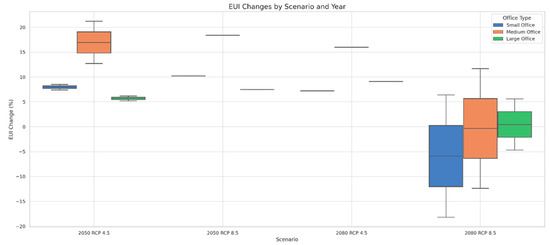
Figure 7.
Visualization of EUI changes across all office types, climate zones, and future climate scenarios. (Author 2025).
Among the three types of office buildings, medium-sized ones are the most affected by prospective climate change scenarios. By 2080, under RCP 8.5, the average EUI for medium-sized offices is projected to increase by 12.5%, while large offices will experience a 7.4% increase, and small offices will see a minor drop of 2.5%. This increased sensitivity is due to the design features of medium office buildings, which often exhibit greater internal heat gains and bigger conditioned areas than small offices but lack the thermal mass and sophisticated systems seen in large office buildings. To assess the impact across cities, the heatmaps (Figure 8) indicate that Miami, FL (21.2%), San Diego, CA (16.0%), and Tucson, AZ (12.7%) demonstrate the most significant increases in EUI for midsize offices under RCP 8.5 by 2080. Conversely, Fairbanks, AK (−18.2%), Rochester, MN (−14.8%), and International Falls, MN (−12.4%) exhibit the most significant declines, indicating diminished energy demands as winters grow milder (Figure 8).
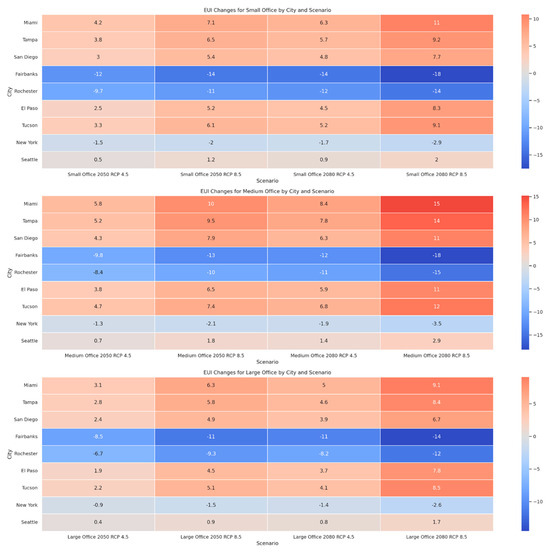
Figure 8.
EUI changes by climate zones and office types. (Author 2025).
Although the ANOVA test revealed a p-value of 0.506, indicating that the observed EUI differences between small, medium, and large office buildings were not statistically significant at the 95% confidence level, the absolute energy use increases across building types and climate zones remain meaningful from a design and policy standpoint. For example, medium-sized offices in hot–humid zones showed EUI increases exceeding 20%, which, although statistically inconclusive, suggest heightened vulnerability to future climate impacts. These findings may still inform decisions related to envelope upgrades, HVAC capacity planning, and climate-responsive design strategies in zones with elevated cooling demands. Thus, the statistical insignificance does not negate the practical utility of the results when considered in a resilience planning context
Summary of Discussion
The projected impact of climate change on the EUI of small office buildings reveals significant variations across different climate zones and future scenarios. On average, EUI is expected to decrease slightly in 2050 and 2080 under the RCP 4.5 and RCP 8.5 scenarios. Specifically, by 2050, the average EUI is projected to decline by approximately 2.03% under RCP 4.5 and 1.85% under RCP 8.5 compared to current levels. By 2080, these reductions are anticipated to be around 2.64% and 2.58% for RCP 4.5 and RCP 8.5, respectively (Figure 9). These modest reductions can be attributed to the complex interplay between decreased heating demands and increased cooling requirements as global temperatures rise. In warmer climates, the reduction in heating energy use often outweighs the increase in cooling energy consumption, leading to a net decrease in total energy use. This phenomenon has been observed in previous studies, such as the work by Wang and Chen [62] which demonstrated that while cooling energy consumption is expected to rise due to global warming, the overall energy use may decline in certain regions because of more significant reductions in heating demands.
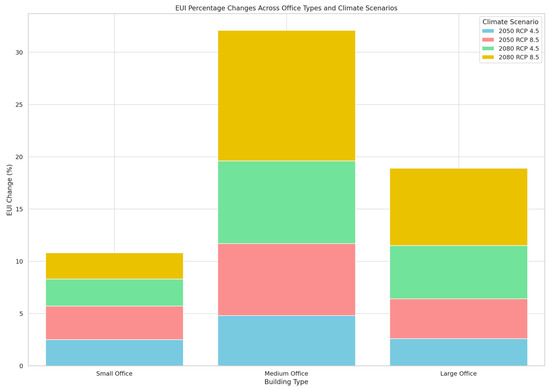
Figure 9.
Summary of EUI percentage changes for all building types across climate zones. (Author 2025).
However, this average trend does not capture the variability observed across different climate zones. Among all climate zones, the highest increase in EUI is observed in Miami, FL (Climate Zone 1A), a very hot and humid region. Under the RCP 8.5 scenario 2080, the EUI rises by approximately 8.47% compared to the current state, reaching 29.83 kBtu/ft2. This increase is primarily driven by the escalating cooling demands required to maintain indoor comfort as temperatures continue to rise. Similar trends, though slightly less pronounced, are seen in the 2050 projections, where the same climate zone experiences a 4.4% increase in EUI under RCP 8.5 and 3.6% under RCP 4.5. These findings align with previous studies indicating that hot–humid climates will experience intensified cooling loads under future warming conditions [63,64].
Conversely, the most significant reduction in EUI is observed in Fairbanks, AK (Climate Zone 8), a subarctic region. By 2080, under the RCP 8.5 scenario, the EUI is projected to decrease by 18.17%, dropping to 35.03 kBtu/ft2. This reduction can be attributed to the diminishing heating requirements as winters become milder, a trend also noted in research by Crawley [65], who highlighted the potential for substantial energy savings in cold climates under future warming scenarios. Similarly, International Falls, MN (Climate Zone 7), known for its very cold climate, experiences significant EUI reductions, with a 15.18% decrease under RCP 8.5 by 2080. The 2050 projections show a comparable trend, with reductions of 9.89% under RCP 4.5 and 11.42% under RCP 8.5. These findings further underscore the regional disparities in climate change impacts, where colder regions benefit from reduced heating demands while hotter regions face increased cooling burdens [59].
The results highlight the need for climate-responsive building designs tailored to specific regions. In hot–humid zones like Miami, prioritizing advanced cooling strategies and high-performance building envelopes will be essential to mitigate rising energy demands. Thus, optimizing heating systems for milder winters can further enhance energy efficiency in colder regions like Fairbanks and International Falls. As the climate continues to evolve, understanding these region-specific impacts will be crucial for developing resilient and sustainable building practices [66].
In addition to passive design strategies, climate adaptation requires integrating adaptive technologies that dynamically respond to environmental and user-driven factors. Advanced building envelopes, such as those incorporating phase change materials (PCMs) or double-skin façades, have been shown to reduce cooling loads under future climate conditions significantly [67]. On-site renewable energy systems, including photovoltaic (PV), geothermal, and hybrid technologies, are also essential to decarbonize buildings while maintaining operational efficiency in a warming climate [68]. Equally important is the consideration of occupant behavior, which demonstrably influences energy use and thermal comfort in buildings. Studies have shown that daily heating, cooling, and ventilation practices significantly affect simulation outcomes under future scenarios [69]. Although these aspects were not modeled directly in this study, we recommend future simulation efforts incorporating adaptive and behavioral parameters alongside envelope modifications and renewable systems.
6. Conclusions
The EUI analysis underscores the profound impact of climate change on building energy consumption across different office types and climate zones. The findings highlight the growing disparity between warming and cooling energy demands, with hot–humid regions facing escalating cooling requirements, while colder areas benefit from reduced heating demands. Among the three office building types, medium-sized office buildings emerge as the most vulnerable category, exhibiting the highest EUI increases under high-emission scenarios, particularly in warm climates such as Miami, San Diego, and Tucson. This heightened sensitivity is attributed to their larger conditioned areas and internal heat gains compared to small offices. Yet, they lack the thermal mass and advanced HVAC systems that contribute to the resilience of large office buildings.
This research illustrates the effects of climate change on office buildings, providing crucial insights into regional energy consumption trends. Cities with hot and humid climates, including Miami, Tampa, and Tucson, exhibit the most significant rises in EUI under projected climatic scenarios, especially for medium office buildings. Large office buildings, while still affected by climate change, demonstrate more stable energy consumption trends due to their more sophisticated mechanical systems and enhanced insulation properties. Conversely, small office buildings exhibit relatively moderate changes in EUI, with some cases experiencing slight declines as reduced heating demands offset the increase in cooling requirements.
This increased vulnerability underscores the pressing need for more sustainable design methodologies integrating passive measures to diminish cooling loads and improve energy efficiency. Passive design strategies, including optimum building orientation, sophisticated shading systems, natural ventilation, and high-performance building envelopes, can substantially reduce the energy demands associated with rising temperatures. Additionally, advancements in energy-efficient HVAC systems, thermal insulation technologies, and smart building automation can further enhance building resilience against extreme climatic conditions.
Furthermore, the findings underscore the imperative for revised building regulations and standards, particularly in climate-sensitive areas, to ensure that forthcoming construction and retrofitting procedures conform to climate resilience objectives. Given their heightened vulnerability to climate change, medium-sized office buildings require particular attention in regulatory updates. Implementing stricter energy efficiency codes, enhanced cooling strategies, and thermal performance standards for medium-sized office buildings in hot and humid climates will be crucial to mitigating future energy demands. Large office buildings, while more resilient, can also benefit from regulations promoting renewable energy integration and smart energy management systems. Small office buildings, experiencing relatively minor variations, may require targeted strategies focusing on cost-effective retrofitting measures to enhance overall efficiency.
As climate change escalates, it is essential to integrate resilience into architectural and regulatory frameworks to safeguard energy systems and urban infrastructure. Future designs must prioritize energy efficiency and climate adaptation strategies, leveraging technological innovations such as adaptive facades, renewable energy integration, and predictive energy modeling. Given these projected shifts, adapting building design to climate-compatible solutions becomes imperative. Policymakers and stakeholders must take proactive measures to ensure that future office buildings remain energy-efficient and sustainable despite the uncertainties of climate change. Collaboration between government agencies, industry leaders, and researchers will be essential in developing policies that promote resilient and adaptable building practices, ultimately ensuring a sustainable future for office buildings in an increasingly dynamic climate landscape.
Directions for Future Research
Future studies could incorporate more granular occupant data to refine these insights further, exploring how daily and seasonal occupancy fluctuations shape real-time cooling and heating loads. Hourly or sub-hourly simulations might uncover the severity of peak critical for grid stability and for sizing equipment like chillers and thermal energy storage. Linking building energy models to electrical grid models would also help stakeholders understand how escalating peak cooling demands might stress local power infrastructure and create resilience challenges. Moreover, expanded research on adaptation strategies, such as shading retrofits, dynamic glazing systems, or on-site renewable integration, would help quantify cost–benefit trade-offs under rising cooling loads. Investigating other building types beyond offices (e.g., retail, healthcare, education) could present a more holistic picture of the commercial sector’s vulnerability to climate change and sharpen state and national energy policy recommendations.
Author Contributions
Conceptualization, M.G.; methodology, M.G.; software, S.N.; validation, M.G. and S.N.; formal analysis, S.N.; writing—original draft preparation, S.N. and M.G.; writing—review and editing, M.G.; visualization, M.G. and S.N.; supervision, M.G. All authors have read and agreed to the published version of the manuscript.
Funding
This research received no external funding.
Institutional Review Board Statement
Not applicable.
Informed Consent Statement
Not applicable.
Data Availability Statement
The raw data supporting the conclusions of this article will be made available by the authors on request.
Conflicts of Interest
The authors declare no conflict of interest.
Abbreviations
The following abbreviations are used in this manuscript:
| EUI | Energy Use Intensity |
| RCP | Representative Concentration Pathways |
| ASHRAE | American Society of Heating, Refrigerating and Air-Conditioning Engineers |
| CFD | Computational Fluid Dynamics |
| UHI | Urban Heat Island |
| NZEB | Net-Zero Energy Building |
| PCMs | Phase Change Materials |
| PV | Photovoltaic |
References
- Li, Y.; Han, M.; Liu, S.; Chen, G. Energy consumption and greenhouse gas emissions by buildings: A multi-scale perspective. Build. Environ. 2019, 151, 240–250. [Google Scholar] [CrossRef]
- Min, J.; Yan, G.; Abed, A.M.; Elattar, S.; Khadimallah, M.A.; Jan, A.; Ali, H.E. The effect of carbon dioxide emissions on the building energy efficiency. Fuel 2022, 326, 124842. [Google Scholar] [CrossRef]
- Baglivo, C.; Albanese, P.M.; Congedo, P.M. Relationship between shape and energy performance of buildings under long-term climate change. J. Build. Eng. 2024, 84, 108544. [Google Scholar] [CrossRef]
- Wang, C.; Song, J.; Shi, D.; Reyna, J.L.; Horsey, H.; Feron, S.; Zhou, Y.; Ouyang, Z.; Li, Y.; Jackson, R.B. Impacts of climate change, population growth, and power sector decarbonization on urban building energy use. Nat. Commun. 2023, 14, 6434. [Google Scholar] [CrossRef] [PubMed]
- Ciancio, V.; Salata, F.; Falasca, S.; Curci, G.; Golasi, I.; de Wilde, P. Energy demands of buildings in the framework of climate change: An investigation across Europe. Sustain. Cities Soc. 2020, 60, 102213. [Google Scholar] [CrossRef]
- Chen, Y.; Ren, Z.; Peng, Z.; Yang, J.; Chen, Z.; Deng, Z. Impacts of climate change and building energy efficiency improvement on city-scale building energy consumption. J. Build. Eng. 2023, 78, 107646. [Google Scholar] [CrossRef]
- De Masi, R.F.; Gigante, A.; Ruggiero, S.; Russo, A. Impacts of the 4.5 and 8.5 RCP global climate scenarios on nearly zero energy building performance: Sensitivity analysis about operative conditions of insulation materials and PV system degradation. Sci. Technol. Built Environ. 2024, 30, 1236–1255. [Google Scholar] [CrossRef]
- Cody, B.; Loeschnig, W.; Eberl, A. Operating energy demand of various residential building typologies in different European climates. Smart Sustain. Built Environ. 2018, 7, 226–250. [Google Scholar] [CrossRef]
- Azar, E.; Menassa, C. Sensitivity of energy simulation models to occupancy related parameters in commercial buildings. In Proceedings of the Construction Research Congress 2012: Construction Challenges in a Flat World, West Lafayette, IN, USA, 21–23 May 2012; pp. 1381–1390. [Google Scholar]
- Dirks, J.A.; Gorrissen, W.J.; Hathaway, J.H.; Skorski, D.C.; Scott, M.J.; Pulsipher, T.C.; Huang, M.; Liu, Y.; Rice, J.S. Impacts of climate change on energy consumption and peak demand in buildings: A detailed regional approach. Energy 2015, 79, 20–32. [Google Scholar] [CrossRef]
- Huang, J.; Gurney, K.R. The variation of climate change impact on building energy consumption to building type and spatiotemporal scale. Energy 2016, 111, 137–153. [Google Scholar] [CrossRef]
- Alhindawi, I.; Jimenez-Bescos, C. Assessing the performance gap of climate change on buildings design analytical stages using future weather projections. Environ. Clim. Technol. 2020, 24, 119–134. [Google Scholar] [CrossRef]
- Apostolopoulou, A.; Jimenez-Bescos, C.; Cavazzi, S.; Boyd, D. Impact of Climate Change on the Heating Demand of Buildings. A District Level Approach. Environ. Clim. Technol. 2023, 27, 1–12. [Google Scholar]
- Behrens, P.; Van Vliet, M.T.; Nanninga, T.; Walsh, B.; Rodrigues, J.F. Climate change and the vulnerability of electricity generation to water stress in the European Union. Nat. Energy 2017, 2, 17114. [Google Scholar] [CrossRef]
- Chidiac, S.E.; Yao, L.; Liu, P. Climate change effects on heating and cooling demands of buildings in Canada. CivilEng 2022, 3, 277–295. [Google Scholar] [CrossRef]
- Meinshausen, M.; Smith, S.J.; Calvin, K.; Daniel, J.S.; Kainuma, M.L.; Lamarque, J.-F.; Matsumoto, K.; Montzka, S.A.; Raper, S.C.; Riahi, K. The RCP greenhouse gas concentrations and their extensions from 1765 to 2300. Clim. Change 2011, 109, 213–241. [Google Scholar] [CrossRef]
- Riahi, K.; Rao, S.; Krey, V.; Cho, C.; Chirkov, V.; Fischer, G.; Kindermann, G.; Nakicenovic, N.; Rafaj, P. RCP 8.5—A scenario of comparatively high greenhouse gas emissions. Clim. Change 2011, 109, 33–57. [Google Scholar] [CrossRef]
- Santamouris, M.; Vasilakopoulou, K. Present and future energy consumption of buildings: Challenges and opportunities towards decarbonisation. E-Prime-Adv. Electr. Eng. Electron. Energy 2021, 1, 100002. [Google Scholar] [CrossRef]
- Bell, N.O.; Bilbao, J.I.; Kay, M.; Sproul, A.B. Future climate scenarios and their impact on heating, ventilation and air-conditioning system design and performance for commercial buildings for 2050. Renew. Sustain. Energy Rev. 2022, 162, 112363. [Google Scholar] [CrossRef]
- Berardi, U.; Jafarpur, P. Assessing the impact of climate change on building heating and cooling energy demand in Canada. Renew. Sustain. Energy Rev. 2020, 121, 109681. [Google Scholar] [CrossRef]
- Chow, D.H.; Levermore, G.J. The effects of future climate change on heating and cooling demands in office buildings in the UK. Build. Serv. Eng. Res. Technol. 2010, 31, 307–323. [Google Scholar] [CrossRef]
- Ortiz, L.; González, J.E.; Lin, W. Climate change impacts on peak building cooling energy demand in a coastal megacity. Environ. Res. Lett. 2018, 13, 094008. [Google Scholar] [CrossRef]
- Baba, F.M.; Ge, H. Effect of climate change on the annual energy consumption of a single family house in British Columbia. In MATEC Web of Conferences; EDP Sciences: Les Ulis, France, 2018. [Google Scholar]
- Baba, F.M.; Ge, H. Effect of climate change on the energy performance and thermal comfort of high-rise residential buildings in cold climates. In MATEC Web of Conferences; EDP Sciences: Les Ulis, France, 2019. [Google Scholar]
- Xiaoxu, L.; Kailiang, H.; Guohui, F.; Danyang, J.; Dan, L.; Jiawei, L. Analysis on night ventilation effect of buildings with different energy consumption levels in Shenyang. In E3S Web of Conferences; EDP Sciences: Les Ulis, France, 2022. [Google Scholar]
- Spinoni, J.; Vogt, J.V.; Barbosa, P.; Dosio, A.; McCormick, N.; Bigano, A.; Füssel, H.-M. Changes of heating and cooling degree-days in Europe from 1981 to 2100. Int. J. Clim. 2018, 38, e191–e208. [Google Scholar] [CrossRef]
- Bass, B.; New, J. How will United States commercial building energy use be impacted by IPCC climate scenarios? Energy 2023, 263, 125945. [Google Scholar] [CrossRef]
- Geissler, S.; Österreicher, D.; Macharm, E. Transition towards energy efficiency: Developing the Nigerian building energy efficiency code. Sustainability 2018, 10, 2620. [Google Scholar] [CrossRef]
- San José, R.; Pérez, J.L.; Pérez, L.; Barras, R.M.G. Climate Change Impacts on Energy Demand of Madrid Buildings. J. Clean Energy Technol. 2018, 6, 87–92. [Google Scholar] [CrossRef]
- Khourchid, A.M.; Ajjur, S.B.; Al-Ghamdi, S.G. Building cooling requirements under climate change scenarios: Impact, mitigation strategies, and future directions. Buildings 2022, 12, 1519. [Google Scholar] [CrossRef]
- Wang, L.; Liu, X.; Brown, H. Prediction of the impacts of climate change on energy consumption for a medium-size office building with two climate models. Energy Build. 2017, 157, 218–226. [Google Scholar] [CrossRef]
- Altan, H. Energy efficiency interventions in UK higher education institutions. Energy Policy 2010, 38, 7722–7731. [Google Scholar] [CrossRef]
- Santos, P.; Gervásio, H.; da Silva, L.S.; Lopes, A.G. Influence of climate change on the energy efficiency of light-weight steel residential buildings. Civ. Eng. Environ. Syst. 2011, 28, 325–352. [Google Scholar] [CrossRef]
- Haghani, M.; Mohammadkari, B.; Fayaz, R. The Evaluation of a New Daylighting System’s Energy Performance: Reversible Daylighting System (RDS). arXiv 2023, arXiv:2303.07511. [Google Scholar]
- Österreicher, D.; Seerig, A. Buildings in Hot Climate Zones—Quantification of Energy and CO2 Reduction Potential for Different Architecture and Building Services Measures. Sustainability 2024, 16, 9812. [Google Scholar] [CrossRef]
- Karmann, C.; Schiavon, S.; Bauman, F. Thermal comfort in buildings using radiant vs. all-air systems: A critical literature review. Build. Environ. 2017, 111, 123–131. [Google Scholar] [CrossRef]
- Niknia, S.; Rashed-Ali, H. Analyzing energy consumption due to occupant interaction with manual and automatic window blinds in multiple climates. J. Build. Eng. 2024, 90, 109506. [Google Scholar] [CrossRef]
- Udendhran, R.; Sasikala, R.; Nishanthi, R.; Vasanthi, J. Smart Energy Consumption Control in Commercial Buildings Using Machine Learning and IOT. In E3S Web of Conferences; EDP Sciences: Les Ulis, France, 2023. [Google Scholar]
- Jenkins, D.P.; Patidar, S.; Simpson, S.A. Quantifying change in buildings in a future climate and their effect on energy systems. Buildings 2015, 5, 985–1002. [Google Scholar] [CrossRef]
- Leslie, P.; Pearce, J.M.; Harrap, R.; Daniel, S. The application of smartphone technology to economic and environmental analysis of building energy conservation strategies. Int. J. Sustain. Energy 2012, 31, 295–311. [Google Scholar] [CrossRef]
- Nimlyat, P.; Dassah, E.; Allu, E. Computer Simulations in Buildings: Implications for Building Energy Performance. IOSR J. Eng. 2014, 4, 56–62. [Google Scholar]
- Duan, Z.; de Wilde, P.; Attia, S.; Zuo, J. Challenges in predicting the impact of climate change on thermal building performance through simulation: A systematic review. Appl. Energy 2025, 382, 125331. [Google Scholar] [CrossRef]
- Kneifel, J.; Kneifel, J.; O’Rear, E. Benefits and Costs of Energy Standard Adoption for New Residential Buildings: National Summary; US Department of Commerce, National Institute of Standards and Technology: Gaithersburg, MD, USA, 2015. [Google Scholar]
- Ma, L.; Zeng, Z. A Survey of the Influence of Air Distribution on Indoor Environment and Building Energy Efficiency. J. Phys. Conf. Ser. 2022, 2287, 012041. [Google Scholar] [CrossRef]
- Billanes, J.D.; Ma, Z.G.; Jørgensen, B.N. Data-Driven Technologies for Energy Optimization in Smart Buildings: A Scoping Review. Energies 2025, 18, 290. [Google Scholar] [CrossRef]
- Elnagar, E.; Gendebien, S.; Georges, E.; Berardi, U.; Doutreloup, S.; Lemort, V. Framework to assess climate change impact on heating and cooling energy demands in building stock: A case study of Belgium in 2050 and 2100. Energy Build. 2023, 298, 113547. [Google Scholar] [CrossRef]
- Yau, Y.H.; Hasbi, S. A review of climate change impacts on commercial buildings and their technical services in the tropics. Renew. Sustain. Energy Rev. 2013, 18, 430–441. [Google Scholar] [CrossRef]
- Shang, Y.; Sang, S.; Tiwari, A.K.; Khan, S.; Zhao, X. Impacts of renewable energy on climate risk: A global perspective for energy transition in a climate adaptation framework. Appl. Energy 2024, 362, 122994. [Google Scholar] [CrossRef]
- Robert, A.; Kummert, M. Designing net-zero energy buildings for the future climate, not for the past. Build. Environ. 2012, 55, 150–158. [Google Scholar] [CrossRef]
- Ibrahim, M.; Harkouss, F.; Biwole, P.; Fardoun, F.; Oultboukhtine, S. Building retrofitting towards net zero energy under climate change. J. Phys. Conf. Ser. 2024, 2857, 012026. [Google Scholar] [CrossRef]
- Baniya, B.; Giurco, D. Net zero energy buildings and climate resilience narratives–Navigating the interplay in the building asset maintenance and management. Energy Rep. 2025, 13, 1632–1648. [Google Scholar] [CrossRef]
- U.S. Department of Energy (DOE). DOE Reference Commercial Buildings Report; Prototype Building Model Package. 2020. Available online: https://www.energycodes.gov/development/commercial/prototype_models (accessed on 7 April 2023).
- Jubb, I.; Canadell, P.; Dix, M. Representative Concentration Pathways (RCPs); Australian Government, Department of the Environment: Canberra, Australia, 2013. [Google Scholar]
- Athalye, R.; Halverson, M.; Rosenberg, M.; Liu, B.; Zhang, J.; Hart, R.; Mendon, V.; Goel, S.; Chen, Y.; Xie, Y. Energy Savings Analysis: ANSI/ASHRAE/IES Standard 90.1–2016; Pacific Northwest National Laboratory (PNNL): Richland, WA, USA, 2017. [Google Scholar]
- Meteotest. Meteonorm Software. 2023. Available online: https://meteonorm.com/en/ (accessed on 24 September 2023).
- PortfolioManager. U.S. Energy Use Intensity by Property Type. 2024. Available online: https://portfoliomanager.energystar.gov/pdf/reference/US%20National%20Median%20Table.pdf (accessed on 5 January 2025).
- Escandón, R.; Calama-González, C.M.; Alonso, A.; Suárez, R.; León-Rodríguez, Á.L. How do different methods for generating future weather data affect building performance simulations? A comparative analysis of Southern Europe. Buildings 2023, 13, 2385. [Google Scholar] [CrossRef]
- Pham, M.-H.; Phap, V.M.; Trung, N.N.; Son, T.T.; Kien, D.T.; Anh Tho, V.T. A study on the impact of various meteorological data on the design performance of rooftop solar power projects in vietnam: A case study of electric power university. Energies 2022, 15, 7149. [Google Scholar] [CrossRef]
- Isaac, M.; Van Vuuren, D.P. Modeling global residential sector energy demand for heating and air conditioning in the context of climate change. Energy Policy 2009, 37, 507–521. [Google Scholar] [CrossRef]
- Santamouris, M. On the energy impact of urban heat island and global warming on buildings. Energy Build. 2014, 82, 100–113. [Google Scholar] [CrossRef]
- Brozovsky, J.; Radivojevic, J.; Simonsen, A. Assessing the impact of urban microclimate on building energy demand by coupling CFD and building performance simulation. J. Build. Eng. 2022, 55, 104681. [Google Scholar] [CrossRef]
- Wang, H.; Chen, Q. Impact of climate change heating and cooling energy use in buildings in the United States. Energy Build. 2014, 82, 428–436. [Google Scholar] [CrossRef]
- Choi, J.-H.; Loftness, V.; Aziz, A. Post-occupancy evaluation of 20 office buildings as basis for future IEQ standards and guidelines. Energy Build. 2012, 46, 167–175. [Google Scholar] [CrossRef]
- Santamouris, M.; Ding, L.; Fiorito, F.; Oldfield, P.; Osmond, P.; Paolini, R.; Prasad, D.; Synnefa, A. Passive and active cooling for the outdoor built environment–Analysis and assessment of the cooling potential of mitigation technologies using performance data from 220 large scale projects. Sol. Energy 2017, 154, 14–33. [Google Scholar] [CrossRef]
- Crawley, D.B. Estimating the impacts of climate change and urbanization on building performance. J. Build. Perform. Simul. 2008, 1, 91–115. [Google Scholar] [CrossRef]
- Attia, S.; Evrard, A.; Gratia, E. Development of benchmark models for the Egyptian residential buildings sector. Appl. Energy 2012, 94, 270–284. [Google Scholar] [CrossRef]
- Moradinia, S.F.; Hussein, A.R.; Chan, M.; Bagherifam, N.; Baghalzadeh Shishehgarkhaneh, M. Evaluating the Impact of Phase Change Materials and Double-Skin Façades on Energy Performance in Office Buildings under Climate Change Scenarios: A Case Study in Iran. Eng 2024, 5, 3049–3079. [Google Scholar] [CrossRef]
- Reddy, V.J.; Hariram, N.; Ghazali, M.F.; Kumarasamy, S. Pathway to sustainability: An overview of renewable energy integration in building systems. Sustainability 2024, 16, 638. [Google Scholar] [CrossRef]
- Fajilla, G.; De Simone, M.; Cabeza, L.F.; Bragança, L. Assessment of the impact of occupants’ behavior and climate change on heating and cooling energy needs of buildings. Energies 2020, 13, 6468. [Google Scholar] [CrossRef]
Disclaimer/Publisher’s Note: The statements, opinions and data contained in all publications are solely those of the individual author(s) and contributor(s) and not of MDPI and/or the editor(s). MDPI and/or the editor(s) disclaim responsibility for any injury to people or property resulting from any ideas, methods, instructions or products referred to in the content. |
© 2025 by the authors. Licensee MDPI, Basel, Switzerland. This article is an open access article distributed under the terms and conditions of the Creative Commons Attribution (CC BY) license (https://creativecommons.org/licenses/by/4.0/).