Abstract
Bio-inspirations in the literature of architecture have been studied as form findings and material explorations; however, there is a gap in exploring a method to simplify thermal and daylighting inspiration from nature as assembled building enclosures. This article explores bio-inspired enclosures as a source of innovation for climate adaptations based on their closed-loop systems. We employed a simulation-based methodology to translate bio-inspired geometries into window-to-wall ratios to evaluate building performances. Case studies and their daylight and energy performance results provide a benchmark assessment for the EUI, DA, and DGP. The EUI remains without a significant difference, as it is mainly related to the space volume and technical specifications, while the comparison between the DA among the three groups of studied surfaces indicates the highest DA for minimal surfaces. This article explored energy and daylight outcomes for minimal and tessellated surfaces, in addition to a method of situating natural inspiration in building enclosure designs for a warming climate.
1. Introduction
Natural inspiration and building performance assessments are considered complex research topics, and their results are not readily available to designers. This research explores simplified methods of applying lessons from natural adaptations in building enclosures in an era of climate change to provide designers with analysis outcomes. One of the main features of bio-inspirations discussed in this article is circularity, since envisioning buildings as closed-loop systems could potentially propose adequate responses to climate change. Cheshire (2021) in the literature on circularity in architecture introduces designs for disassembly and designing-out waste [1]. Biomimetic geometries, alternatively, inspire a method to disassemble. For instance, a honeycomb geometry implies a system where waste is minimal and a modular tessellated structure with disassembly possibilities.
Heisel and Cepezed (2022) further explore details of assembly and case studies representing disassembly by defining buildings as Material Banks [2,3]. As a closed-loop system, nature adaptively responds to the climate. It adapts in terms of materials and design; Beyond geometrical features, natural materials complete a closed-loop system at the end of their life. Material Banks describe buildings as material resources for future construction when produced in a way that provides possibilities for disassembly and modularity.
Observing plants, one could argue that material cells recognize their growth patterns, as they are the decision-makers and designers of different organisms. Materials could be the carriers of the growth patterns that define assemblies as systems. For instance, Tschinkel (2021) reviews the architecture of ant nests by casting and sculpting them, representing the intricate assembly of the nests through ants’ path-making [4]. This instinct, additionally, protects them against temperature fluctuations. Such examples point to observing nature as a unified system where decisions and geometries connect and imply adaptive behaviors.
Bio-Inspirations
Bio-inspired geometries and materiality imply investigations into the functions and behaviors of biological species as a system. For instance, the proportion and interconnections of the foliage systems of trees are designed to support the plant’s nutrients while adapting to climate conditions. As a result, in this article, we looked at geometrical features of foliage based on the climate and proposed a method to translate bio-based geometries to WWRs. Pawlyn (2016) addresses biomimicry through creative examples of ways to design more efficient structures based on nature, with a practical guide for architects [5]. This guide describes structures such as shells and domes found in nature or evolved buttress designs similar to tree roots growing in shallow soils. Pawlyn’s research continues by exploring how nature manufactures with a hierarchy, leaving no distinction between materials and structures.
Bio-based studies in architecture range from geometrical standpoints to material innovations, leaving a gap for analytical and comparative explorations. Neri Oxman (2020) in Material Ecology visualizes the synergy between nature and humans through bio-artistic innovations [6]. Abdollahi et al. investigate a methodology to optimize daylight and ventilation by designing kinetic panels, while Khosromanesh reviews bio-material inspirations to develop hydro-actuated facades [7,8]. Additionally, Talaei et al. focus on designing bio-inspired dynamic shading based on the geometry of the Iris flower and stomata pores to optimize daylight and glare performances [9]. This work provides an in-depth abstraction method to design a facade by emphasizing the intersection of bio-inspired architecture and building performance evaluation. Similarly, Sankaewthong et al. tested the Daylight Factor in three different types of facades—a glass panel, a static facade, and a kinetic façade–in a work environment. The results showed better daylight outcomes for the twisting kinetic facade [10].
BioProtopia takes a different approach and reviews self-growing materials and crafting bio-tech materials at micro- and macroscales [11]. Such studies provide a detailed design approach based on biomimicry, while a “comparative” investigation is missing in the daylighting literature. Figure 1 provides an overview of the literature and methodology in this article. The reviewed precedents illustrate valuable design methods in response to climate change, where implementing such methods along with the efficiency of a closed-loop system leads to a responsible decision. The following question concludes this discussion with an open-ended anecdote: How does contemporary architecture and pedagogy address bio-inspired solutions for climate change?

Figure 1.
Overview of the literature and research methodology.
2. Materials and Methods
Natural inspiration in the architecture literature has been studied as form finding and material exploration; however, there is a gap in exploring a method to simplify and compare thermal and daylighting inspiration from nature as assembled building enclosures. This work hypothesizes a proposed method for designers to translate nature into building enclosures’ window-to-wall ratios and provides building performance results employing this methodology. This research is innovative in exploring a natural adaptation translation technique and assessing its building performance outcomes as an optimization benchmark. We focus on the building’s thermal and daylight performances as analysis results; however, one should consider that natural systems integrate different aspects of design, such as assembly, performances, materiality, etc. This study emphasizes the importance of integrating building performance measures through the design decision process.
This article employs both qualitative (observation) and quantitative research methods (simulations) to examine this hypothesis. In phase one, this work focuses on observing different trees based on climate conditions to better understand the thermal and daylight performance of natural adaptations. Phase two of this research proposes a methodology to investigate enclosure designs inspired by nature and translate their characteristics into window-to-wall ratios. Phase three of this work provides enclosure performance assessments for the designer’s analysis and comparison.
2.1. Observations
Designers get inspired by mechanisms in nature, including geometrical properties and cellular structures, applying them at different scales. For instance, one could investigate and compare how different types of trees respond to climate conditions in terms of the foliage (macro) and cellular structure (micro) of the components. Figure 2 explores the thermal behaviors of trees as a closed-loop system based on different temperature conditions in Tallahassee, FL, USA. The images are captured using an FLIR Thermography camera model C3-X (Teledyne FLIR, Wilsonville, OR, USA) with a Thermal Sensitivity < 70 mK. The images capture tree trunks with areas that show warmer spots closer to the center, and the second capture verifies the same observation on a day with higher temperatures. This observation indicated how the density of the tree bark responded to thermal conditions. The next observation explores the geometrical features of different types of tree foliage based on climate conditions as a means of translating natural adaptations into building enclosure indices.
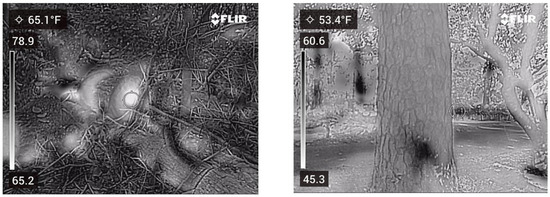
Figure 2.
Thermography images of trees (FLIR Camera).
In this effort to translate the thermal behaviors of tree foliage based on the percentages of openings and shades in different climate conditions, we created abstract drawings of the elevation of specific types of trees. The root system is not presented in these drawings, as further investigation into water absorption and the mechanisms of the soil is needed. Figure 3 illustrates an observation of the density of the foliage as a counterpart to the window-to-wall ratio (WWR) in different climates. This illustration shows an abstraction of the areas of the tree foliage through which light penetrates on a quadrilateral grid, representing window-to-wall ratios. The comparison looks at eastern white pine, live oak, and cacti to categorize their openings based on the prevalent species for cold, hot–humid, and hot–dry climates. This observation also includes the depth of the live oak tree’s shade. The results indicate a WWR = 20% for pine trees in cold climates versus 30% for shaded live oaks in hot–humid climates and 10% for cacti pores in hot and arid climates.

Figure 3.
Exploration of trees as climatic design inspiration.
2.2. Thermal Translation Workflow
The Cove Energy Analysis tool (ASHRAE 140) is utilized to model a sample shoebox building with the same window-to-wall ratios for north- and south-facing conditions inspired by the studied tree typologies [12]. The geometry is designed as an 8000 cu. Ft. box with a wall R-value of 13, a roof R-value of 40, a glazing U-value (heat transfer coefficient) of 0.29, office building type, and schedule of Mon-Fri 8 AM-5 PM. The Energy Plus weather files (.epw) used for climate zones 2 and 6 are Tallahassee and Boston, respectively. The following settings would make it possible to replicate the results:
- Heating Set-Point (F): 70
- Cooling Set-Point (F): 74
- Daylight Sensors: 100%
The following are the building enclosure energy results based on different WWRs, where Energy Use Intensity (EUI) shows the energy usage per square foot per year. This analysis indicates the EUI numerical increase based on the amount of glazing in average hot (climate zone 2) and cold (climate zone 6) conditions (Table 1). The results indicate the highest EUI for the 20% WWR in climate zone 6 and the lowest for the 10% WWR in climate zone 2, using the same settings.

Table 1.
EUI measurements for WWR categorizations in climate zone 2 and 6 based on foliage typologies.
The first phase of this article suggested a methodology to translate the geometrical properties of tree foliage into building enclosure indices. Building on an understanding of this translation method into WWRs, the next phase of this study examines building performance results for case studies of bio-inspired enclosures. The examined enclosure iterations in this study include minimal, auxetic, and tessellated surface modules. Minimal Surfaces are of interest as they create the least area with the lowest energy; such geometries could be observed in soap films. Other bio-inspirations in this article stem from the potential for disassembly and movement behaviors in plants—explored as auxetic and tessellated surfaces. Auxetic surfaces are a representation of adding movement to static inspiration from honeycombs, where materials display expansions and compressions.
Investigating minimal, tessellated, and auxetic surfaces, one sees how they create geometries with a minimum amount of building material waste. Accordingly, the results could be used as a simple method to compare window-to-wall ratios along with a cross-comparison of their impact on daylighting and energy outcomes for designers. The WWRs are calculated based on the geometrical openings of the explored bio-inspired surfaces in this study. The reason for including auxetics is to consider the dynamic mode of WWRs, which could change based on the time of the year to adjust for daylighting. This section will analyze EUI, CO2 emissions, Daylight Autonomy (DA), and Daylight Glare Probability (DGP) analysis of building enclosures inspired by minimal and auxetic surfaces. Since DA measures the annual daylight, and the DGP simulation time is 21 March at 11:00 a.m., the results represent the average daylighting. EUI is calculated using the Cove tool, which does not read the shading geometry but rather the volume and corresponding WWRs.
The first set of designs in this study is focused on minimal surfaces, where, in nature, such surfaces are a result of an equilibrium in tensions between boundaries [13]. A simple experiment to create minimal surfaces in nature is by making soap films. Figure 4 illustrates geometrical drawings for Gyroid, Costa, and Schwarz P surfaces using the Rhino 3D tool, where applying these surfaces to a building enclosure results in 30% window-to-wall ratios (WWRs). This illustration explains how WWRs are calculated based on the visual analysis of the openings that the geometries fabricate.
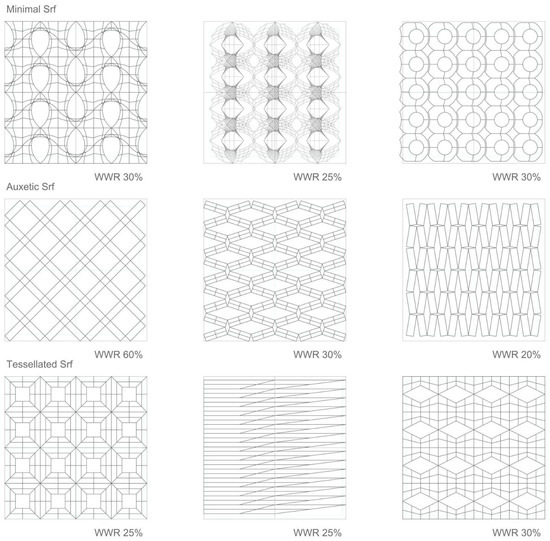
Figure 4.
Minimal, auxetic, and tessellated building enclosures (WWR).
Auxetics is a term that groups the structures with the potential to expand and contract. Sharston et al. conducted an optimization study using an auxetic shading system, which showed an increase in visual comfort and improvement in thermal comfort for occupants in Florida [14]. Auxetics’ ability to adjust provides them with the potential to create different shades, enhancing the potential to mediate temperatures when applied as building enclosures. Beyond auxetics, this article focuses on tessellated enclosures as another innovative inspiration from nature to promote disassembly. For instance, a honeycomb is a well-known example of a tessellated surface with interesting structural interconnections.
This section explores different window-to-wall ratio scenarios for minimal, auxetic, and tessellated enclosure designs. Minimal surfaces explored in this study, Gyroid, Costa, and Schwartz P, represent 30% WWRs. Auxetic building enclosures could respond to different solar needs during the day and change mechanically or chemically in response to environmental factors (i.e., heat or light). Auxetics are explored in this study with a dynamic range of 30% to 60% window-to-wall ratios for auxetic surfaces, where case studies for different minimal and tessellated designs represent 25% WWRs, as they provide a more enclosed spectrum of surfaces. All simulations are performed using the same settings for the south-facing orientation, shading depth, materials, and climate-based daylight modeling with clear sky conditions in Tallahassee, FL, USA. Glass transmittance is set to 0.55 for all simulations, generic floor 20% reflectance, generic wall 50%, and ceiling 80%, using the angular fisheye for the glare view-based analysis.
3. Results
This section of the study evaluates the energy and daylight results of building enclosures inspired by minimal, auxetic, and tessellated surfaces based on their respective WWRs. These surfaces are modeled as south-facing enclosures featuring a three-foot shading depth within an 8000 cu. Ft. box in climate zone 2 (Tallahassee, FL, USA). This study employs the AI-based Cove Energy Modeling tool for the energy analysis and the Honeybee plugin (Ladybug Tools) for daylighting studies; both tools are validated [15,16,17]. The energy modeling of complex geometries attempts to simplify the process by focusing on the window-to-wall ratios. Table 2 summarizes the energy settings using the Cove tool.

Table 2.
Energy modeling settings.
The energy and daylight results assist in realizing optimum WWRs and their corresponding energy and daylight outcomes. The categorization of WWRs for various bio-inspired iterations has implications for EUI optimization, as it generates abstract examples for design decisions. The following results indicate the EUI, the total energy usage, and the CO2 emissions for different window-to-wall ratios. The EUI results indicate a moderate increase between 30% and 60% for window-to-wall ratios, 30–31 kBtu/ft2/yr, using the same settings. The Cove tool results illustrate EUI and carbon emission comparisons, enumerating 1.3 tons per year for the 30% and 45% glazing, respectively (Table 3).

Table 3.
Summary of energy results based on WWR categorization.
In order to have a comparison benchmark, Figure 5 provides DA and DGP results for a simple south-facing opening for a WWR of 40% with a 5 ft. overhang (under the same conditions). The forthcoming comparisons show the difference in the daylight distribution and values throughout the space.

Figure 5.
Base case scenario DA and DGP for 40% WWR with 5 ft. overhang.
Beyond energy outcomes, Figure 6 depicts DA comparison results for optimal minimal, auxetic, and tessellated surface enclosures using the Honeybee tool. The Daylight Autonomy provides the percentage of time that the space meets a target illuminance (Reinhart). The Spatial Daylight Autonomy (sDA [300, 50%]) is a daylight availability metric that corresponds to the percentage of the space that meets the target illuminance of 300 lux values for 50% of the time [18]. The sDA results in this study indicate that minimal surfaces and the tessellations with 30% WWRs meet the 75% target level. Even though the auxetic surfaces with a high WWR were predicted to have a higher glare possibility, their daylight analysis responds to a lower value because of the geometrical density of the shaded opaque elements.
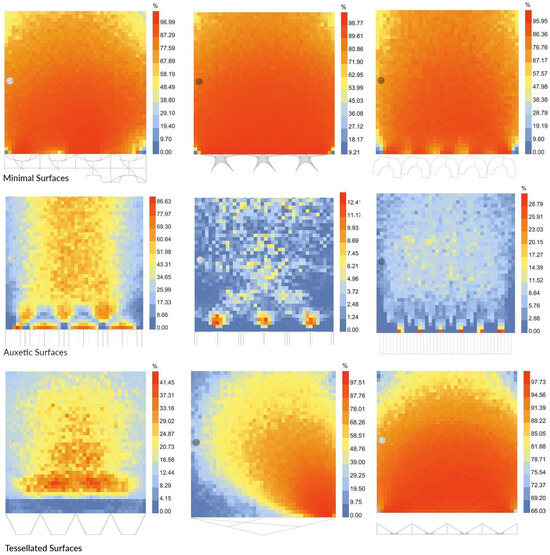
Figure 6.
DA comparison for minimal, auxetic, and tessellated surfaces.
The Daylight Glare Probability (DGP) predicts the probability of an observer experiencing discomfort glares to evaluate visual comfort. Figure 7 illustrates view-based daylighting simulations to investigate the Imperceptible Glare comparison for the minimal and auxetic enclosures for 21 March at 11:00 a.m. (spring equinox). The results capture fish-eye views of the interior for different bio-inspired apertures with different opening ratios. The view is considered free of Imperceptible Glare if the DGP is <35%, free of Perceptible Glare if the DPG is <35% < DGP < 40%, free of Disturbing Glare if 40% < DGP < 45%, and it is considered as having Intolerable Glare if it has a DGP > 45% [19]. The modeled DGP results evaluate all cases free of Imperceptible Glare.
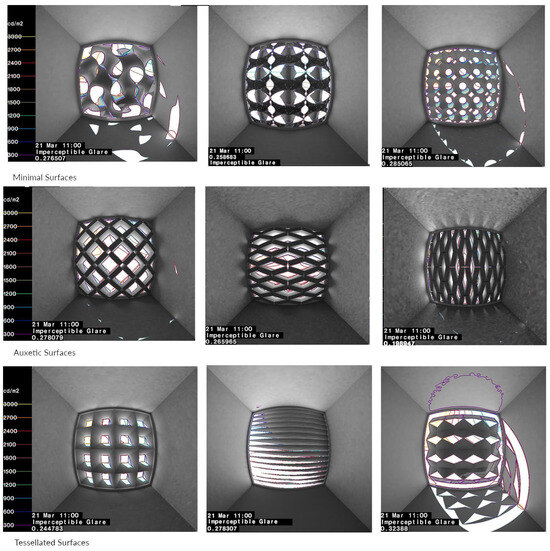
Figure 7.
View-based daylight analysis comparing Imperceptible Glare for minimal and auxetic enclosures with contour lines.
Table 4 summarizes enclosure performance findings, including the average EUI, sDA, and DGP based on the WWR categorization of the surfaces explored in this study. The EUI remains without a significant difference, as it is mainly related to the space volume and the material properties of the building components in a particular climate condition. Based on the energy and daylighting comparisons, it is possible to conclude a 30–40% WWR as an optimized scenario for the studied location in climate zone 2—hot and humid with clear sky conditions. The comparison between the sDA among the three groups of studied surfaces indicates the highest sDA for minimal surfaces. All geometry groups show less than a 35% DGP, indicating visual comfort.

Table 4.
Summary of enclosure performance findings.
The chart in Figure 8 represents the relationship between enclosed surface types and the sDA/DGP, with the highest daylight outcome for minimal surfaces. The findings showed that minimal surfaces provided the most efficient combination of an sDA > 75% and a glare < 35% within the 30% WWR range. This work demonstrated a translation methodology between natural geometries and WWRs as building enclosures. The results, furthermore, provide building performance outcomes and comparisons for designers not to focus on form findings from nature but to search for climate-based translations based on the performance results.
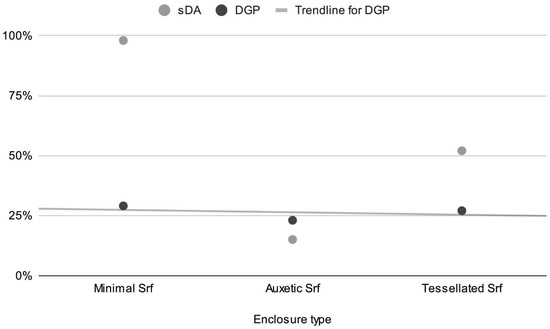
Figure 8.
Comparison of surface types and sDA/DGP (minimal, auxetic, and tessellated surfaces).
4. Discussion
This article reviewed a translation methodology between bio-inspirations and building enclosure performances. Exploring the porosity of the tree foliage corresponding to the hot climate conditions, we translated this feature into an optimized window-to-wall ratio since such geometrical properties imply specific behavioral patterns. The next phase of this article provided a simplified methodology to translate and model energy outcomes of bio-based modules based on the WWR to compare EUI and daylighting metrics. Minimal, auxetic, and tessellated surfaces were investigated in this study. Building performance results for the optimized case studies represented EUI savings and well-lit spaces, particularly for minimal surfaces, based on daylight analysis metrics.
The comparison results for the studied minimal, auxetic, and tessellated surfaces suggested an optimized 30% WWR with an EUI of 30 kBtu/ft2/yr, an sDA of 75% and a DGP < 35%. Meeting 75% sDA provides a well-lit space, and a DGP < 35% assures that the space is without glare. Tessellated and auxetic surfaces could have several variations, where daylighting outcomes vary based on the density of the shades. One of the main interpretations of this study concerns searching for geometrical features in bio-inspiration and looking for comparative results based on different bio-inspired geometries. For instance, in this study, one would question how a simplified shading device provides similar results to a complex minimal surface, since the purpose is not to replicate the geometry.
The daylight outcomes could provide a comparative palette for designers as a benchmark for their early decision-making. Designers’ access to such outcomes and the integration of simplified energy modeling techniques could promote optimized decisions as a practical implication of this study. Energy and daylight modeling require specialty and time, which is not readily available to all designers. Reviewing sets of designs with their daylight performance implications could assist in early design decisions and pursuing LEED (Leadership in Energy and Environmental Design) credits. This study was limited in testing for more algorithmic bio-based models and providing an analysis for existing case studies at the detailed assembly (wall section) scale. Open questions involve evaluating the material settings and daylight outcomes for different shading depths, where sDA results are lower than expected (i.e., in auxetic cases in this article).
Schwartzberg’s documentary “Fantastic Fungi” [20] inspired this study by exploring journeys through scale and an understanding of the connected networks from the perspective of mycologists. This insight represented an understanding of nature as a closed-loop network where materiality, assemblies, and climatic responses intertwine with the design. Creating such geometries with regenerative/disassembled materials results in an ultimate synergy between nature and design. The discussed enclosure types (minimal, auxetic, and tessellated surfaces) support modularity, bio-geometrical investigations, and material reuse, highlighting the connection between circularity and daylight analysis.
The broad impact of this study is to acknowledge nature as a source of innovation beyond geometrical features and materiality; instead, it is a means to explain adaptive solutions as a system. Understanding the geometries, however, provides insights into the underlying infrastructure for behavioral responses. For instance, the energy and daylight outcomes presented in this article contribute as benchmarks for evaluating and optimizing enclosure performances. Designers and the pedagogical discourse, therefore, are to promote finding adaptive solutions for building enclosures as closed-loop systems.
Funding
This research received no external funding.
Institutional Review Board Statement
Not applicable.
Informed Consent Statement
Not applicable.
Data Availability Statement
The author confirms that the data supporting the findings of this study are available within the article.
Acknowledgments
This work is dedicated to Razieh Samie for her everlasting wisdom and support.
Conflicts of Interest
The author declares no conflicts of interest.
Abbreviations
The following abbreviations are used in this manuscript:
| EUI | Energy Use Intensity |
| DA | Daylight Autonomy |
| sDA | spatial Daylight Autonomy |
| DGP | Daylight Glare Probability |
| U-value | Heat Transfer Coefficient |
| WWR | Window-to-Wall Ratio |
References
- Cheshire, D. The Handbook to Building a Circular Economy; RIBA Publishing: London, UK, 2021. [Google Scholar]
- Heisel, F.; Hebel, D.; Webster, K. Building Better-Less-Different: Circular Construction and Circular Economy; Birkhäuser: Basel, Switzerland, 2022. [Google Scholar]
- Cepezed. Removable Courthouse. In DETAIL: Circular Economy; Cepezed: Munich, Germany, 2022; Volume 11, pp. 72–79. [Google Scholar]
- Tschinkel, W. Ant Architecture: The Wonder, Beauty, and Science of Underground Nests; Princeton University Press: Princeton, NJ, USA, 2021. [Google Scholar]
- Pawlyn, M. Biomimicry in Architecture; RIBA Publishing: London, UK, 2016. [Google Scholar]
- Oxman, N. Material Ecology; The Museum of Modern Art: New York, NY, USA, 2020. [Google Scholar]
- Abdollahi Rizi, R.; Sangin, H.; Haghighatnejad Chobari, K.; Eltaweel, A.; Phipps, R. Optimising Daylight and Ventilation Performance: A Building Envelope Design Methodology. Buildings 2023, 13, 2840. [Google Scholar] [CrossRef]
- Khosromanesh, R. Towards Refining Bio-Inspired Hydro-Actuated Building Facades by Emphasising the Importance of Hybrid Adaptability. Sustainability 2024, 16, 959. [Google Scholar] [CrossRef]
- Talaei Kamalabadi, S.; Hosseini, M.; Azmoodeh, M. Integration of bio-inspired adaptive systems for optimizing daylight performance and glare control. J. Build. Eng. 2025, 105, 112415. [Google Scholar] [CrossRef]
- Sankaewthong, S.; Horanont, T.; Miyata, K.; Karnjana, J.; Busayarat, C.; Xie, H. Using a Biomimicry Approach in the Design of a Kinetic Façade to Regulate the Amount of Daylight Entering a Working Space. Buildings 2022, 12, 2089. [Google Scholar] [CrossRef]
- Morrow, R.; Bridgens, B.; Mackenzie, L. BioProtopia: Designing the Built Environment with Living Organisms; Birkhäuser: Basel, Switzerland, 2023. [Google Scholar]
- Cove Tools. Available online: https://cove.tools/ (accessed on 1 August 2024).
- Schoen, A.H. Reflections concerning triply-periodic minimal surfaces. Interface Focus 2012, 2, 658–668. [Google Scholar] [CrossRef] [PubMed]
- Sharston, R.; Shen, J.; Singh, M. Utilization of Auxetic Structures in Advanced Shading Systems to Improve Lighting and Thermal Performance in Florida. In Proceedings of the 18th IBPSA Building Simulation Conference, Shanghai, China, 4–6 September 2023. [Google Scholar]
- Ladybug Tools. Available online: https://www.ladybug.tools/ (accessed on 1 August 2024).
- Radiance Lighting Simulation Tool. Available online: https://www.radiance-online.org/ (accessed on 1 August 2024).
- Kharvari, F. An empirical validation of daylighting tools: Assessing radiance parameters and simulation settings in Ladybug and Honeybee against field measurements. Sol. Energy 2020, 207, 1021–1036. [Google Scholar] [CrossRef]
- Reinhart, C. Daylighting Handbook II; Building Technology Press: Cambridge, MA, UK, 2018. [Google Scholar]
- Jakubiec, A.; Reinhart, C. The ‘adaptive zone’—A concept for assessing discomfort glare throughout daylit spaces. Light. Res. Technol. 2012, 44, 149–170. [Google Scholar] [CrossRef]
- Schwartzberg, L. Fantastic Fungi Documentary; Fantastic Fungi LLC: Fortlauradle, FL, USA, 2019. [Google Scholar]
Disclaimer/Publisher’s Note: The statements, opinions and data contained in all publications are solely those of the individual author(s) and contributor(s) and not of MDPI and/or the editor(s). MDPI and/or the editor(s) disclaim responsibility for any injury to people or property resulting from any ideas, methods, instructions or products referred to in the content. |
© 2025 by the author. Licensee MDPI, Basel, Switzerland. This article is an open access article distributed under the terms and conditions of the Creative Commons Attribution (CC BY) license (https://creativecommons.org/licenses/by/4.0/).