Article

Microplastic Pollution in Headwater Streams and a Small Freshwater Fish

1
Environmental, Geographic, and Public Health Sciences Department, Fitchburg State University, Fitchburg, MA 01420, USA
2
Biology and Chemistry Department, Fitchburg State University, Fitchburg, MA 01420, USA
*
Author to whom correspondence should be addressed.
Microplastics 2026, 5(3), 144; https://doi.org/10.3390/microplastics5030144
Submission received: 27 May 2026 / Revised: 9 July 2026 / Accepted: 14 July 2026 / Published: 18 July 2026
(This article belongs to the Special Issue Microplastics in Freshwater Ecosystems)

Abstract

Microplastic pollution is an increasingly important environmental concern, especially in aquatic ecosystems. However, research on microplastics has historically been skewed towards marine systems and large freshwater systems, leading to an incomplete picture of the potential prevalence and scope of this type of pollution. In order to understand the potentially ubiquitous nature of freshwater microplastics, our study focused on 11 small headwater streams in north–central Massachusetts (USA) and a small freshwater fish species, the Blacknose dace (Rhinichthys atratulus). Microplastics were found in all sampled streams. Considerable variation in the number of stream microplastics existed, with concentrations ranging from 0.3 to 45.1 pieces per cubic meter of water. Microplastics were assessed in 14–20 fish from each of five of these streams. The vast majority of all fish had microplastics, with some individuals having over 200 pieces in their digestive tract. The number of fish microplastics was not found to be statistically related to the amount of water microplastics, the length of the fish, or the land use surrounding the streams. Together, these results illustrate that microplastics are prevalent and that small freshwater ecosystems need to be considered when assessing the full impact this source of pollution may have on ecosystems.

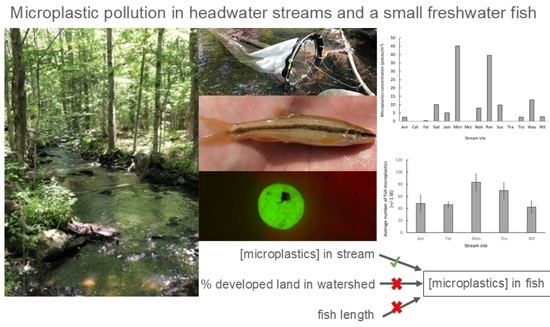
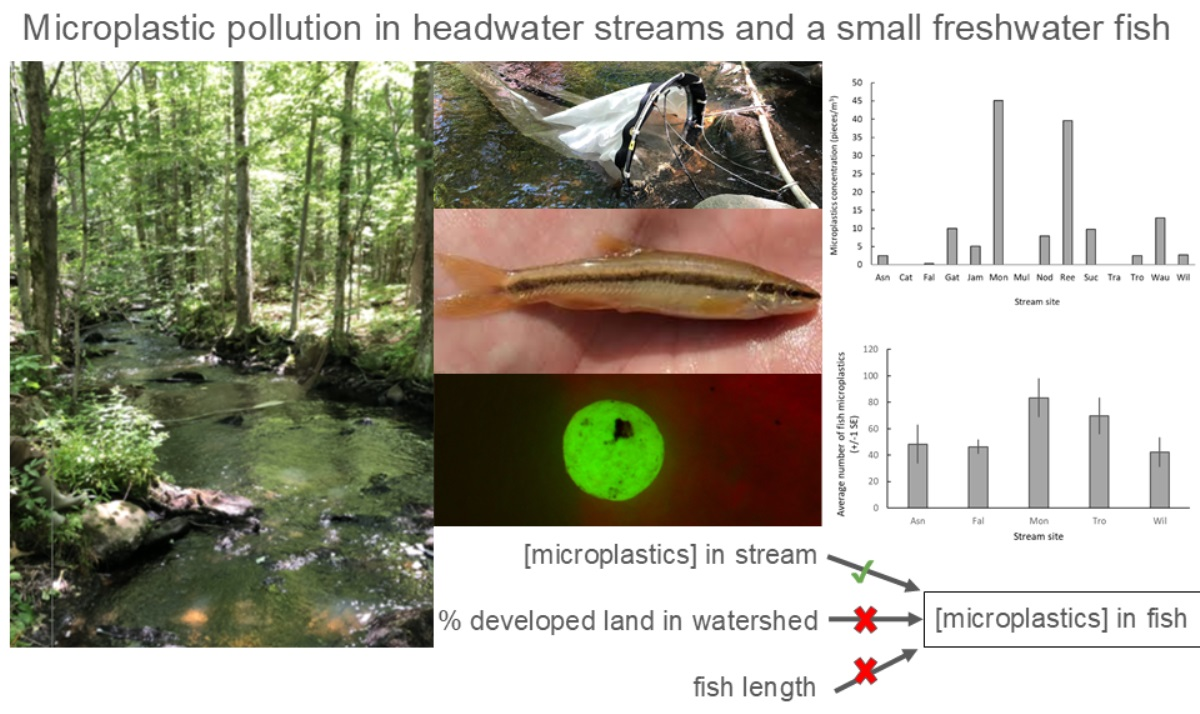
Graphical Abstract

1. Introduction

Plastic contamination of aquatic and terrestrial environments is a growing concern—one that is only expected to get worse [1,2]. According to a report by the Ellen MacArthur Foundation, there is projected to be more plastic in the ocean, by weight, than the biomass of fish by 2050 [3]. Until recently, such reports have mostly focused on large pieces of plastic, sometimes called “macroplastics”. However, growing attention has turned to understanding microplastic pollution due to its reported ubiquity and concerns about human and ecosystem health impacts, e.g., [4,5,6].
Microplastics, defined as plastic particles less than 5 mm in size, have been found on all continents, including Antarctica [7], as well as throughout the entire water column of the ocean [8], and are present in clouds and rainfall [9,10]. They have increasingly become recognized as a major source of plastic contamination in aquatic ecosystems, e.g., [11,12]. Recent studies have demonstrated direct adverse effects on fish, such as neurotoxicity, oxidative stress, and starvation, as well as enhanced toxicity due to adsorption and bioaccumulation of chemical pollutants ([13] and references therein). Initial research on microplastics was focused on the marine environment, while freshwater systems have only received attention in the past one or two decades. (see refs. [14,15] for details about the history of microplastic research). Recent reviews [6,14,16] have noted that our knowledge of the prevalence and impacts of microplastic pollution in freshwater environments is still lacking when compared to knowledge of microplastic pollution in marine environments. Improving our understanding of microplastic pollution in freshwater habitats is therefore essential.
Freshwater systems comprise a diverse array of habitats, from small streams and ponds to larger rivers and lakes, and act as critical habitat for numerous aquatic and terrestrial animals. They also provide important ecosystem services for humans, such as drinking water, crop irrigation, food sources, and recreation. Small freshwater systems, especially headwater streams, are of particular importance, as they are the feeders for larger ponds, lakes, and rivers—and ultimately the ocean. However, as Hu and colleagues [17] note, microplastic pollution of small waterbodies and the organisms that inhabit them is poorly understood.
The abundance of microplastics in a freshwater system may be logically expected to relate to the amount of human development in its watershed, given that plastics derive from anthropogenic activities and enter streams through processes such as stormwater runoff, industrial effluent, and wastewater treatment-plant discharge. Previous studies have reported a relationship between microplastic concentrations in aquatic systems and the human impact on their watersheds, typically characterized in terms of population density, land use, and/or impervious land cover. For example, Yonkos et al. [18] observed higher microplastic concentrations in water samples from Chesapeake Bay (USA) tributaries that had higher population densities and more urban development. Sampling locations from reservoirs along the Colorado River (USA) showed higher abundances of microplastics at sites experiencing a greater human impact [19]. Baldwin et al. [20] reported a positive relationship between microplastic concentration and urban land use in Great Lakes (USA) tributaries, as did de Carvalho et al. [21] in the Garonne River (France). Mabry and Urban-Rich [22] found that sampling locations along the Charles River (USA) categorized as sites of low human impact had lower microplastic abundance compared to medium- and high-impact sites. Freitas et al. [23] observed higher concentrations of microplastics downstream of an urban area compared to samples collected upstream.
Microplastics in freshwater may be ingested by aquatic organisms, including fish, either directly from their habitat (i.e., suspended in the water column or deposited on the benthic habitat) or through trophic interactions (i.e., ingesting prey that contain microplastics). It is currently unknown which is the most common mode of ingestion of microplastics in fish, as research has found fish species obtain microplastics in both ways [24]. There is also mixed evidence as to whether fish that ingest microplastics directly from the water are doing so intentionally, mistaking them for food [25,26], or if they are unintentionally consumed during water ingestion [27]. Theoretical work by Roch and colleagues [25] suggests that ingestion may be affected by which sense (visual versus chemosensory) is most predominantly used during foraging, although even then, accidental uptake may occur.
A number of variables have been reported to influence the amount of microplastics found in freshwater fish, including foraging behavior and the microplastic encounter rate [15], as well as land use within the watersheds of streams they inhabit, e.g., [22,28]. Some studies have observed a relationship between fish length and microplastic abundance [29,30], though not all freshwater species show this pattern [24,31]. Therefore, large research gaps remain, and very small fish in small freshwater streams are particularly understudied. Chen et al. [32] called for an increased focus on small fish, as they are likely to encounter greater microplastic exposure per unit of body mass. As these species are often critical links in the food webs and ecosystems that they are part of, studies that focus on small fish are necessary for a complete understanding of the prevalence of microplastic pollution in aquatic habitats.
The goal of this study was to evaluate the prevalence of microplastic pollution in small freshwater streams and small fish species that inhabit them. We hypothesized that the concentration of microplastics in the water (pieces per m3) and their abundance in fish (pieces per fish) would be positively correlated with developed land use in the watershed. Additionally, we predicted that the abundance of microplastics in fish species would be positively related to the concentration of microplastics in the water, as well as to the size of the fish.

2. Material and Methods

2.1. Study Area and Study Species

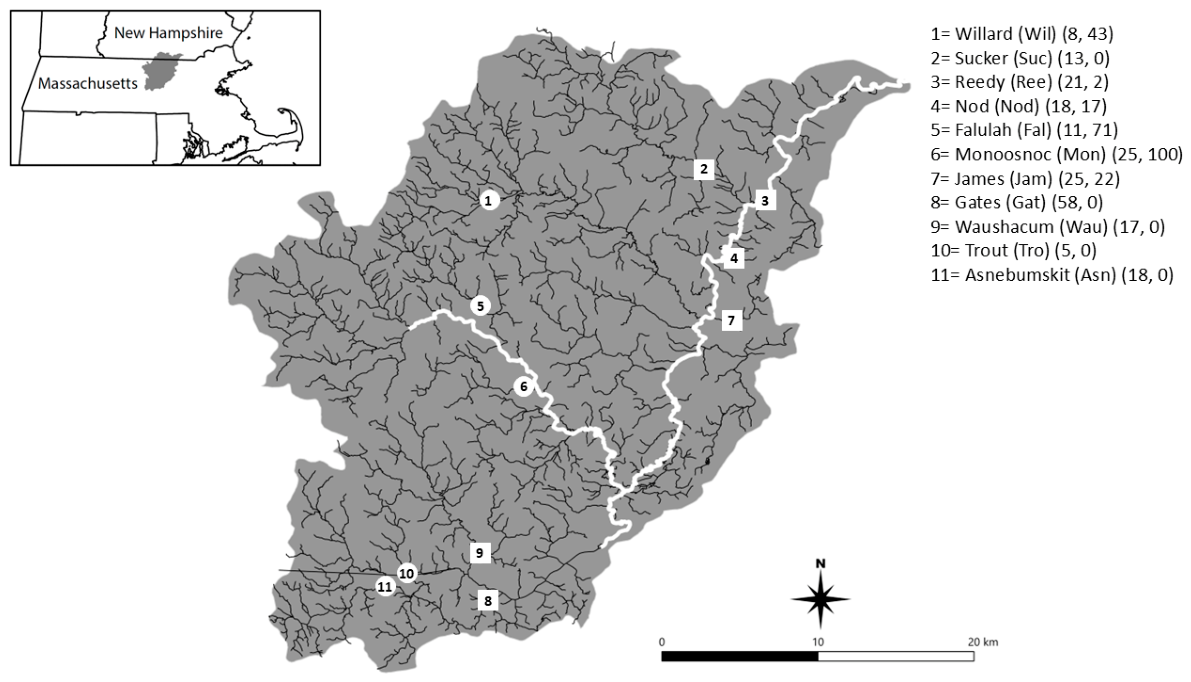
The study area was a single sub-basin, the Nashua River (HUC 8-01070004) in the Gulf of Maine Coastal Plain ecoregion of the Northeastern Coastal Plain. Water samples were collected from eleven headwater streams, and fish samples were collected from five of those streams without prior knowledge of the presence of microplastics (Figure 1; Supplemental Table S1). Water and fish samples were collected contemporaneously in June and July of 2019. Streams were selected to represent a range of developed land use (5 to 60%; ref. [33] provides detailed physical characteristics of these streams), all classified as headwater streams (stream order of three or less [34]). Tributary streams were small (all less than 10 m in width at the location of water and fish sampling) and slow-moving (discharge of less than 2 m3/s at the time of water collection) and surrounded primarily by forest.
A small (often < 4 cm) freshwater species found in flowing water habitats, the Blacknose dace (Rhinichthys atratulus) is a common and abundant fish species in most of eastern North America (see Ref. [35] for details about its distribution and post-glacial colonization). It plays an important ecological role, as it consumes aquatic insects, small crustaceans and plant material and, in turn, is prey for larger organisms (large fish, birds, etc.). Blacknose dace likely consume prey through drift feeding, as well as while foraging along the bottom of their habitat [36,37]. A large-scale study of 22 streams in this watershed found Blacknose dace to make up 61% of over 3700 captured fish [33]. Because of its prevalence and importance as a link in the food web in our watershed, the Blacknose dace is an ideal species to study when developing an understanding of microplastic pollution in these headwater streams.

2.2. Sample Collection

At each sampling site, a 100 m reach was established following Shank et al. [38]. The length of each reach was equal to 10 times the mean wetted width (determined over equally spaced transects), with a minimum reach length of 100 m.
Water was collected once from each of 11 streams (Figure 1) during summer baseflow levels using a 150-micron plankton net with an attached 150-micron catch cup. Each water sample was obtained during a 10–30 min collection interval, and contents from each catch cup were placed into a glass jar. The water was collected at the approximate downstream point of the 100 m stream reach and marked with GPS coordinates at each stream. The water flow velocity at the mouth of the net was measured with a Global Water (Gold River, USA) velocity meter (Flow Probe 211). The cross section of the submerged portion of the net, which varied depending on stream water depth, was calculated at each sampling site and, along with the water velocity and sampling time, used to determine the volume of water flowing through the net. The sampling design represents summer baseflow conditions, ensuring return to baseflow after any precipitation events, and therefore is not used to examine variability in microplastic concentration across different discharge conditions.
Five streams were selected for fish collection based on the known presence of Blacknose dace and to represent a gradient of developed land use. At each stream, an average of 17 fish (range: 14–20) were collected over the course of a 100 m stream reach using protocols approved by Fitchburg State University’s Institutional Animal Care and Use Committee. Fish were collected using a backpack electroshocker unit (Smith-Root (Vancouver, USA) Model LR-24) and dip nets. Once collected, fish were euthanized with an overdose of buffered Tricaine mesylate (AKA MS-222) (MilliporeSigma, St. Louis, USA) and returned to the lab for processing.

2.3. Sample Processing

Samples were analyzed for microplastics following the protocol outlined in Ref. [39], with careful consideration to minimize plastic contamination at each step. Water samples were passed through a 5.0 mm stainless-steel sieve, corresponding to the upper cutoff for microplastics; particulates smaller than 5 mm were baked in an oven in a glass petri dish at a temperature of approximately 85–90 °C for 24 h or until dry. Oxidation of organic materials of the dried particulates was conducted in a fume hood. Twenty mL of 0.05 M Iron Sulfate (FeSO4), a catalyst, was added to the sample in a glass beaker. Hydrogen Peroxide (30%) was added to samples in 20 mL increments every five minutes with continuous stirring. When no visible organic material remained and bubbling had ceased, the sample was heated on a hot plate to 75 °C and maintained at that temperature for 30 min.
Density separation was performed on the oxidized samples after adding salt to achieve a 5 M NaCl solution. Samples were poured into a glass funnel, with clamped rubber tubing attached at the bottom. The funnel was covered with foil, and the sample was allowed to settle overnight. Higher density materials settled to the bottom and were subsequently drained and discarded, while the lower density material containing microplastics was run through a 0.3 mm sieve, corresponding to the lower cutoff for microplastics in this study, and placed in an oven until dry. Microplastics were initially separated from the remaining particulates via visual identification using light microscopy. Nile red staining (see below) was used to identify plastic pieces.
Microplastic concentrations in fish samples were determined from the gastrointestinal (GI) tract. Prior to lab processing, the standard length of each fish was measured to the nearest mm, and the entire gastrointestinal tract was removed by making an incision from the mouth to the anus on each fish. The GI tract was subject to the same drying, oxidation, density separation, and microplastic identification procedure as described for the water samples.
Nile red stain, a lipophilic dye, has been shown to aid in identification of plastic particles and reduce chances of misidentification by fluorescently labeling plastic particles but not organic material [40,41,42]. In our study, a Nile red stock solution was prepared by mixing 10 mg of Nile red powder in 50 mL of acetone. A working solution was prepared by diluting the stock solution using 1.25 mL of Nile red stock solution and mixing it with 48.75 mL of acetone to bring the final solution to a volume of 50 mL. Microplastics were stained with the Nile red working solution using pre-combusted glass fiber filters (GFFs) and vacuum filtration. All glass dishes and capillary tubes were pre-rinsed with acetone. A GFF was placed on a vacuum filtration system with acetone-rinsed tweezers, and the sample containing microplastics was transferred from the vial to the GFF by adding acetone using a 100 µL glass capillary tube. Two hundred µL of Nile red working solution was applied to the filter and allowed to sit for one minute. The filter was then rinsed with acetone until the Nile red was barely visible. The filter was transferred to a clean glass petri dish.
Filters with stained samples were viewed under a Leica MZ10 F fluorescent microscope (Leica Microsystems, Deerfield, USA) using a Green Fluorescent Protein light filter. Nile red stain adheres to plastic particles and allows them to illuminate under a fluorescent microscope, making them distinguishable from undigested/unoxidized organic materials or other non-plastic synthetic material. Particles that fluoresced noticeably more than the background were considered microplastics, and each microplastic particle was counted. Particle counts were completed by one of two observers, whose results were validated on a subset of samples to ensure interobserver consistency. Our study did not distinguish plastic particle shapes, sizes, or chemical compositions.
Control samples were created to account for potential plastic contamination from the ambient environment. The control was made of Nile red solution applied to a clean glass petri dish. One control was made for each day on which water or fish samples were stained. The control sample was observed under the microscope along with the samples stained that same day. Any plastic particles observed in the controls were counted and subtracted from the number of plastic particles counted in the water and fish samples; the difference was reported as the number of particles in the sample. If the difference yielded a negative number (i.e., there were more plastic pieces in the control than the water or fish sample), then that sample was assigned a value of zero plastic pieces (see Supplemental Table S2 for control values).

2.4. Data Analysis

To understand the effects of land cover on microplastic pollution in both water and fish samples, land cover was characterized and analyzed at multiple spatial scales (see Refs. [33,43,44,45,46]). In our study, two nested spatial scales (watershed and local) were used. “Watershed” refers to the land use of the entire watershed upstream of our sampling point. “Local” refers to the land cover as characterized by a 50 m buffer on either side of each stream for the entire length of the 100 m stream reach. Fifty meters was chosen because this was the smallest extent to which land cover could be measured by remote sensing techniques. Although streams were chosen to represent a range of % developed land-use values at the watershed scale, developed land-use values at the local scale do not fall along an evenly distributed continuous gradient (see Supplemental Table S1). Each stream watershed was delineated in StreamStats (Version 4.29.2, U.S. Geological Survey) based on the GPS coordinates of the sampling point, which also corresponded to the downstream point of the reach, using the % developed land use from the 2016 National Land Cover Dataset [47].
Normality tests revealed that our data violated assumptions of normality for both the water (Shapiro-Wilk test, W = 0.686, p < 0.001) and fish (Shapiro-Wilk test, W = 0.790, p < 0.001) samples, which is common with count data (i.e., number of microplastics), which guided further statistical analyses.
For the water data, Spearman’s rank correlations were used to test whether there was a relationship between the % developed land use and the microplastic concentration in the water. Two correlations were performed—one at each of the two spatial scales mentioned above—in order to understand if land use at different spatial scales affects the water microplastic concentration. Spearman’s rank correlation confidence intervals were computed using bootstrapping based on 1000 bootstrap samples. These analyses were performed in SPSS (v.28).
For the fish data, a single generalized linear mixed model with a negative binomial distribution was used to test whether the amount of microplastics in the fish was affected by (i) the number of microplastics in the water, (ii) the percent of developed land use of the stream watershed, (iii) the percent of developed land use local to the stream reach, or (iv) the length of the fish. The negative binomial distribution was used because the data are overdispersed, and all factors were treated as fixed effects in the model, except stream site (which was a random effect). The FishMicroplastics ~ WaterMicroplastics + FishLength + Reach_Percent_Developed + WaterShed_Percent_Developed + (1|Site) model was used. This analysis was conducted in R (v.4.6.1) using the glmmTMB package (v.1.1.15). Due to the small sample size because of the explorational nature of our study, only strong statistical associations are likely to have been detected.

3. Results

3.1. Stream Water Samples

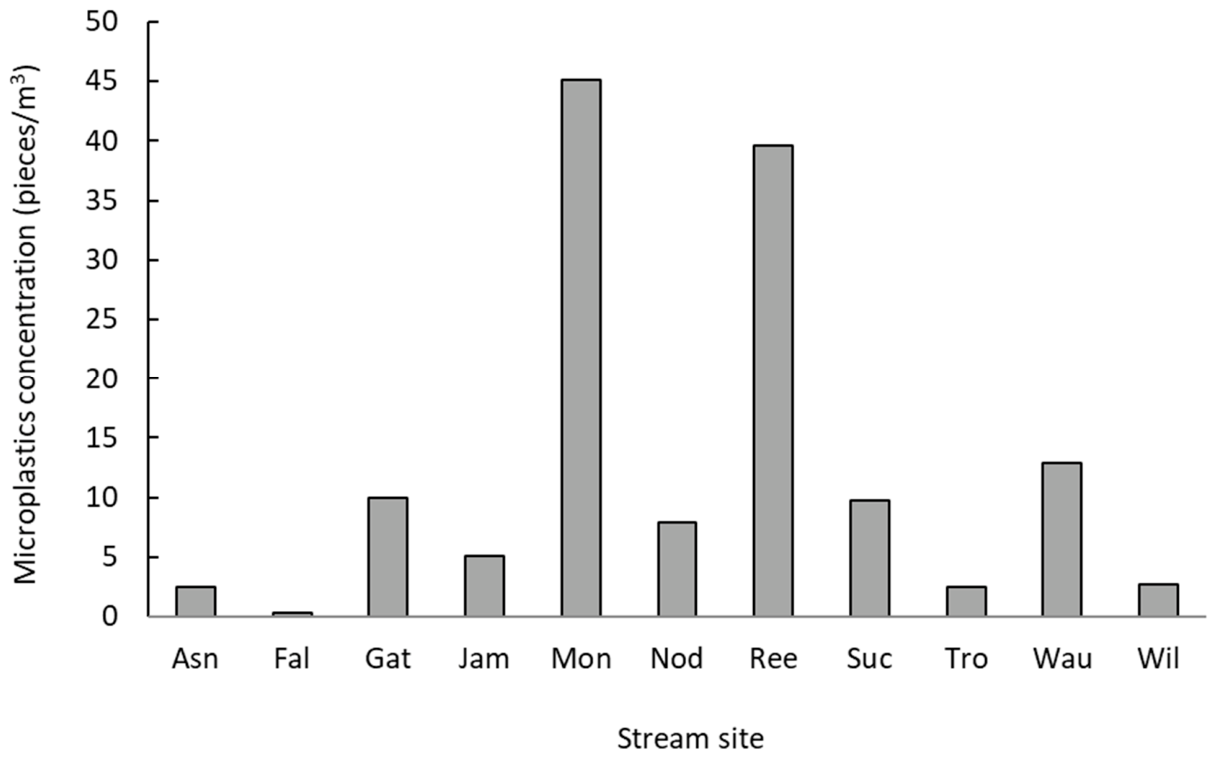
Microplastics were prevalent throughout the watershed—present in all 11 of the sampled streams; microplastic concentrations varied between 0.3 and 45.1 pieces per cubic meter of water (Figure 2). Most of the streams contained fewer than 15 pieces per cubic meter, but two of the streams—Monoosnoc (Mon) and Reedy Meadow (Ree)—had concentrations above 35 pieces per cubic meter.
We examined the relationship between % developed land use and the water microplastic concentration at two spatial scales. At the watershed spatial scale, the relationship between water microplastic concentration and watershed developed land use was positive but did not reach conventional statistical significance (Spearman’s ρ = 0.575, n = 11, p = 0.064; 95% CI = −0.058, 0.878). Similarly, at the smaller spatial scale (the “local” reach level), no statistical relations were found between the % developed land use and the amount of microplastics in the water (Spearman’s ρ = 0.000, n = 11, p = 1.00; 95% CI = −0.613, 0.613).

3.2. Fish Samples

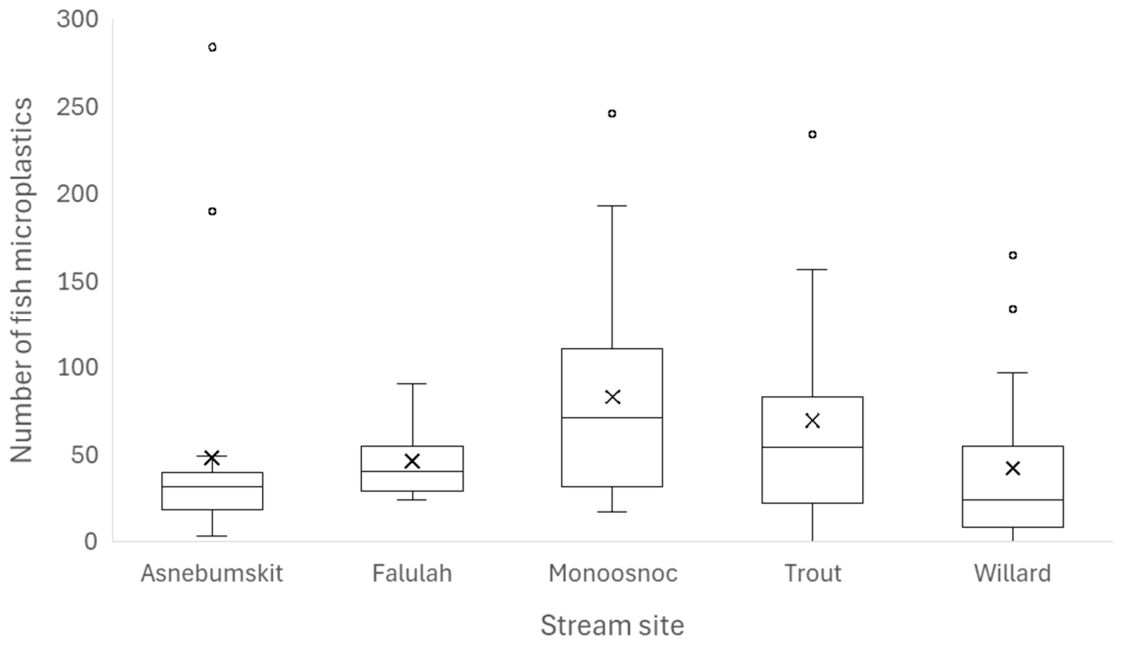
Microplastic pieces were very common in the digestive tracts of fish in the five streams—present in 94% of the 87 sampled fish (Figure 3; Supplemental Table S3). All fish from Asnebumskit (Asn), Falulah (Fal), and Monoosnoc (Mon) contained microplastics, while 94% of the fish from Trout (Tro) and 76% from Willard (Wil) contained microplastics. There was a wide range of microplastic abundance found in the fish from the different sites (Asn: 3–284 pieces per fish; Fal: 24–91; Mon: 17–246; Tro: 0–234; Wil: 0–165). Across the five streams, fish ranged in length from 4.5 to 7.8 cm.
The amount of microplastics in fish was not affected by the amount in the water, the length of the fish, or the % developed land use at either spatial scale (all p > 0.05) (Supplemental Table S4 and Supplemental Figure S1).

4. Discussion

Our results add to the growing body of literature demonstrating that microplastic pollution is pervasive in the environment. Overall, we found that all investigated small headwater streams contained microplastics in the water, and microplastics were found in the digestive tract of a small fish species that inhabits these streams. However, we found no statistical relationship between the amount of microplastics in the fish and in the water. Additionally, we found that the developed land use surrounding the streams did not have a statistically significant impact on the amount of microplastics in the water or fish, nor did fish size influence the amount of microplastics found in the fish.
While microplastics were common in this watershed, there was variability between streams. With the exception of Monoosnoc and Reedy Meadow, sampled streams had fewer than fifteen pieces per cubic meter of water. The observed range is similar to values measured in tributaries of the Great Lakes (USA) (0.05 to 32 pieces per cubic meter [20]) but lower than that reported in the Charles River basin, Boston, MA [22], and several other freshwater systems (see Ref. [6] for a recent review). As the streams investigated in the present study are headwater streams, lower levels may be expected. Larger streams and rivers are likely to have more microplastics, as they are fed by smaller streams and headwater streams. Although differences in sampling methodologies can impede direct comparison of microplastic abundance, our research shows that even small streams that may be perceived to be pristine are not immune from microplastic pollution. It is currently unknown whether such low amounts are biologically meaningful, and future research should utilize such small streams to develop a more holistic understanding of the prevalence and impact of microplastics on the natural world.
Our study found that there was not a statistically significant relationship between the microplastic concentration in stream samples and the percent of developed land use in the respective watershed. Although initially an unexpected result, other studies have similarly reported a lack of a relationship between developed land use and microplastic concentration. Pol et al. [48] compared microplastic concentrations in rivers flowing through two different cities in Poland and found similar concentrations despite differences in urban characteristics. While Mabry and Urban-Rich [22] observed lower microplastic concentrations in sections of the Charles River with lower human impact, they did note that this relationship varied seasonally, suggesting that hydrological conditions are also important in driving microplastic concentrations. In a study focused on the Garonne River, de Carvalho et al. [21] concluded that both urban land use and hydrological conditions are important in controlling microplastic abundance. Given that our samples were collected under baseflow conditions, we were not able to assess the influence of stream discharge on microplastic concentrations. Additional research conducted under different hydrological conditions may help elucidate the relative importance of land use and discharge, among other factors, in these headwater streams.
Like our water samples, microplastics were also common in the digestive tract of the Blacknose dace in this watershed, with the majority of fish containing dozens of pieces of microplastics. The average abundance of microplastics in the fish from our study (42–83 pieces per fish) is similar to values reported by Tuzzio et al. [28] in Appalachian streams (USA) but lower than that observed in Lake Mead [19]. Tuzzio and colleagues [28] also found a similarly large range of microplastics (8–274 pieces per fish) in their study species. A recent review of marine and freshwater environments in North America by Wootton and colleagues [49] reported a mean of ~15 pieces per fish. As these and other prior studies have typically utilized species larger than Blacknose dace, our results demonstrate that small fish species are encountering and ingesting microplastic pollution.
Microplastic abundance in fish was not indicative of stream microplastic concentration in our study. Sainio and colleagues [50] similarly found no relationship between amounts in the water and amounts in four small marine fish species. McNeish et al. [24] determined that microplastic concentration in the water was not a good predictor of concentration in the fish in tributaries of Lake Michigan. In contrast, Park et al. [51] found a positive relationship between the amount of microplastics in fish and the amount in water in Tachon stream, one of the main tributaries of the Han River in Korea. Similarly, analysis of gut contents of a coastal freshwater fish in an Argentinian estuary revealed that the number of microplastics was significantly higher close to sewage discharge, suggesting the amount of microplastics in the aquatic habitat is a driver of the amount in fish [52]. These conflicting results could be due to environmental factors or methodological differences. For example, similar to water microplastics, seasonal variation has also been suggested to be important in microplastic concentrations in fish [53]. Foraging behavior may also play a role: Blacknose dace consume a large portion of their food from the benthic environment [36,37], and there is some evidence that fish occupying these habitats have greater microplastic abundances compared to their pelagic counterparts (e.g., [24]; see also [15] for a review). However, Güven et al. [54] found more microplastics in pelagic species. One possible explanation may be related to the variation of microplastic abundance throughout the water column. For example, Liedermann et al. [55], studying the Danube River, reported higher concentrations of microplastics at surface and mid-level depths in the water column compared to the deepest waters. While the results of our study contribute to the broader understanding of microplastics in aquatic systems and start to address gaps in our knowledge of small streams and small fish species, it is clear that additional studies are needed to decipher factors that influence the uptake of microplastics by fish in these habitats.
We found that the size of the fish in our study was not related to the microplastic abundance in their digestive tracts. In a large 27-species study of the Nandu River, China, Chen and colleagues [32] also found no relationship between microplastic abundance and fish size. However, size does seem to be important in other studies conducted in both marine and freshwater. For instance, fish size was positively related to microplastic abundance in hardhead catfish (Ariopsis felis) and southern flounder (Paralichthys lethostigma) [56], and a study by Tuzzio et al. [28] showed a positive relationship between fish length and microplastic abundance in northern hogsucker (Hypentelium nigricans) in Appalachian streams. As most of these previous studies examined larger fish, additional research should focus on smaller fish, particularly from freshwater systems and headwater streams.

5. Conclusions

Microplastics were found to be common in the investigated small, headwater freshwater streams and the Blacknose dace that inhabit them. There was no clear statistical relationship between the surrounding developed land cover and the amount of microplastics in the water and the fish. As small freshwater streams and their inhabitants are a severely understudied piece of the larger microplastic pollution puzzle, our findings represent an important first step in developing a holistic understanding of this environmental concern. Elucidation of the factors that drive microplastic abundance in aquatic systems is complex. Future studies that focus on additional small streams and their inhabitants would add to our findings and help assess whether our results are representative of all smaller freshwater streams and small fish species. Additional studies using multiple sampling time points would help evaluate the impacts of hydrological conditions and seasonal variation on microplastic abundance, and characterization of microplastic morphology and chemical composition would help elucidate sources. Finally, examining species that have different feeding regimes may increase our understanding of the importance of foraging modes and their relationship with microplastic pollution in these aquatic ecosystems.

Supplementary Materials

The following supporting information can be downloaded at: https://www.mdpi.com/article/10.3390/microplastics5030144/s1, Figure S1: Scatterplots of water microplastics and developed land use. Table S1: Sampled streams and GPS coordinates of downstream sampling locations. Table S2: Details about controls in water and fish. Table S3: Descriptive statistics for fish. Table S4: Results from mixed-effects analysis of fish microplastics.

Author Contributions

E.S.G. and D.P.W. designed the study, collected samples, supervised laboratory analyses, and wrote the manuscript; D.P.W. performed statistical analysis; M.H.A. and N.E.B. collected water samples, conducted initial microplastic identification from water and fish samples, and contributed to writing of the Section 2; K.E.P. and P.T. performed Nile red analysis to confirm plastic identification and contributed to writing of the Section 2. All authors edited the final draft of the manuscript. All authors have read and agreed to the published version of the manuscript.

Funding

Funding for this project came from The Lloyd G. Balfour Foundation; Bank of America; N.A., Trustee; the Community Foundation of North Central Massachusetts; the Avantor Sciences Foundation; and Fitchburg State University.

Institutional Review Board Statement

Not applicable.

Data Availability Statement

The data presented in this study are available upon request from the corresponding author due to legal requirements of funding sources.

Acknowledgments

Elyse Clark, Emma Downs, John Ludlam, and three anonymous reviewers provided feedback on the manuscript. Jessie Oehrlein and John Ludlam provided invaluable help with statistical analysis. John Ludlam and Hannah Wilder shared the Nile red procedure. John Ludlam helped with the map used in Figure 1. Sam Richard provided assistance with lab methodology. Erica Ulrich, Luke Perron, and Wade Williams assisted with fish collection. Numerous landowners granted permission to access stream sites, including the Department of Conservation and Recreation and the cities and towns of Ashburnham, Ashby, Fitchburg, Groton, Holden, Lancaster, Leominster, Lunenburg, Pepperell, Shirley, West Boylston, and Westminster. This study was approved by the Institutional Animal Care and Use Committee (IACUC) at Fitchburg State University (protocol IACUC#2019-Welsh-1R).

Conflicts of Interest

The authors declare no conflicts of interest.

References

  1. Kaza, S.; Yao, L.C.; Bhada-Tata, P.; Van Woerden, F. What a Waste 2.0: A Global Snapshot of Solid Waste Management to 2050; Urban Development; World Bank: Washington, DC, USA, 2018. [Google Scholar]
  2. Borrelle, S.B.; Ringma, J.; Law, K.L.; Monnahan, C.C.; Lebreton, L.; McGivern, A.; Murphy, E.; Jambeck, J.; Leonard, G.H.; Hilleary, M.A.; et al. Predicted growth in plastic waste exceeds efforts to mitigate plastic pollution. Science 2020, 369, 1515–1518. [Google Scholar] [CrossRef] [Scilit] [PubMed]
  3. World Economic Forum. The New Plastics Economy: Rethinking the Future of Plastics; Ellen MacArthur Foundation: Cowes, UK; McKinsey & Company: New York, NY, USA, 2016. [Google Scholar]
  4. Thompson, R.C.; Olsen, Y.; Mitchell, R.P.; Davis, A.; Rowland, S.J.; John, A.W.G.; McGonigle, D.; Russell, A.E. Lost at Sea: Where Is All the Plastic? Science 2004, 304, 838. [Google Scholar] [CrossRef] [Scilit] [PubMed]
  5. Li, Y.; Tao, L.; Wang, Q.; Wang, F.; Li, G.; Song, M. Potential Health Impact of Microplastics: A Review of Environmental Distribution, Human Exposure, and Toxic Effects. Environ. Health 2023, 1, 249–257. [Google Scholar] [CrossRef] [Scilit]
  6. Bhardwaj, L.K.; Rath, P.; Yadav, P.; Gupta, U. Microplastic contamination, an emerging threat to the freshwater environment: A systematic review. Environ. Syst. Res. 2024, 13, 8. [Google Scholar] [CrossRef] [Scilit]
  7. Jones-Williams, K.; Rowlands, E.; Primpke, S.; Galloway, T.; Cole, M.; Waluda, C.; Manno, C. Microplastics in Antarctica—A plastic legacy in the Antarctic snow? Sci. Total Environ. 2025, 966, 178543. [Google Scholar] [CrossRef] [Scilit] [PubMed]
  8. Zhao, S.; Kvale, K.F.; Zhu, L.; Zettler, E.R.; Egger, M.; Mincer, T.J.; Amaral-Zettler, L.A.; Lebreton, L.; Niemann, H.; Nakajima, R.; et al. The distribution of subsurface microplastics in the ocean. Nature 2025, 641, 51–61. [Google Scholar] [CrossRef] [Scilit] [PubMed]
  9. Trainic, M.; Flores, J.M.; Pinkas, I.; Pedrotti, M.L.; Lombard, F.; Bourdin, G.; Gorsky, G.; Boss, E.; Rudich, Y.; Vardi, A.; et al. Airborne microplastic particles detected in the remote marine atmosphere. Comm. Earth Environ. 2020, 1, 64. [Google Scholar] [CrossRef] [Scilit]
  10. Abbasi, S. Microplastics washout from the atmosphere during a monsoon rain event. J. Haz. Mat. Adv. 2021, 4, 100035. [Google Scholar] [CrossRef] [Scilit]
  11. Law, K.L.; Thompson, R.C. Microplastics in the seas. Science 2014, 345, 144–145. [Google Scholar] [CrossRef] [Scilit] [PubMed]
  12. Jin, X.; Li, Z.; Peñuelas, J.; Sardan, J.; Wu, Q.; Peng, Y.; Heděnec, P.; Li, Z.; Yuan, C.; Yuan, J.; et al. Quantitative assessment on the distribution patterns of microplastics in global inland waters. Commun. Earth Environ. 2025, 6, 331. [Google Scholar] [CrossRef] [Scilit]
  13. Witczak, A.; Przedpełska, L.; Pokorska-Niewiada, K.; Cybulski, J. Microplastics as a Threat to Aquatic Ecosystems and Human Health. Toxics 2024, 12, 571. [Google Scholar] [CrossRef] [Scilit] [PubMed]
  14. Li, C.; Busquets, R.; Campos, L.C. Assessment of microplastics in freshwater systems: A review. Sci. Total Environ. 2020, 707, 135578. [Google Scholar] [CrossRef] [Scilit] [PubMed]
  15. Parker, B.; Andreou, D.; Green, I.D.; Britton, J.R. Microplastics in freshwater fishes: Occurrence, impacts, and future perspectives. Fish Fish. 2021, 22, 467–488. [Google Scholar] [CrossRef] [Scilit]
  16. Galafassi, S.; Campanale, C.; Massarelli, C.; Uricchio, V.F.; Volta, P. Do Freshwater Fish Eat Microplastics? A Review with A Focus on Effects on Fish Health and Predictive Traits of MPs Ingestion. Water 2021, 13, 2214. [Google Scholar] [CrossRef] [Scilit]
  17. Hu, L.; He, D.; Shi, H. Microplastics in Inland Small Waterbodies in Microplastics. In Terrestrial Environments; He, D., Luo, Y., Eds.; Springer: Cham, Switzerland, 2020; pp. 93–110. [Google Scholar]
  18. Yonkos, L.T.; Friedel, E.A.; Perez-Reyes, A.C.; Ghosal, S.; Arthur, C.D. Microplastics in Four Estuarine Rivers in the Chesapeake Bay, U.S.A. Environ. Sci. Technol. 2014, 48, 14195–14202. [Google Scholar] [CrossRef] [Scilit] [PubMed]
  19. Baldwin, A.K.; Spanjer, A.R.; Rosen, M.R.; Thom, T. Microplastics in Lake Mead National Recreation Area, USA: Occurrence and biological uptake. PLoS ONE 2020, 15, e0228896. [Google Scholar] [CrossRef] [Scilit] [PubMed]
  20. Baldwin, A.K.; Corsi, S.R.; Mason, S.A. Plastic Debris in 29 Great Lakes Tributaries: Relations to Watershed Attributes and Hydrology. Environ. Sci. Technol. 2016, 50, 10377–10385. [Google Scholar] [CrossRef] [Scilit] [PubMed]
  21. de Carvalho, A.R.; Garcia, F.; Riem-Galliano, L.; Tudesque, L.; Albignac, M.; Halle, A.T.; Cucherousset, J. Urbanization and hydrological conditions drive the,.patial and temporal variability of microplastic pollution in the Garonne River. Sci. Total Environ. 2021, 769, 144479. [Google Scholar] [CrossRef] [Scilit] [PubMed]
  22. Mabry, L.; Urban-Rich, J. Seasonal and Distributional Changes in the Composition and Flux of Anthropogenic Microparticles in the Surface Waters of the Charles River, Massachusetts, United States. Microplastics 2024, 3, 539–558. [Google Scholar] [CrossRef] [Scilit]
  23. Freitas, P.G.V.; Oliveira, A.C.d.P.; Mayrink, L.F.; Coimbra, E.C.L.; Guimarães, L.d.M.; Mounteer, A.H. Influence of Urbanization and Seasonality on Microplastics in a Small Brazilian Inland Stream. Microplastics 2025, 4, 86. [Google Scholar] [CrossRef] [Scilit]
  24. McNeish, R.E.; Kim, L.H.; Barrett, H.A.; Mason, S.A.; Kelly, J.J.; Hoellein, T.J. Microplastic in riverine fish is connected to species traits. Sci. Rep. 2018, 8, 11639. [Google Scholar] [CrossRef] [Scilit] [PubMed]
  25. Roch, S.; Friedrich, C.; Brinker, A. Uptake routes of microplastics in fishes: Practical and theoretical approaches to test existing theories. Sci. Rep. 2020, 10, 3896. [Google Scholar] [CrossRef] [Scilit] [PubMed]
  26. Yagi, M.; Ono, Y.; Kawaguchi, T. Microplastic pollution in aquatic environments may facilitate misfeeding by fish. Environ. Poll. 2022, 315, 120457. [Google Scholar] [CrossRef] [Scilit]
  27. Li, B.; Liang, W.; Liu, Q.-X.; Fu, S.; Ma, C.; Chen, Q.; Su, L.; Craig, N.J.; Shi, H. Fish ingest microplastics unintentionally. Environ. Sci. Technol. 2021, 55, 10471–10479. [Google Scholar] [CrossRef] [Scilit] [PubMed]
  28. Tuzzio, I.M.; Murry, B.A.; Arantes, C.C. Widespread Microplastic Pollution in Central Appalachian Streams: Implications for Freshwater Ecosystem Sustainability. Sustainability 2025, 17, 2926. [Google Scholar] [CrossRef] [Scilit]
  29. Horton, A.A.; Jürgens, M.D.; Lahive, E.; van Bodegom, P.M.; Vijver, M.G. The influence of exposure and physiology on microplastic ingestion by the freshwater fish Rutilus rutilus (roach) in the River Thames, UK. Environ. Poll. 2018, 236, 188–194. [Google Scholar] [CrossRef] [Scilit]
  30. Buwono, N.R.; Risjani, Y.; Soegianto, A. Spatio-temporal patterns of occurrence of microplastics in the freshwater fish Gambusia affinis from the Brantas River, Indonesia. Environ. Poll. 2022, 311, 119958. [Google Scholar] [CrossRef] [Scilit]
  31. Kankılıç, G.B.; Koraltan, I.; Erkmen, B.; Çağan, A.S.; Çırak, T.; Özen, M.; Seyfe, M.; Altındağ, A.; Tavşanoğlu, Ü.N. Size-selective microplastic uptake by freshwater organisms: Fish, mussel, and zooplankton. Environ. Poll. 2023, 336, 122445. [Google Scholar] [CrossRef] [Scilit]
  32. Chen, Y.; Shen, Z.; Li, G.; Wang, K.; Cai, X.; Xiong, X.; Wu, C. Factors affecting microplastic accumulation by wild fish: A case study in the Nandu River, South China. Sci. Total Environ. 2022, 847, 157486. [Google Scholar] [CrossRef] [Scilit] [PubMed]
  33. Welsh, D.P.; Ludlam, J.P.; Downs, E.L.; Gordon, E.S.; Clark, E.V.; Levy, B.; Huang, J.; O’cOnnor, A.M. Stream fish community structure across an urban gradient in a northeastern US watershed. Environ. Biol. Fishes 2023, 106, 1579–1595. [Google Scholar] [CrossRef] [Scilit]
  34. Strahler, A.N. Hypsometric (area-altitude) analysis of erosional topology. Geol. Soc. Am. Bull. 1952, 63, 1117–1142. [Google Scholar] [CrossRef] [Scilit]
  35. Tipton, M.L.; Gignoux-Wolfsohn, S.; Stonebraker, P.; Chernoff, B. Postglacial recolonization of eastern Blacknose Dace, Rhinichthys atratulus (Teleostei: Cyprinidae), through the gateway of New England. Ecol. Evol. 2011, 1, 343–358. [Google Scholar] [CrossRef] [Scilit] [PubMed]
  36. Rollwagen, J.; Stainken, D. Ectoparasites and Feeding Behavior of the Blacknose Dace, Rhinichthys atratulus (Cyprinidae: Cypriniformes) Hermann. Am. Midl. Nat. 1980, 103, 185–190. [Google Scholar] [CrossRef] [Scilit]
  37. Johnson, J.H.; Johnson, E.Z. Diel foraging in relation to available prey in an Adirondack Mountain stream fish community. Hydrobiologia 1982, 96, 97–104. [Google Scholar] [CrossRef] [Scilit]
  38. Shank, M.K.; Henning, A.M.; Leakey, A.S. Examination of a single-unit, multiple-pass electrofishing protocol to reliably estimate fish assemblage composition in wadeable streams of the Mid-Atlantic Region of the USA. N. Am. J. Fish. Manag. 2016, 36, 497–505. [Google Scholar] [CrossRef] [Scilit]
  39. Masura, J.; Baker, J.; Foster, G.; Arthur, C. Laboratory Methods for the Analysis of Microplastics in the Marine Environment: Recommendations for Quantifying Synthetic Particles in Waters and Sediments; NOAA Technical Memorandum NOS-OR&R-48; NOAA Marine Debris Division: Silver Spring, MD, USA, 2015.
  40. Erni-Cassola, G.; Gibson, M.I.; Thompson, R.C.; Christie-Oleza, J.A. Lost, but found with Nile red: A novel method for detecting and quantifying small microplastics (1 mm to 20 μm) in environmental samples. Environ. Sci. Technol. 2017, 51, 13641–13648. [Google Scholar] [CrossRef] [Scilit] [PubMed]
  41. Maes, T.; Jessop, R.; Wellner, N.; Haupt, K.; Mayes, A.G. A rapid-screening approach to detect and quantify microplastics based on fluorescent tagging with Nile Red. Sci. Rep. 2017, 7, 44501. [Google Scholar] [CrossRef] [Scilit] [PubMed]
  42. Ho, D.; Liu, S.; Wei, H.; Karthikeyan, K.G. The glowing potential of Nile red for microplastics Identification: Science and mechanism of fluorescence staining. Microchem. J. 2024, 197, 109708. [Google Scholar] [CrossRef] [Scilit]
  43. Wang, L.; Lyons, J.; Kanehl, P.; Bannerman, R. Impacts of urbanization on stream habitat and fish across multiple spatial scales. Environ. Manag. 2001, 28, 255–266. [Google Scholar] [CrossRef] [Scilit]
  44. Rowe, D.C.; Pierce, C.L.; Wilton, T.F. Physical habitat and fish assemblage relationships with landscape variables at multiple spatial scales in wadeable Iowa streams. N. Am. J. Fish. Manag. 2009, 29, 1333–1351. [Google Scholar] [CrossRef] [Scilit]
  45. Stephenson, J.M.; Morin, A. Covariation of stream community structure and biomass of algae, invertebrates and fish with forest cover at multiple spatial scales. Freshw. Biol. 2009, 54, 2139–2154. [Google Scholar] [CrossRef] [Scilit]
  46. Ludlam, J.P.; Welsh, D.P.; Clark, E.V.; Downs, E.L.; Gordon, E.S.; Huang, J.X.; Levy, B.; O’COnnor, A.M. Assessing Taxonomic and Functional Responses of Stream Macroinvertebrate Communities to Multi-Scale Influences of Urban Land Cover. River Res. Appl. 2025, 41, 2297–2308. [Google Scholar] [CrossRef] [Scilit]
  47. Dewitz, J. National Land Cover Database (NLCD) 2016 Products (ver. 3.0, November 2023): U.S. Geological Survey Data Release; USGA: Liberty Corner, NJ, USA. [CrossRef] [Scilit]
  48. Pol, W.; Zmijewska, A.; Stasinska, E.; Piotr Zielinski, P. Spatial-Temporal Distribution of Microplastics in Lowland Rivers Flowing Through Two Cities (Ne Poland). Water Air Soil Pollut. 2022, 233, 140. [Google Scholar] [CrossRef] [Scilit]
  49. Wootton, N.; Reis-Santos, P.; Gillanders, B.M. Microplastic in fish—A global synthesis. Rev. Fish. Biol. Fish. 2021, 31, 753–771. [Google Scholar] [CrossRef] [Scilit]
  50. Sainio, E.; Lehtiniemi, M.; Setälä, O. Microplastic ingestion by small coastal fish in the northern Baltic Sea, Finland. Mar. Poll. Bull. 2021, 172, 112814. [Google Scholar] [CrossRef] [Scilit]
  51. Park, T.-J.; Lee, S.-H.; Lee, M.-S.; Lee, J.-K.; Park, J.-H.; Zoh, K.-D. Distributions of microplastics in surface water, fish, and sediment in the vicinity of a sewage treatment plant. Water 2020, 12, 3333. [Google Scholar] [CrossRef] [Scilit]
  52. Pazos, R.S.; Maiztegui, T.; Colautti, D.C.; Paracampo, A.H.; Gómez, N. Microplastics in gut contents of coastal freshwater fish from Río de la Plata estuary. Mar. Poll. Bull. 2017, 122, 85–90. [Google Scholar] [CrossRef] [Scilit]
  53. Dantas, D.V.; Barletta, M.; da Costa, M.F. The seasonal and spatial patterns of ingestion of polyfilament nylon fragments by estuarine drums (Sciaenidae). Environ. Sci. Pollut. Res. 2012, 19, 600–606. [Google Scholar]
  54. Güven, O.; Gokda, K.; Jovanovi, B.; Kideys, A.E. Microplastic litter composition of the Turkish territorial waters of the Mediterranean Sea, and its occurrence in the gastrointestinal tract of fish. Environ. Poll. 2017, 223, 286–294. [Google Scholar] [CrossRef] [Scilit]
  55. Liedermann, M.; Gmeiner, P.; Pessenlehner, S.; Haimann, M.; Hohenblum, P.; Habersack, H. A Methodology for Measuring Microplastic Transport in Large or Medium Rivers. Water 2018, 10, 414. [Google Scholar] [CrossRef] [Scilit]
  56. Gad, A.K.; Midway, S.R. Relationship of microplastics to body size for two estuarine fishes. Microplastics 2022, 1, 211–220. [Google Scholar] [CrossRef] [Scilit]
Figure 1. Nashua River sub-basin. The mainstem of the Nashua River, outlined in white, flows towards the northeast within the basin. Squares indicate sites on tributary headwater streams where only water samples were collected. Circles indicate sites where both water and fish samples were collected. Numbers correspond to sampling locations. Stream names and three-letter abbreviations ae shown in the top right, along with % developed land use at the watershed level and % developed land use at the reach level in parentheses.
Microplastics 05 00144 g001
Figure 2. Concentration of microplastics in the water from each stream. Stream abbreviations identified in Figure 1 and Supplemental Table S1.
Microplastics 05 00144 g002
Figure 3. The number of microplastic pieces in fish digestive tracts from each stream. “X” denotes the mean. Bars represent minimum and maximum values. Data points 1.5 times beyond the interquartile range are shown as separate points outside the bars.
Microplastics 05 00144 g003
Disclaimer/Publisher’s Note: The statements, opinions and data contained in all publications are solely those of the individual author(s) and contributor(s) and not of MDPI and/or the editor(s). MDPI and/or the editor(s) disclaim responsibility for any injury to people or property resulting from any ideas, methods, instructions or products referred to in the content.