Article

Adsorption of Polyethylene Nanoplastics by Graphene Oxide–Polysaccharide Composites: Kinetic, Isotherm and Thermodynamic Studies


by
Mahrosh Javed
1,*,
Galina Lujanienė
1,
Sergej Šemčuk
1,
Tayyab Tahir
2,
Aušra Selskienė
3,
Vidas Pakštas
3,
Audrius Drabavičius
3 and
Martynas Talaikis
4
1
Department of Environmental Research, State Research Institute Center for Physical Sciences and Technology (FTMC), Savanorių Ave. 231, LT-02300 Vilnius, Lithuania
2
Department of Nuclear Research, State Research Institute Center for Physical Sciences and Technology (FTMC), Savanorių Ave. 231, LT-02300 Vilnius, Lithuania
3
Department of Characterization of Materials Structure, State Research Institute Center for Physical Sciences and Technology (FTMC), Savanorių Ave. 231, LT-02300 Vilnius, Lithuania
4
Department of Organic Chemistry, State Research Institute Center for Physical Sciences and Technology (FTMC), Savanorių Ave. 231, LT-02300 Vilnius, Lithuania
*
Author to whom correspondence should be addressed.
Microplastics 2026, 5(3), 142; https://doi.org/10.3390/microplastics5030142
Submission received: 25 April 2026 / Revised: 11 June 2026 / Accepted: 2 July 2026 / Published: 17 July 2026

Abstract

With high mobility, long-term durability, and potential risks to aquatic ecosystems and human health, polyethylene nanoplastics (PE–NPs) are a developing environmental issue. Therefore, graphene oxide (GO) was utilized to functionalize chitosan (CS) and microcrystalline cellulose (MCC) in order to create sustainable polysaccharide-based composites that resulted in graphene oxide–chitosan (GO–CS), graphene oxide–MCC–50 µm and graphene oxide–MCC–90 µm adsorbents in order to evaluate the adsorption performance of sustainable GO–polysaccharide composites toward laboratory-prepared polyethylene nanoplastics under controlled conditions. The novelty of this study lies in the comparative evaluation of GO–chitosan and GO–microcrystalline cellulose composites with two MCC particle sizes (50 μm and 90 μm) for the adsorption of laboratory-prepared polyethylene nanoplastics, providing insight into the influence of adsorbent composition and particle size on adsorption performance. The prepared adsorbents were characterized using scanning electron microscopy (SEM), Fourier transform infrared spectroscopy (FTIR), point of zero charge (pHpzc), and X-ray diffraction (XRD) in order to analyze adsorption behavior by morphology, chemical structure, surface chemistry, and particle crystallinity. According to the results, GO–CS has the maximum adsorption capacity (50.25 mg·g−1), followed by GO–MCC–50 µm (38.31 mg·g−1) and GO–MCC–90 µm (27.02 mg·g−1). Smaller MCC particle sizes of adsorbent resulted in improved adsorption performance, as demonstrated by the increased adsorption capacity of GO–MCC–50 µm as opposed to GO–MCC–90 µm. The difference between the graphene oxide–MCC–50 µm and graphene oxide–MCC–90 µm composites’ adsorption capacities demonstrates that adsorption capacity greatly increases with small adsorbent particle sizes. Stronger interaction sites, hydrophobic contacts, and a large number of functional groups are all responsible for the improved performance. The findings provide insight into the influence of polymer type and particle size on polyethylene nanoplastic adsorption and support the further development of GO-based biopolymer adsorbents.

1. Introduction

Industrialization and urbanization have driven the rapid expansion of the plastic industry [1], which reportedly generates 1.7–1.9 billion metric tons of global waste per year and is projected to reach 27 billion metric tons by 2025 [2]. Inadequate waste management has resulted in the accumulation of around 6.3 billion metric tons of plastic waste in the environment [3]. Once released, this debris undergoes degradation and fragmentation, producing nanoplastics (<1 µm) and microplastics (1 µm–5 mm) [4], leading to plastic pollution [5]. Due to their small size and large surface area, these particles can act as carriers for heavy metals and organic materials [3]. Among the world’s five most widely produced plastics, polyethylene (PE) is used in pipes, foam, bags, clothing, cables, and the petrochemical industry [6]. Recently, PE has also been used in nuclear physics for neutron measurements in reactor operations [7]. Approximately 24% of global plastic production is low-density polyethylene (LDPE) [8], resulting in the production and release of PE–NPs into the environment. These PE–NPs have been reported to induce cardiovascular toxicity in zebrafish embryos [9], as well as disrupt cell membranes and trigger inflammatory responses in human cells [10].
Given these findings, PE–NPs present an imminent threat to human health, underscoring the need for cost-effective and sustainable solutions [11]. Among various water treatment techniques [12,13], adsorption is a cost-effective, simple, and sustainable method for water purification that relies on both physical as well as chemical interactions, enabling the formation of strong and stable pollutant–adsorbent bonds [14]. Numerous adsorbent materials, such as clays, zeolites, metal–organic frameworks, biochar, and graphene oxide-based composites, have been used for the adsorptive removal of nanoplastics from water [15]. As a derivative of graphene, graphene oxide (GO) contains abundant oxygen functional groups (approximately 25–33% [16]), such as carbonyl (C=O), epoxy (C–O–C), hydroxyl (–OH), and carboxyl (COOH), which enhance its surface reactivity. Modified graphene derivatives have demonstrated excellent adsorption capacities for various water pollutants, including Am, Eu, Pu, and other radionuclides [17]. However, GO as an adsorbent faces several challenges, including limited reusability, strong π–π interactions, hydrophobic interactions, and the inherent tendency of adsorbents to aggregate, which compromise its efficiency and long-term stability [18]. In this context, naturally abundant and biodegradable polysaccharides such as chitosan offer a promising alternative for sustainable adsorbent development [4]. As the world’s second most abundant polysaccharide, chitosan is an organic material derived from chitin found in the exoskeletons of shrimp, crabs, and insects [19]. Its abundance, biodegradability, and low cost make chitosan a promising material for sustainable adsorbents [20,21]. Similarly, cellulose is a low-cost, abundant, and sustainable polysaccharide [22]. It is used in many industries, including paper, cardboard, pulp, and medical applications [23,24]. Cellulose exists in various forms, such as cellulose fibers, microcrystalline cellulose, cellulose nanocrystals, holocellulose [25], hypromellose, hydroxyethyl cellulose, and cellulose acetate phthalate [26]. It features interconnected pores, tunable pore architecture, mechanical robustness, and crystallinity. Among the various types of cellulose, microcrystalline cellulose (MCC), which contains hydroxyl (–OH) functional groups, is a non-toxic, abundant, water-insoluble, and low-cost biopolymer [27]. However, it exhibits pH sensitivity, low mechanical strength, and limited adsorption sites [24,28]. Its insolubility in water and common organic solvents also limits its practical adsorption performance, necessitating modification or composite formation to enhance its functionality and suitability for integration with graphene oxide. This combination may lead to the fabrication of multifunctional hybrid composites [29]. Activation of the MCC surface is a key step in attaching graphene oxide to its surface [30]. To remove pollutants from water, integrating MCC with graphene oxide (GO) offers a promising strategy for creating a biocompatible and sustainable adsorbent [31].
Recent studies have demonstrated the potential of graphene oxide (GO), chitosan, chitin, and cellulose-based materials for the adsorption and removal of microplastics and nanoplastics from aquatic environments due to their abundant surface functional groups, tunable surface chemistry, biodegradability, and strong interactions with polymeric contaminants. GO/chitosan sponges, GO/chitosan/genipin composites, and chitin/GO-based adsorbents have shown promising performance for the removal of microplastics and nanoplastics from water [32,33,34]. However, despite these advances, limited information is available regarding the comparative performance of different GO–polysaccharide composites for polyethylene nanoplastic removal, particularly concerning the influence of adsorbent particle size on adsorption behavior. To address this knowledge gap, the present study comparatively evaluates graphene oxide–chitosan (GO–CS) and graphene oxide–microcrystalline cellulose (GO–MCC) composites with two MCC particle sizes (50 μm and 90 μm) for the removal of laboratory-prepared polyethylene nanoplastics. The study further investigates the effects of adsorbent composition and particle size through adsorption, kinetics, isotherms, thermodynamics, and surface characterization analyses, providing new insights into the design of sustainable GO-based biopolymer adsorbents for nanoplastic remediation.

2. Materials and Methods

2.1. Chemicals

Acetic acid (Sigma–Aldrich, Buchs, Switzerland), Microcrystalline cellulose (average particle size 50 μm and 90 μm, Thermo Fisher Scientific, Kandel, Germany), Chitosan (100.000–300.000 m. w., Sigma Aldrich, Taufkirchen, Germany), Dimethyl sulfoxide (DMSO; Chempur, Piekary Śląskie, Poland), Ethanol (Honeywell Riedel-de Haën, Seelze, Germany), Glutaraldehyde (25% aqueous solution; VWR BDH Chemicals, Leuven, Belgium), Graphite (<20 μm synthetic, Sigma–Aldrich, Buchs, Switzerland), Hydrogen peroxide (30%, Chempur, Piekary Śląskie, Poland), Hydrochloric acid (35–38%, Chempur, Piekary Śląskie, Poland), Isopropanol (2-propanol, Chempur, Piekary Śląskie, Poland), Milli-Q water (Billerica, MA, USA), Phosphoric acid (85%, Lach-Ner s.r.o., Neratovice, Czech Republic), Potassium permanganate (Standard, Lublin, Poland), Sulfuric acid (96%, Lach-Ner s.r.o., Neratovice, Czech Republic), Toluene (Lach-Ner s.r.o., Neratovice, Czech Republic).

2.2. Preparation of Graphene Oxide

Modified Hummer’s method was used to prepare graphene oxide [35]. In short, 324 mL of sulfuric acid was added to 36 mL of phosphoric acid and mixed for 10 min. Subsequently, 3 g of graphite was added to the mixture and stirred for 30 min at 840 rpm at room temperature. After completely mixing, 18 g of potassium permanganate was slowly added for oxidation at room temperature, then the reaction mixture was maintained at 100 °C for an hour and then stirred at ambient temperature for 48 h until the color changed from black to reddish brown. To terminate the reaction, 25 mL of hydrogen peroxide and 400 g of ice were added turning the solution yellow. The obtained product was washed with 35% hydrochloric acid, 1 M hydrochloric acid, water, ethanol and isopropanol followed by drying in the oven at 40 °C.

2.3. Preparation of Graphene Oxide-Chitosan Composites

A total of 3 g of chitosan was added to 100 mL of acetic acid solution (2% v/v) and stirred until a clear solution formed. A total of 0.5 g of graphene oxide was dissolved in 100 mL of deionized water. GO solution was added to the chitosan solution and mixed for 1 h. Subsequently, 3 mL of 25% glutaraldehyde was introduced to the mixture as a crosslinker [17] and the mixture was stirred continuously for two hours, followed by crosslinking for 6 h. A total of 0.1 M NaOH was used for precipitating out composites followed by washing with water and ethanol till pH became neutral. Then, the obtained composites were dried in an oven at 50 °C for overnight and stored for use.

2.4. Preparation of Graphene Oxide-Cellulose Composites

A total of 3 g of microcrystalline cellulose (MCC 50 µm and MCC 90 µm) was dispersed in 200 mL of 2 M NaOH [36] separately and stirred till partial dissolution. A total of 0.5 g of graphene oxide is added to 100 mL of water and stirred for 30 min in both solutions. Cellulose solution is then dispersed into graphene oxide solution slowly and stirred for 30 min. For crosslinking, 3 mL of 25% glutaraldehyde was introduced to the solution and mixed for 24 h. The obtained composites were washed with water and ethanol until a neutral pH was maintained. Following the washing, composites were dried at 50 °C and stored at 4 °C.

2.5. Preparation of PE Nanoplastics

A total of 1 g of polyethylene (PE) plastic obtained from a commercial plastic bag was added to 50 mL of toluene and heated with continuous stirring until complete dissolution was achieved. Then the plastic solution was slowly added to the already prepared stabilizer solution (5% PVA) and stirred for 2 h. Following complete stabilization of the nanoplastic, excess solvent was removed through high-speed centrifugation at around 7000 rpm for 25 min. Ethanol was used to wash the nanoplastics and repeated three times. Then to remove any excess toluene, the nanoplastics were dried at 80 °C. After drying, nanoplastics were stored at 4 °C for further use.

2.6. Determination of Point of Zero Charge

The salt titration method was used to find the pHpzc of GO–CS, GO–MCC–50 µm, GO-MCC–90 µm composites and PE–NPs. Briefly, 30 mg of each material was added to 0.1 M NaCl separately adjusted within the pH range of 2–10 [37]. These prepared samples were agitated at 150 rpm. After 24 h, samples were filtered and the pH of the solution was measured again. pHpzc was measured by plotting a graph against initial pH (pHi) and ΔpH. The pHpzc was determined at the intersection of ΔpH and pHi.

2.7. Batch Adsorption Experiments

The adsorption performance of the three composites toward polyethylene nanoplastics (PE–NPs) was evaluated using batch adsorption experiments. A PE–NPs stock suspension (20 mg/L) was first ultrasonicated in an ultrasonic bath for 180 min to ensure proper dispersion of the nanoplastics. For the adsorption experiment, 10 mg of the dried composite was added to 10 mL of PE–NP solution at different pH values. To assess the effect of initial PE–NPs concentration, concentrations ranging from 0.05 to 0.2 g·L−1 were used. The influence of adsorbent dosage was investigated by adjusting the amount of adsorbent between 5 and 20 mg while keeping the PE–NP concentration at 0.05 g·L−1. Adsorption kinetics were investigated using separate vials for each contact time (5 min, 10 min, 30 min, 1 h, 1.5 h, and 24 h). For these experiments, 10 mg of each GO/composite was added to 10 mL of PE–NP solution and agitated at 150 rpm at 25 °C. The influence of temperature on adsorption was evaluated at 25, 30, 35, and 40 °C. For UV–Visible analysis, the adsorbent was separated by centrifugation at 7000 rpm. The residual PE–NP concentration was determined at 200 nm using a calibration curve. All adsorption experiments were performed in triplicate, and the mean values were used for analysis.
The adsorption capacity at equilibrium (qe) was calculated using the equations:
A d s o r p t i o n   e f f i c i e n c y ( % ) = C i C e C i × 100
q e ( m g · g 1 ) = C i C e m V
where m(g) is the mass of the adsorbent, Ci represents the initial and Ce (mg·L−1) Ce equilibrium concentrations of PE–NPs and V(L) is the solution volume.

3. Results

The structural, chemical, and surface characterization of the synthesized GO–CS, GO–MCC–50 µm, and GO–MCC–90 µm composites demonstrates that both the polymer type and particle size significantly influence the physicochemical properties of the final adsorbents. When compared with previously reported graphene oxide–polysaccharide composites, the results obtained in this study follow well-established trends but also show distinct features arising from particle size variation and sodium activation [38].

3.1. Characterization

3.1.1. Scanning Electron Microscopy

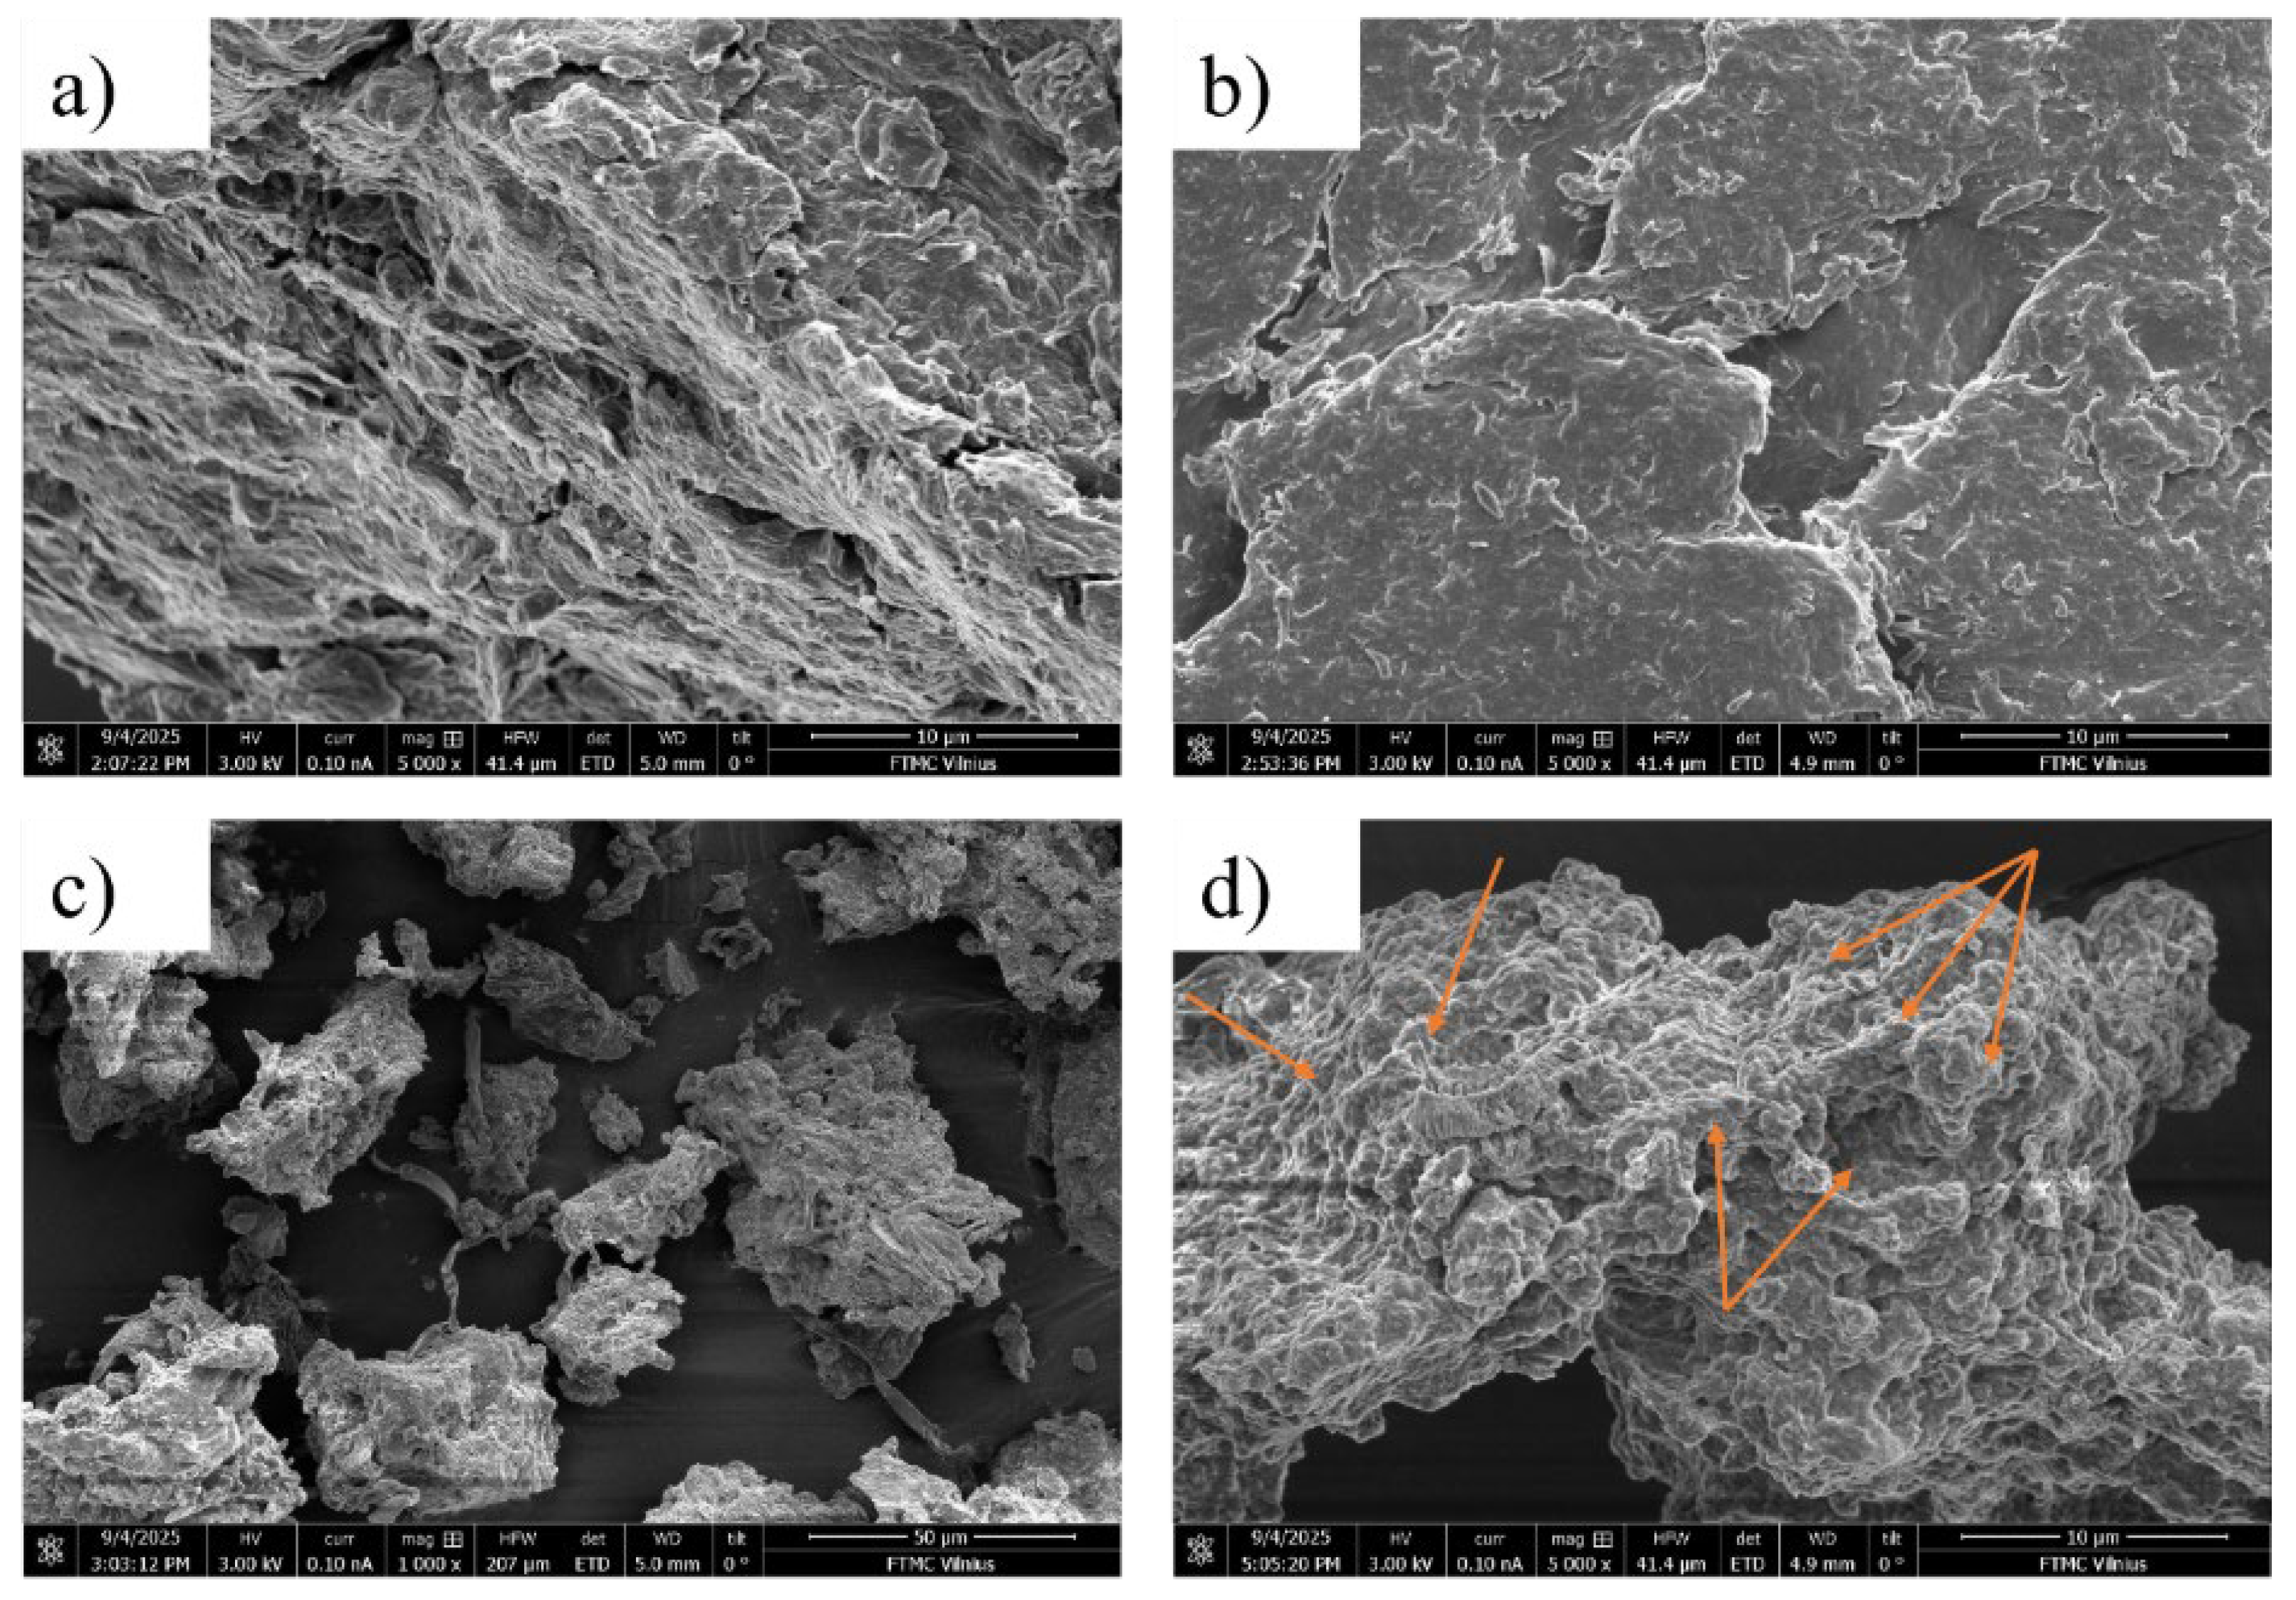
To understand the structural characteristics and effects of composite formation, synthesized composites were characterized by scanning electron microscopy (SEM) (SEM/FIB workstation Helios Nanolab 650 (FEI, Eindhoven, The Netherlands) with an energy-dispersive X-ray (EDX) spectrometer INCA Energy 350 X-Max 20) [39]. This technique provides direct insight into the structural features and interfacial morphology of the prepared composites. For GO, SEM images reveal a multi-layered, wrinkled structure with exfoliated sheets and a folded, thin, flaky morphology with a high surface area (Figure 1a). According to Tang, Lee et al., these characteristic folds increase the surface area and create abundant active sites, which are beneficial for subsequent composite formation and adsorption processes. For chitosan (CS), the results show a dense but smooth surface, reflecting its polymeric nature and intermolecular hydrogen bonding within the chitosan structure (Figure 1b). The low porosity and strong hydrogen bonding result in a limited surface area for adsorption [40]. In the GO–CS composite images, the surface appears more heterogeneous and rougher, with irregular folds and visible flakes, indicating good interfacial interaction between GO sheets and chitosan [41]. The irregular morphology demonstrates hydrogen bonding and physical interlocking between GO and chitosan. These morphological changes may significantly improve surface area, active site accessibility, and diffusion pathways, leading to enhanced adsorption capacity of the prepared composites. The distribution of GO in this composite is indicated by the orange arrows in Figure 1d.
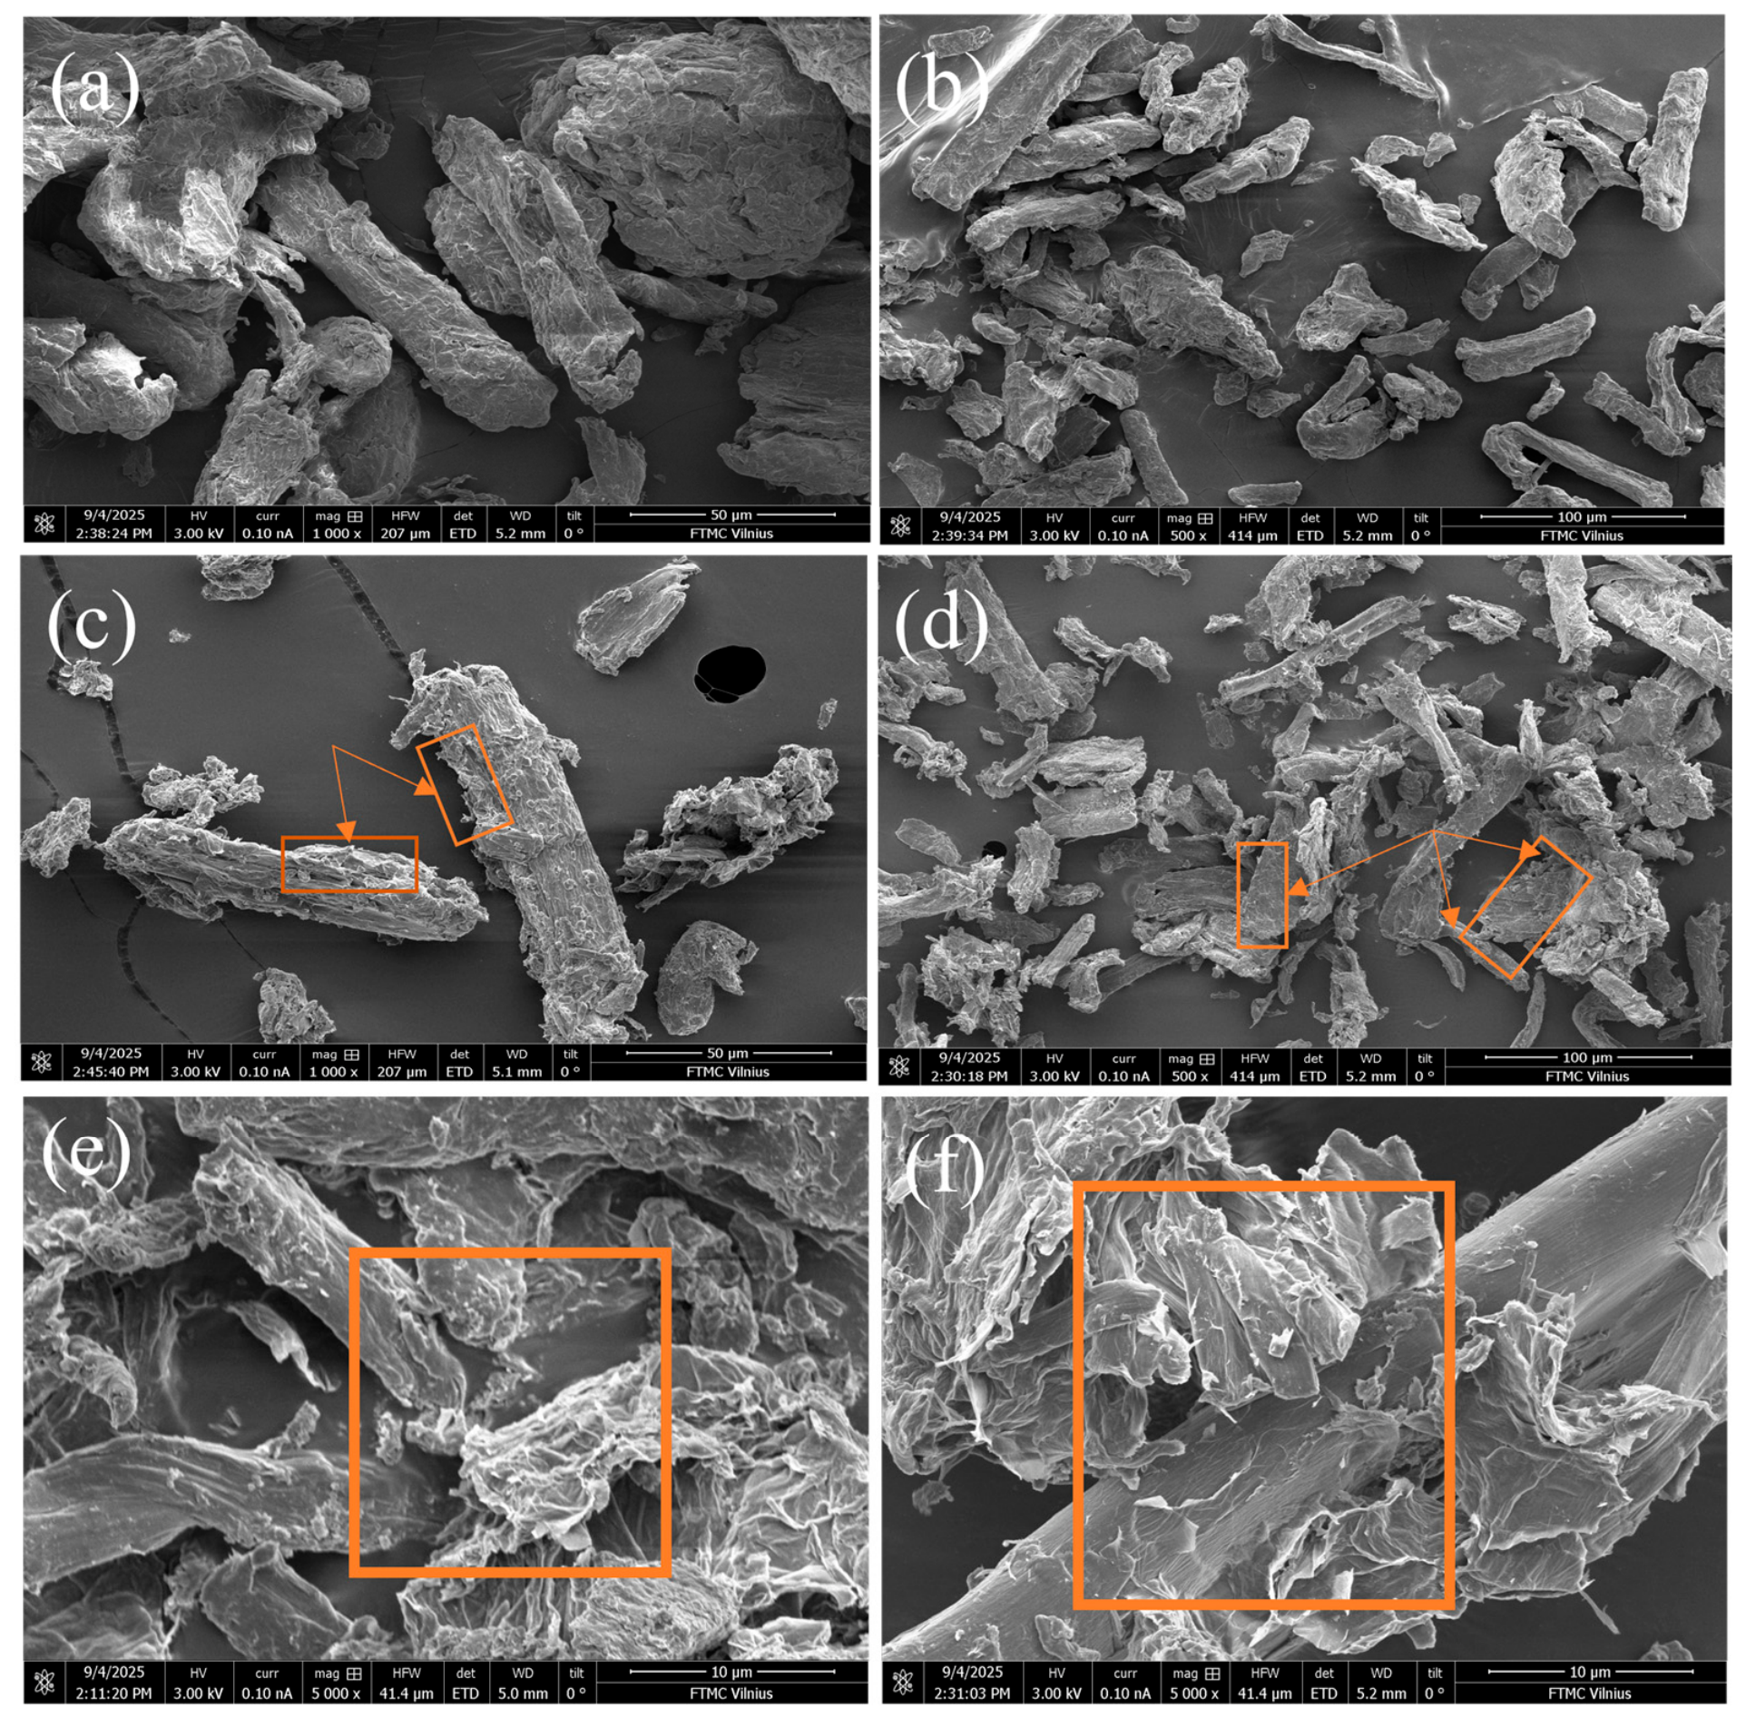
For MCC, SEM images show a smooth, compact surface morphology and fibrillated shapes. The MCC–50 µm sample presents a more uniform and denser surface, whereas the MCC–90 µm sample exhibits increased porosity and a slightly rougher texture, indicating looser packing of cellulose chains (Figure 2a,b). For GO–Microcrystalline Cellulose (GO–MCC) composites (50 µm and 90 µm), the surface becomes rougher and more irregular, indicating successful integration of GO sheets within the microcrystalline cellulose particles (Figure 2c,d). SEM images of GO–MCC–50 µm composites show a more compact structure, while the 90 µm composites display more open pores. The distribution of GO in GO–MCC composites (50 µm and 90 µm) is indicated by the orange arrows in Figure 2c,d.
The observed morphology is consistent with another study on MCC–GO hybrids, which reported rougher textures and wrinkled surfaces due to hydrogen bonding and physical interlocking between GO and polysaccharide chains [42]. The layered and rough GO–MCC (50 µm) surface indicates the formation of strong hydrogen bonds between the –OH groups of MCC and functional groups present on the surface of GO. These visible changes on the composite surface provide more interaction sites, confirming the formation of composites with improved mechanical stability and surface uniformity [28].
GO–MCC–90 µm has a more porous and rougher surface. This expanded surface exhibits high porosity, which may provide additional pathways for molecules to access internal sites. Figure 2c,d highlight the differences between the two MCC substrates, showing clear variations in the fibrous structure that result in visible differences in the final composites. Particle size, hydrogen bonding, and GO integration interact to produce both structures. Larger particles favor bulk porosity, while smaller particles favor surface-dominated characteristics. Similar effects have been reported in the literature, where larger cellulose particle sizes or lower crystallinity lead to more porous and irregular composite structures [43]. The distribution of GO in (GO–MCC) composites (50 µm and 90 µm) is depicted by the orange arrows, as displayed in Figure 2c,d. The observed morphology aligns well with another study done on a combination of MCC–GO hybrids which show rougher textures and wrinkled surfaces due to hydrogen bonding and physical interlocking between GO and polysaccharide chains [42].

3.1.2. Transmission Electron Microscopy

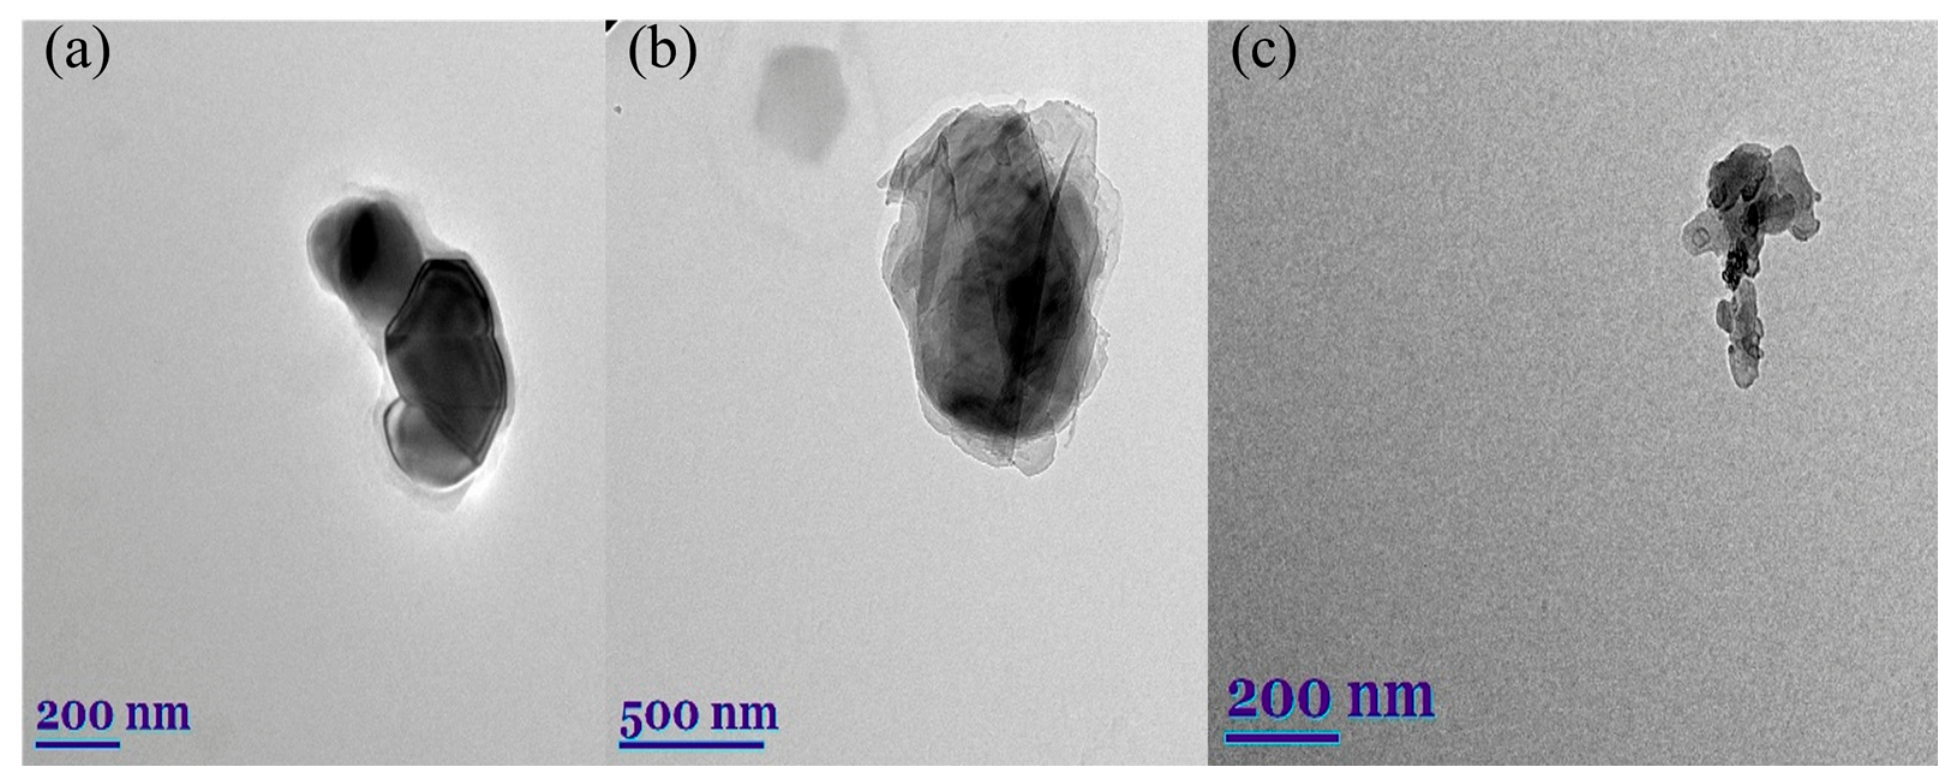
TEM images of PE-NPs obtained by Tecnai F20 X-TWIN (FEI, The Netherlands,) transmission electron microscope with an accelerating voltage of 200 kV using high-resolution imaging, confirm the successful synthesis of nanoplastics with particle sizes ranging from 200 to 500 nm, as shown in Figure 3. Figure 3a shows individual PE–NPs with irregular, quasi-spherical morphology and smooth particle boundaries. Figure 3b presents a larger nanoplastic particle with a layered internal contrast, reflecting differences in particle thickness resulting from the nanoprecipitation process. Figure 3c illustrates a small cluster of PE–NPs on the TEM image.

3.1.3. Attenuated Total Reflectance-Fourier Transform Infrared Spectroscopy

The attenuated total reflectance-Fourier transform infrared spectroscopy (ATR-FTIR) spectra were recorded using an Alpha spectrometer (Bruker Inc., Ettlingen, Germany) with an ATR platinum diamond accessory and a room temperature Detector RT-DLATGS.
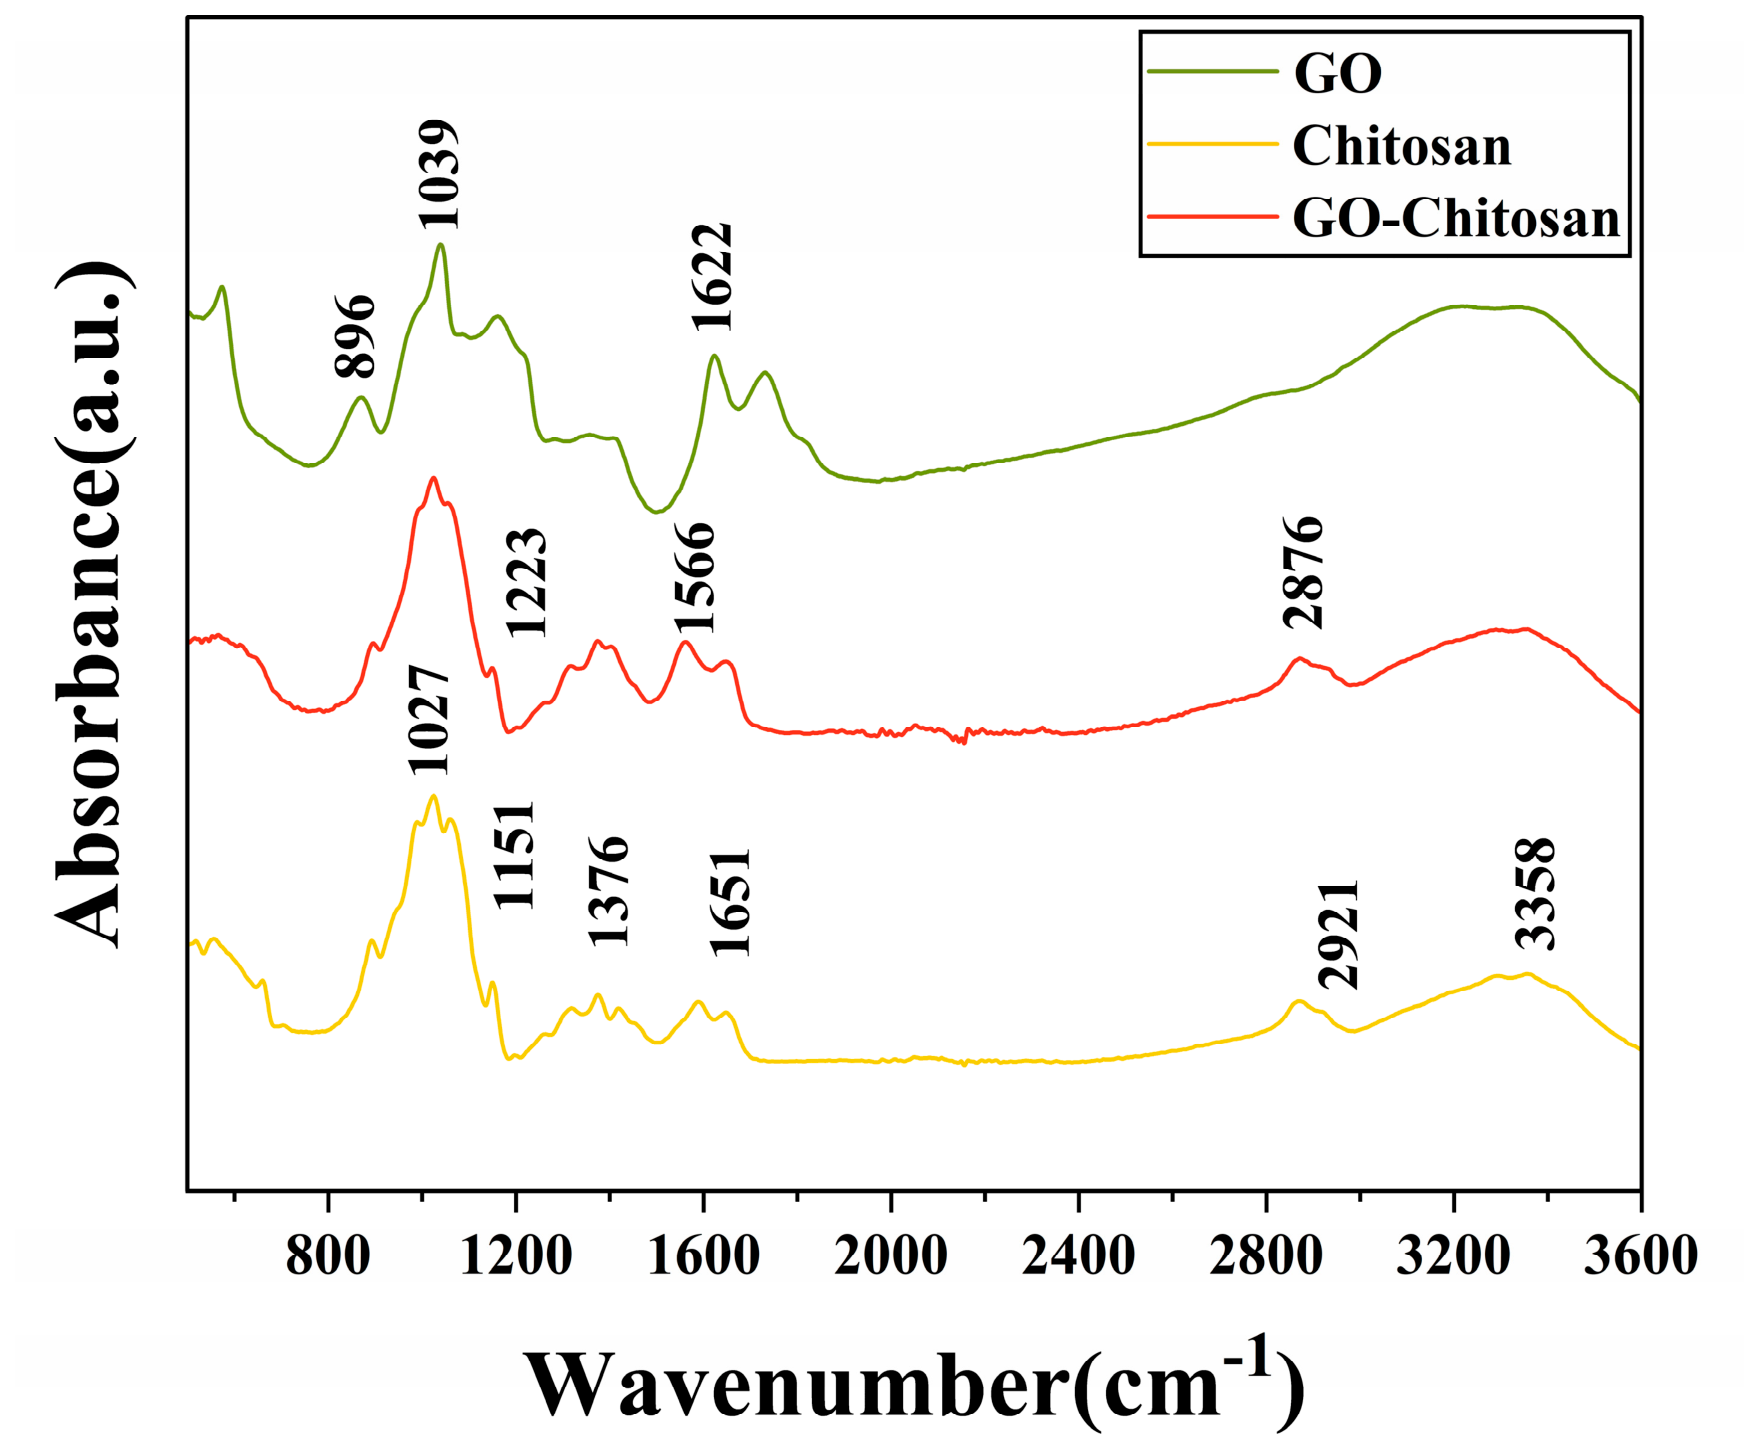
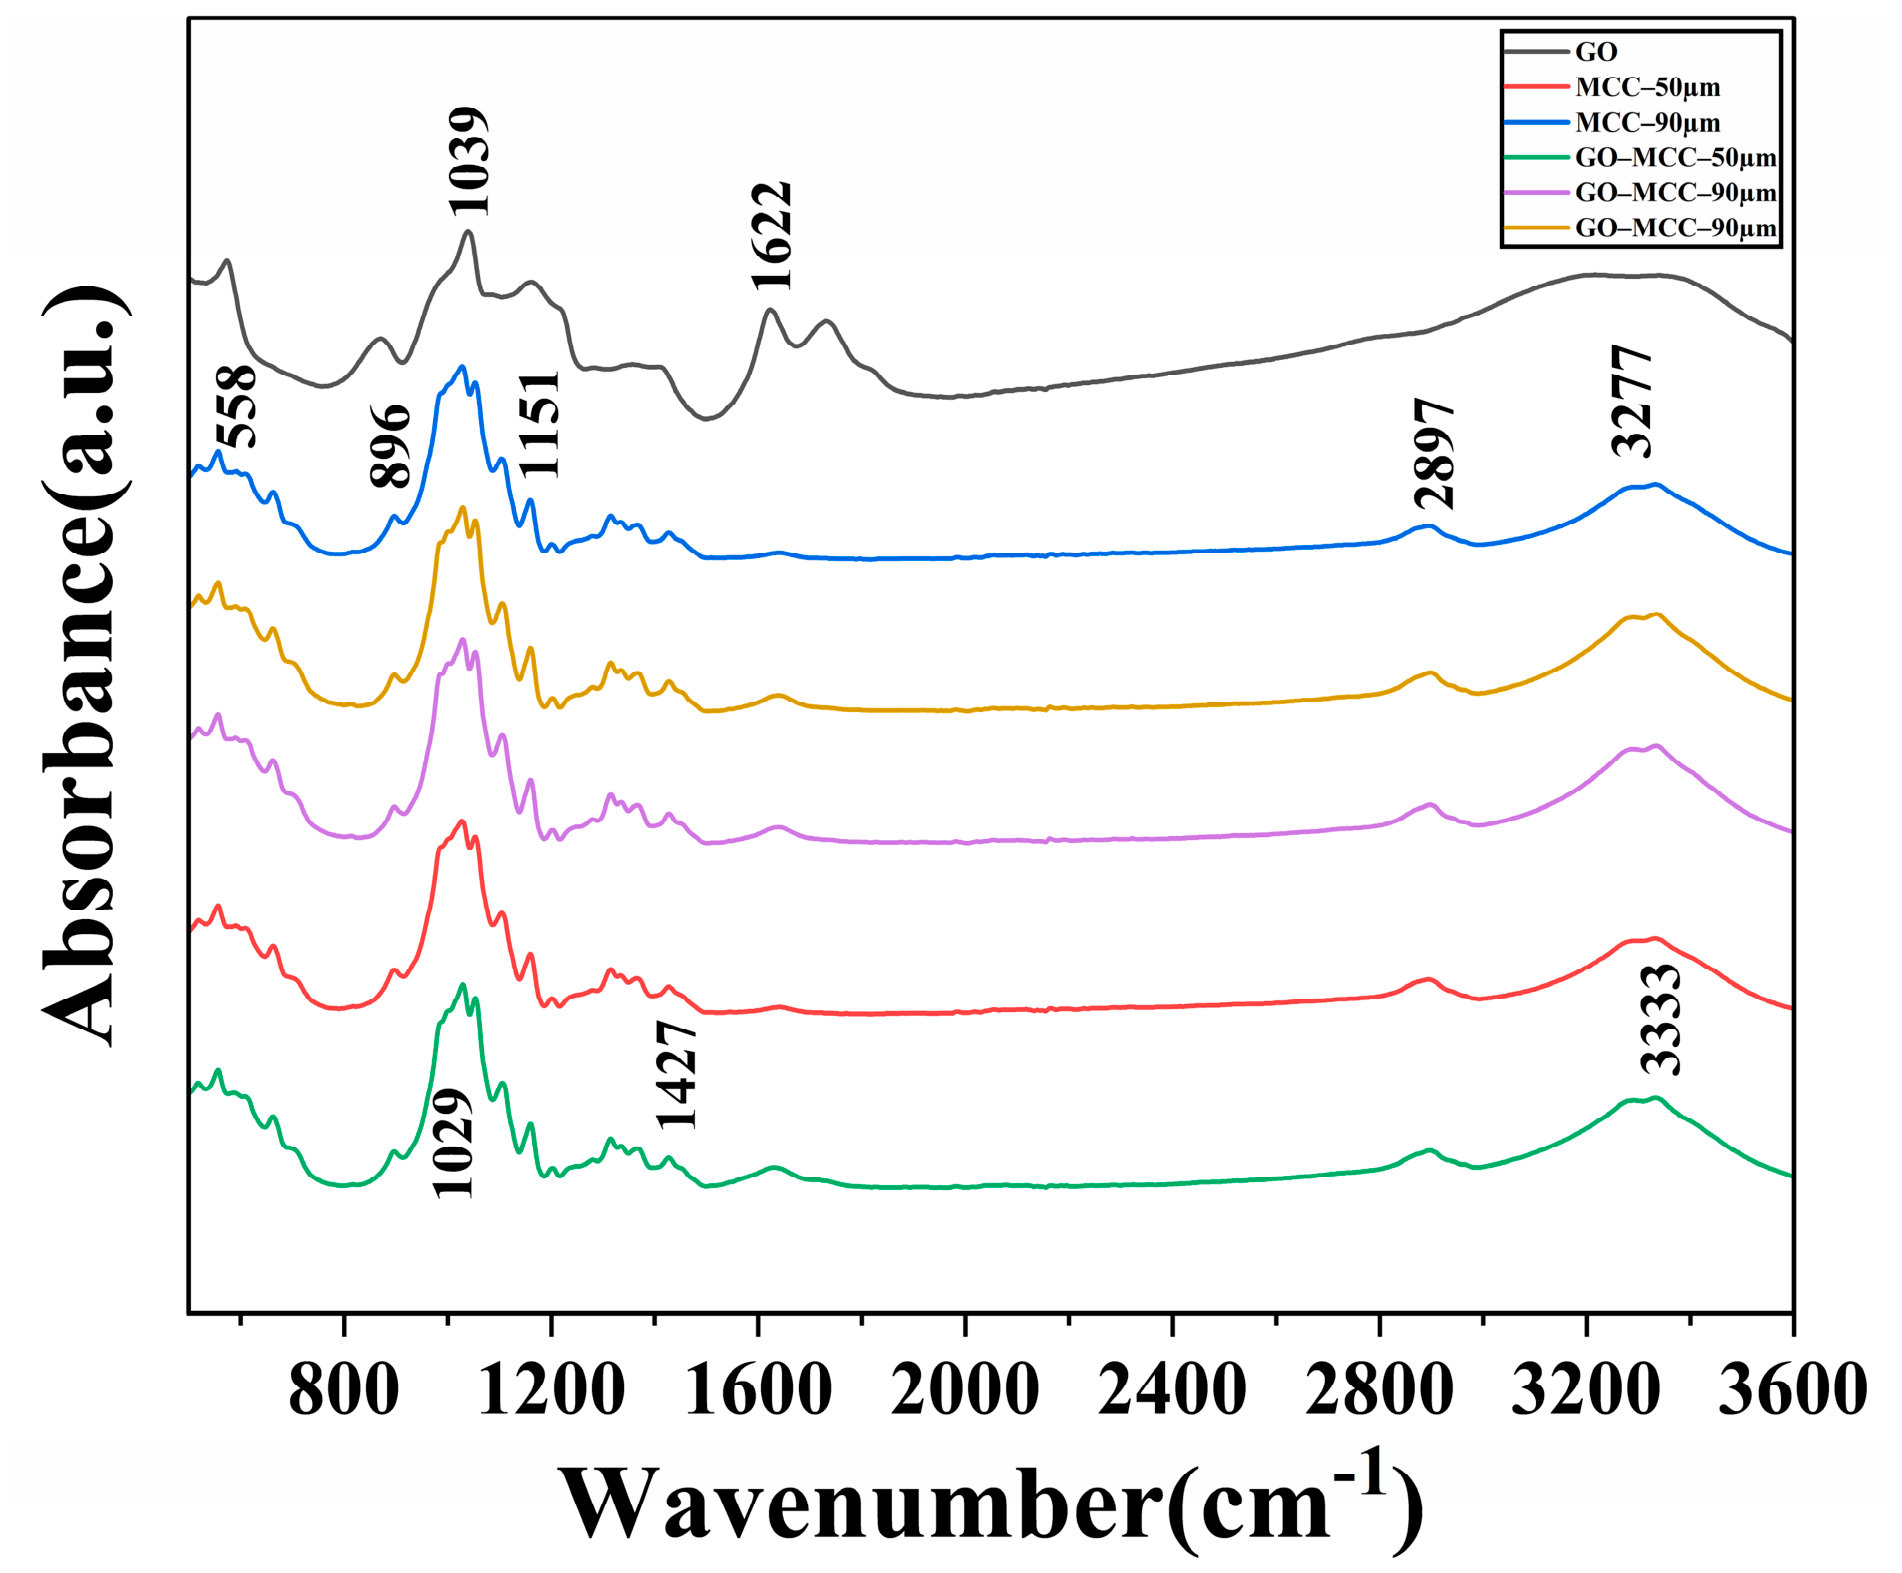
ATR-FTIR analysis offers details on the functional groups present in microcrystalline cellulose, chitosan, graphene oxide, and their prepared adsorbents. The spectra of graphene oxide, chitosan and microcrystalline cellulose are shown in Figure 4 and Figure 5. A broad O–H stretching vibration from –OH and carboxyl groups is visible at 3400 cm−1 in the graphene oxide spectra. The band at 1730 cm−1 is characteristic of a carboxylic acid or carbonyl group C=O stretching. The rise at 1622 cm−1 is attributed to the aromatic sp2 carbon skeleton’s C=C stretching vibration. Epoxy C-O-C vibration or C-OH stretching is identified at 1223 cm−1. The peak at 1039 cm−1 is associated with alkoxy group C–O stretching. The FTIR peaks for chitosan reveal N–H and O–H stretching vibrations from intramolecular and intermolecular H-bonding at 3358 cm−1, C–H stretching from –CH3 and –CH2 groups at 3284 cm−1, C=O stretching at 1651 cm−1, N–H bending at 1566 cm−1, C–H bending or C–N stretching at 1376 cm−1, and C–O–C stretching vibrations resulting from glycosidic linkages within chitosan at 1080–1030 cm−1. The C-N fingerprint is seen at 896 cm−1.
After crosslinking in GO–CS composites, there is a slight shift at 3400 cm−1 to a lower wavenumber, indicating stronger hydrogen bonding interactions between the amino and –OH groups of chitosan and the –OH, –COOH, and –O– (oxygen groups) of GO. A slight shift at 1659 cm−1 and 1590 cm−1 also indicates hydrogen bond formation and amide linkages between chitosan and GO [44]. The peak for the carbonyl group of GO at 1730 cm−1 disappears, which may be due to interaction with the amino groups of chitosan, consistent with previously reported GO–CS composites [45]. The intensity around 1050–1020 cm−1 changes, confirming interaction between C–O–C and C–O through oxygenated groups of GO and the chitosan backbone, resulting in hydrogen bonding or crosslinking [46,47]. For GO–MCC composites, in Figure 5, FTIR results of MCC show the presence of –OH stretching as a broad band near 3333 cm−1, which may be attributed to –OH groups. The peak near 2897 cm−1 is attributed to C–H stretching of the methylene group. The band around 1622 cm−1 results from water absorption and C=O groups from oxidized sites or hemicellulose. At 1427 cm−1, the vibration is related to the methylene group. The sharp peaks around 1057 cm−1 are due to C–O–C and C–O stretching vibrations of the anhydro glucose ring, confirming the polysaccharide backbone [48]. At 896 cm−1, the C–H group appears [49].
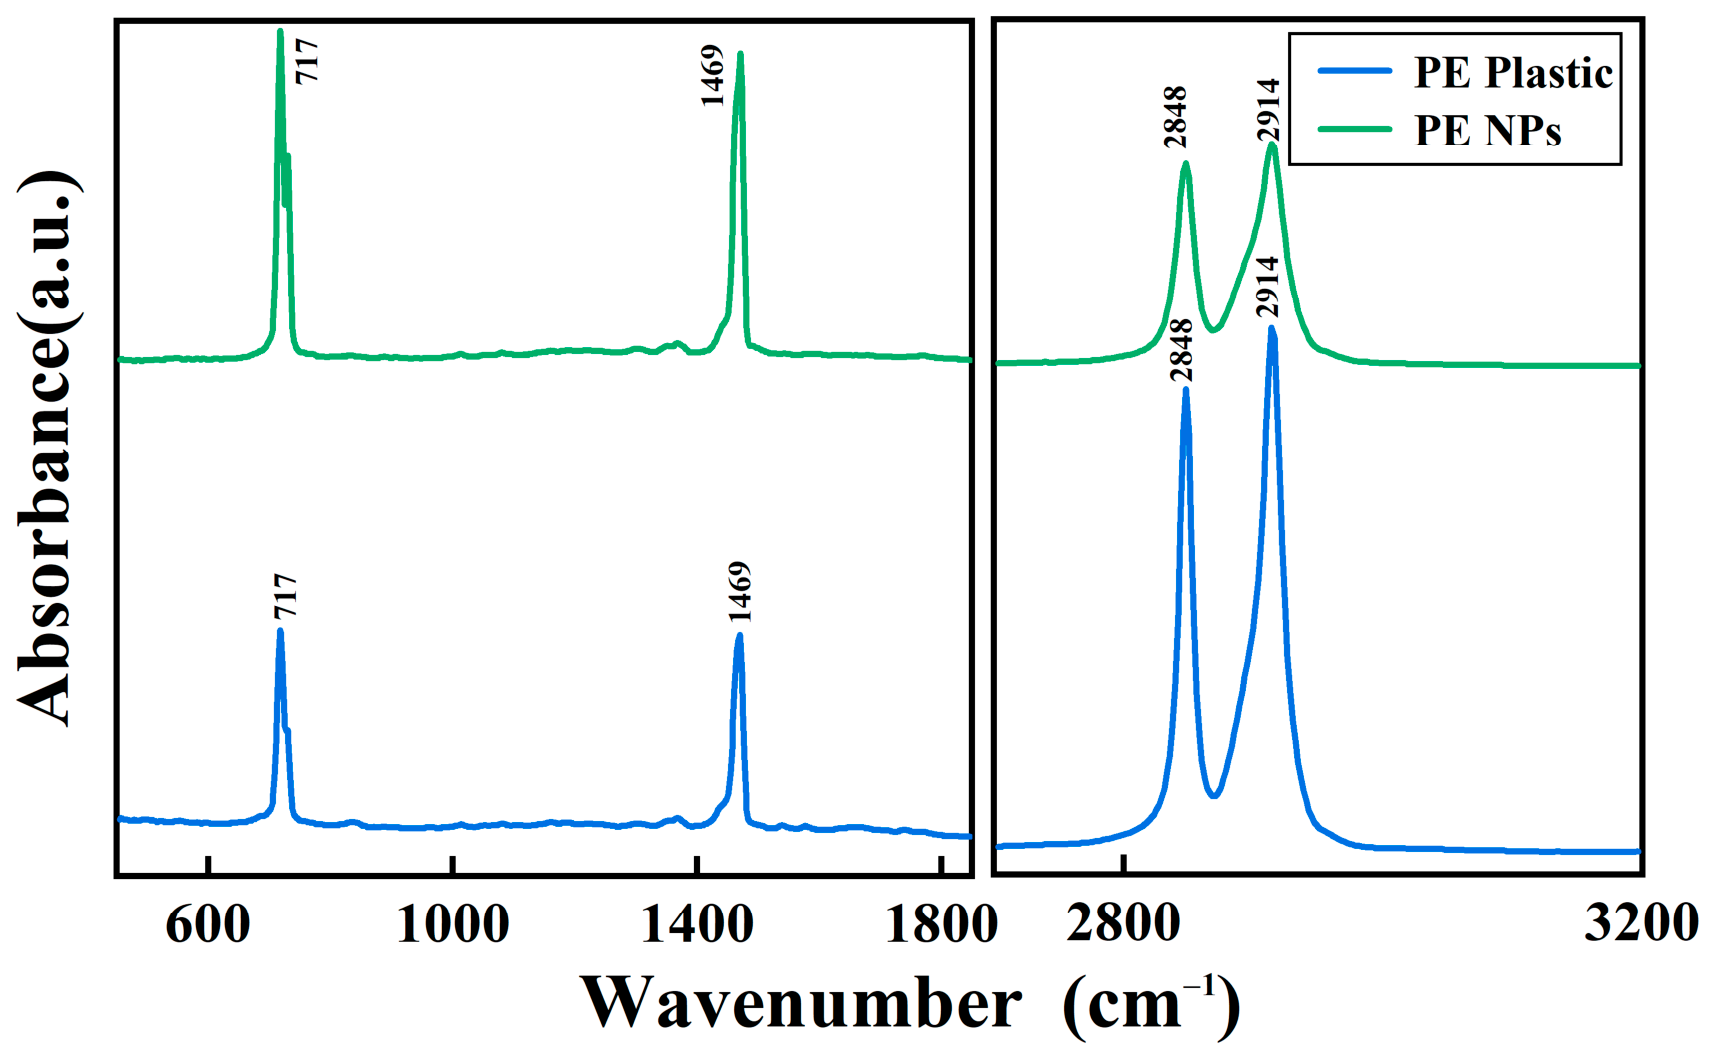
The structural evolution of the materials in the synthesis of GO–CS and GO–MCC composites can be linked to specific chemical pathways occurring during the reaction process. The amino groups become protonated and more reactive towards electrophilic oxygen-containing functions on GO sheets [50] in the slightly acidic environment required to solubilize chitosan. This environment promotes nucleophilic interactions with carbonyl and epoxy groups, enabling the formation of substantial hydrogen bonding as well as amide or amino-alcohol connections [51]. The production of GO–MCC composites is governed by a similar mechanism: cellulose’s numerous hydroxyl groups can participate in condensation or epoxy-ring-opening reactions with GO, creating new C–O–C or C–O links and enhancing interfacial adhesion. Strong hydrogen bonds and these chemical interactions help inhibit GO restacking and promote the formation of a more stable and integrated hybrid network [52]. The proposed reaction pathways are consistent with previously documented syntheses of GO–biopolymer hybrid materials, in which GO is partially reduced and covalent bonds form at the GO–polymer interface due to amine-induced activation of carbonyl and epoxy groups or hydroxyl-driven condensation reactions. Similar results have been reported for GO–CS hydrogels and GO–MCC hybrid films, where the intrinsic reactivity of amino and hydroxyl groups under acidic conditions drives composite formation without the need for additional crosslinking agents [53]. Therefore, the synthesis behavior observed in this work aligns with previous research, and the degree of band shifting and suppression of distinctive GO peaks indicates interfacial bonding strength equal to or greater than that found in earlier studies. ATR-FTIR was also used to characterize both PE plastic and PE-NPs (Figure 6). All observed peaks have already been reported as characteristic of PE plastics [54]. Major peaks for PE plastics include 717, 1469, 2848, and 2914 cm−1. The strong asymmetric CH2 stretching and symmetric CH2 stretching in the methylene group were observed at 2848 cm−1 and 2914 cm−1. The band at 1467 cm−1 is attributed to CH2 scissoring [55]. The peak around 717 cm−1 corresponds to CH2 rocking [56]. All these peaks were also observed for the nanoplastics. No new absorption bands were detected during the formation of PE-NPs, indicating that no significant chemical structural changes occurred during the nanoplastics preparation process.

3.1.4. X-Ray Diffraction Analysis (XRD)

The X-ray diffraction analysis (XRD) patterns of the prepared composites were obtained by a D8 X-ray diffractometer (Bruker AXS, Bremen, Germany). For X-ray diffraction analyses, the Vertex 70v (Bruker Inc., Bremen, Germany) vacuum spectrometer with a spectral resolution of 2 cm−1 (using a KBr pellet for sample preparation).
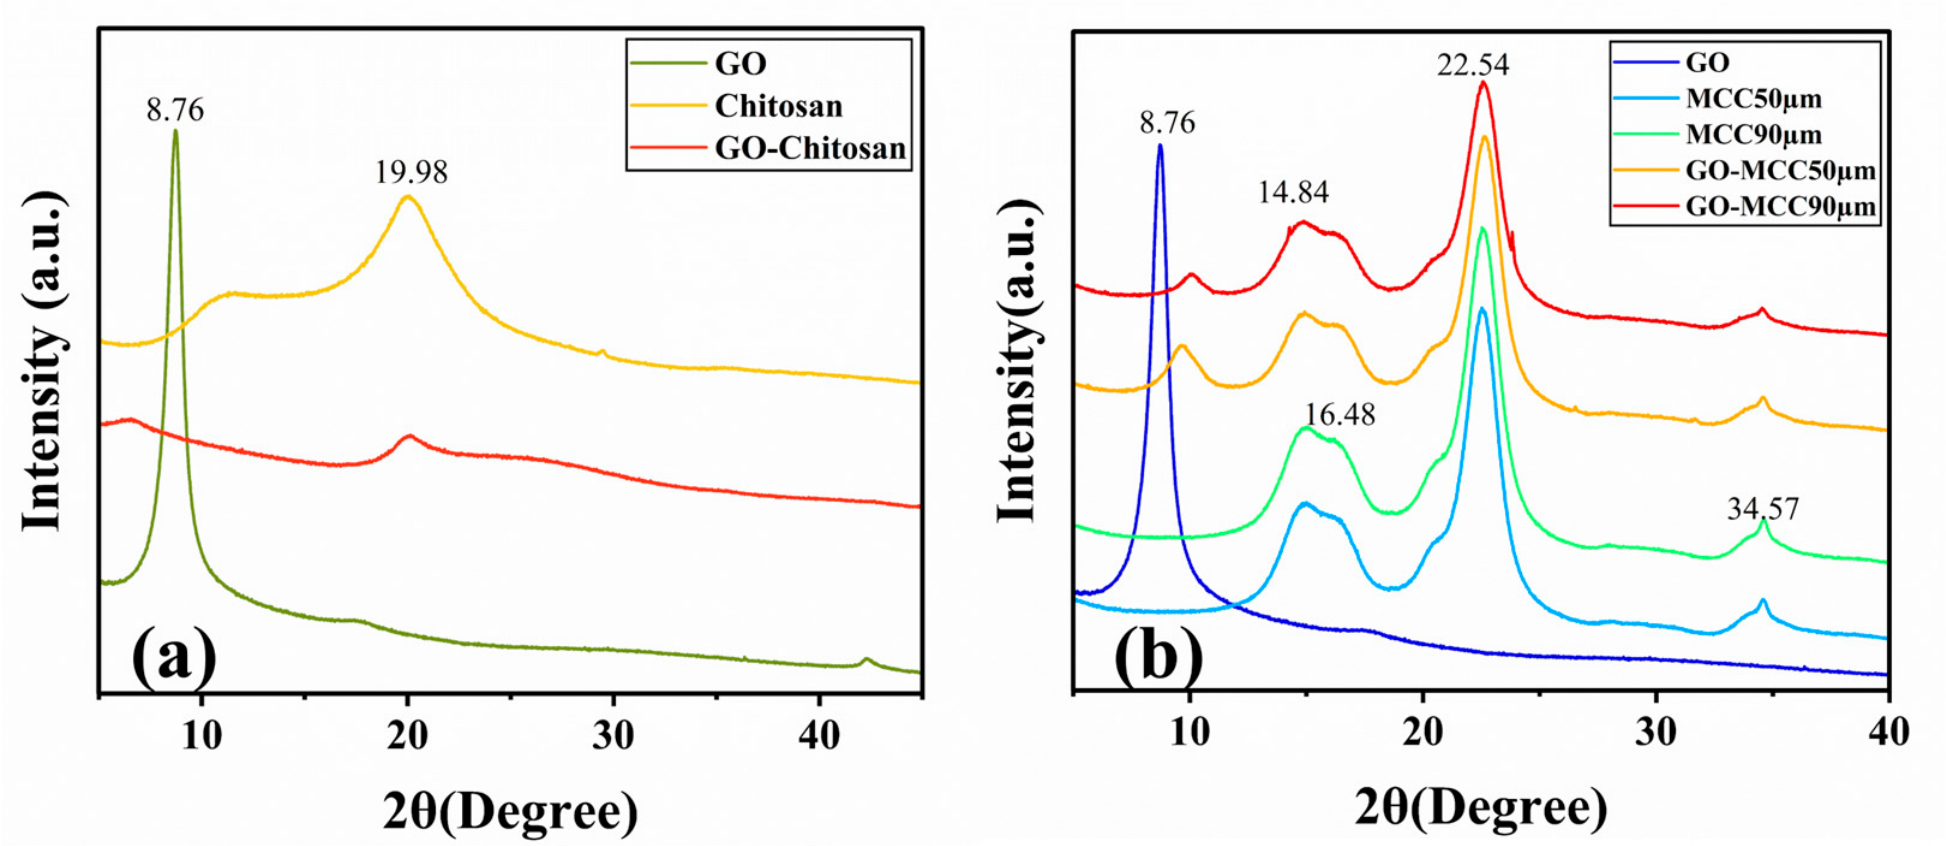
Figure 7 displays the XRD patterns for GO, chitosan, MCC, and modified composites (GO–MCC–50 µm, GO-MCC–90 µm) in the 2θ range of 5–40°. At 2θ ≈ 8.76°, the XRD pattern for GO has a strong peak that corresponds to the 003-plane reflection pattern. The high peak intensity and low angle show that GO has consistent layer stacking and functional groups that contain oxygen. The diffraction planes 004, 200, 1–10 and 110 are represented by the peaks for MCC at 34.57°, 22.54°, 16.48° and 14.84° respectively. The GO–MCC (50 µm, 90 µm) samples display a strong diffraction peak at 2θ ≈ 8.7°, corresponding to the (003) reflection of graphene oxide. This peak indicates expanded interlayer spacing due to the intercalation of MCC chains and water molecules between GO sheets [27].
In contrast, GO–Chitosan samples showed dominant broad peaks centered at 2θ ≈ 19.98°, attributed to the semi-crystalline regions of the polymer matrices and partially restacked or disordered GO layers. The absence of the low-angle (003) reflection in these samples indicates enhanced exfoliation and stronger GO–polymer interactions, which disrupt long-range layered ordering [57]. These crystallinity patterns closely match trends reported in the literature and demonstrate that smaller MCC particles promote improved GO dispersion and stronger structural reorganization. Overall, the XRD results confirm that polymer type and particle size significantly affect GO interlayer spacing and composite crystallinity.

3.2. Adsorption Study

3.2.1. Point of Zero Charge

In adsorption experiments, surface charges significantly influence the interface between the adsorbent and analyte. The pH point of zero charge (pHpzc) is a vital chemical characteristic used to determine the surface charge of a material, as it depends on the interaction between the surface charge and the initial pH of the solution. This test indicates the pH at which the surface charge is neutral [58]. It is well known that a material’s surface charge is negative if the pH is higher than the pHpzc and positive if it is lower. Therefore, adsorption of cationic species is favored at pH values higher than the pHpzc, while lower pH values are generally more effective for the adsorption of anionic species. OH and H+ ions in the mixture interact with the material’s surface groups. In this regard, nanoplastics have been used to plot the pHpzc and assess the surface charge in order to investigate the surface chemistry of the developed composites.
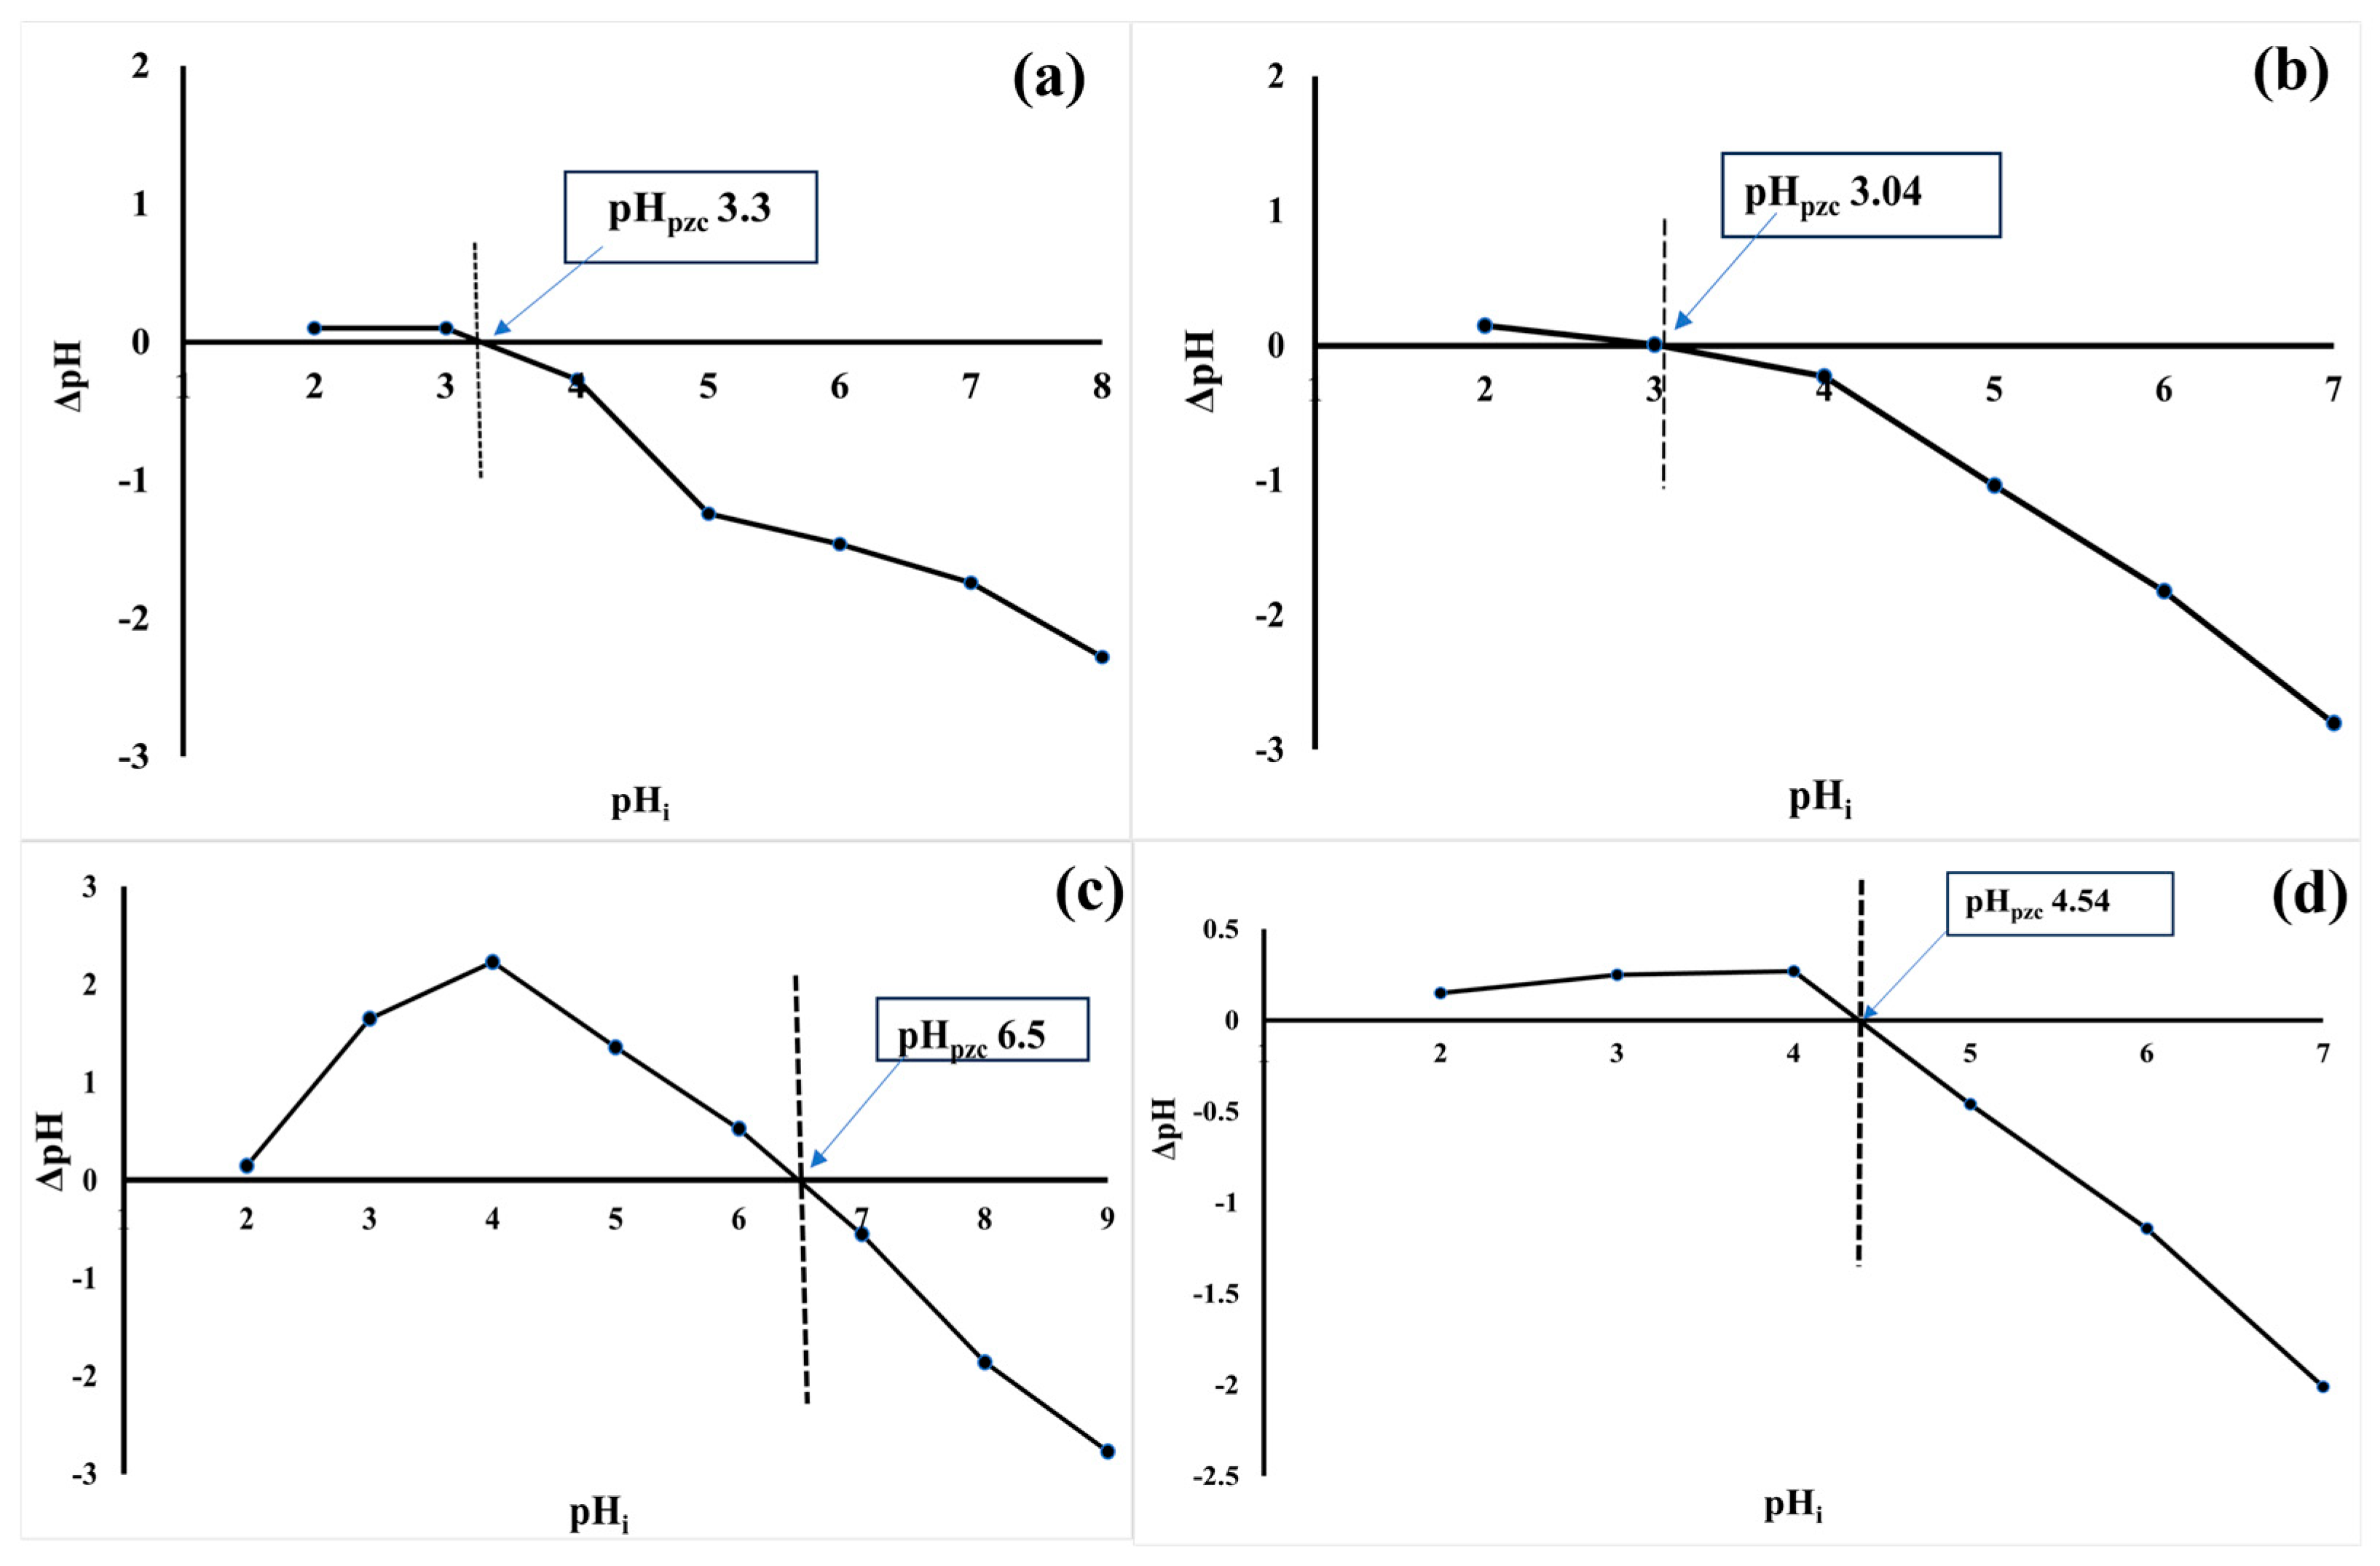
In Figure 8a, the pHpzc for GO-MCC–50 µm was approximately 3.3, while the pHpzc of GO-MCC–90 µm was about 3.04 (Figure 8b). All pHpzc values for the prepared composites are shown in Table 1. These pHpzc values are mainly attributed to the abundance of oxygen-containing functional groups on graphene oxide, such as carboxyl and phenolic groups. MCC provides hydroxyl groups, and the sodium activation step enhances surface accessibility and promotes partial deprotonation of the carboxyl groups on GO, increasing the overall density of negatively charged sites. These factors result in a high negative charge, which requires a strongly acidic medium for neutralization. In previous studies, Dipannita et al. analyzed the pHpzc of carboxymethylcellulose-functionalized magnetic graphene oxide as an adsorbent for tetracycline from aqueous media, finding a pHpzc of around 3.5. [59]. Allouss et al. reported that CMC-based hydrogels also have a similar pHpzc of 3.5 [60]. Both studies focus on the combination of GO and CMC in basic media (NaOH). The difference in pHpzc values for the two MCC composites could be explained by changes in the relative exposure of acidic functional groups on the GO surfaces embedded in the MCC matrix with increasing particle size [61]. Improved GO–MCC interfacial interactions, such as hydrogen bonding between GO oxygen functionalities and MCC hydroxyls, and potential partial neutralization or shielding of acidic −COOH groups, probably lower the net acidity of the surface in more finely ground (50 µm) particles, increasing the pHpzc. In contrast, a higher percentage of GO may remain in more oxidized, less-interacted domains (with carboxyl and other oxygenated groups intact) in coarser (90 µm) particles, resulting in changes in surface charge and, consequently, a shift in pHpzc [62,63]. From Figure 8c, it can be seen that for GO–CS composites, the pHpzc value is around 6.5, indicating a neutral surface charge for graphene oxide and chitosan nanocomposites. The material’s surface charge is net neutral at this specific pH, as the positive charges from chitosan balance the negative charges from graphene oxide, resulting in a neutral surface. However, at a solution pH below 6.5, the surface of the composite is positively charged due to protonated amine groups from chitosan, which favors the adsorption of anionic pollutants. On the other hand, at pH above 6.5, deprotonated carboxylic and hydroxyl groups from GO result in a negatively charged surface, favoring the adsorption of cationic species. For example, Promkatkaew, Srisuratsiri et al. prepared GO–chitosan composites for effluent removal, and the pHpzc of the composites was found to be around 6.53 [64]. In another study, for the removal of chromium and methyl orange, Hamad (2025) synthesized a chitosan-modified GO adsorbent, with a pHpzc also found to be around 6.01 [65]. Materials with a neutral surface charge at pHpzc ≈ 6.5 typically show flexible adsorption behavior based on the pH of the ambient environment and the pollutant charge. In contrast, under natural environmental water conditions, materials with a neutral surface charge and pHpzc values of ≈3.0–3.3, such as GO–MCC, have higher densities of deprotonated sites at moderate pH values from 5 to 8, making them more effective at adsorbing cationic pollutants.
Polyethylene surfaces are generally negatively charged at pH levels above 2.5 [66]. Recent publications report that the point of zero charge for polyethylene (PE) nanoplastics typically ranges from 2.5 to 3.2 [67]. However, the surface charge of PE particles can be influenced by preparation method, surfactant, particle size, and degree of degradation, which may alter surface functional groups, morphological heterogeneities, and surface charge characteristics [68,69,70]. In the present study, the pHpzc of the prepared PE–NPs was determined to be 4.54. This relatively higher pHpzc value may be attributed to differences in the synthesis procedure and resulting surface properties of the nanoplastics. Since PVA was used as a stabilizer during nanoparticle synthesis, trace amounts of residual PVA may remain on the PE-NP surface despite repeated washing steps. Residual PVA could contribute hydroxyl-containing surface functionalities and may partially influence the measured pHpzc. The absence of characteristic PVA bands in the FT-IR spectrum suggests that the washing procedure effectively removed most of the stabilizer from the PE nanoplastic surface. Although characteristic PVA bands were not detected by FTIR, the presence of trace amounts of surface-associated PVA cannot be completely excluded. Since the pHPZC is below environmentally relevant pH values, the nanoplastics are expected to possess a net negative surface charge at pH > 5, which can significantly influence their aggregation behavior, transport dynamics, and sorption processes in aqueous environments and adsorption behavior.

3.2.2. Effect of pH

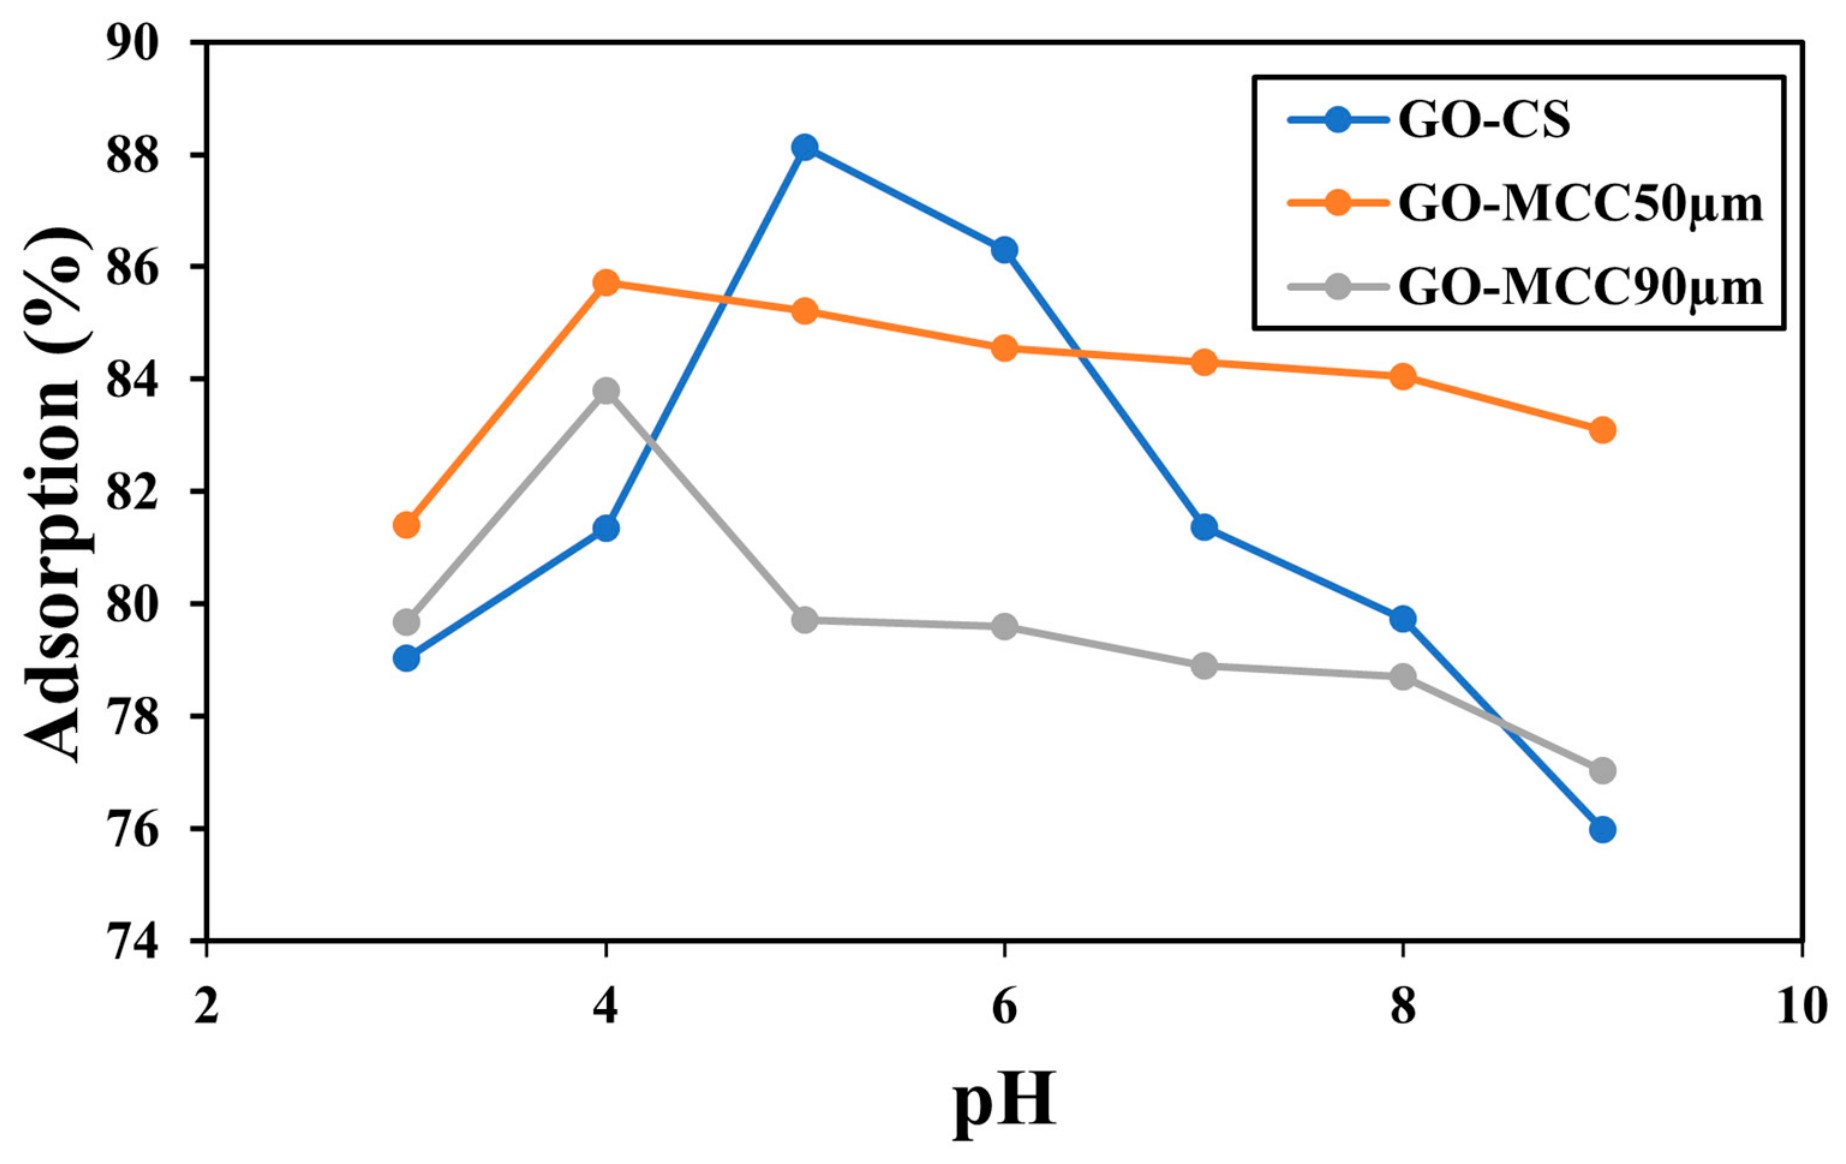
The pH plays a crucial role in adsorption performance by influencing the surface charge of nanoplastics and adsorbents [17]. In this study, results prove that the adsorption behavior of GO–CS, GO–MCC–50 µm and GO–MCC–90 µm composites on PE–NPs was strongly pH–dependent as shown in Figure 9.
For the GO–CS composite, it can be seen from the Figure 8 that maximum adsorption of around 88.12% occurred at pH 5. The pHpzc of GO–CS was determined to be 6.5, indicating that the composite surface is positively charged at pH values lower than this point. Since the pHpzc of PE–NPs is approximately 4.54, the nanoplastics tend to carry a negative surface charge at pH values above this value. Therefore, at pH 5, electrostatic attraction between the positively charged GO–CS surface and negatively charged PE–NPs promotes enhanced adsorption. Similarly, pH-dependent adsorption performance has been extensively observed in systems based on graphene oxide and chitosan, where maximum adsorption typically occurs in mildly acidic conditions due to favorable surface charge interactions [24]. These investigations demonstrate that protonation of functional groups at a less acidic pH increases adsorption capacity, which is in line with the trends obtained from this study. These results are consistent with another study on chitosan-based adsorbents, which found that the pH range of 4–6 was best for the adsorption of negatively charged species because of the protonation of amino groups (–NH3+), which increased electrostatic attraction [20]. Although the changes in adsorption percentage across the investigated pH range were relatively small, the observed trends were consistent across replicate experiments, and the variation remained within the experimental error (±5%).
In contrast, for GO–MCC–50 µm and GO–MCC–90 µm composites, maximum adsorption of 85.70% and 83.80% was observed at pH 4 respectively. At pH values slightly higher than their pHpzc, the composite surfaces become weakly negatively charged; however, significant adsorption was still observed, indicating that mechanisms other than electrostatic attraction contribute to the adsorption process. Similar results have been noted for graphene oxide and cellulose-based composites, where adsorption continues even in electrostatically unfavorable circumstances, indicating the role of non-electrostatic interaction [71]. This suggests that decreased electrostatic attraction can be made up by surface chemistry and structural heterogeneity. In particular, the hydrophobic nature of polyethylene nanoplastics may promote hydrophobic interactions with the graphene–oxide surface, while additional Van der Waals forces and possible surface interactions may also contribute. According to previous research on micro- and nanoplastic adsorption, hydrophobic interactions between polymer chains and graphene-based materials have been identified as dominant mechanisms, particularly for nonpolar pollutants [72]. Overall, the adsorption effectiveness declined as pH increased, and pH 5 was determined to be the optimum range for GO–CS research in the future. Cellulose composite experiments were conducted at pH 4. The literature indicates that increasing alkalinity causes surface deprotonation, increased electrostatic repulsion, and competition with hydroxide ions for active sites [73], which is also consistent with the decrease in adsorption at higher pH values.

3.2.3. Effect of Adsorbent Dose

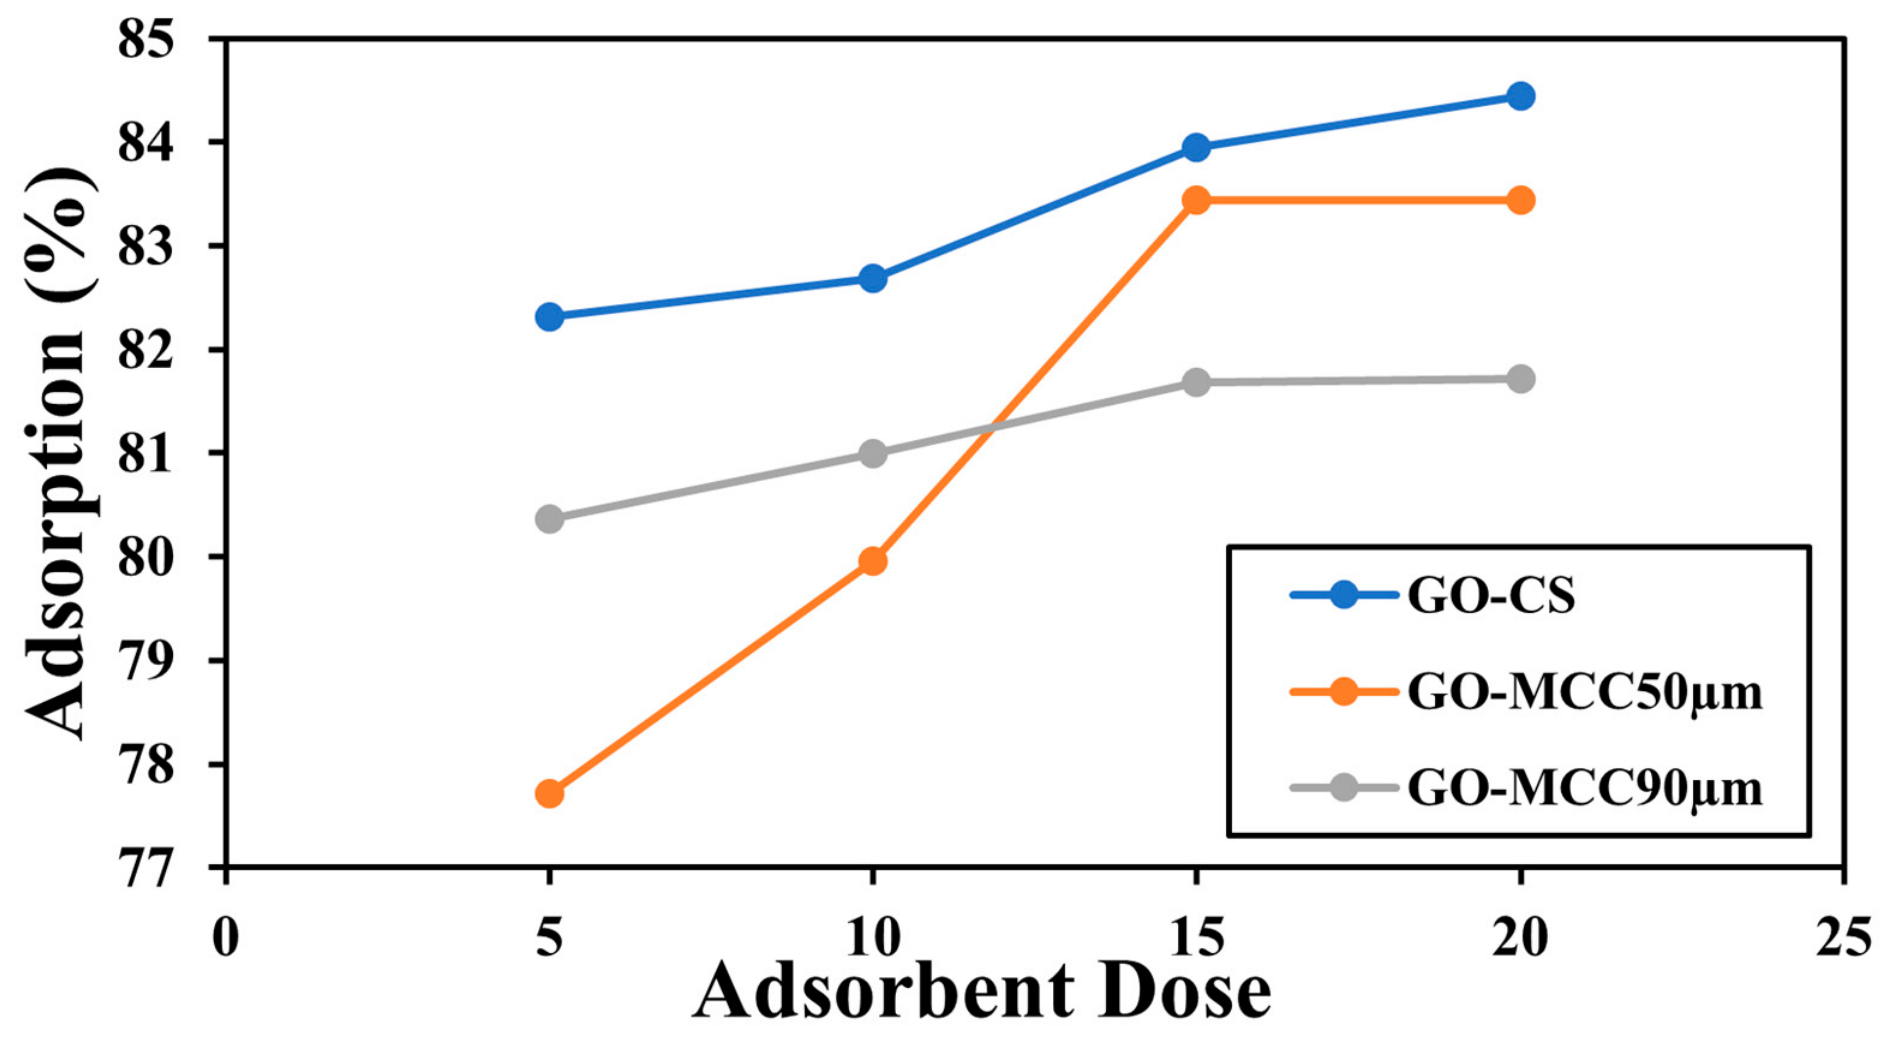
The ability of the adsorbent to bind an adsorbate is determined by the dosage of the adsorbent at a particular initial concentration of adsorbate [74]. Therefore, by varying the dose of each GO–CS, GO–MCC–50 µm and GO–MCC–90 µm composite, a change in adsorption percentage was recorded. The adsorption of PE–NPs was steadily increased from 82.30 to 84.43% with each addition of GO–CS. In case of GO–MCC–50 µm, the adsorption percentage changed from 77.71 to 83.43%. While for GO–MCC–90 µm composite, it changed from 80.36 to 81.71% as shown in Figure 10. It appears that increasing the dosage of GO–CS, GO–MCC–50 µm, and GO–MCC–90 µm composite leads to an increase in active sites and sufficient surface area. As a result, the adsorption of PE–NPs was improved by increasing the dose of GO–CS, GO–MCC–50 µm, and GO–MCC–90 µm composite up to 0.15 g. Nevertheless, no appreciable increase in adsorption was observed above 0.15 g, which may be the consequence of overlapping or spatially obstructing active regions when an excessive quantity of adsorbent is present. Other adsorption studies for GO-composites also suggest that due saturation of pollutant particles on active sites of adsorbent, the increase in adsorption percentage is negligible [75].
The difference in percentage adsorption for both cellulose composites is related to the difference in particle size. As smaller particles have a larger surface area-to-volume ratio and better diffusion toward active sites, which results in more effective contact with the adsorbent surface, a decrease in pollutant particle size often increases adsorption capacity. Other studies by Liu, Miao et al. have explained that particle size has an effect on the adsorption mechanism [76].

3.2.4. Effect of Initial Concentration

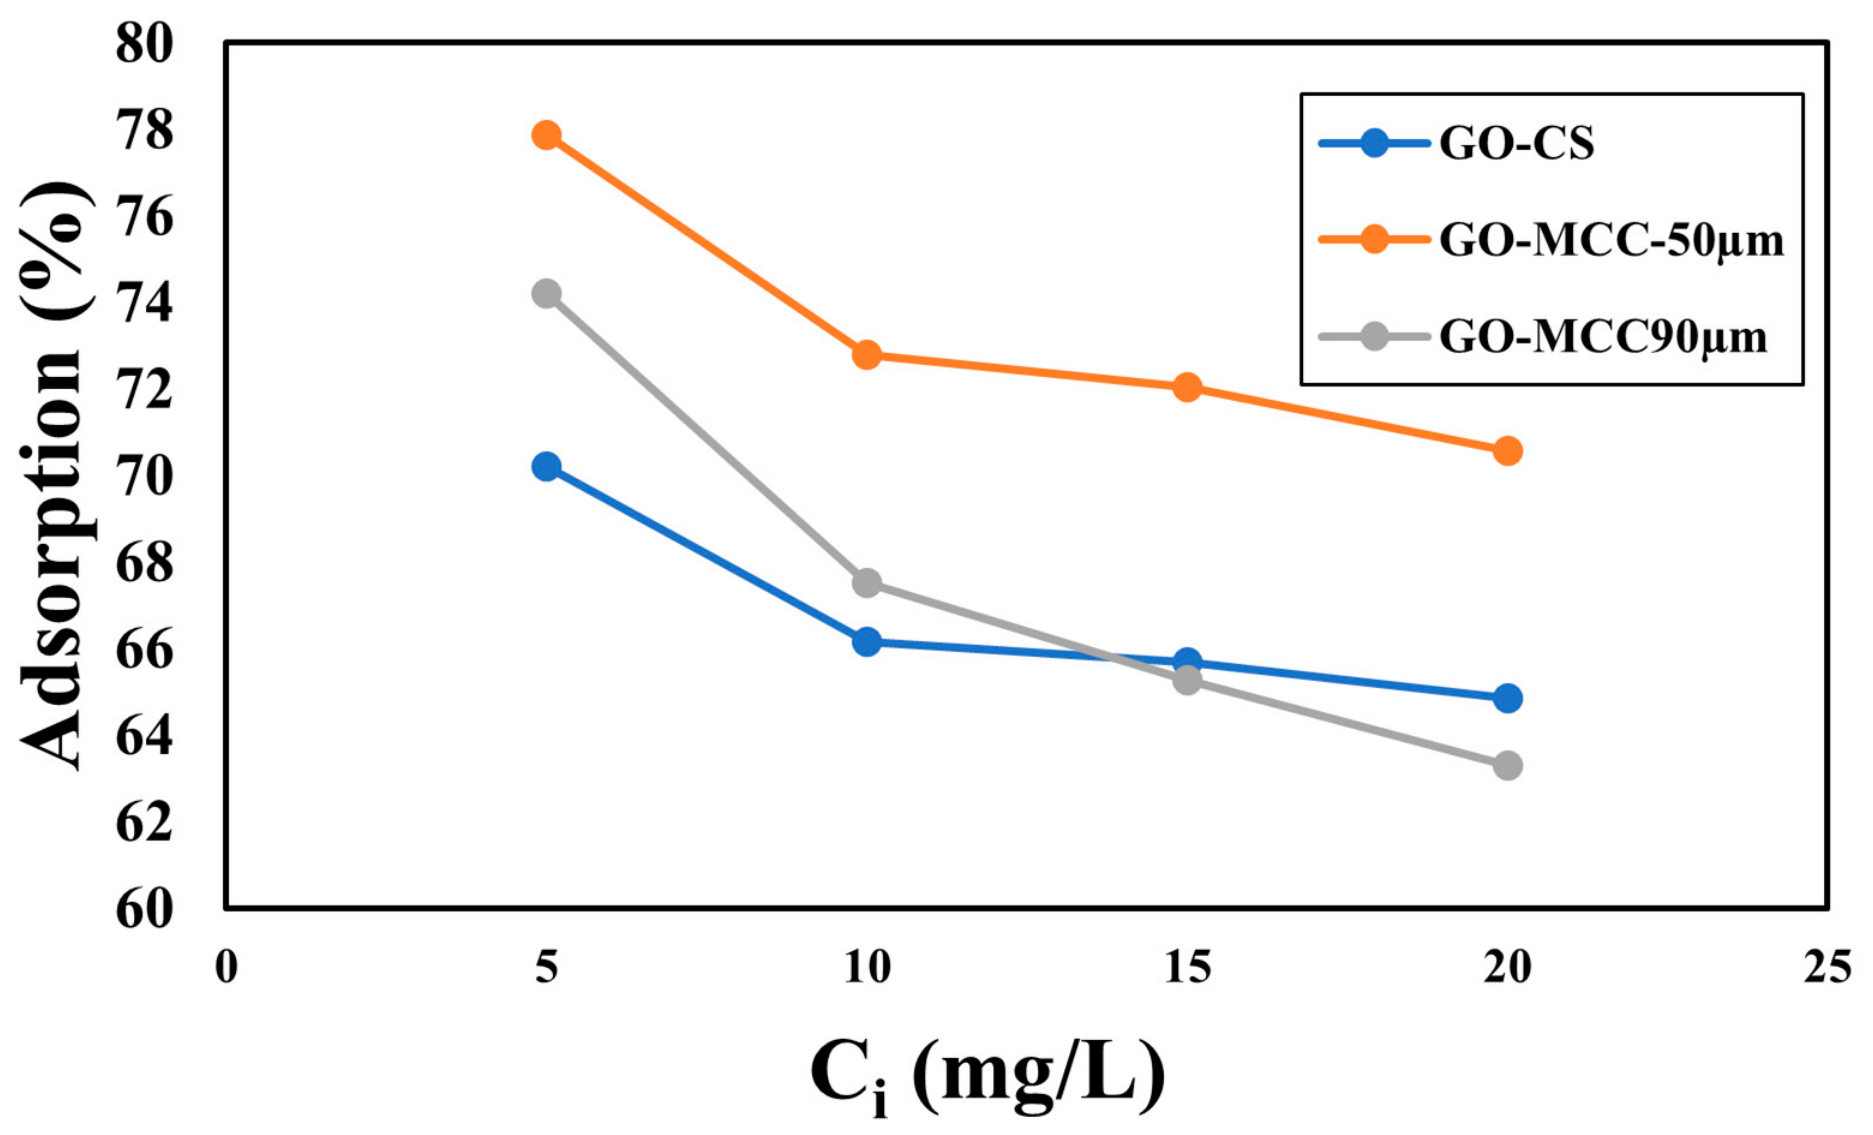
Adsorption capacity has been widely acknowledged to be significantly impacted by the starting concentration [77]. It can be seen from Figure 11 that the adsorption of PE–NPs onto GO–CS (70.21%), GO–MCC–50 µm (77.857%), and GO–MCC–90 µm (74.21%) composites was higher at low initial concentration. However, the adsorption steadily decreased as the initial concentration of PE–NPs increased. The highest adsorption was seen at low initial concentration because the number of PE–NPs molecules at the start of adsorption was less than the accessible sites of GO–CS, GO–MCC–50 µm, and GO–MCC–90 µm composites. In contrast to accessible sites on GO–CS, GO–MCC–50 µm, and GO–MCC–90 µm composites, the number of PE–NPs molecules at higher starting concentrations increased, which led to a regular decline in PE–NP adsorption. Similar results have been observed for adsorption and the initial concentration effect [78]. It should be noted that the PE-NP concentrations employed in this study (5–20 mg L−1) are substantially higher than concentrations typically reported in natural aquatic environments. These concentrations were selected to facilitate adsorption, kinetic, and equilibrium investigations under controlled laboratory conditions and to evaluate the proof-of-concept performance of the synthesized adsorbents.

3.2.5. Effect of Contact Time

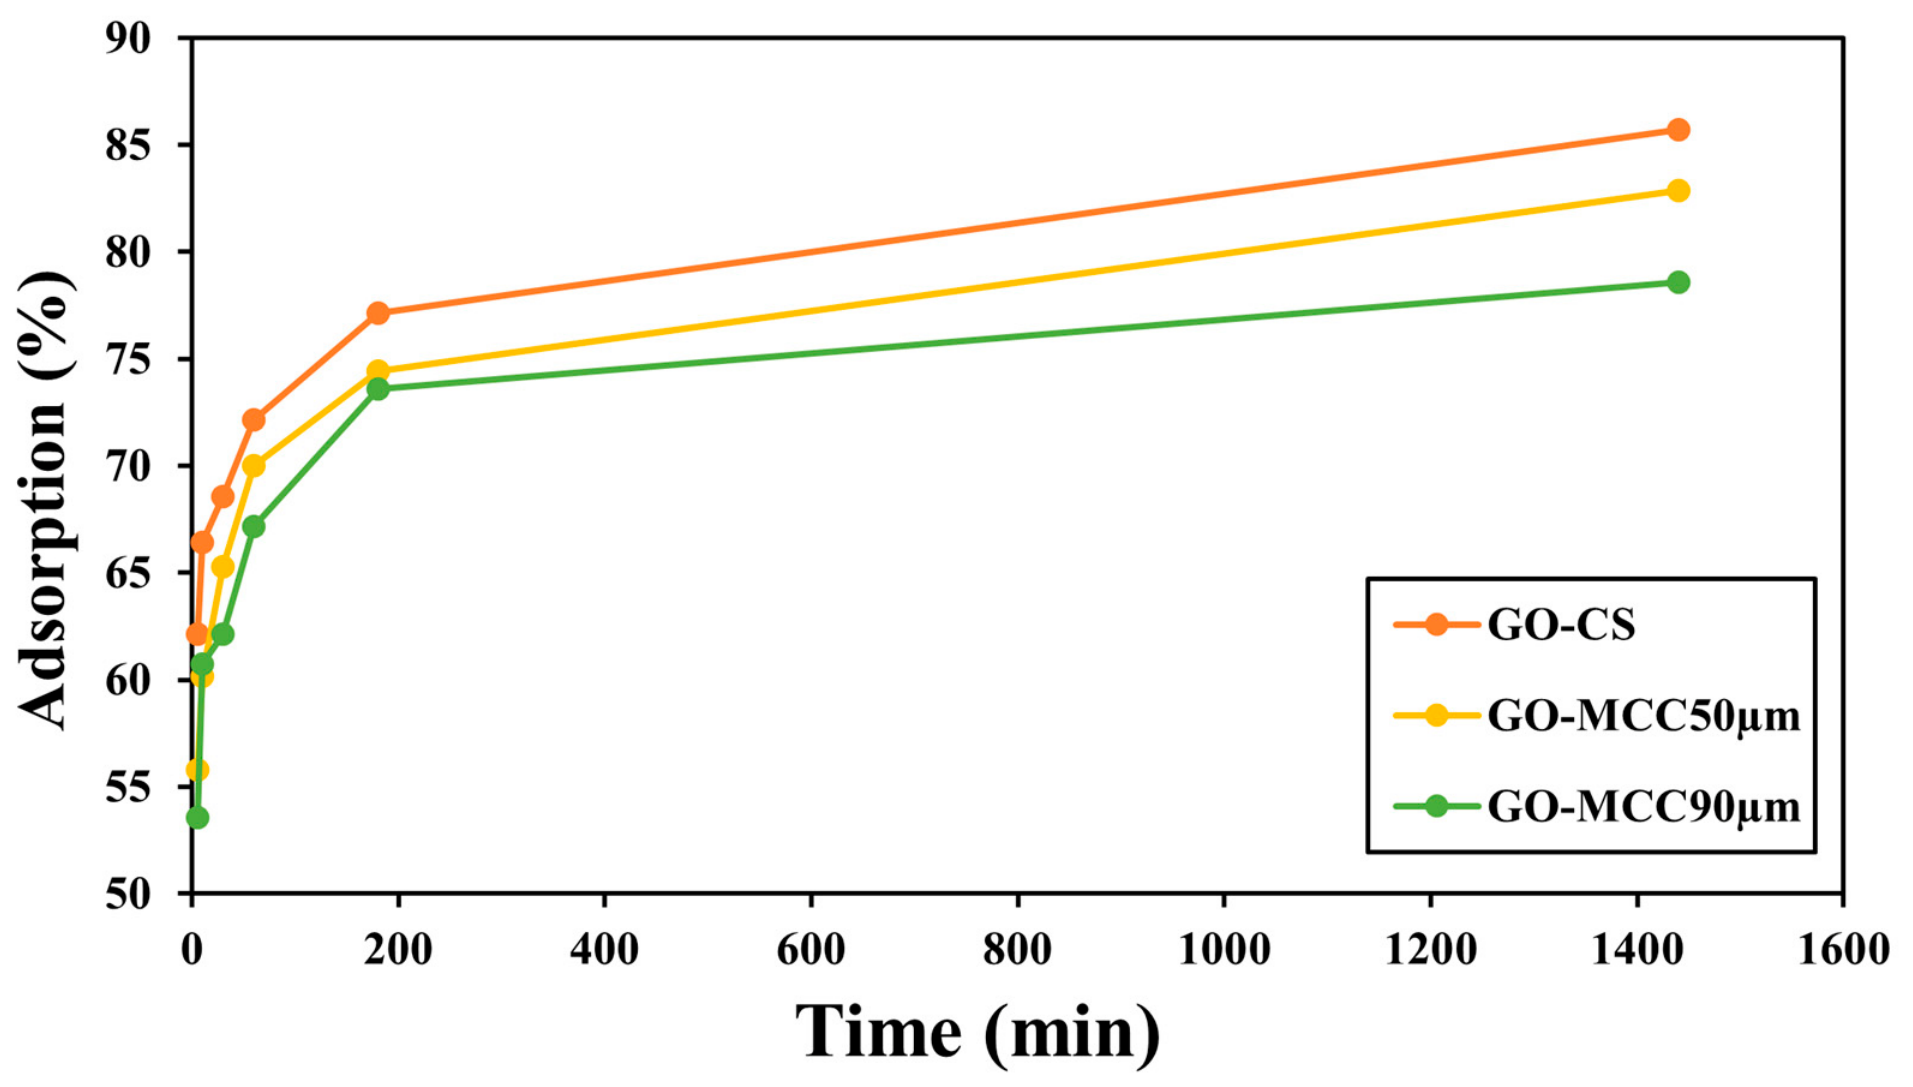
The duration of contact has a major impact on the sorption phenomena [79]. Thus, the contact time was varied from 5, 10, 30, 60, 180 min, and 24 h in order to examine the dependence of sorption of PE–NPs on time. The outcome is shown in Figure 12, which shows that stirring up to 24 h increased the sorption of PE–NPs onto GO–CS, GO–MCC–50 µm, and GO–MCC–90 µm composites.
However, the fact that maximum adsorption was observed after 24 h indicates that all active sites were occupied [80]. These results indicate that the maximum adsorption percentage was observed by GO–CS composites of around 85.71%. It might be explained by the fact that GO–CS has more amine and hydroxyl groups than GO–MCC composites, as well as better surface area and pore accessibility, all of which boost adsorption. Among cellulose composites, GO–MCC–50 µm has shown a better adsorption percentage of 82.85% than GO–MCC–90 µm of 78.57% due to a smaller particle size. Li et al. have already observed that as there is an increase in the initial concentration of analyte, the competition for active sites increases, leading to a lower adsorption percentage [81]. It should also be noted that substantial adsorption occurred during the first 30–60 min but equilibrium was reached after approximately 24 h. This behavior suggests that rapid adsorption initially occurs on readily accessible external active sites, followed by a slower stage associated with diffusion into internal pores and less accessible adsorption sites.

3.2.6. Effect of Temperature

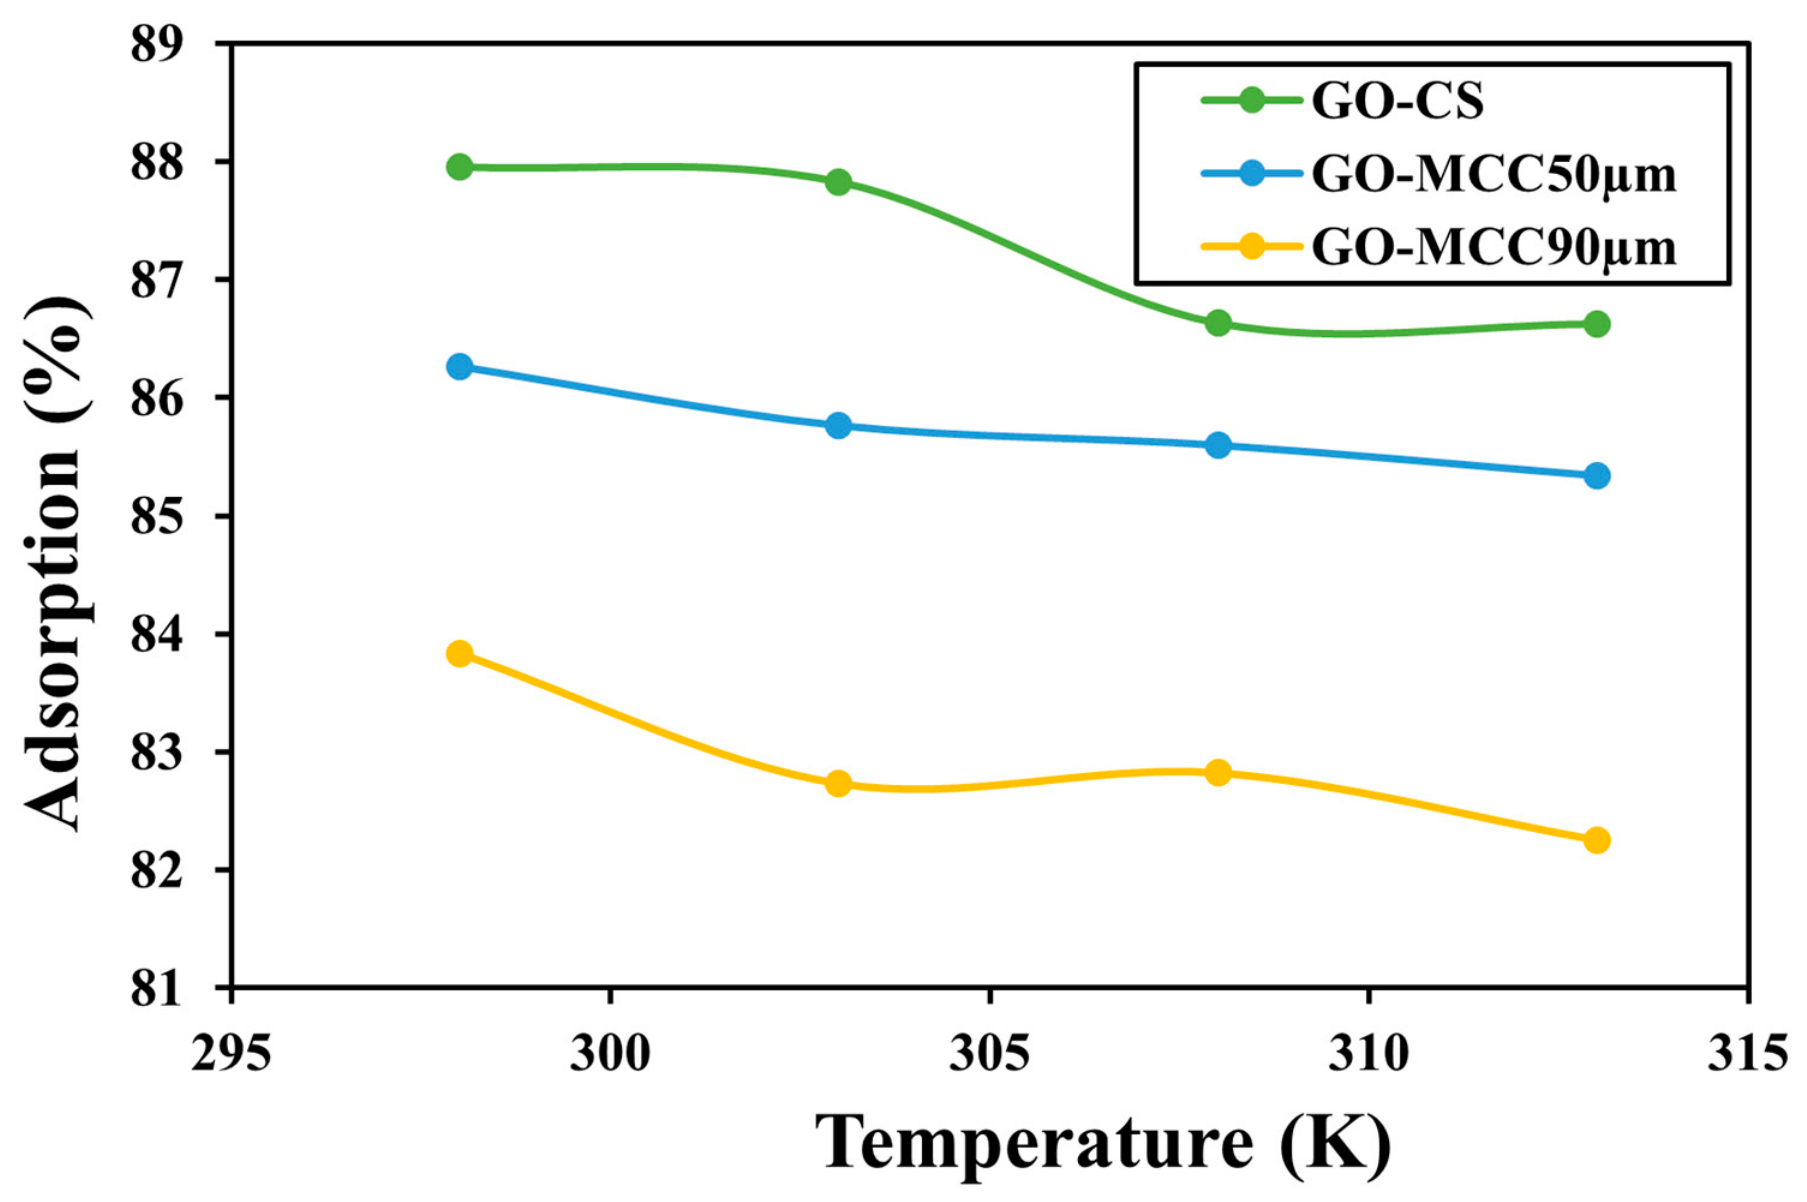
The adsorption process is greatly influenced by temperature [82]. As a result, the adsorption of PE–NPs onto GO–CS, GO–MCC–50 µm, and GO–MCC–90 µm for temperatures between 298 and 313 K is shown in Figure 13. In the case of GO–CS composites percentage decreased from 87.95 to 86.62%. While for GO–MCC–50 µm 86.26 decreased to 85.34% and for GO–MCC–90 µm 83.83 to 82.25%. The adsorption gradually decreased as the temperature increased. PE–NPs molecules readily moved from the surface of the composites to the solution phase when the temperature rose because the boundary layer thickness decreased. The reduction in adsorption as the temperature rises indicates that the process is exothermic because the interactions between PE–NPs and the composite surfaces decrease by increasing thermal energy, which reduces surface binding. Another study done by Ebisike et al. also presented similar results; whereas temperature increased, a decline in adsorption was recorded [77].

3.3. Adsorption Isotherm Modeling

The interface between the adsorbent and adsorbate at a specific temperature is demonstrated by the adsorption isotherm. Adsorption isotherms are therefore crucial for optimizing the use of adsorbents. Plotting the amount of adsorbate in the solid phase against the amount of adsorbate in the liquid phase is likely to illustrate the equilibrium adsorption isotherm. In this case, the adsorption data of PE–NPs were analyzed using Freundlich and Langmuir models.
One of the first known empirical formulas that shows invariability upon an exponential dispersal of adsorptive sites on a heterogeneous substrate is the Freundlich isotherm [74]. Multilayer adsorption on heterogeneous substrates typically uses this isotherm. The following expression explains it:
l o g q e = l o g K F + 1 n l o g C e
In this case, qe (mg·g−1) represents the quantity of PE–NPs adsorbed onto GO–MCC–50 µm, GO–MCC–90 µm composites, and GO–CS; KF (mg·g−1) represents the adsorption capacity; Ce (mg·L−1) represents the equilibrium concentration of PE–NPs; and 1/n represents the adsorption intensity. Values of 1/n are known to provide information about the different types of isotherms. While in the case of 1/n < 0, the isotherm is supposed to be irreversible; and for 1/n > 0, it should be necessary; and in the case of 1/n > 1, it should be unfavorable [58].
The Langmuir isotherm illustrates that adsorption takes place as a monolayer over a homogeneous surface composed of a few available sites that are roughly equivalent to one another [83]. The degree to which adsorptive active sites are filled has little effect on adsorption energy. This isotherm’s empirical formula is as follows:
C e q e =   1 q m a x K L + C e q m a x
The amount for PE–NPs adsorbed onto GO–MCC–50 µm, GO–MCC–90 µm and GO–CS composites is indicated by qe (mg·g−1), the maximum adsorption capacity is revealed by qmax (mg·g−1), the concentration of PE–NPs at equilibrium is indicated by Ce (mg·L−1), and the adsorption energy is linked to KL (L·mg−1). The separation factor (RL), a dimensionless constant, can be used to illustrate one of the most significant features of the Langmuir isotherm. The following formula can be used to determine the magnitudes of RL:
R L =   1 1 + K L C i
Here, the Langmuir constant is denoted by KL (L·mg−1), and the initial concentration of PE–NPs is indicated by Ci (mg·L−1). The slope and intercept of linear plots of isotherms were used to calculate all of the coefficients of each isotherm; the coefficients’ magnitudes are shown in Table 2.
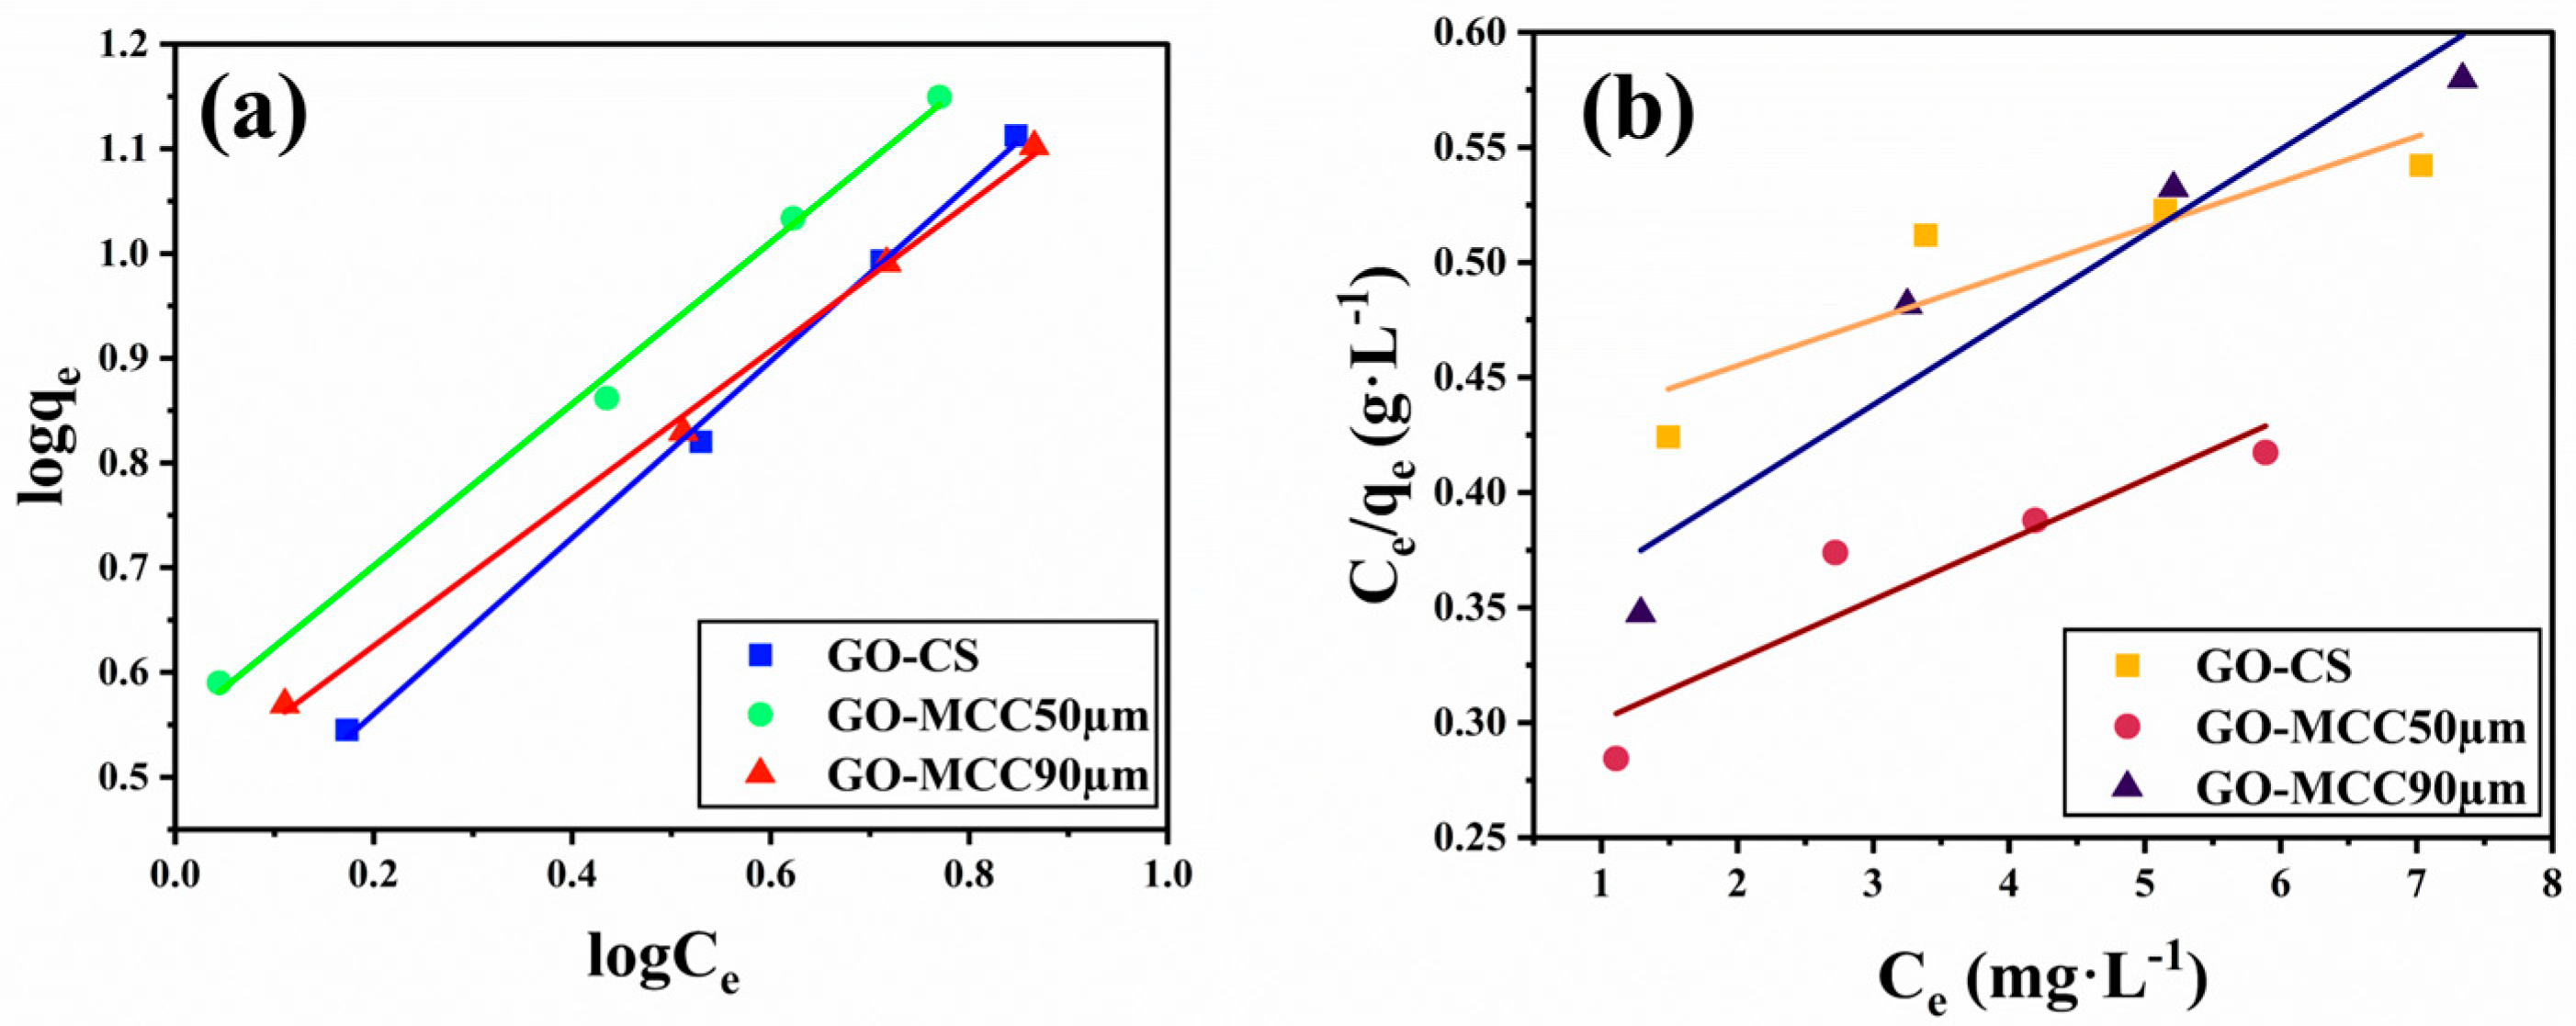
The Langmuir model assumes monolayer adsorption on a homogeneous surface containing a finite number of identical adsorption sites, whereas the Freundlich model describes adsorption on a heterogeneous surface with non-uniform adsorption energies. A comparison of the isotherm parameters (Figure 14) showed that the Freundlich model provided a better fit to the experimental data than the Langmuir model. This suggests that PE–NPs adsorption occurred on the heterogeneous surfaces of the GO–CS and GO–MCC composites, which contain multiple types of adsorption sites originating from graphene oxide, chitosan, and microcrystalline cellulose functional groups.
The suitability of the adsorption isotherm models used in the current investigation can be evaluated from the correlation coefficients and isotherm constant magnitudes. The Freundlich model exhibited higher R2 values (0.996–0.997) than the Langmuir model (0.819–0.919), indicating that adsorption occurred on heterogeneous surfaces with non-uniform adsorption energies. A comparison of the maximum adsorption capacities revealed that GO–CS exhibited the highest adsorption capacity compared with GO–MCC–50 µm and GO–MCC–90 µm composites, which may be attributed to the greater availability of active adsorption sites and functional groups. Furthermore, the separation factor (RL) values ranged between 0 and 1 for all adsorbents, indicating favorable adsorption of PE–NPs onto the prepared composites. Based on the isotherm analysis, the Freundlich model was considered the most appropriate model for describing PE–NPs adsorption in this study. The results suggest adsorption on a heterogeneous surface through multiple physical interactions rather than ideal monolayer adsorption on a perfectly homogeneous surface.
Since the adsorption is advantageous when (0 < RL <1), unfavorable when (RL > 1), linear when (RL = 1), or irreversible when (RL = 0) [74]. From Table 2, it can be seen that the separation factor values range from 0 to 1, indicating that the adsorption process of PE–NPs onto all three composites is favorable.

3.4. Adsorption Kinetics Modeling

The kinetics modeling of the adsorption mechanism can be used to assess the mechanics of nanoplastic adsorption. It also aids in the investigation of the mechanisms—such as mass transfer, diffusion control, or chemical reactions—that control the adsorption process [80]. The volume of adsorbate adsorbed on the adsorbent surface is described by the adsorption kinetics, which therefore regulates the amount of time the adsorbate spends at the interface between the adsorbent and solution [84]. The adsorption data were analyzed using pseudo-first-order, pseudo-second-order, and intraparticle diffusion models in an attempt to investigate the control mechanism of the PE–NPs adsorption onto GO–MCC–50 µm, GO–MCC–90 µm composites, and GO–CS.
The pseudo-first-order model was initially presented by Lagergren, who used it to calculate the rate constant based on the adsorption capacity. According to this model, adsorption capacity varies with the rate at which the adsorbate is removed in relation to contact time [84]. This model can be seen in the following relationship:
l o g q e q t = l o g q e k 1 t 2.303
The rate constant of the pseudo-first-order kinetic model is denoted by k1 (min–1), the adsorption capacity at equilibrium is denoted by qe (mg·g−1), and the adsorption capacity at time t is denoted by qt (mg·g−1).
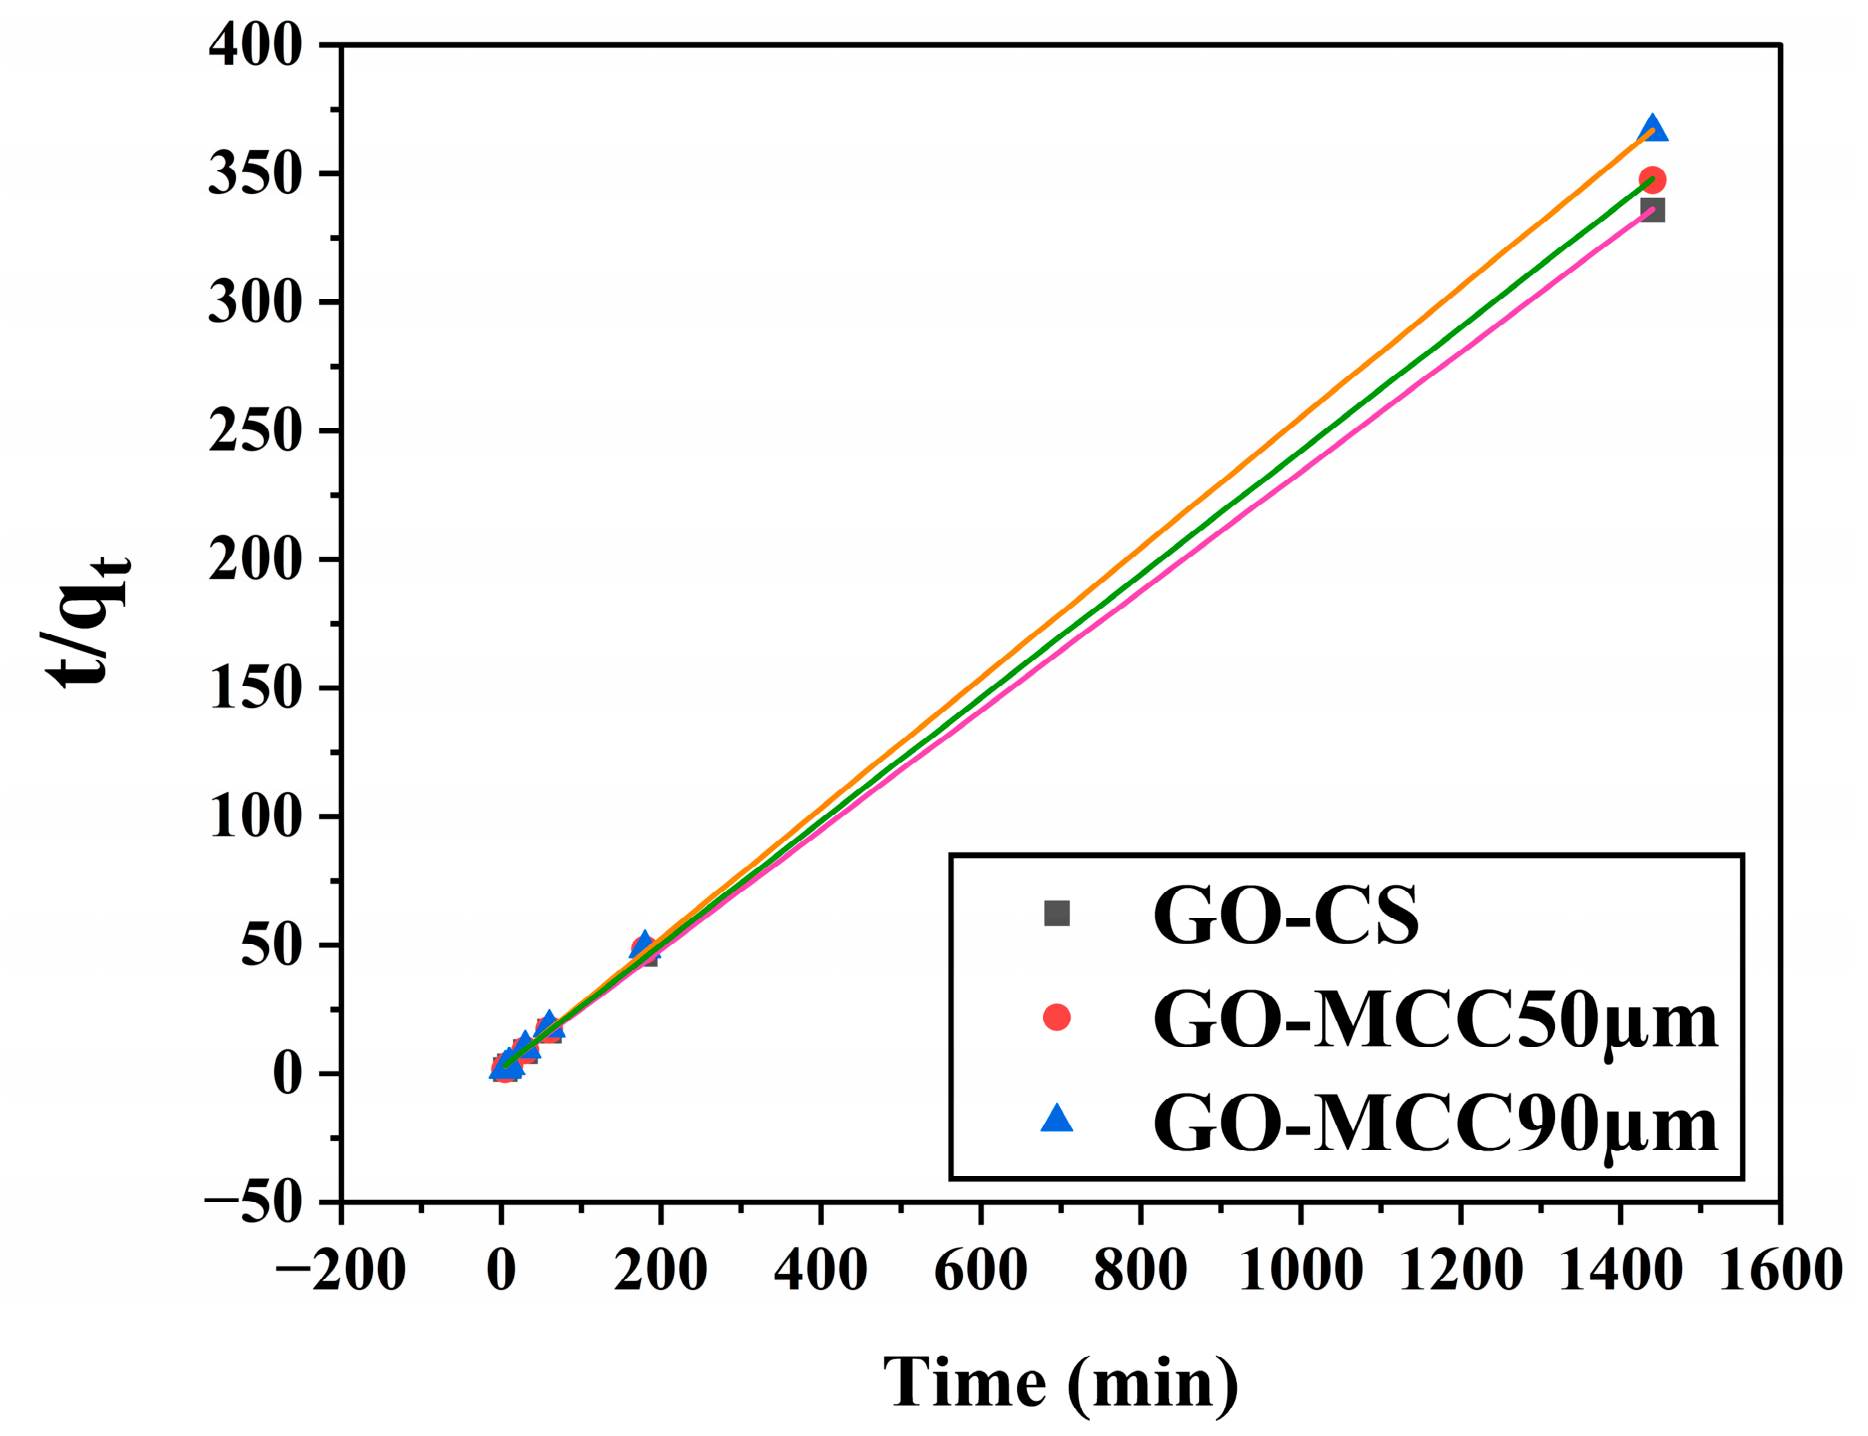
The pseudo-second-order model proposed by Ho and Mckay is based on the prediction of adsorption performance across the full adsorption time. A good fit of the pseudo-second-order model suggests a chemisorption mechanism [80]. The model’s mathematical representation is shown below:
t q t =   t q e +   1 k 2 q e 2
Here, qe (mg·g−1) represents adsorption capacity at equilibrium, qt (mg·g−1) signifies adsorption capacity at time t, and k2 (g·mg−1·min−1) represents the rate constant of the pseudo-second-order kinetic model.
The intraparticle diffusion model, which was developed by Morris and Weber, is typically used to determine the diffusion mechanism of the adsorption process. The adsorption process involves a number of processes, including the transfer of adsorbate from the bulk solution to the exterior surface surrounding the adsorbent, the transfer of adsorbate from the exterior surface to its interior sites, and the transfer of adsorbate from the interior sites to the interior surface of the adsorbent pores [74]. Moreover, intraparticle diffusion would be the rate-determining step if the plot of qt against t1/2 produced a straight line with zero intercept, according to Morris and Weber. This model can be expressed mathematically as the following relationship:
q t = K i d t 1 / 2 + C
Accordingly, Kid (g·mg−1·min−1/2) represents the intraparticle diffusion rate constant, while the boundary layer thickness is represented by C (mg·g−1).
In the plot of −ln(1 − F) against time is linear with zero intercept, the diffusion of adsorbate around the adsorbent would govern the sorption kinetics of PE–NPs [74]. Nevertheless, the intercept in our investigation is not zero, indicating that this model could involve additional mechanisms in addition to controlling the kinetics of the sorption of PE–NPs onto all three composites. The values of constant parameters were determined using each kinetic model’s slope and intercept, and the results are shown in Table 3. As shown in Table 3, the pseudo-second-order kinetic model exhibited the highest correlation coefficients (R2 ≈ 0.99) for all adsorbents (GO−CS, GO−MCC−50 μm and GO−MCC−90 μm) compared with the pseudo-first-order model. Furthermore, the equilibrium adsorption capacities (qe) calculated from the pseudo-second-order model were in close agreement with the experimentally determined values, indicating that this model adequately describes the adsorption kinetics of PE−NPs. The corresponding linear plots are presented in Figure 15 and were obtained using Equation (6).
The superior fit of the pseudo-second-order model suggests that surface interactions between the adsorbent and adsorbate play an important role in the adsorption process and that chemisorption may contribute to the overall adsorption mechanism. Similar behavior has been reported for graphene oxide- and polysaccharide-based adsorbents, where adsorption is influenced by interactions such as hydrogen bonding, electrostatic attraction, and other surface-related phenomena. Therefore, the kinetic results indicate that chemisorption is likely involved in PE−NPs adsorption, although the overall adsorption mechanism may result from the combined contribution of multiple adsorption processes.

3.5. Thermodynamic Study

The nature and mechanism of the adsorption process may be studied by evaluating thermodynamic parameters. These thermodynamic parameters including entropy, free energy, and enthalpy were calculated using the Van’t Hoff equation [85]. Thermodynamic parameters indicate disorder of the system, energy of interaction between adsorbate and adsorbent and spontaneity for standard entropy change (ΔS°), standard free energy change (ΔG°) and standard enthalpy change (ΔH°) respectively [77]. The following formulas were used to calculate these thermodynamic parameters:
K D =   q e c e
l n K D = Δ H 0 R T + Δ S 0 R
Δ G 0 = R T l n K D
Here, Kd stands for thermodynamic equilibrium constant, Ce (mg·L−1) for equilibrium PE–NPs concentration, qe (mg·g−1) for biosorption capacity, temperature as T (K) and gas constant as R, i.e., 8.314 J K−1·mol−1. The slope was used to calculate the magnitude of ΔH°, and the intercept of the plot of lnKD against 1/T was used to calculate the magnitude of ΔS°, which was reported in Table 4.
If the value for ΔG° is negative then adsorption is spontaneous and if the value of ΔG° is positive it is nonspontaneous [77]. A detailed analysis of the data suggests that the adsorption of PE–NPs onto GO–MCC–50 µm, GO–MCC–90 µm, and GO–CS composites is a spontaneous process because the values of ΔG° are negative. The exothermic character of PE–NPs adsorption onto GO–MCC–50 µm, GO–MCC–90 µm and GO–CS composites is shown by the negative value of ΔH° [85]. Generally, ΔG° values in the range of 0 to −20 kJ mol−1 are indicative of physisorption, whereas values between −80 and −400 kJ mol−1 are associated with chemisorption. The magnitude of the obtained ΔG° values is more consistent with physical adsorption than with the formation of strong chemical bonds. Therefore, the adsorption mechanism is likely dominated by weak intermolecular interactions, including hydrophobic interactions, van der Waals forces, hydrogen bonding, and, in the case of PS nanoplastics, possible π–π interactions between the aromatic rings of PS and the graphene oxide surface. Similarly, ΔS° was discovered to be negative, indicating a decrease in randomness after the adsorption of PE–NPs onto GO–MCC–50 µm and GO–MCC–90 µm. While in the case of GO–CS composites, ΔS° was discovered to be positive, indicating an increase in randomness confirming stronger attraction between PE–NPs and GO–CS composites [80].

4. Discussion

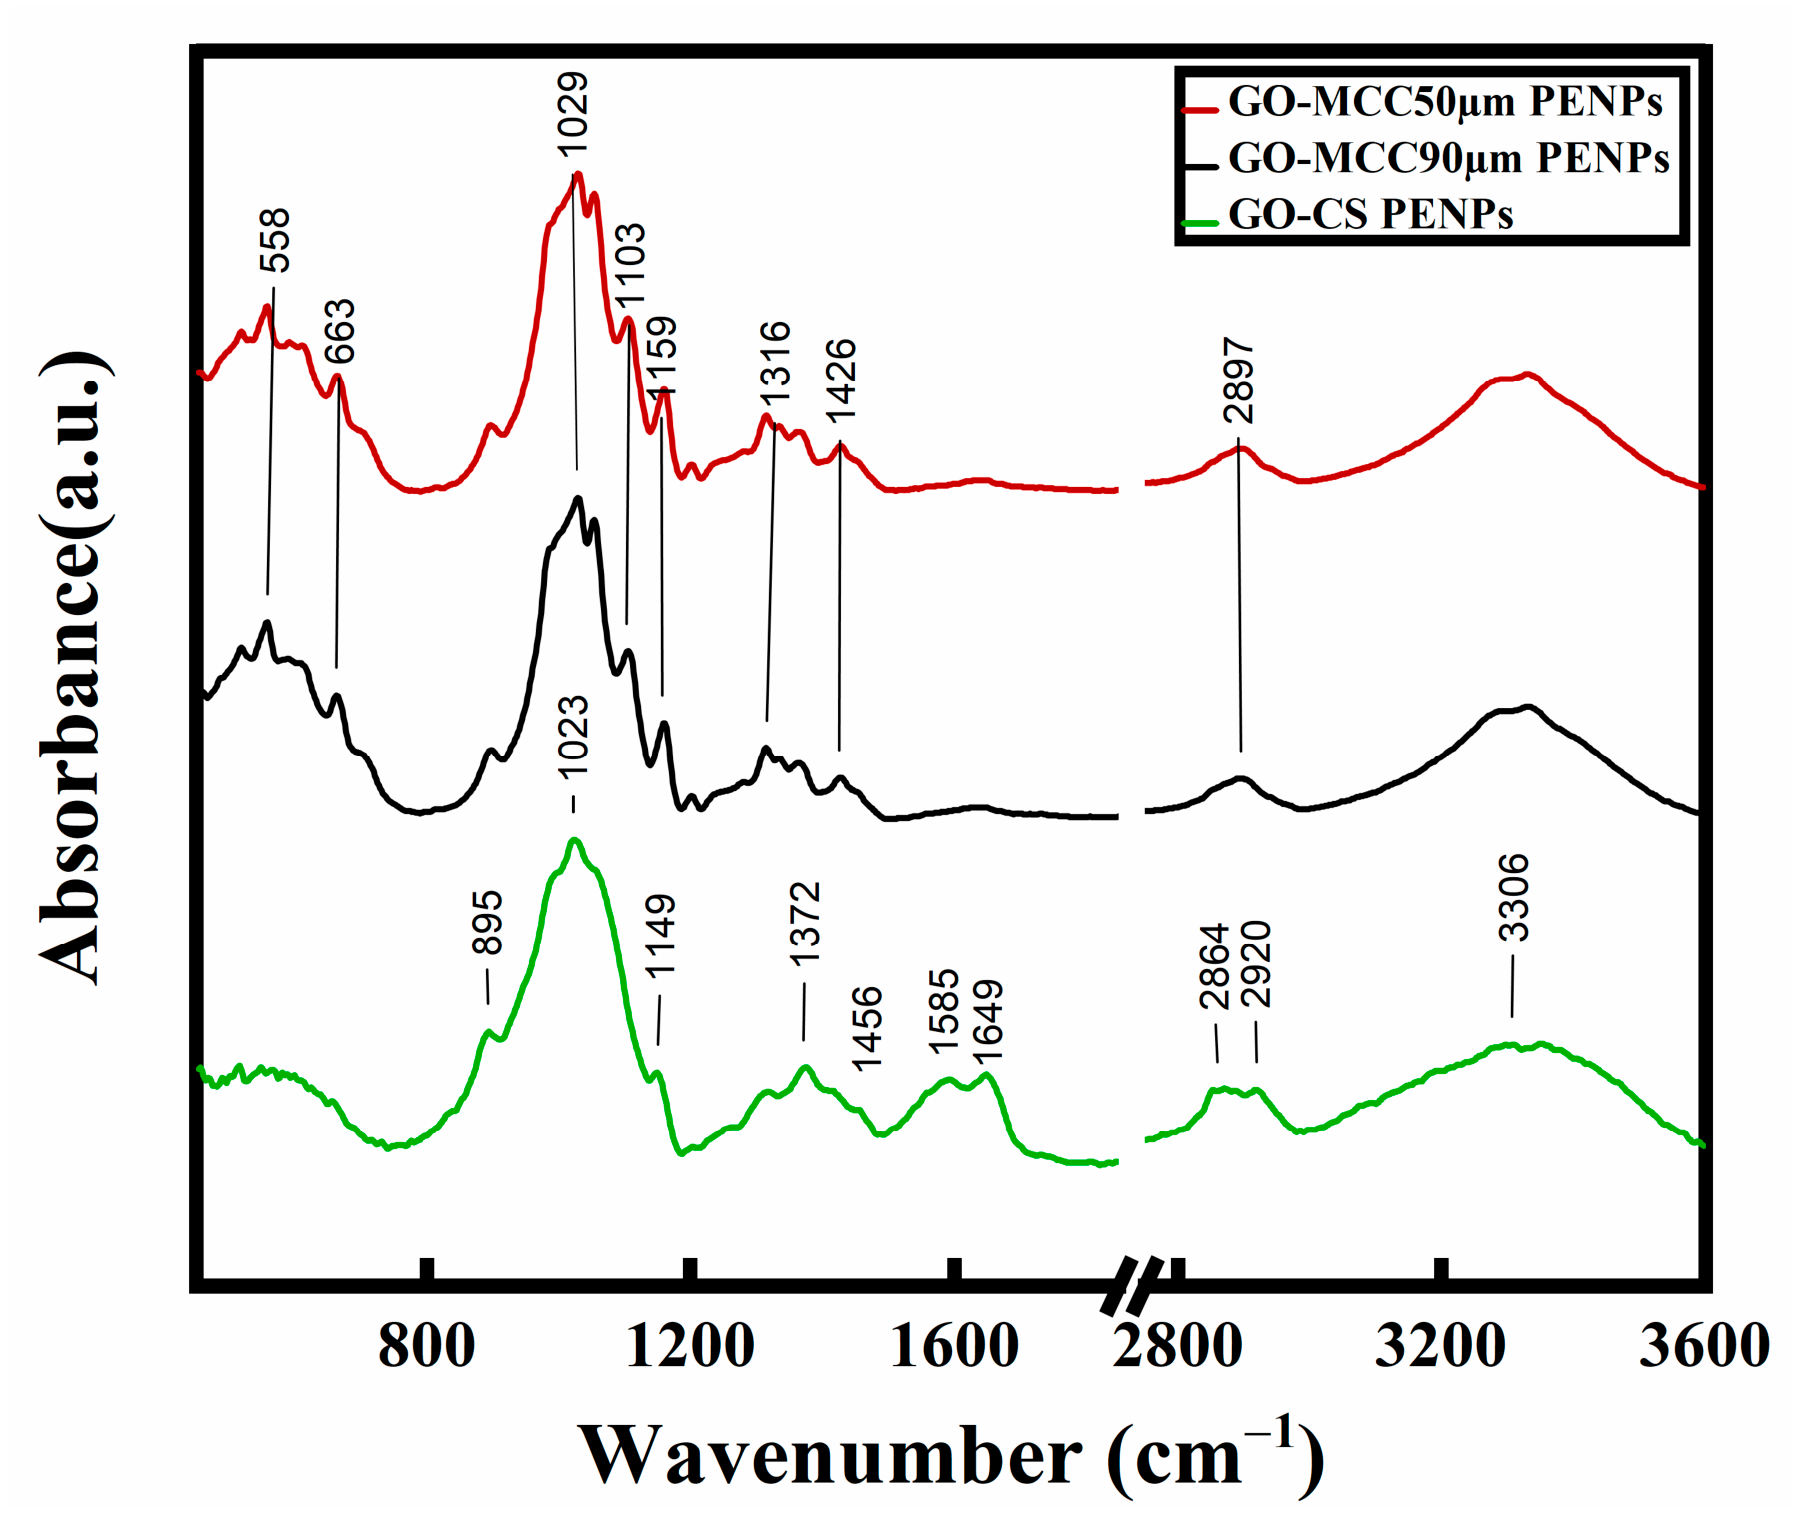
Polyethylene (PE) nanoplastics attach to graphene oxide GO–chitosan and GO–microcrystalline cellulose (MCC) composites through a combination of weak but compatible interactions governed by plastic hydrophobicity and surface chemistry [86]. The successful adsorption of PE–NPs onto GO–CS, GO–MCC–50 µm, and GO–MCC–90 µm was confirmed by FTIR analysis (Figure 16), which showed peak shifts, the appearance of new bands, and changes in intensity after adsorption. Notable changes included the emergence of PE-related bands at approximately 1456/1426 cm−1 and 2864–2920 cm−1, corresponding to polyethylene functional groups, confirming PE–NP surface attachment. Alterations in the carbonyl bands and the broad O–H stretching region indicated that hydroxyl and oxygen-containing groups participated in adsorption through surface contact (close proximity enhances all interactions), van der Waals forces (weak interactions between the PE backbone and adsorbent surface) and electrostatic interactions (–NH3+ groups of chitosan interact with negatively charged PE surfaces) and hydrogen bonding (–OH/–COOH groups form intermolecular bonds with oxidized PE). Minor modifications included band broadening, intensity changes, and slight shifts in the C–O and C–O–C bands.
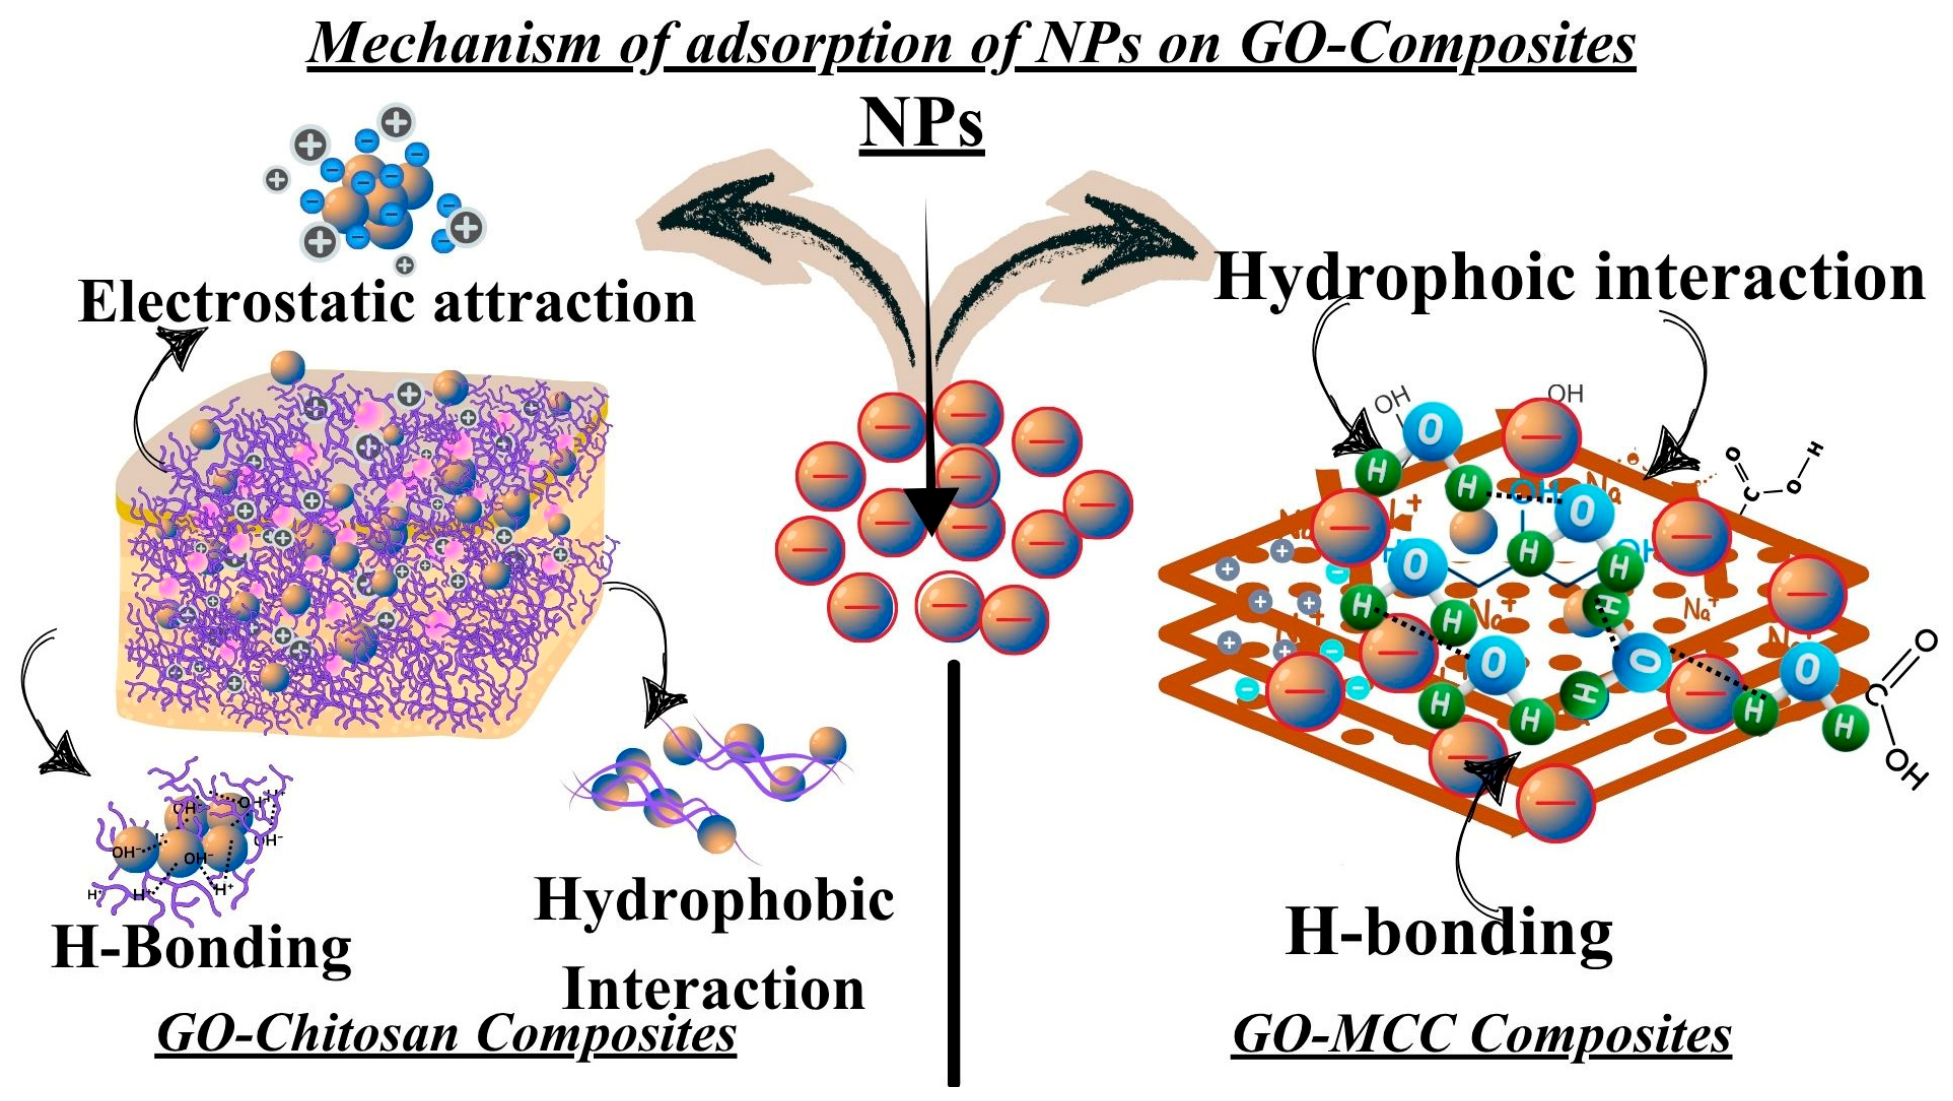
Recent studies indicate that hydrophobic interactions between the graphitic regions of GO and the nonpolar PE backbone are typically predominant when interacting with carbon-based materials [87,88,89]. Studies on aged polyethylene nanoplastics have shown that protonated amine groups (–NH3+) of chitosan interact with negatively charged functional groups on oxidized or environmentally aged PE surfaces, producing additional electrostatic attraction in GO–chitosan systems. Additionally, hydrogen bonding can occur indirectly through oxygen-containing groups on GO (–OH, –COOH), especially when PE surfaces develop oxygenated functionalities through oxidative aging or UV exposure, which increases their polarity and adsorption affinity [72]. Similar hydrophobic interactions and van der Waals forces control adsorption in GO–MCC composites, but cellulose’s high hydroxyl group density enhances GO dispersion and provides more hydrogen bonding sites, increasing total adsorption capacity [90]. Notably, despite PE’s chemical inertness [91], numerous studies have shown that environmental aging significantly increases its interaction with oxygenated [92] and bio-based adsorbents [93]. Therefore, results from PE microplastics are directly applicable to PE nanoplastics in aqueous systems [94]. A brief summary of the possible mechanisms is shown in Figure 17.
In addition to showing that surface functionalization and aging significantly increase electrostatic and hydrogen bonding contributions, the observed adsorption behavior is consistent with earlier research highlighting major hydrophobic interactions between PE and GO-based materials. These findings suggest that bio-based composites such as GO–chitosan and GO-MCC can effectively capture PE nanoplastics in aqueous systems; however, direct scalability may be limited by variations in water chemistry and environmental aging. Future studies should measure adsorption in real environmental settings, investigate the long-term stability of the composites, and distinguish between interaction processes specific to nanoplastics and microplastics.

5. Conclusions

In this study, graphene oxide-based composites were used to evaluate the adsorption behavior of polyethylene (PE) nanoplastics, which were successfully produced by nanoprecipitation. Batch studies examined the effects of pH, contact time, and adsorbent type on adsorption efficiency. The GO–CS composite outperformed GO–MCC composites, exhibiting the highest adsorption capacity (50.25 mg·g−1). This enhanced performance is attributed to stronger interaction sites, hydrophobic interactions, and a greater abundance of functional groups. Additionally, adsorption efficiency is likely influenced by differences in the size and structure of the composite particles. The Freundlich isotherm and pseudo-second-order kinetic model best fit the adsorption results, indicating heterogeneous surface adsorption controlled by chemisorption. The results demonstrate the effectiveness of GO–CS as a high-performance adsorbent, further supported by its biocompatibility and potential as an environmentally friendly material. Overall, these findings suggest potential applications for removing nanoplastics from aquatic environments.

Future Directions

Future studies should evaluate the performance of the developed GO–polysaccharide composites at environmentally relevant nanoplastic concentrations and in more complex water matrices containing dissolved organic matter, competing ions, and varying ionic strengths. Additional control experiments involving GO, MCC, chitosan, and PVA-stabilized PE nanoplastics should be conducted to better understand the contribution of individual components to the adsorption mechanism. In addition, adsorption–desorption cycles and regeneration studies are needed to assess the long-term stability, reusability, and practical applicability of these materials. Future work should determine the zeta potential of PE nanoplastics over the studied pH range to better characterize their surface charge properties and interactions with the adsorbents. Such investigations would contribute to a more comprehensive understanding of nanoplastic adsorption processes and support the development of efficient and environmentally relevant GO-based biopolymer adsorbents for water treatment applications.

Author Contributions

Conceptualization, G.L.; Data curation, M.J., G.L. and S.Š.; Formal analysis, M.J., A.S., V.P., A.D., T.T. and M.T.; Investigation, M.J., G.L., S.Š., A.S., V.P., A.D., T.T. and M.T.; Methodology, M.J., G.L., S.Š., A.S., V.P., A.D., T.T. and M.T.; Resources, S.Š.; Supervision, G.L. and S.Š.; Validation, M.J., G.L., S.Š. and T.T.; Visualization, M.J., G.L., A.S., V.P., A.D., T.T. and M.T.; Writing—original draft, M.J. and G.L.; Writing—review and editing, M.J., G.L. and S.Š. All authors have read and agreed to the published version of the manuscript.

Funding

This research received no external funding.

Data Availability Statement

The original contributions presented in this study are included in the article. Further inquiries can be directed to the corresponding author.

Conflicts of Interest

The authors declare no conflicts of interest.

References

  1. Zhao, X.; You, F. Microplastic human dietary uptake from 1990 to 2018 grew across 109 major developing and industrialized countries but can be halved by plastic debris removal. Environ. Sci. Technol. 2024, 58, 8709–8723. [Google Scholar] [CrossRef] [Scilit] [PubMed]
  2. Fayshal, M.A. Current practices of plastic waste management, environmental impacts, and potential alternatives for reducing pollution and improving management. Heliyon 2024, 10, e40838. [Google Scholar] [CrossRef] [Scilit] [PubMed]
  3. Wang, M.; Lilly, K.; Martin, L.M.; Xu, W.; Tamamis, P.; Phillips, T.D. Adsorption and removal of polystyrene nanoplastics from water by green-engineered clays. Water Res. 2024, 249, 120944. [Google Scholar] [CrossRef] [Scilit] [PubMed]
  4. Zhao, J.; Lan, R.; Tan, H.; Wang, J.; Ma, Y.; Chen, Q.; Jiang, F.; Wang, Z.; Xing, B. Detection and characterization of microplastics and nanoplastics in biological samples. Nat. Rev. Bioeng. 2025, 3, 1019–1033. [Google Scholar] [CrossRef] [Scilit]
  5. MacLeod, M.; Arp, H.P.H.; Tekman, M.B.; Jahnke, A. The global threat from plastic pollution. Science 2021, 373, 61–65. [Google Scholar] [CrossRef] [Scilit] [PubMed]
  6. Chen, L.; Lin, Z. Polyethylene: Properties, production and applications. In 2021 3rd International Academic Exchange Conference on Science and Technology Innovation (IAECST); IEEE: New York, NY, USA; pp. 1191–1196.
  7. Tang, X.; Han, X.; Sulaiman, N.H.M.; He, L.; Zhou, X. Recent Advances in the Photoreforming of Plastic Waste: Principles, Challenges, and Perspectives. Ind. Eng. Chem. Res. 2023, 62, 9032–9045. [Google Scholar] [CrossRef] [Scilit]
  8. Hernández, B.; Vlachos, D.G.; Ierapetritou, M.G. Superstructure optimization for management of low-density polyethylene plastic waste. Green Chem. 2024, 26, 9476–9487. [Google Scholar] [CrossRef] [Scilit]
  9. Sun, M.; Ding, R.; Ma, Y.; Sun, Q.; Ren, X.; Sun, Z.; Duan, J. Cardiovascular toxicity assessment of polyethylene nanoplastics on developing zebrafish embryos. Chemosphere 2021, 282, 131124. [Google Scholar] [CrossRef] [Scilit] [PubMed]
  10. Hwangbo, S.; Kim, I.Y.; Ko, K.; Park, K.; Hong, J.; Kang, G.; Wi, J.-S.; Kim, J.; Lee, T.G. Preparation of fragmented polyethylene nanoplastics using a focused ultrasonic system and assessment of their cytotoxic effects on human cells. Environ. Pollut. 2024, 362, 125009. [Google Scholar] [CrossRef] [Scilit] [PubMed]
  11. Mei, Y.; Zhuang, S.; Wang, J. Adsorption of heavy metals by biochar in aqueous solution: A review. Sci. Total Environ. 2025, 968, 178898. [Google Scholar] [CrossRef] [Scilit] [PubMed]
  12. El Messaoudi, N.; Franco, D.S.P.; Gubernat, S.; Georgin, J.; Şenol, Z.M.; Ciğeroğlu, Z.; Allouss, D.; El Hajam, M. Advances and future perspectives of water defluoridation by adsorption technology: A review. Environ. Res. 2024, 252, 118857. [Google Scholar] [CrossRef] [Scilit] [PubMed]
  13. Mohamed Nasser, S.; Abbas, M.; Trari, M. Understanding the rate-limiting step adsorption kinetics onto biomaterials for mechanism adsorption control. Prog. React. Kinet. Mech. 2024, 49, 14686783241226858. [Google Scholar] [CrossRef] [Scilit]
  14. Badran, A.M.; Utra, U.; Yussof, N.S.; Bashir, M.J.K. Advancements in adsorption techniques for sustainable water purification: A focus on lead removal. Separations 2023, 10, 565. [Google Scholar] [CrossRef] [Scilit]
  15. Javed, M.; Lujanienė, G. Nanoplastics in aquatic systems: Challenges and advances in adsorptive removal technologies. Front. Water 2025, 7, 1611558. [Google Scholar] [CrossRef] [Scilit]
  16. Kahya, N.; Erim, F.B. Graphene oxide/chitosan-based composite materials as adsorbents in dye removal. Chem. Eng. Commun. 2022, 209, 1711–1726. [Google Scholar] [CrossRef] [Scilit]
  17. Lujanienė, G.; Novikau, R.; Joel, E.F.; Karalevičiūtė, K.; Šemčuk, S.; Mažeika, K.; Talaikis, M.; Pakštas, V.; Tumėnas, S.; Mažeika, J.; et al. Preparation of graphene oxide-maghemite-chitosan composites for the adsorption of europium ions from aqueous solutions. Molecules 2022, 27, 8035. [Google Scholar] [CrossRef] [Scilit] [PubMed]
  18. Nam, S.-N.; Jun, B.-M.; Park, C.M.; Jang, M.; Cho, K.-S.; Lee, J.Y.; Park, C.; Snyder, S.A.; Son, A.; Yoon, Y. Removal of bisphenol A via adsorption on graphene/(reduced) graphene oxide-based nanomaterials. Sep. Purif. Rev. 2024, 53, 231–249. [Google Scholar] [CrossRef] [Scilit]
  19. Gonçalves, J.O.; de Farias, B.S.; Rios, E.C.; Jaeschke, D.P.; Ribeiro, A.C.; da Silva, M.D.; Vieira, M.L.G.; Carvalho, V.V.d.L.; Cadaval, T.R.S.; Pinto, L.A.d.A. Advances in chitosan-based materials for application in catalysis and adsorption of emerging contaminants. Sustainability 2024, 16, 8321. [Google Scholar] [CrossRef] [Scilit]
  20. Ngah, W.W.; Teong, L.; Hanafiah, M. Adsorption of dyes and heavy metal ions by chitosan composites: A review. Carbohydr. Polym. 2011, 83, 1446–1456. [Google Scholar] [CrossRef] [Scilit]
  21. Li, X.; Zhou, H.; Wu, W.; Wei, S.; Xu, Y.; Kuang, Y. Studies of heavy metal ion adsorption on Chitosan/Sulfydryl-functionalized graphene oxide composites. J. Colloid Interface Sci. 2015, 448, 389–397. [Google Scholar] [CrossRef] [Scilit] [PubMed]
  22. D’Amora, U.; Dacrory, S.; Hasanin, M.S.; Longo, A.; Soriente, A.; Kamel, S.; Raucci, M.G.; Ambrosio, L.; Scialla, S. Advances in the physico-chemical, antimicrobial and angiogenic properties of graphene-oxide/cellulose nanocomposites for wound healing. Pharmaceutics 2023, 15, 338. [Google Scholar] [CrossRef] [Scilit] [PubMed]
  23. Ding, Z.; Tang, Y.; Zhu, P. Reduced graphene oxide/cellulose nanocrystal composite films with high specific capacitance and tensile strength. Int. J. Biol. Macromol. 2022, 200, 574–582. [Google Scholar] [CrossRef] [Scilit] [PubMed]
  24. Hsu, C.-Y.; Ajaj, Y.; Mahmoud, Z.H.; Ghadir, G.K.; Alani, Z.K.; Hussein, M.M.; Hussein, S.A.; Karim, M.M.; Al-Khalidi, A.; Abbas, J.K.; et al. Adsorption of heavy metal ions use chitosan/graphene nanocomposites: A review study. Results Chem. 2024, 7, 101332. [Google Scholar] [CrossRef] [Scilit]
  25. Fu, L.-H.; Liu, B.; Meng, L.-Y.; Ma, M.-G. Comparative study of cellulose/Ag nanocomposites using four cellulose types. Mater. Lett. 2016, 171, 277–280. [Google Scholar] [CrossRef] [Scilit]
  26. Bin Bakri, M.K.; Rahman, R. Extraction, types, and classification of cellulose. In Fundamentals and Recent Advances in Nanocomposites Based on Polymers and Nanocellulose; Elsevier: Amsterdam, The Netherlands, 2022; pp. 19–40. [Google Scholar] [CrossRef] [Scilit]
  27. Boudjellal, A.; Trache, D.; Khimeche, K.; Hafsaoui, S.L.; Razali, M.S. Preparation and characterization of graphene oxide-based natural hybrids containing alfa fibers or microcrystalline cellulose. J. Nat. Fibers 2022, 19, 5321–5332. [Google Scholar] [CrossRef] [Scilit]
  28. Miao, Y.; Wang, X.; Liu, Y.; Liu, Z.; Chen, W. Preparation of graphene oxide/cellulose composites with microcrystalline cellulose acid hydrolysis using the waste acids generated by the hummers method of graphene oxide synthesis. Polymers 2021, 13, 4453. [Google Scholar] [CrossRef] [Scilit] [PubMed]
  29. Soliman, M.; Sadek, A.A.; Abdelhamid, H.N.; Hussein, K. Graphene oxide-cellulose nanocomposite accelerates skin wound healing. Res. Vet. Sci. 2021, 137, 262–273. [Google Scholar] [CrossRef] [Scilit] [PubMed]
  30. SaifulAzry, S.; Chuah, T.G.; Paridah, M.T.; Aung, M.M.; Edi, S.Z. Effects of Polymorph Transformation via Mercerisation on Microcrystalline Cellulose Fibres and Isolation of Nanocrystalline Cellulose Fibres. Pertanika J. Sci. Technol. 2017, 25, 1275–1290. [Google Scholar]
  31. Le, H.K.H.; Nguyen, L.T.V.; Phung, T.B.N.; Nishina, Y.; Huynh, K.P.H.; Nguyen, T.S.; Chau, N.D.Q. Synthesis and characterization of graphene oxide-cellulose based aerogels. Chem. Eng. Trans. 2022, 97, 319–324. [Google Scholar] [CrossRef]
  32. Choi, J.-H.; Ko, M.; Yoon, S.; Kim, N.; Jang, T.; Lee, M.; Park, J.-A. Removal of nanoplastics from aquatic environments using graphene oxide/chitosan sponges. J. Environ. Manag. 2026, 398, 128458. [Google Scholar] [CrossRef] [Scilit] [PubMed]
  33. Ko, M.; Choi, J.-H.; Jang, T.; Yoon, S.; Choi, J.-W.; Park, J.-A. Simultaneous removal of diclofenac, triclosan, and microplastics using graphene oxide-chitosan sponges. J. Water Process Eng. 2025, 70, 107032. [Google Scholar] [CrossRef] [Scilit]
  34. Sun, C.; Wang, Z.; Chen, L.; Li, F. Fabrication of robust and compressive chitin and graphene oxide sponges for removal of microplastics with different functional groups. Chem. Eng. J. 2020, 393, 124796. [Google Scholar] [CrossRef] [Scilit]
  35. Mohamed, A.; Shaban, M.; Kordy, M.G.; Al-Senani, G.M.; Eissa, M.F.; Hamdy, H. Fabrication and characterization of NiCu/GO and NiCu/rGO nanocomposites for fuel cell application. RSC Adv. 2024, 14, 6776–6792. [Google Scholar] [CrossRef] [Scilit] [PubMed]
  36. Sunardi; Febriani, N.M.; Junaidi, A.B. Preparation of carboxymethyl cellulose produced from purun tikus (Eleocharis dulcis). In AIP Conference Proceedings; AIP Publishing LLC: Melville, NY, USA, 2017. [Google Scholar] [CrossRef] [Scilit]
  37. Kollannur, N.J.; Arnepalli, D.N. Methodology for determining point of zero salt effect of clays in terms of surface charge properties. J. Mater. Civ. Eng. 2019, 31, 04019286. [Google Scholar] [CrossRef] [Scilit]
  38. Mustikaningrum, M.; Adelina, D.; Sawali, F.D.I.; Afandy, M.A. Effect of sodium hydroxide treatment on adsorption of methylene blue based on cellulose nano crystals. J. Vocat. Stud. Appl. Res. 2024, 6, 7–11. [Google Scholar] [CrossRef] [Scilit]
  39. Lujanienė, G.; Novikau, R.; Karalevičiūtė, K.; Pakštas, V.; Talaikis, M.; Levinskaitė, L.; Selskienė, A.; Selskis, A.; Mažeika, J.; Jokšas, K. Chitosan-minerals-based composites for adsorption of caesium, cobalt and europium. J. Hazard. Mater. 2024, 462, 132747. [Google Scholar] [CrossRef] [Scilit] [PubMed]
  40. Tang, L.A.L.; Lee, W.C.; Shi, H.; Wong, E.Y.L.; Sadovoy, A.; Gorelik, S.; Hobley, J.; Lim, C.T.; Loh, K.P. Highly wrinkled cross-linked graphene oxide membranes for biological and charge-storage applications. Small 2012, 8, 423–431. [Google Scholar] [CrossRef] [Scilit] [PubMed]
  41. Kamal, M.A.; Bibi, S.; Bokhari, S.W.; Siddique, A.H.; Yasin, T. Synthesis and adsorptive characteristics of novel chitosan/graphene oxide nanocomposite for dye uptake. React. Funct. Polym. 2017, 110, 21–29. [Google Scholar] [CrossRef] [Scilit]
  42. Zhu, W.; Jiang, X.; Jiang, K.; Liu, F.; You, F.; Yao, C. Fabrication of reusable carboxymethyl cellulose/graphene oxide composite aerogel with large surface area for adsorption of methylene blue. Nanomaterials 2021, 11, 1609. [Google Scholar] [CrossRef] [Scilit] [PubMed]
  43. Abd-Elhamid, A.I.; Abu Elgoud, E.M.; Aly, H.F. Graphene oxide modified with carboxymethyl cellulose for high adsorption capacities towards Nd(III) and Ce(III) from aqueous solutions. Cellulose 2022, 29, 9831–9846. [Google Scholar] [CrossRef] [Scilit]
  44. Abd-Elhamid, A.I.; Abu Elgoud, E.M.; Aly, H.F. Sorption behavior of strontium ions by graphene oxide decorated with chitosan nanoparticles from aqueous solutions. Cellulose 2024, 31, 8203–8220. [Google Scholar] [CrossRef] [Scilit]
  45. Mohamadi, M.B.; Ejazi, H.; Azadbakht, F. Using composite chitosan-graphene oxide to eliminate reactive blue 19 from water solutions: The study of adsorption kinetics and reaction thermodynamics. Desalin. Water Treat. 2019, 155, 341–349. [Google Scholar] [CrossRef] [Scilit]
  46. Zuo, P.-P.; Feng, H.-F.; Xu, Z.-Z.; Zhang, L.-F.; Zhang, Y.-L.; Xia, W.; Zhang, W.-Q. Fabrication of biocompatible and mechanically reinforced graphene oxide-chitosan nanocomposite films. BMC Chem. 2013, 7, 39. [Google Scholar] [CrossRef] [Scilit] [PubMed]
  47. Mizhir, A.A.; Abdulwahid, A.A.; Al-Lami, H.S. Adsorption of carcinogenic dye Congo red onto prepared graphene oxide-based composites. Desalin. Water Treat. 2020, 202, 381–395. [Google Scholar] [CrossRef] [Scilit]
  48. Suripto, S.; Noviany, N.; Wasinton, S.; Kiswandono, A.A.; Sutopo, H. Similarity characterization of carboxymethyl cellulose (CMC) synthesized from microcellulose of cassava peel. Mater. Plast. 2020, 57, 225–235. [Google Scholar] [CrossRef]
  49. Ibrahim, M.; Osman, O.; Mahmoud, A.A. Spectroscopic analyses of cellulose and chitosan: FTIR and modeling approach. J. Comput. Theor. Nanosci. 2011, 8, 117–123. [Google Scholar] [CrossRef] [Scilit]
  50. Hummers, W.S., Jr.; Offeman, R.E. Preparation of graphitic oxide. J. Am. Chem. Soc. 1958, 80, 1339. [Google Scholar] [CrossRef] [Scilit]
  51. Park, S.; Lee, K.-S.; Bozoklu, G.; Cai, W.; Nguyen, S.T.; Ruoff, R.S. Graphene oxide papers modified by divalent ions—Enhancing mechanical properties via chemical cross-linking. ACS Nano 2008, 2, 572–578. [Google Scholar] [CrossRef] [Scilit] [PubMed]
  52. Gao, R.; Hu, N.; Yang, Z.; Zhu, Q.; Chai, J.; Su, Y.; Zhang, L.; Zhang, Y. Paper-like graphene-Ag composite films with enhanced mechanical and electrical properties. Nanoscale Res. Lett. 2013, 8, 32. [Google Scholar] [CrossRef] [Scilit] [PubMed]
  53. Chen, Y. Synthesis and Characterization of Novel Functional Materials Based on Cellulose and Graphene Oxide. Doctoral Dissertation, Dresden University of Technology, Dresden, Germany, 2020. [Google Scholar]
  54. Rajandas, H.; Parimannan, S.; Sathasivam, K.; Ravichandran, M.; Yin, L.S. A novel FTIR-ATR spectroscopy based technique for the estimation of low-density polyethylene biodegradation. Polym. Test. 2012, 31, 1094–1099. [Google Scholar] [CrossRef] [Scilit]
  55. Boronat, C.; Correcher, V.; Benavente, J.; Bravo-Yagüe, J. Thermoluminescence and ATR-FTIR study of UVC-irradiated low-density polyethylene (LDPE) food packaging. Spectrochim. Acta Part A Mol. Biomol. Spectrosc. 2024, 323, 124882. [Google Scholar] [CrossRef] [Scilit] [PubMed]
  56. Andrady, A.L.; Law, K.L.; Donohue, J.; Koongolla, B. Accelerated degradation of low-density polyethylene in air and in sea water. Sci. Total Environ. 2022, 811, 151368. [Google Scholar] [CrossRef] [Scilit] [PubMed]
  57. Yadav, M.; Ahmad, S. Montmorillonite/graphene oxide/chitosan composite: Synthesis, characterization and properties. Int. J. Biol. Macromol. 2015, 79, 923–933. [Google Scholar] [CrossRef] [Scilit] [PubMed]
  58. Haq, A.U.; Saeed, M.; Muneer, M.; Jamal, M.A.; Maqbool, T.; Tahir, T. Biosorption of metribuzin pesticide by Cucumber (Cucumis sativus) peels-zinc oxide nanoparticles composite. Sci. Rep. 2022, 12, 5840. [Google Scholar] [CrossRef] [Scilit] [PubMed]
  59. Dipannita, N.T.; Yasmin, S.; Hasan, K.; Hossain, S.; Somapti, M.A.; Kabir, H. Carboxymethylcellulose functionalized magnetic graphene oxide for the efficient removal of tetracycline from aqueous media. RSC Adv. 2025, 15, 35219–35232. [Google Scholar] [CrossRef] [Scilit] [PubMed]
  60. Allouss, D.; Essamlali, Y.; Amadine, O.; Chakir, A.; Zahouily, M. Response surface methodology for optimization of methylene blue adsorption onto carboxymethyl cellulose-based hydrogel beads: Adsorption kinetics, isotherm, thermodynamics and reusability studies. RSC Adv. 2019, 9, 37858–37869. [Google Scholar] [CrossRef] [Scilit] [PubMed]
  61. Azizkhani, S.; Mahmoudi, E.; Abdullah, N.; Ismail, M.H.S.; Mohammad, A.W.; Hussain, S.A. Synthesis and characterisation of graphene oxide-silica-chitosan for eliminating the Pb(ii) from aqueous solution. Polymers 2020, 12, 1922. [Google Scholar] [CrossRef] [Scilit] [PubMed]
  62. Partlan, E.; Davis, K.; Ren, Y.; Apul, O.G.; Mefford, O.T.; Karanfil, T.; Ladner, D.A. Effect of bead milling on chemical and physical characteristics of activated carbons pulverized to superfine sizes. Water Res. 2016, 89, 161–170. [Google Scholar] [CrossRef] [Scilit] [PubMed]
  63. Kosmulski, M. pH-dependent surface charging and points of zero charge. IV. Update and new approach. J. Colloid Interface Sci. 2009, 337, 439–448. [Google Scholar] [CrossRef] [Scilit] [PubMed]
  64. Promkatkaew, M.; Srisuratsiri, P.; Sangpanich, U.; Somboonviwat, K.; Kitjaruwankul, S. Graphene Oxide–Chitosan Composite for Efficient Adsorptive Removal of Cu(II), Co(II), and Ni(II) from Simulated E-Waste Effluents. ACS Omega 2025, 10, 44111–44124. [Google Scholar] [CrossRef] [Scilit] [PubMed]
  65. Hamad, M.T.M.H. A novel hybrid approach for predicting and optimizing the adsorption of methyl orange and Cr(VI) removal from aqueous solutions using fungal-cross linked chitosan integrated into graphene oxide as a cost-effective adsorbent. BMC Chem. 2025, 19, 193. [Google Scholar] [CrossRef] [Scilit] [PubMed]
  66. Beneš, P.; Paulenová, M. Surface charge and adsorption properties of polyethylene in aqueous solutions of inorganic electrolytes: I. Streaming potential measurement. Kolloid-Z. Z. Polym. 1973, 251, 766–771. [Google Scholar] [CrossRef] [Scilit]
  67. Zhang, W.; Zhang, L.; Hua, T.; Li, Y.; Zhou, X.; Wang, W.; You, Z.; Wang, H.; Li, M. The mechanism for adsorption of Cr(VI) ions by PE microplastics in ternary system of natural water environment. Environ. Pollut. 2020, 257, 113440. [Google Scholar] [CrossRef] [Scilit] [PubMed]
  68. Çiftçi, G.; Türkeli, Ü.D.; Özen, E.Y.; Özdemir, M.; Sanin, F.D.; İmamoğlu, I. Microplastics and organics—A comparative study of sorption of triclosan and malachite green onto polyethylene. Water Sci. Technol. 2023, 87, 1072–1081. [Google Scholar] [CrossRef] [Scilit] [PubMed]
  69. Jang, M.-H.; Kim, M.-S.; Han, M.; Kwak, D.-H. Experimental application of a zero-point charge based on pH as a simple indicator of microplastic particle aggregation. Chemosphere 2022, 299, 134388. [Google Scholar] [CrossRef] [Scilit] [PubMed]
  70. Bartnick, R.; Shahriari, S.; Auernhammer, G.K.; Mansfeld, U.; Reichstein, W.; Hülsmann, L.; Lehndorff, E. UV-degraded polyethylene exhibits variable charge and enhanced cation adsorption. PLoS ONE 2025, 20, e0337180. [Google Scholar] [CrossRef] [Scilit] [PubMed]
  71. Liu, G.; Zhao, J.; Zhao, Y.; Mi, H.; Zhu, L.; Wang, C.; Guan, D. Molecular dynamics insights into polypropylene microplastics adsorption onto PDMS coated sponge. Environ. Pollut. 2025, 382, 126733. [Google Scholar] [CrossRef] [Scilit] [PubMed]
  72. Arenas-Blanco, B.A.; López-Meza, A.; Vesga-Gamboa, L.C.; Beltrán-Larrotta, J.-I.; Cajicá-Trillos, C.A.; Mejía-Ospino, E. Mechanistic study of nanoplastic capture using functionalized graphene oxide: A molecular dynamics approach. Comput. Mater. Sci. 2026, 265, 114530. [Google Scholar] [CrossRef] [Scilit]
  73. Foo, K.; Hameed, B. Insights into the modeling of adsorption isotherm systems. Chem. Eng. J. 2010, 156, 2–10. [Google Scholar] [CrossRef] [Scilit]
  74. Haq, A.U.; Saeed, M.; Usman, M.; Naqvi, S.A.R.; Bokhari, T.H.; Maqbool, T.; Ghaus, H.; Tahir, T.; Khalid, H. Sorption of chlorpyrifos onto zinc oxide nanoparticles impregnated Pea peels (Pisum sativum L.): Equilibrium, kinetic and thermodynamic studies. Environ. Technol. Innov. 2020, 17, 100516. [Google Scholar] [CrossRef] [Scilit]
  75. Wang, J.; Guo, X. Adsorption kinetics and isotherm models of heavy metals by various adsorbents: An overview. Crit. Rev. Environ. Sci. Technol. 2023, 53, 1837–1865. [Google Scholar] [CrossRef] [Scilit]
  76. Liu, Y.; Miao, J.; Han, H.; Xu, P. Differences in influence of particle size on the adsorption capacity between deformed and undeformed coal. ACS Omega 2021, 6, 5886–5897. [Google Scholar] [CrossRef] [Scilit] [PubMed]
  77. Ebisike, K.; Okoronkwo, A.E.; Alaneme, K.K.; Akinribide, O.J. Thermodynamic study of the adsorption of Cd2+ and Ni2+ onto chitosan—Silica hybrid aerogel from aqueous solution. Results Chem. 2023, 5, 100730. [Google Scholar] [CrossRef] [Scilit]
  78. Purwiyanto, A.I.S.; Suteja, Y.; Trisno; Ningrum, P.S.; Putri, W.A.E.; Rozirwan, R.; Agustriani, F.; Fauziyah, F.; Cordova, M.R.; Koropitan, A.F. Concentration and adsorption of Pb and Cu in microplastics: Case study in aquatic environment. Mar. Pollut. Bull. 2020, 158, 111380. [Google Scholar] [CrossRef] [Scilit] [PubMed]
  79. Wahyuhadi, M.E.; Kusumadewi, R.A.; Hadisoebroto, R. Effect of contact time on the adsorption process of activated carbon from banana peel in reducing heavy metal Cd and dyes using a stirring tub (pilot scale). In IOP Conference Series: Earth and Environmental Science; IOP Publishing: Bristol, UK, 2023. [Google Scholar] [CrossRef] [Scilit]
  80. Harja, M.; Buema, G.; Bucur, D. Recent advances in removal of Congo Red dye by adsorption using an industrial waste. Sci. Rep. 2022, 12, 6087. [Google Scholar] [CrossRef] [Scilit] [PubMed]
  81. Li, S.; Yang, M.; Wang, H.; Jiang, Y. Adsorption of microplastics on aquifer media: Effects of the action time, initial concentration, ionic strength, ionic types and dissolved organic matter. Environ. Pollut. 2022, 308, 119482. [Google Scholar] [CrossRef] [Scilit] [PubMed]
  82. Yadav, B.S.; Dasgupta, S. Effect of time, pH, and temperature on kinetics for adsorption of methyl orange dye into the modified nitrate intercalated MgAl LDH adsorbent. Inorg. Chem. Commun. 2022, 137, 109203. [Google Scholar] [CrossRef] [Scilit]
  83. Liu, Z.; Wang, Q.; Huang, X.; Qian, X. Surface functionalization of graphene oxide with hyperbranched polyamide-amine and microcrystalline cellulose for efficient adsorption of heavy metal ions. ACS Omega 2022, 7, 10944–10954. [Google Scholar] [CrossRef] [Scilit] [PubMed]
  84. Tang, Y.; Zhang, S.; Su, Y.; Wu, D.; Zhao, Y.; Xie, B. Removal of microplastics from aqueous solutions by magnetic carbon nanotubes. Chem. Eng. J. 2021, 406, 126804. [Google Scholar] [CrossRef] [Scilit]
  85. Al-Asadi, S.T.; Al-Qaim, F.F.; Al-Saedi, H.F.S.; Deyab, I.F.; Kamyab, H.; Chelliapan, S. Adsorption of methylene blue dye from aqueous solution using low-cost adsorbent: Kinetic, isotherm adsorption, and thermodynamic studies. Environ. Monit. Assess. 2023, 195, 676. [Google Scholar] [CrossRef] [Scilit] [PubMed]
  86. Tubić, A.; Lončarski, M.; Apostolović, T.; Isakovski, M.K.; Tričković, J.; Jazić, J.M.; Agbaba, J. Adsorption mechanisms of chlorobenzenes and trifluralin on primary polyethylene microplastics in the aquatic environment. Environ. Sci. Pollut. Res. 2021, 28, 59416–59429. [Google Scholar] [CrossRef] [Scilit] [PubMed]
  87. Wang, T.; Yu, C.; Chu, Q.; Wang, F.; Lan, T.; Wang, J. Adsorption behavior and mechanism of five pesticides on microplastics from agricultural polyethylene films. Chemosphere 2020, 244, 125491. [Google Scholar] [CrossRef] [Scilit] [PubMed]
  88. Fu, L.; Li, J.; Wang, G.; Luan, Y.; Dai, W. Adsorption behavior of organic pollutants on microplastics. Ecotoxicol. Environ. Saf. 2021, 217, 112207. [Google Scholar] [CrossRef] [Scilit] [PubMed]
  89. Hüffer, T.; Hofmann, T. Sorption of non-polar organic compounds by micro-sized plastic particles in aqueous solution. Environ. Pollut. 2016, 214, 194–201. [Google Scholar] [CrossRef] [Scilit] [PubMed]
  90. Rai, P.K.; Sonne, C.; Brown, R.J.; Younis, S.A.; Kim, K.-H. Adsorption of environmental contaminants on micro- and nano-scale plastic polymers and the influence of weathering processes on their adsorptive attributes. J. Hazard. Mater. 2022, 427, 127903. [Google Scholar] [CrossRef] [Scilit] [PubMed]
  91. Agboola, O.D.; Benson, N.U. Physisorption and chemisorption mechanisms influencing micro (nano) plastics-organic chemical contaminants interactions: A review. Front. Environ. Sci. 2021, 9, 678574. [Google Scholar] [CrossRef] [Scilit]
  92. Hüffer, T.; Weniger, A.-K.; Hofmann, T. Sorption of organic compounds by aged polystyrene microplastic particles. Environ. Pollut. 2018, 236, 218–225. [Google Scholar] [CrossRef] [Scilit] [PubMed]
  93. Prus, Z.; Styszko, K. Wastewater-Derived Microplastics as Carriers of Aromatic Organic Contaminants (AOCs): A Critical Review of Ageing, Sorption Mechanisms, and Environmental Implications. Int. J. Mol. Sci. 2025, 26, 11758. [Google Scholar] [CrossRef] [Scilit] [PubMed]
  94. Joo, S.H.; Liang, Y.; Kim, M.; Byun, J.; Choi, H. Microplastics with adsorbed contaminants: Mechanisms and Treatment. Environ. Chall. 2021, 3, 100042. [Google Scholar] [CrossRef] [Scilit] [PubMed]
Figure 1. SEM images of GO (a), chitosan (b) and GO–chitosan composites (c,d).
Microplastics 05 00142 g001
Figure 2. MCC 50 µm (a), MCC 90 µm (b), GO–MCC-50 µm (c,e), and GO–MCC-90 µm (d,f).
Microplastics 05 00142 g002
Figure 3. TEM images of laboratory-prepared polyethylene nanoplastics (PE–NPs): (ac) representative particles with sizes ranging from approximately 200–500 nm.
Microplastics 05 00142 g003
Figure 4. ATR-FTIR spectra of GO–chitosan composites.
Microplastics 05 00142 g004
Figure 5. ATR-FTIR spectra of GO-MCC (50 µm and 90 µm) composites.
Microplastics 05 00142 g005
Figure 6. The FTIR spectra of PE and PE nanoparticles.
Microplastics 05 00142 g006
Figure 7. XRD patterns of chitosan, GO and GO–chitosan composites (a) and MCC–50 µm, MCC–90 µm, GO-MCC (90 µm) and GO-MCC (50 µm) composites (b).
Microplastics 05 00142 g007
Figure 8. Plot between initial pH and ΔpH presenting the zero-crossing point (pHpzc) by linear interpolation for GO–MCC–50 µm (a), GO–MCC–90 µm (b), GO–CS composites (c), and PE nanoplastics (d).
Microplastics 05 00142 g008
Figure 9. The effect of pH on adsorption of PE–NPs by GO–CS, GO–MCC–50 µm, and GO–MCC–90 µm composites, pH: 3–9, contact time: 24 h, volume of solution: 10 mL, adsorbent dose: 0.01 g, initial concentration of PE–NPs: 5 mg·L−1.
Microplastics 05 00142 g009
Figure 10. The effect of adsorbent dosage on adsorption of PE–NPs by GO–CS, GO–MCC–50 µm, and GO–MCC–90 µm composites, contact time: 24 h, volume of solution: 10 mL, adsorbent dose: 0.005–0.02 g, initial concentration of PE–NPs: 5 mg·L−1.
Microplastics 05 00142 g010
Figure 11. The effect of initial concentration (Ci) on adsorption by GO–CS, GO–MCC–50 µm, and GO–MCC–90 µm composites, contact time: 24 h, volume of solution: 10 mL, adsorbent dose: 0.01 g, initial concentration range of PE–NPs: 5–20 mg·L−1.
Microplastics 05 00142 g011
Figure 12. The effect of contact time on removal efficiency by GO–CS, GO–MCC–50 µm, and GO–MCC–90 µm composites, contact time: 5–1440 min, volume of solution: 10 mL, adsorbent dose: 0.01 g, initial concentration of PE–NPs: 5 mg·L−1.
Microplastics 05 00142 g012
Figure 13. The effect of temperature on removal efficiency by GO–CS, GO–MCC–50 µm, and GO–MCC–90 µm composites. Temperature: 298–313 K. Contact time: 24 h. Volume of solution: 10 mL. Adsorbent dose: 0.01 g. Initial concentration of PE–NPs: 5 mg·L−1.
Microplastics 05 00142 g013
Figure 14. The linear adsorption isotherms of the Freundlich (a) and Langmuir (b).
Microplastics 05 00142 g014
Figure 15. Pseudo-second-order kinetic model for GO–CS, GO–MCC–50 µm, and GO–MCC–90 µm.
Microplastics 05 00142 g015
Figure 16. ATF-FTIR spectra of GO–chitosan, GO-MCC (50 and 90 µm) composites and PE–NPs after adsorption.
Microplastics 05 00142 g016
Figure 17. Adsorption mechanism of PE–NPs on GO-modified composites.
Microplastics 05 00142 g017
Table 1. pHpzc values for GO–CS, GO–MCC–50 µm and GO–MCC–90 µm composites and PE-NPs.
MaterialspHpzc
GO–MCC–50 µm 3.30
GO–MCC–90 µm 3.04
GO–CS6.50
PE–NPs4.54
Table 2. Isotherm parameters for the adsorption of PE–NPs.
ModelLangmuirFreundlich
ParametersR2qmaxKLRLnKfR2
GO–CS 0.81950.250.0470.345–0.6781.872.460.997
GO–MCC–50 µm 0.86838.310.0940.312–0.6451.293.520.996
GO–MCC–90 µm 0.91927.020.110.510–0.8061.413.050.997
Table 3. The kinetic parameters for the adsorption of PE–NPs.
Kinetic ModelExperimental Values
PFOAdsorbentqe (mg·g−1)K1 (min−1)R2
GO–CS 1.6740.0080.483
GO–MCC–50 µm 1.1550.0050.881
GO–MCC–90 µm 2.3380.0260.525
PSOAdsorbentqt (mg·g−1)K2 (g·mg−1·min−1) R2
GO–CS 4.3060.02650.999
GO–MCC–50 µm 4.1640.02610.999
GO–MCC–90 µm 3.9460.03490.999
IDAdsorbentC (mg·g−1)Kid (mg·g−1·min−1/2)R2
GO–CS 3.2600.0290.873
GO–MCC–50 µm 2.7470.0790.905
GO–MCC–90 µm 2.9600.028 0.733
Table 4. Thermodynamic parameters for the adsorption of PE–NPs.
AdsorbentTemperature (K)∆G
(kJ·mol−1)
∆H
(kJ·mol−1)
∆S
(kJ·mol−1·K−1)
GO–CS 298−4.55−3.7650.00259
303−4.52
308−4.56
313−4.58
GO–MCC–50 µm 298−4.92−7.235−0.00769
303−4.97
308−4.78
313−4.86
GO–MCC–90 µm 298−4.07−5.139−0.00369
303−3.94
308−4.02
313−3.99
Disclaimer/Publisher’s Note: The statements, opinions and data contained in all publications are solely those of the individual author(s) and contributor(s) and not of MDPI and/or the editor(s). MDPI and/or the editor(s) disclaim responsibility for any injury to people or property resulting from any ideas, methods, instructions or products referred to in the content.