1. Introduction
Protecting biodiversity has become increasingly urgent as global ecosystems face unprecedented degradation driven by human activities. Processes that once unfolded over evolutionary timescales now occur within decades, leaving virtually no ecosystem unaffected. Current estimates indicate that approximately 0.25% of remaining species are lost each year before being formally described, and that around 34,000 plant species, or roughly 12.5% of global flora, are threatened with extinction. Biodiversity conservation is particularly critical in regions dominated by native and specialised plant communities, where ecological integrity is especially vulnerable to disturbance [
1].
Among the major drivers of biodiversity loss, human pressures such as habitat destruction, ecosystem degradation, demographic expansion, and the introduction of invasive alien species (IAS) stand out. IAS are considered among the most serious global threats to biodiversity, after habitat loss. Their spread is particularly pronounced in disturbed or human-altered environments, including ruderal areas, degraded soils, agricultural lands, parks, gardens, and industrial zones. In such contexts, IAS frequently outcompete native species and disrupt ecosystem functioning, underscoring the need for coordinated management strategies to safeguard native biodiversity and maintain ecosystem resilience [
2,
3].
Portugal has been a pioneer in regulating invasive alien species, introducing its first national list of restricted taxa in 1999 and later expanding it through Decree-Law No. 92/2019, which currently includes more than 100 confirmed or potentially invasive plant species. This national framework is complemented by European Union Regulation No. 1143/2014, which establishes a “Union list” that automatically incorporates species of EU concern into Portuguese legislation. Together, these instruments reflect the growing recognition of biological invasions as a major environmental challenge and the need for harmonised prevention and management across Europe.
Over recent decades, extensive research has advanced knowledge of plant invasions in Portugal, documenting alien plant diversity, mapping invasion risks [
4], and analysing species-specific dynamics in problematic taxa such as Acacia spp. [
5] and Carpobrotus edulis [
6]. Studies have also focused on vulnerable ecosystems, including dunes, forests, riparian zones, and inland waters, highlighting the ecological complexity of invasions [
7,
8,
9,
10]. Despite these efforts and the increasing availability of citizen science data, a complete national-scale distribution of invasive plants remains limited because of fragmented datasets and local knowledge gaps.
The selection of
Hakea sericea as the focal species in this study is justified by its ecological aggressiveness, fire-adapted reproductive traits, and increasing impact on Mediterranean ecosystems. Native to southeastern Australia,
H. sericea is a fire-adapted shrub whose morphology, rigid needle-like leaves, serotinous woody follicles, and winged seeds support a reproductive strategy closely linked to fire. Mass seed release following fire or plant death, combined with wind-driven dispersal and a persistent canopy seed bank, enables rapid colonisation of nutrient-poor, disturbed habitats [
11,
12,
13].
Initially introduced for ornamental and hedging purposes, the species now forms dense monospecific stands that suppress native vegetation and alter community structure. In Portugal, invasions are particularly severe in northern regions and in fire-affected pine forests, where
H. sericea outcompetes native species such as
Pinus pinaster. Wildfires further intensify its spread by removing competitors and creating favourable post-fire conditions for establishment, a trend expected to worsen under climate change [
14,
15]. Effective management is challenged by its heat-resistant fruits and long-lived seed banks, although biological control programmes in South Africa have demonstrated potential. In Portugal, where the species is officially classified as invasive, mitigation requires integrated strategies combining ecological monitoring, fire regime assessment, and coordinated mechanical, chemical, and biological control measures [
16,
17].
The valorisation of biomass from invasive species through thermochemical liquefaction offers a strategic pathway to reduce fuel-loads, strengthen forest management, and contribute to wildfire prevention. Forest biomass is one of the most abundant raw materials for producing biofuels and chemical feedstocks. Thermochemical liquefaction has emerged as a promising technique due to its potential to reduce environmental impacts, promote long-term sustainability, and decrease dependence on fossil fuels. Biomass-derived chemicals can replace petroleum-based materials while adding value to agroforestry by-products [
18,
19,
20].
Thermochemical liquefaction can be applied to a wide range of lignocellulosic residues, including carob, pinewood, cork, eucalyptus, manure, potato peel, wheat straw, corn straw, olive pomace, and rice husk. It typically occurs at moderate temperatures (100–250 °C) in the presence of organic solvents such as polyalcohols or ethylene carbonate. The solvent prevents crosslinking and side reactions, while the process requires neither high pressure nor prior drying, making it particularly suitable for biomass with high moisture content. Liquefaction efficiency depends on several factors, including biomass composition, solvent type, catalyst, temperature, and reaction time [
21,
22]. The products obtained through liquefaction can be directed toward multiple applications, including fuels, chemical precursors, and other value-added materials. Moreover, liquefaction offers the advantage of operating at more moderate temperatures and without the need for prior biomass drying, which significantly reduces the overall energy requirements of the process [
23].
Response surface methodology (RSM) is a statistical and mathematical approach used to optimise processes and systems. It integrates experimental design (DoE), model development, and analysis of the relationships between one or more response variables and multiple input factors. The primary objective of RSM is to determine optimal operating conditions or to understand how input variables influence process outputs [
24]. Compared with classical experimental methods, RSM can generate meaningful insights with fewer experimental runs. A key advantage of RSM in optimisation is its ability to produce models that reliably describe and predict process behaviour [
25]. This methodology has been widely applied to optimise biomass liquefaction [
26,
27,
28] and pyrolysis processes [
29].
In the context of biomass valorisation, using the entire H. sericea shrub, including leaves, branches, and trunk material, offers significant advantages over approaches relying solely on wood chips. This strategy maximises biomass utilisation, reduces waste, and leverages the plant’s high volatile compound and essential oil content, thereby enhancing bio-oil quality. It also minimises preprocessing and logistical costs while supporting circular-economy principles.
This study investigates the liquefaction behaviour of H. sericea biomass using a whole-plant feedstock composed of leaves, branches, and trunks collected in the Serra da Estrela region. By valorising the entire plant, the study improves resource efficiency and provides a more comprehensive assessment of this underexplored biomass for bio-oil production. Response surface methodology was applied to optimise process conditions and identify the main factors controlling bio-oil yield and quality. Comprehensive physicochemical characterisation of the feedstock and resulting bio-oils further provided valuable insights into the conversion pathways and product properties.
2. Materials and Methods
2.1. Materials and Chemicals
This study used 2-Ethylhexanol (99% purity, Acros, Lisbon, Portugal) as the solvent. The catalysts were p-toluenesulfonic acid (99% purity, Sigma-Aldrich, St. Louis, MO, USA) and acetone (99–100%, Enzymatic, Lisbon, Portugal).
The biomass samples (a mixture of
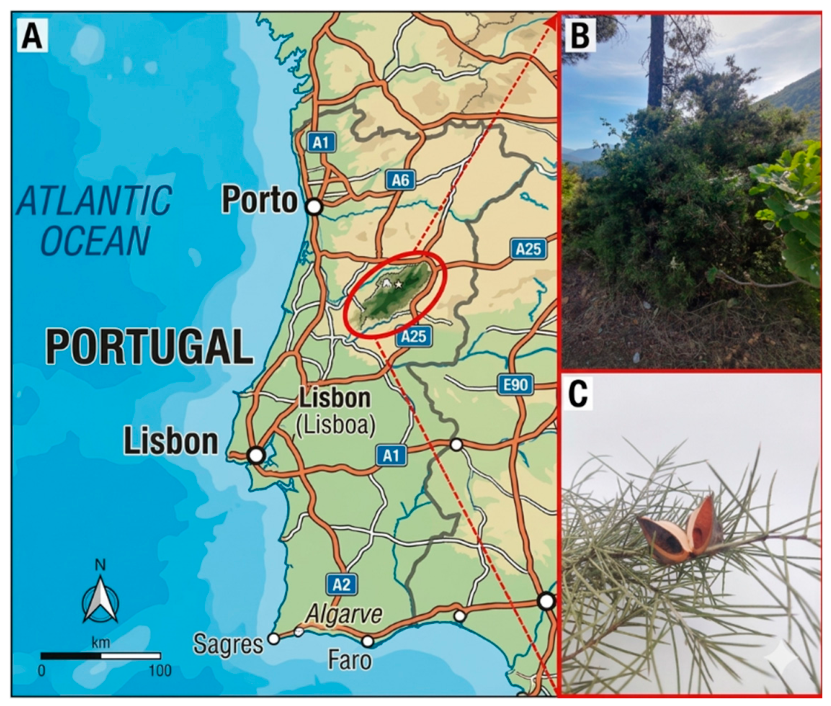
H. sericea leaves, branches, and trunks) were collected in the Lagoa Comprida–Torre area of Serra da Estrela Natural Park (
Figure 1).
2.2. Liquefaction Reaction
H. sericea biomass was milled to <4 mm using a Retsch SM 300 cutting mill with a 4 mm sieve. A weighed amount of the biomass was combined with 2-ethylhexanol as the solvent, maintaining a solvent-to-biomass feed ratio of 5:1 (
w/
w).
p-Toluenesulfonic acid (pTSA) was added as a catalyst at varying weight-based concentrations, calculated relative to the total mass of biomass and solvent. The mixture was transferred to a sealed reactor and heated to the target temperature for the designated reaction time under continuous stirring. After completion, the system was cooled to room temperature, and the reaction mixture was filtered to separate the solid and liquid fractions. The recovered products were then collected and stored for subsequent analysis. The mild acid-catalysed liquefaction experiments were conducted at three temperatures (120, 140, and 160 °C) and three reaction times (30, 60, and 90 min). The reactions were carried out in three-neck glass reactors: one fitted with a condenser, another with a nitrogen inlet to ensure an inert atmosphere, and the third with a thermocouple. Catalyst concentrations of 1%, 2%, and 3% (
w/
w) were used relative to the total mass of biomass and solvent. The reaction time was recorded only once the mixture reached the target temperature (t = 0), and the heating ramp was not considered. After the designated reaction time, the reactor was gradually cooled to 40 °C, and the mixture was vacuum filtered using a BUCHI (Flawil, Switzerland) pump. The solid residue was then washed with acetone to extract the remaining bio-oil, yielding an acetone/bio-oil fraction that was subsequently recovered by evaporating the acetone and the solvent. The washed residues were dried in an oven at 90 °C until constant weight. Bio-oil yield was subsequently determined using Equation (1), as commonly applied in previous studies [
30,
31].
where
ms is the mass of solids after the filtration and
mi is the initial mass.
This equation excludes gaseous products, as non-condensable gases are formed only in negligible amounts and cannot be effectively isolated under the experimental conditions. Most of the carbon is recovered in the bio-oil and the solid residue, although gas may still be generated in reduced amounts. These minor gaseous by-products are typically vented from the reactor, particularly when the system is not fully sealed, as in this study.
2.3. Fourier Transform Infrared Spectroscopy with Attenuated Total Reflectance (FTIR-ATR) Analysis
FTIR-ATR analyses were conducted using a PerkinElmer Spectrum Two instrument (Waltham, MA, USA). Spectra were recorded over the 600–4000 cm−1 wavenumber range, and the characteristic fingerprint region of lignocellulosic materials was processed using the PerkinElmer Spectrum 10 IR software.
2.4. Elemental Analysis and Higher Heating Value (HHV)
The elemental composition of the biomass, the bio-oil samples with the highest and lowest conversion yields, and the solid residue were determined using a Velp Scientifica EMA 502 elemental microanalyser (Usmate, Italy). Carbon, hydrogen, nitrogen, and sulphur contents were measured experimentally, while oxygen content was calculated by difference [
32]. Each sample was analysed in triplicate, and the average value was used when the variance among replicates was below 2%. In biomass and its derived products, carbon, hydrogen, and oxygen typically account for 97–99% of the total composition. Nitrogen and sulphur are present only in trace amounts, often below the instrument’s detection limits, making their direct quantification challenging [
30,
33]. Consequently, the oxygen content was calculated by difference using equation).
The higher heating value (HHV) is a key parameter in bio-oil characterisation, as it reflects the fuel’s intrinsic energy content and overall quality, thereby indicating its potential as a renewable energy source. Estimation models based on elemental composition offer a practical alternative to direct calorimetric measurements, as they rely on readily obtainable carbon, hydrogen, and oxygen contents, enabling rapid and cost-effective HHV prediction without the need for labour-intensive techniques such as bomb calorimetry [
34,
35]. The correlation proposed by Mateus et al. [
30] was applied to estimate the higher heating value of the bio-oil sample, as presented in Equation (3).
The energy densification ratio (EDR) was calculated using Equation (4), enabling the comparison of the higher heating values of the biomass and corresponding bio-oil samples.
2.5. Thermogravimetric Analysis (TGA)
Thermogravimetric analysis (TGA) of the solid residues and bio-oil samples was performed using a Hitachi STA 7200 instrument (Tokyo, Japan). Measurements were performed under a nitrogen atmosphere at a flow rate of 200 mL/min, with a heating rate of 10 °C/min over the temperature range 30–600 °C.
2.6. Proximate Analysis
Moisture (MC), volatile matter (VM), fixed carbon (FC), and ash contents were determined by proximate analysis following ASTM D5142, using a Hitachi STA7200 thermogravimetric analyser (TGA). Approximately 10 mg of each sample was weighed, and the temperature was increased from room temperature to 105 °C at 10 °C/min under a nitrogen atmosphere to quantify MC from the corresponding mass loss. VM was determined from the additional weight loss occurring as the temperature increased from 105 °C to 600 °C at the same heating rate under nitrogen. The temperature was then held constant while the purge gas was switched from nitrogen to air, allowing combustion of the remaining carbon; the associated mass loss corresponded to FC. The residual mass after combustion was recorded as the ash content [
36].
2.7. Lignocellulosic Content Estimation
Traditionally, biomass characterisation has relied on chemical analysis techniques to quantify its main structural components: hemicellulose, cellulose, and lignin. Although these methods are well-established and highly reliable, they are also time-consuming, costly, and dependent on multiple reagents and complex laboratory procedures. Consequently, their applicability in industrial contexts is limited by issues of scalability and operational practicality.
Thermogravimetric Analysis (TGA) has emerged as a rapid, efficient, and cost-effective alternative for the preliminary evaluation of biomass composition. The DTG curve, which represents the rate of mass loss as a function of temperature, has proven particularly useful for identifying the thermal degradation behaviour of lignocellulosic materials. Numerous studies have demonstrated that deconvolving DTG profiles enables distinguishing the main decomposition stages associated with the major biomass constituents [
37].
After the initial moisture evaporation and the release of low-molecular-weight volatiles, typically occurring below 150 °C, the thermal degradation of structural components proceeds in a sequential manner:
Hemicellulose is the first component to degrade, typically decomposing at temperatures between 200 and 300 °C. Cellulose undergoes thermal breakdown next, displaying a sharper and more pronounced degradation peak between 250 and 380 °C.
Lignin, owing to its highly complex and heterogeneous aromatic structure, degrades over the widest temperature interval, beginning near 200 °C and extending up to approximately 1000 °C.
DTG deconvolution techniques enable semi-quantitative estimation of each component’s contribution to the overall mass loss. This approach improves the interpretation of biomass thermal behaviour and offers a practical methodology for compositional analysis in both research and industrial contexts [
38,
39,
40].
Woody biomass samples were analysed using TGA to determine their lignocellulosic composition. The decomposition behaviour was evaluated by deconvolving the derivative thermogravimetric (DTG) curves using a pseudo-component model, enabling the estimation of the relative contributions of individual biomass constituents. The DTG curve represents the rate of mass loss as a function of temperature, derived from data collected at a constant heating rate of 30 °C/min.
By comparing the DTG profiles of the biomass samples with those of isolated reference materials, cellulose, hemicellulose, and lignin, it becomes possible to identify the characteristic volatilisation temperature ranges of each component. This comparison supports the estimation of thermal degradation intervals and provides validation against values reported in the literature.
A multicomponent model was applied to the DTG data, considering four primary constituents: water, hemicellulose, cellulose, and lignin. A theoretical DTG curve was generated by combining the individual volatilisation curves of each component, modelled using symmetric Gaussian functions. Curve fitting was performed using the Solver tool in Microsoft Excel to align the theoretical curve with the experimental data.
For each component, three parameters were optimised: α (amplitude), corresponding to peak height; b (position), the temperature at maximum mass loss; and c (width at half height), representing the curve’s spread. The quality of the fit was assessed using the Mean Squared Error (MSE), which quantifies the variance between the experimental and theoretical DTG curves (Equation (5)) [
41].
DTG
T represents the theoretical DTG value at each temperature interval, obtained by summing the contributions of the four individual component curves. DTG
E corresponds to the experimentally measured DTG values at the same intervals, and
denotes the total number of data points. The expression for DTG
T as a function of the parameters α,
, and
is given in Equation (6).
The area under each DTG curve is directly proportional to the corresponding mass loss, allowing the mass loss of each biomass component to be determined through numerical integration. This calculation was performed using the trapezoidal rule, a straightforward and effective method for approximating integrals from discrete data points.
The integrative function
is applied to the symmetric Gaussian-type curves representing each component, enabling estimation of the total mass loss associated with each thermal event from the fitted DTG profiles. (Equation (7))
Analytical integration is expressed as follows in the form of integral I (Equation (8)).
2.8. Nuclear Magnetic Resonance (NMR) Analysis
The molecular composition of the bio-oil was examined through proton nuclear magnetic resonance (1H NMR) spectroscopy. Analyses were performed using a Bruker Avance 400 MHz spectrometer, Massachusetts, United States. Approximately 100 mg of bio-oil was dissolved in 6 mL of deuterated chloroform, and the resulting solution was subjected to 1H NMR analysis over a chemical shift range of 0–10 ppm. Spectral processing and interpretation were carried out using MestreNova 14 software.
2.9. Scanning Electron Microscopy (SEM) Analysis
Scanning electron microscopy (SEM) was employed to characterise morphological alterations in the biomass before and after liquefaction. Imaging was conducted using a Phenom ProX G6 microscope (ThermoFisher Scientific, Waltham, MA, USA) equipped with a low-vacuum detector operating at approximately 60 Pa.
2.10. Response Surface Methodology (RSM) and Statistical Analysis
Response Surface Methodology (RSM) integrates statistical and mathematical tools to model and analyse systems in which multiple variables influence a given response. Its primary objective is to optimise that response by assessing both individual variable effects and their interactions. While experimental correlations often rely on empirical linear, polynomial, or logarithmic models to simplify relationships, RSM extends this approach by effectively capturing non-linear behaviour through regression-based fitting. By combining statistical experimental design with numerical optimisation, RSM provides a systematic framework for designing experiments, evaluating factor–response relationships, and developing predictive models [
28]. Response Surface Methodology (RSM) provides a graphical means of visualising interactions among variables, allowing the influence of independent factors on a given response to be clearly interpreted. While simple correlations reveal basic relationships, RSM advances this analysis by modelling factor interactions and enabling response optimisation. To investigate the effects and interactions of the three experimental variables, reaction temperature (x
1), reaction time (x
2), and catalyst concentration (x
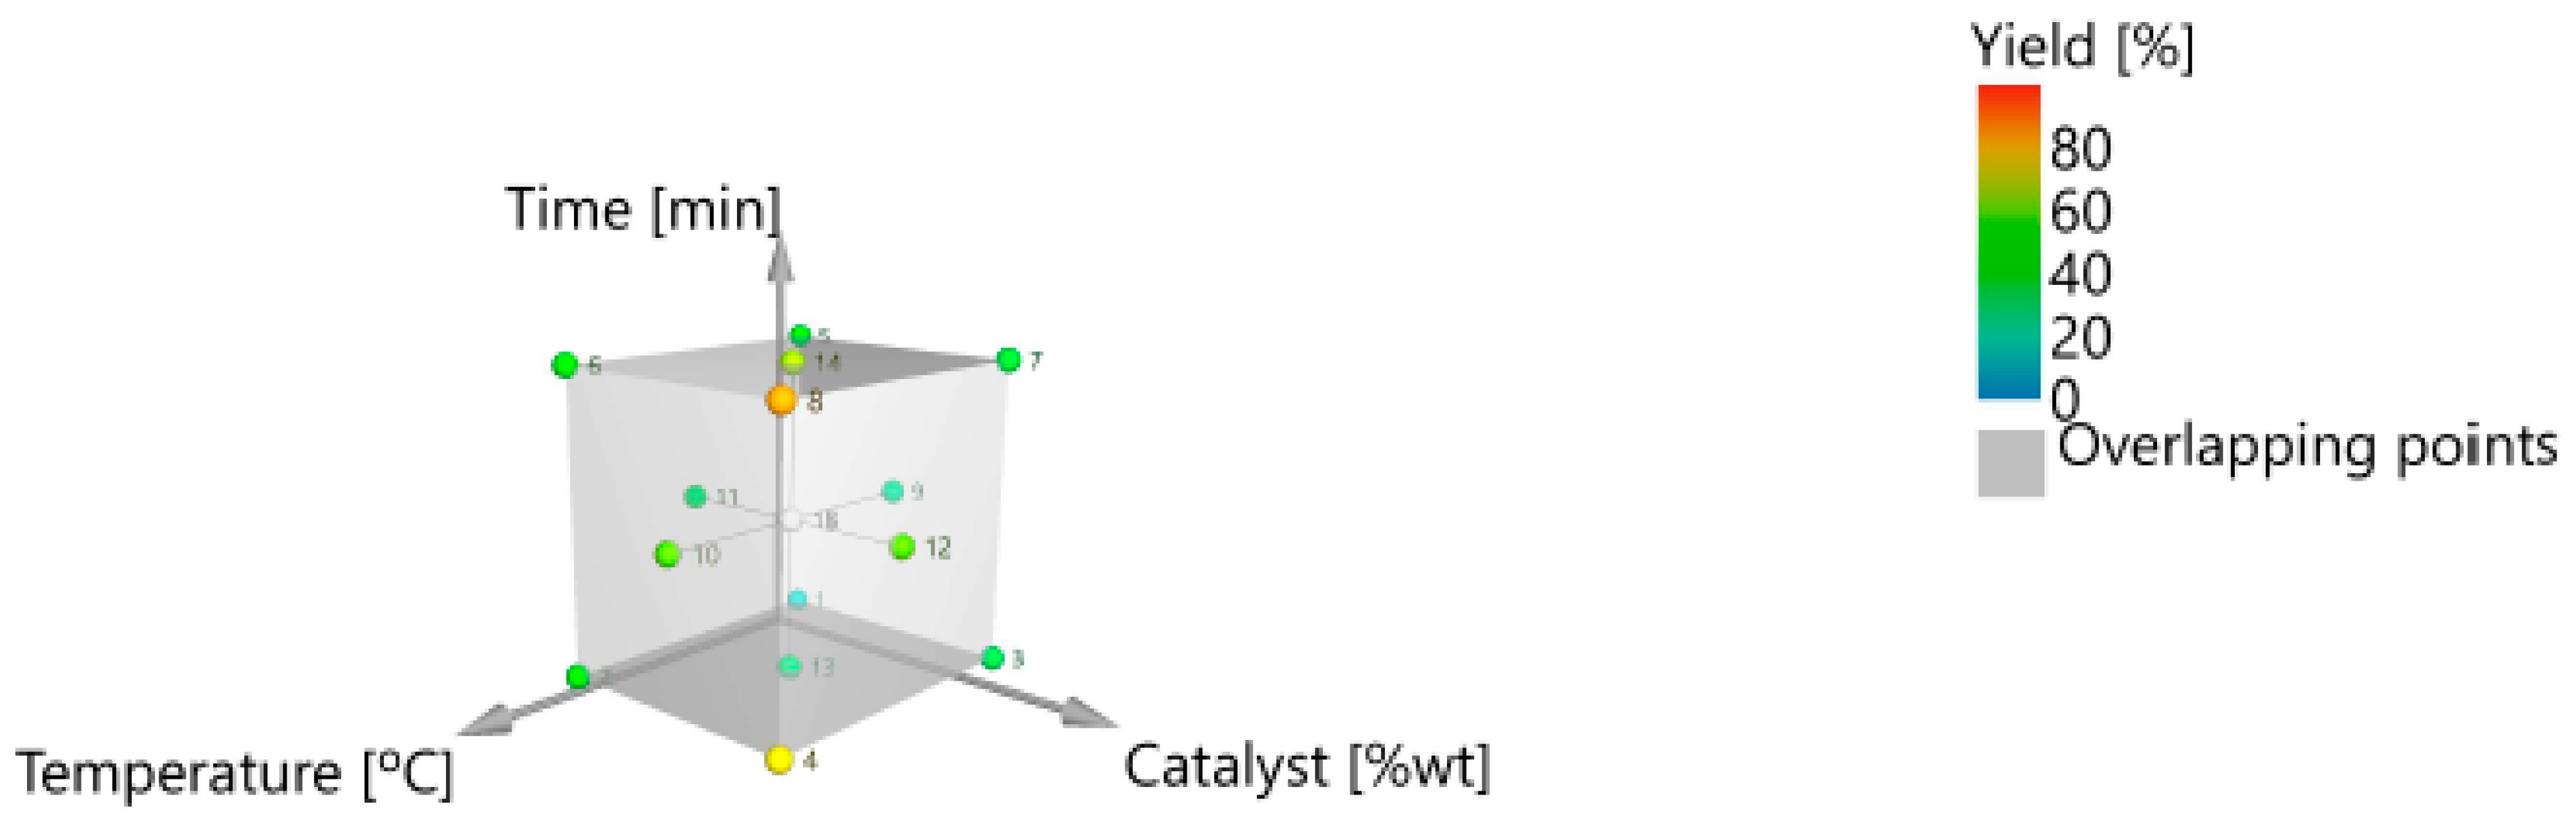
3), this study employed a central composite face-centred (CCF) design (
Figure 2). The experimental design incorporated three replicates at the cube’s central point (0,0,0), along with one experiment at each of the cube’s vertices (factorial points) and at the face-centred positions (axial points), resulting in a total of 17 experimental runs. The three variables, temperature, reaction time, and catalyst concentration, were coded and varied within the ranges of 120–160 °C, 30–90 min, and 1–3% (
w/
w), respectively. The conversion response (Y, %) as a function of these parameters is described by Equation (9).
γ represents the model’s output, while
xn denotes the independent variable, which is alternatively referred to as factors [
42,
43].
Equation (10), a second-order polynomial, provides the predictive model describing the process behaviour as a function of the studied factors [
42].
The response γ is expressed as a function in which the regression coefficients include β0 for the intercept, βi for linear effects, βii for quadratic terms, and βij for interaction effects. The independent variables xi and xj are unscaled, and ε represents the random experimental error. Implementation of the CCF design is supported by specialised software that streamlines design construction, model validation, and response surface evaluation. In this study, MODDE 13 Pro® was used to analyse the experimental data, performing regression fitting and analysis of variance (ANOVA) to evaluate main effects, interactions, and curvature, thereby ensuring the statistical robustness of the model.
3. Results and Discussion
3.1. Chemical Characterisation of Biomass
The liquefaction of
H. sericea was investigated to assess its potential as a feedstock for bio-oil production and to identify conditions that enable high yields while reducing reaction time and energy consumption. As noted, liquefaction is a thermochemical process that converts biomass into liquid fractions by applying heat in the presence of a solvent and a catalyst, enabling the subsequent production of fuels and value-added chemicals. Understanding the chemical composition and energy content of
H. sericea is therefore essential. Key feedstock properties, including elemental composition, higher heating value and lignocellulosic content, provide crucial indicators of its suitability for the liquefaction process.
Table 1 presents the elemental analysis, energy content, and lignocellulosic composition of the raw biomass, establishing a baseline for the subsequent analysis and discussion of results.
The biomass exhibited carbon, hydrogen, and oxygen contents of 45.39%, 6.40%, and 48.21%, respectively, while sulphur and nitrogen remained below the detection limit. It is widely recognised that the contents of these specific elements (S and N) can be disregarded due to their very low concentrations, as reported by other authors [
44]. The HHV of the feedstock was estimated at 15.92 MJ/kg using Dulong’s formula [
45,
46] (
Table 1). The elemental analysis of
H. sericea thus provides fundamental information regarding its composition and energy potential. The carbon and hydrogen contents indicate a biomass with relevant energy density, while the HHV further confirms its potential for efficient energy recovery during liquefaction.
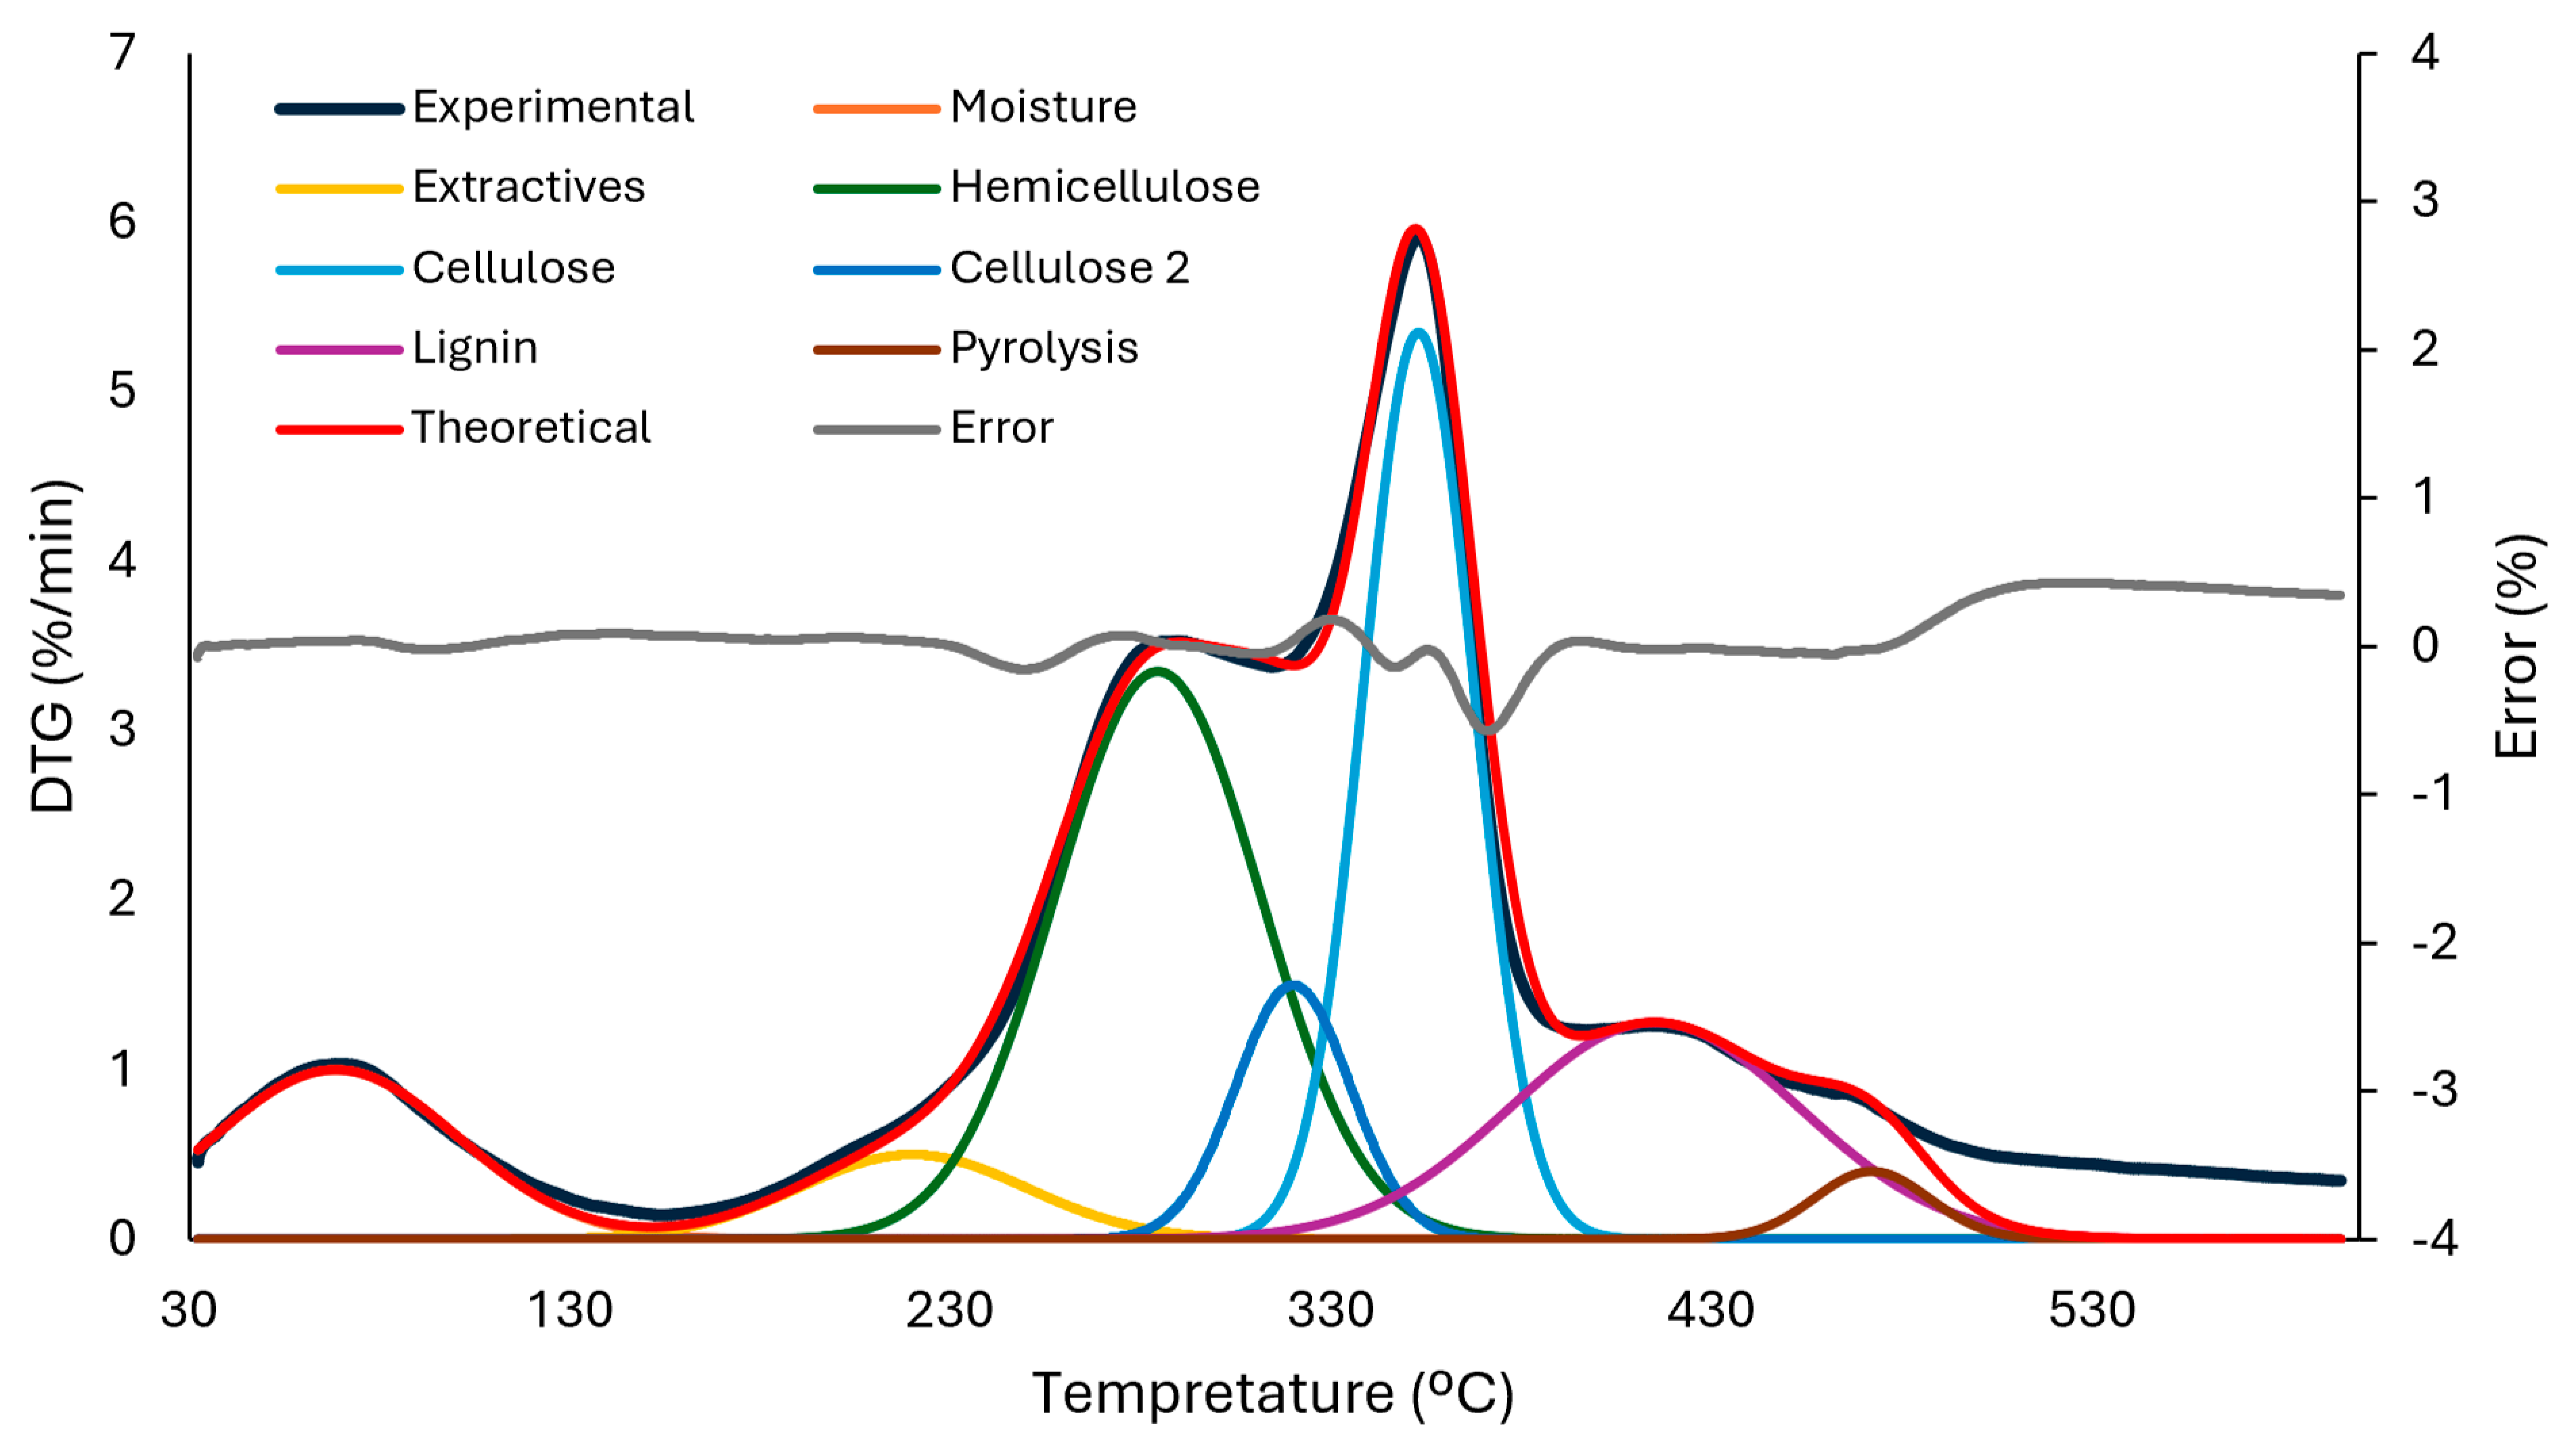
On the other hand, the total percentages of lignocellulosic components in the analysed biomass were obtained by summing the mass fractions of the decomposed volatile components and the fixed carbon residue and distributing them according to the proportions derived from DTG deconvolution as seen in
Figure 3. The resulting values, shown in
Table 1, represent the overall composition of the sample. The biochemical profile of
H. sericea, as determined from the deconvoluted thermogravimetric curves, exhibits a characteristic lignocellulosic distribution, with cellulose, hemicellulose, and lignin contents of 35.92%, 32.29%, and 17.36%, respectively. This composition is consistent with reported values for acacia and other hardwood species, in which cellulose typically represents the dominant fraction, followed by hemicellulose and lignin.
The study by Queirós et al. (2020) [
12] provided one of the first detailed chemical characterisations of
H. sericea, focusing specifically on the composition of its woody fruits. Their work highlighted the species’ high structural biopolymer content and confirmed its potential as a lignocellulosic feedstock. In comparison, the present study expands the compositional understanding of
H. sericea by analysing a more representative mixture of biomass fractions, including leaves, fruits, branches, and trunks, thus reflecting the heterogeneity typically encountered in biomass harvesting for valorisation. The mixed sample exhibited a lignin content of 17.36%, cellulose of 35.92%, and hemicellulose of 32.29%, values consistent with the structural profile expected for Proteaceae woody species and broadly aligned with the trends reported by Queirós et al. While their fruit-focused analysis emphasised the chemical robustness of the follicles, the inclusion of additional plant tissues in the present work leads to a slightly different balance of structural polymers, particularly a higher proportion of polysaccharides. The relatively elevated lignin and cellulose contents are particularly significant, as both components strongly influence the efficiency of solvent liquefaction and the distribution of the resulting products. Overall, the biochemical profile of Hakea supports its suitability as a feedstock for solvent-based liquefaction, a process that can generate energy-dense liquid biofuels and valuable platform chemicals. The choice of solvent plays a decisive role in maximising conversion efficiency and enhancing product quality [
47].
3.2. Biomass Liquefaction
Liquefaction experiments were conducted under a range of operational conditions to assess process performance, determine liquefaction yields, and support subsequent modelling efforts. The resulting data are summarised in
Table 2. The highest liquefaction yield (82.7%) was achieved at 160 °C with a reaction time of 90 min, whereas the lowest yield (15.59%) was obtained at 120 °C over 30 min. Overall, the results indicate that the
H. sericea mixture exhibits favourable liquefaction behaviour under appropriate temperature and time conditions.
The effectiveness of biomass conversion is demonstrated by the results obtained in this study using pTSA as an acid catalyst. With a degree of crystallinity substantially lower than that of widely used commercial mineral acids, pTSA may act as more effective for biomass liquefaction than conventional mineral acids, such as sulphuric or hydrochloric acids. Its lower crystallinity enables improved penetration into and interaction with the lignocellulosic matrix, promoting the cleavage of structural bonds and enhancing overall conversion efficiency. Furthermore, because pTSA is a milder acid than, for example, sulphuric acid, it helps minimise undesirable side reactions and bio-oil degradation. This combination of reduced aggressiveness and effective catalytic activity makes pTSA a favourable option for liquefaction processes [
48].
Experiments conducted at 160 °C demonstrated that both catalyst loading and reaction time play important roles in biomass conversion efficiency. At this temperature, conversion values ranged from 44.37% to 82.70%, with the lowest conversion corresponding to the shortest reaction time and the lowest catalyst concentration, and the highest conversion achieved under the longest reaction time and the highest catalyst concentration. At high conversion levels, secondary condensation reactions promote the formation of insoluble solid residues. These solid by-products are typically associated with recondensation reactions of degradation intermediates and are commonly identified as tar-like compounds and humins. This phenomenon reduces the yield of the liquid fraction [
49,
50].
Lower temperatures, such as 120 °C, were associated with reduced biomass conversion rates, ranging from 15.59% to 43.25%. This behaviour can be explained by the different activation energies required for the degradation of the main biomass constituents: hemicellulose, cellulose, and lignin. Lignin exhibits the highest activation energy, followed by cellulose and hemicellulose. Additionally, the presence of crystalline cellulose must be considered, as it can significantly influence the process. Compared with its amorphous counterpart, crystalline cellulose requires a higher activation energy for degradation. Consequently, the energy available in the reaction medium at lower temperatures may be insufficient to disrupt the crystalline structure of cellulose and the associated glycosidic bonds. The available energy at low temperatures is likely sufficient to hydrolyse only hemicellulose and amorphous cellulose [
44].
Response surface methodology was employed in this study to optimise the process, providing an effective tool for illustrating the interactions between different experimental factors and their corresponding outcomes. This approach facilitates the derivation of polynomial equations that describe the influence of each variable on the system response, in this case, the liquefaction yield. Using a Central Composite Face-Centred (CCF) design, an experimental matrix was constructed in MODDE 13 Pro
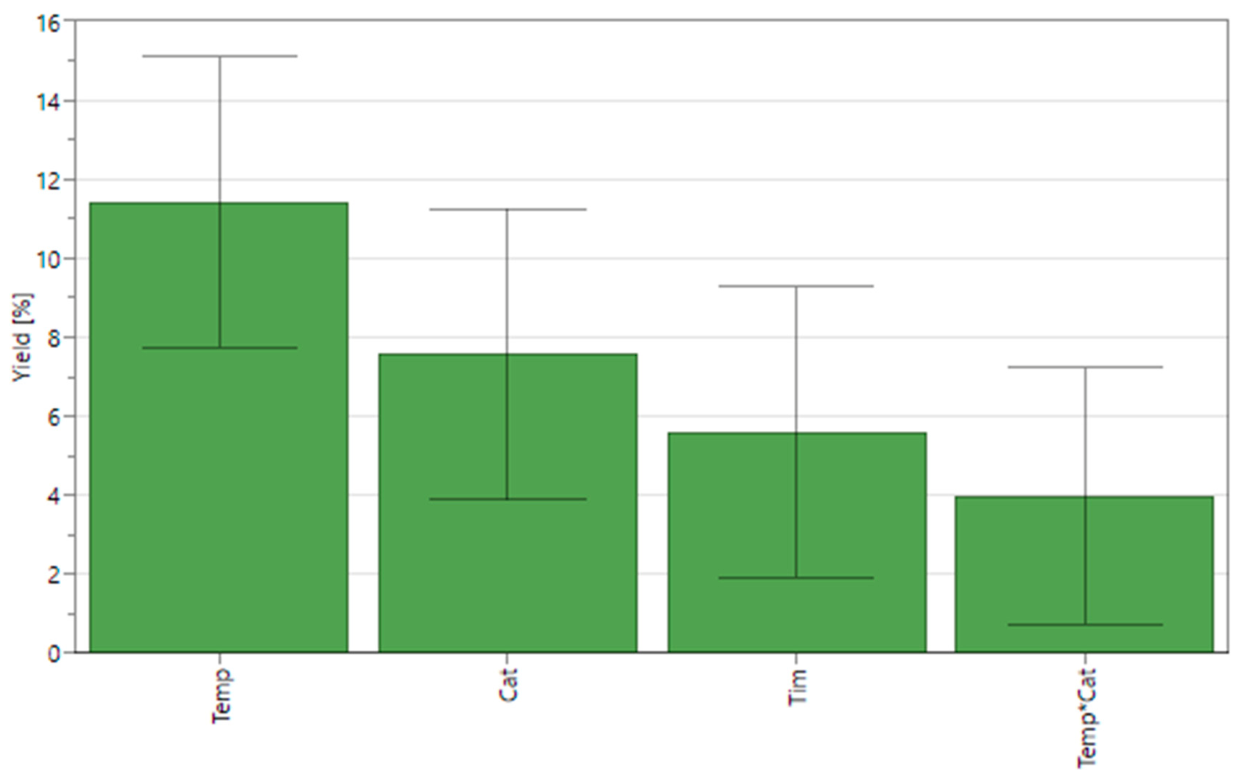
®. The analysis considered three variables: temperature (Temp), catalyst concentration (Cat), and time (Tim). Second-order effects and interactions between variables (TempTemp), (CatCat), (TimeTime), (TempCat), and (Time*Cat) were estimated. The model coefficient plot and correlation coefficient are presented in
Figure 4. The significance of each variable indicates the magnitude of its impact on the response. The results show that temperature and catalyst concentration are the main factors influencing conversion, whereas reaction time has a comparatively smaller effect on yield.
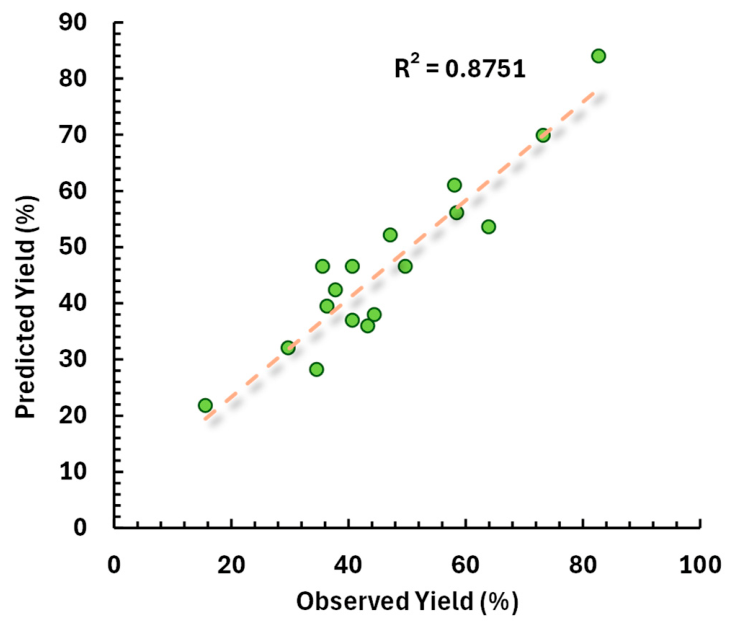
With an R
2 value of 0.875, the model exhibits a strong correlation with the experimental data, meaning that 87.5% of the observed variability is explained by the independent variables within the studied range, while the remaining variability remains unexplained. Consequently, the model demonstrates a good predictive capability, further supported by a Q
2 value of 0.753, which exceeds the recommended threshold of 0.5, confirming its reliability in estimating the effects of process optimisation and changes in operational parameters [
51]. In addition, the model presents a validity index well above the minimum required value of 0.25, and the measured repeatability of 0.875 exceeds the reference limit of 0.5, indicating good experimental control and low pure error.
Analysis of Variance (ANOVA) was employed to assess the statistical significance of the model equation. The results revealed a highly significant model term (F = 21.01470; p = 0.00002) at the 95% confidence level. The lack-of-fit test yielded a p-value greater than 0.05 (p = 0.64505), confirming that the regression model provides an adequate fit to the experimental data.
Figure 5 illustrates the performance of the model for both the calibration and validation datasets, as represented in Equation (11). These results demonstrate that the calibration model developed to predict the liquefaction behaviour of the
H. sericea mixture exhibits strong predictive capability, extending effectively to experiments conducted at different temperatures and catalyst concentrations.
The effect plot (
Figure 6) was used to evaluate the coefficients of the model. When the confidence interval of a coefficient intersects the origin, that coefficient is considered non-significant and is therefore excluded from the model. In this study, the terms X
1, X
2, X
3, and X
1X
3 were identified as significant contributors. Equation (11) presents the unscaled coefficients of the resulting response surface model.
In this model, Y1 represents the liquefaction yield, X1 the temperature, X2 the reaction time, and X3 the catalyst concentration. The resulting regression equation describes a multivariate system in which the liquefaction yield is influenced by linear and/or quadratic relationships among all operational parameters.
Temperature (X1) and catalyst concentration (X3) were identified as the primary parameters that linearly influence the liquefaction yield. Reaction time was the least influential variable, affecting the response only when accompanied by simultaneous increases or decreases in temperature and catalyst concentration. Overall, a significant correlation was observed between all three parameters and the variations in liquefaction yield.
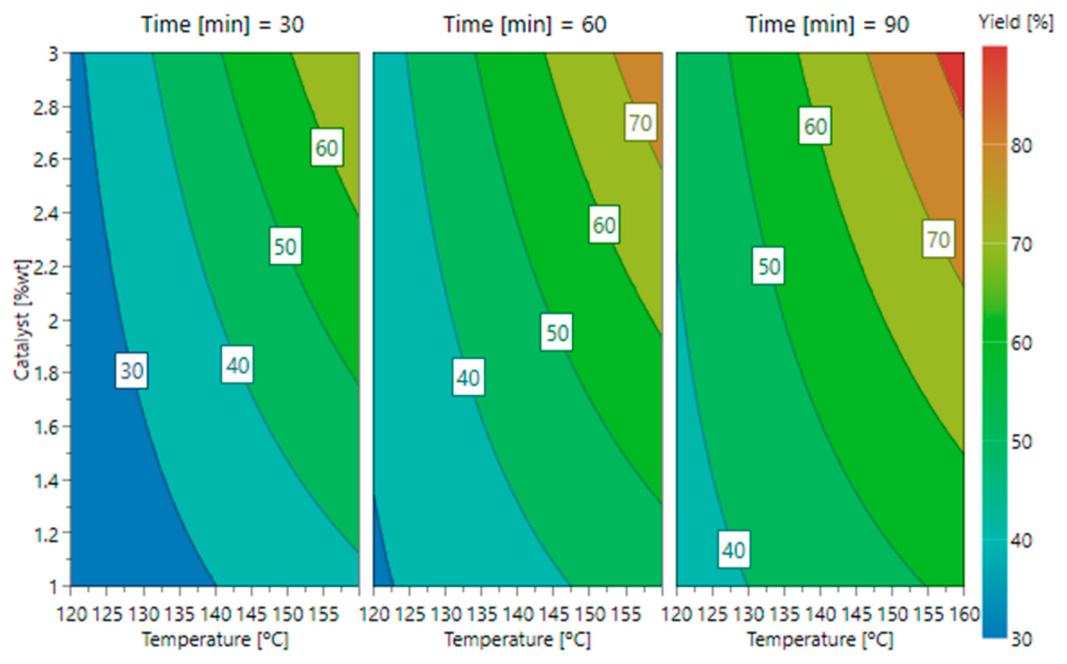
The contour map of the model, presented in
Figure 6, shows that temperature and catalyst concentration are the variables with the greatest influence on the process, whereas reaction time has a much smaller impact. Conversions above 70% were achieved within 30 min when the catalyst concentration and temperature are increased to 3% and 160 °C, respectively. In contrast, even at the maximum catalyst concentration (3%), liquefaction conversions remain consistently below 80% when reaction times of 90 min and temperatures below 160 °C are used. These results show that the highest conversion efficiencies are obtained at elevated temperature and catalyst concentration, enabling higher yields to be achieved in shorter reaction times.
Comparable conversion results have been reported in liquefaction studies using different types of biomasses. This work shows that the trunks, branches, and leaves of H. sericea can be converted into bio-oil without significantly affecting conversion rates. Thus, liquefying this biomass mixture may represent a promising strategy for valorising material collected during forest-clearing operations aimed at reducing fire risk.
To assess the model’s predictive accuracy, two additional experiments were conducted within the established experimental limits, using random values for the factors. The predicted responses were then compared with the experimental results. The validation conditions are presented in
Table 3. The conversions obtained fell within the predicted intervals, confirming the strong predictive capability of the RSM-based model. These results demonstrate that the developed model fits the experimental data well and reliably predicts the process behaviour.
3.3. Fourier Transformed Infrared-Attenuated Total Reflectance (FTIR-ATR) Analysis of Biomass, Bio-Oil and Solid Residue Samples
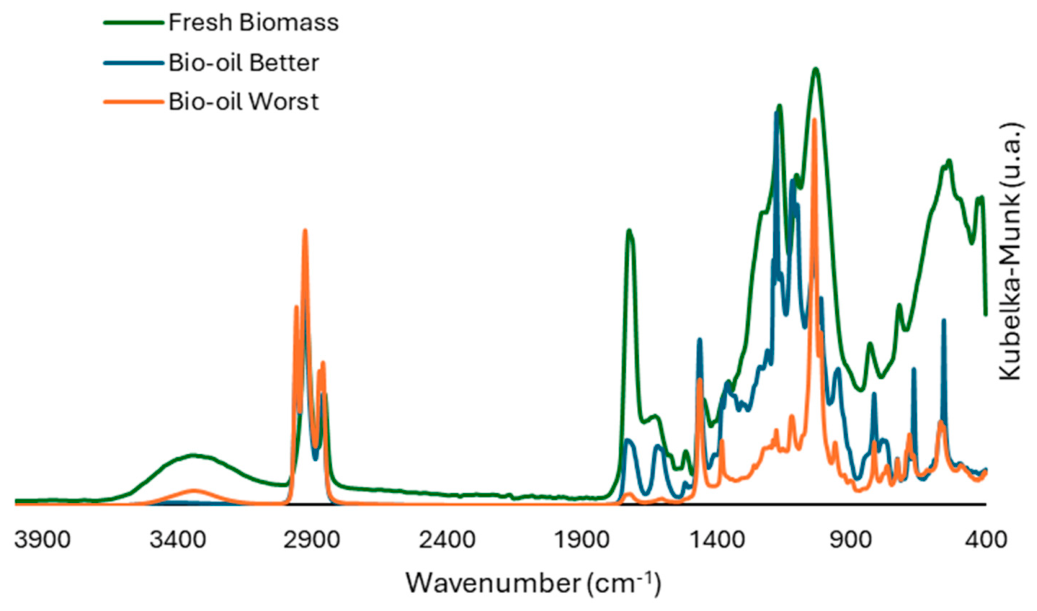
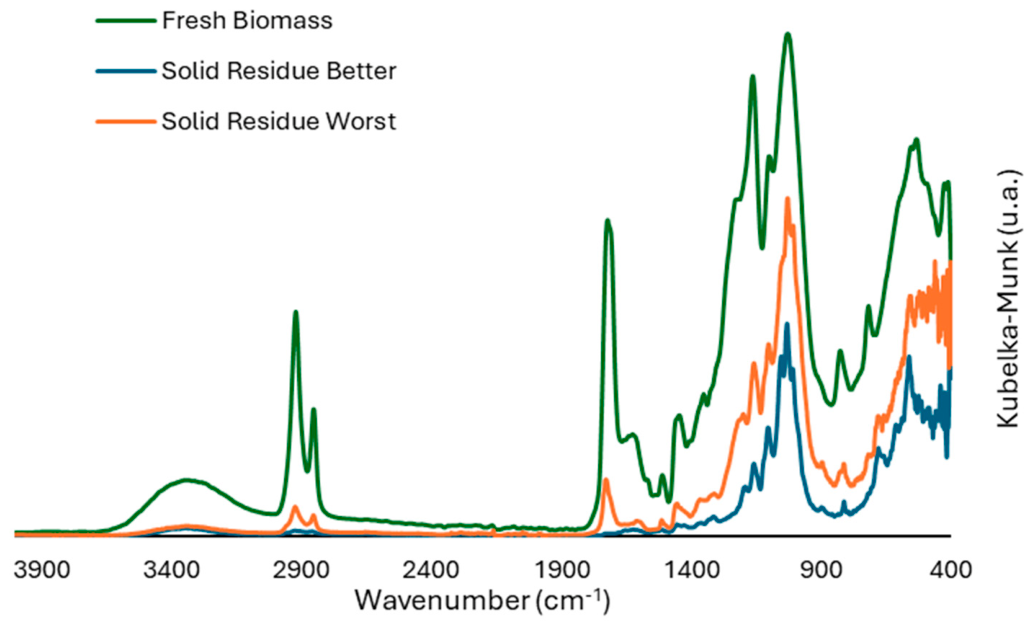
Figure 7 and
Figure 8 display the FTIR-ATR spectra of fresh biomass, liquid, solid samples used as solid residue, and the bio-oil product.
The FTIR analysis revealed functional groups originating from polysaccharides, lignin, and residual solvents. A broad O–H stretching band at 3400 cm−1 indicated the presence of alcohols and carboxylic acids, while C–H stretching bands between 3000 and 2800 cm−1 suggested contributions from the solvent. Strong carbonyl absorptions (1750–1700 cm−1) were attributed to aldehydes, ketones, esters, and acids formed during the thermal conversion of hemicellulose and cellulose. The C–O–H vibration between 1440 and 1395 cm−1 indicated aromatic carbohydrate derivatives, and peaks at 1036–1033 cm−1 and 1125–1123 cm−1 confirmed the presence of hydroxyl groups in the bio-oil.
Bands in the 1200–1000 cm
−1 region, corresponding to cellulose C–O stretching, suggested that hydroxyl groups were transferred from the solid phase to the liquefied biomass. Compared with fresh biomass, the C–H stretching intensity between 950 and 850 cm
−1 decreased in the solid residues; however, the liquefied biomass retained these bands, indicating that these bonds migrated to the liquid fraction. Comparison of the spectra from biomass, bio-oil, and solid residues showed that lignin-related peaks persisted in the bio-oil but were largely absent in the residues, while the residues retained peaks associated with unreacted holocellulose (
Table 4). Overall, the FTIR results confirmed extensive depolymerisation of lignocellulosic components and the transfer of functional groups from the solid to the liquid fraction.
3.4. Higher Heating Value (HHV) of Bio-Oil and Solid Residue Samples
The bio-oil and solid residue samples obtained from the reaction with the highest liquefaction efficiency were analysed for elemental composition, and the estimated HHVs were calculated. As expected, when compared with the corresponding ratios in the biomass feedstock, the liquefaction process reduced the O/C ratios of the bio-oils by approximately 0.35, reflecting the removal of oxygen during conversion. Variations in the H/C ratios were less pronounced, although the bio-oil exhibited values higher than those of coals and comparable to hydrocarbons.
Consequently,
Table 5 shows that the HHV of the bio-oil was significantly higher than that of the original biomass. The HHV increased from 15.92 MJ kg
−1 for the raw biomass to 31.91 MJ kg
−1 for the bio-oil, corresponding to an energy densification ratio of 2.00, indicating an energy gain from the bio-oil.
This improvement in calorific value is linked to the loss of water and oxygen during liquefaction, which increases the average mass fractions of hydrogen and carbon. The thermochemical liquefaction process employed in this study therefore produces bio-oils with higher HHVs than those typically obtained through other pyrolysis techniques, including fast pyrolysis, whose lower energy performance is attributed to the higher oxygen content of the resulting products.
3.5. Thermogravimetric Analysis (TGA) of Biomass, Bio-Oil and Solid Residue Samples
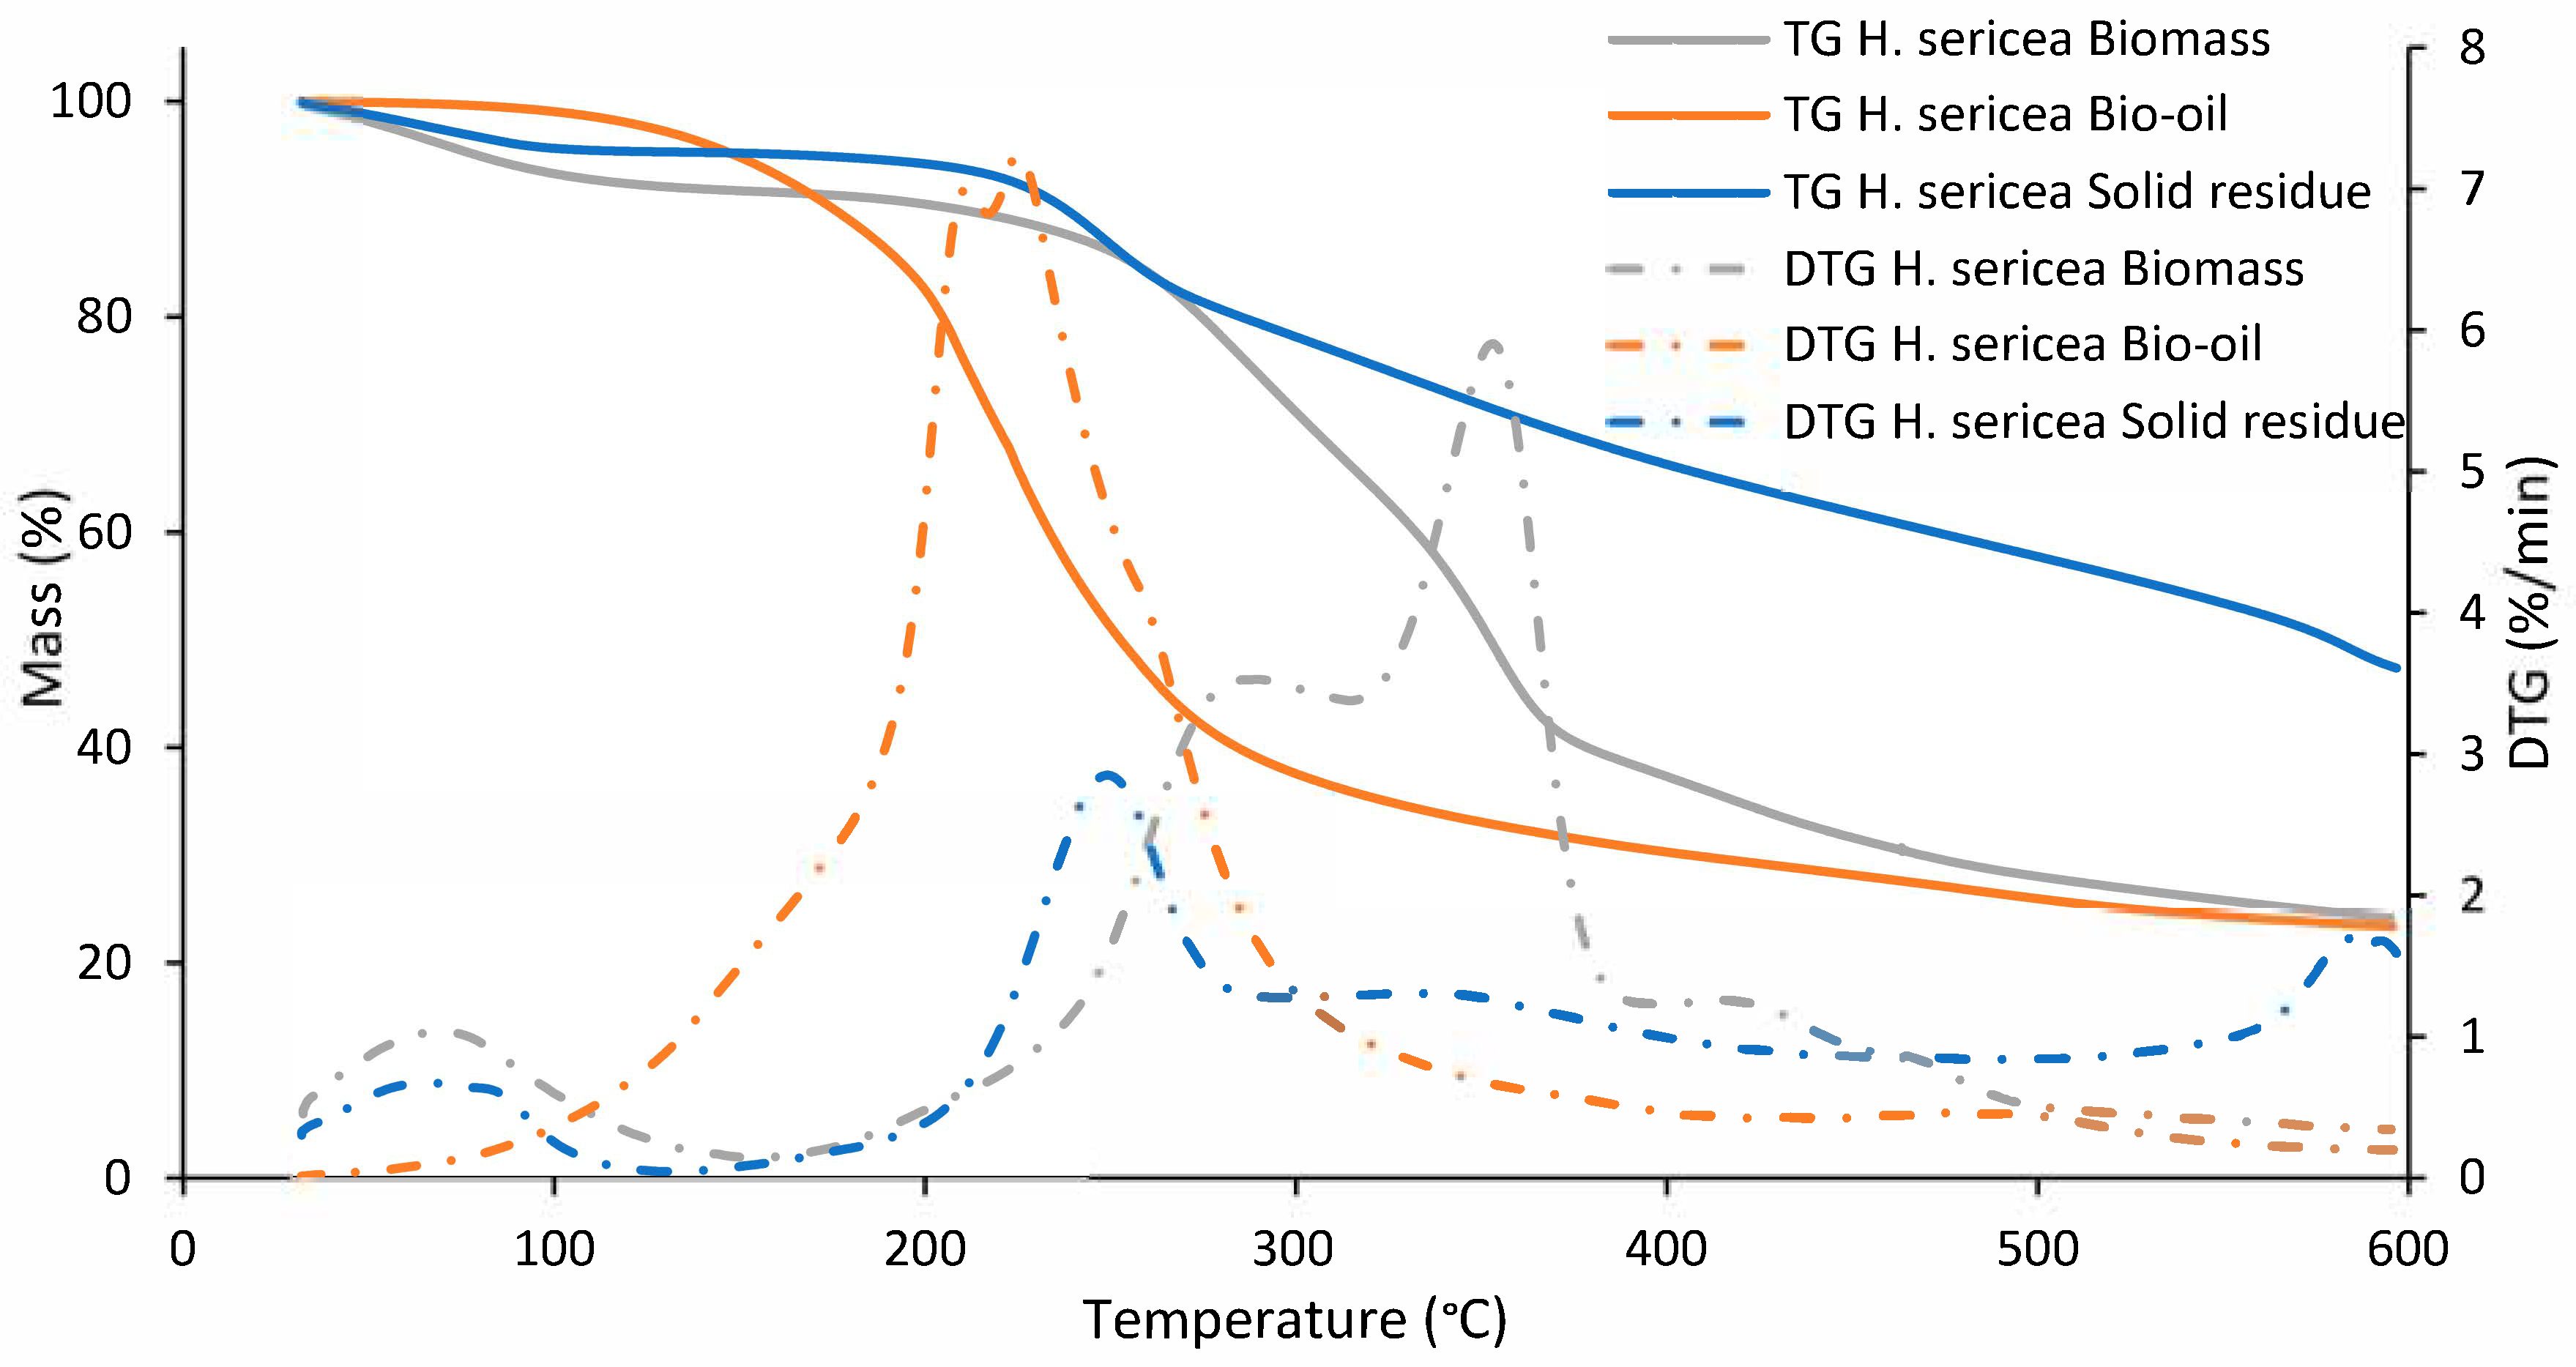
The mass loss of the biomass, solid residue, and bio-oil samples obtained from the reaction with the highest liquefaction yield is presented through the TG curves in
Figure 9, and
Table 6 reports the specific mass loss of the liquid and solid samples for the corresponding temperature ranges of the TG analysis.
The first stage for the biomass and solid residue samples occurs between 35 °C and 220 °C, during which the mass loss is associated with the removal of moisture and highly volatile compounds. The second stage occurs between 220 °C and 360 °C, during which the biomass undergoes 44% mass loss, corresponding to the active pyrolysis phase driven by the decomposition of cellulose and hemicellulose. The third stage, occurring between 360 °C and 600 °C, shows an additional 21% mass loss and reflects the continuation of active pyrolysis, mainly linked to lignin degradation. According to the literature, the typical temperature ranges for the thermal decomposition of hemicellulose, cellulose, and lignin are 210–325 °C, 310–400 °C, and 160–900 °C, respectively [
56].
Although hemicelluloses and cellulose are generally considered to be largely degraded during the active pyrolysis stages, lignin also undergoes decomposition within this temperature range. Above 600 °C, the mass loss becomes relatively small as the remaining char forms slowly. This process, known as passive pyrolysis, is often associated with the gradual breakdown of lignin [
57]. The behaviour of the solid residue supports this interpretation, the TG curve is nearly linear, and the mass loss progresses gradually up to approximately 550 °C. This trend suggests that the remaining solid consists mainly of ash and thermally stable carbonaceous material.
The bio-oil samples exhibited most of their mass loss progressively at relatively low temperatures, degradation began at around 150 °C and gradually slowed above 360 °C. A slight mass loss was also observed below 150 °C, possibly due to residual solvent in the bio-oil. The approximately 150 °C temperature corresponds to the onset of thermal degradation, which is typically associated with lighter compounds. The heavier components of the bio-oil are likely responsible for the average mass loss of 37% recorded in the second stage, occurring between 220 °C and 360 °C. The third stage, between 360 °C and 600 °C, is attributed to the slower disintegration of the sample and to the formation of non-degradable ash and carbon. Compared with biomass, the DTG curves show that bio-oil begins to lose mass earlier, confirming the presence of lighter volatile compounds such as alcohols, carboxylic acids, and aldehydes. This stage enables the removal of small, volatile organic molecules; however, non-volatile macromolecular compounds undergo thermal degradation via pyrolysis between 375 °C and 550 °C [
58].
3.6. Proximate Analysis of Biomass, Bio-Oil and Solid Residue Samples
The proximate analysis obtained by thermogravimetric analysis provides essential insights into the thermal decomposition behaviour and composition of forestry-based products (biomass, bio-oil, and solid residue) under controlled heating conditions. The moisture content (MC) values were relatively low across all samples (5%, 2%, and 5%, respectively). The substantial mass loss observed between 105 °C and 600 °C, primarily associated with the release of volatile matter (VM), highlights the thermal instability of the materials under a nitrogen atmosphere. Bio-oil exhibited a pronounced mass loss of 55% between 154 °C and 366 °C, whereas biomass showed a lower loss of 48% over a slightly higher temperature range (263–384 °C). This difference indicates that bio-oil releases its volatile components at lower temperatures than biomass, likely because it is enriched in lightweight, thermally sensitive compounds formed during liquefaction. In contrast, the solid residue showed much lower VM-related mass losses (25% and 16% in the corresponding ranges), as expected. Its enhanced thermal stability can be attributed to its reduced VM content and the presence of thermally stable fixed carbon (FC).
The data also show that bio-oil experienced the highest overall mass loss during the nitrogen phase due to volatile matter (VM) release (80%), followed by biomass (74%). This behaviour is expected, as bio-oil is enriched in lightweight, thermally unstable compounds formed during liquefaction, which readily volatilise at moderate temperatures. Biomass, in contrast, contains structurally complex polymers such as cellulose, hemicellulose, and lignin, which decompose more gradually and at higher temperatures. The greater mass loss observed for bio-oil therefore reflects its composition, dominated by highly volatile, partially refined compounds.
In the final stage, where nitrogen flow was replaced by air at 600 °C, oxidation of fixed carbon occurred. Biomass and bio-oil exhibited FC values of approximately 21% and 18%, respectively, with bio-oil leaving no residual ash. This observation indicates that the bio-oil is fully combustible, a favourable characteristic for energy applications. Similarly, biomass showed no ash retention, suggesting that this species contains minimal mineral impurities. The solid residue, being a by-product rich in fixed carbon, demonstrated high stability during this phase, underscoring its potential as a carbonaceous material for energy production or soil amendment.
Overall, the results highlight the distinct thermal characteristics of biomass, bio-oil, and solid residue. The higher VM content of the biomass indicates a less thermally refined material, whereas the absence of ash and the bio-oil’s high combustibility support its suitability as a clean-burning fuel. The solid residue, with its high carbon content and strong thermal stability, shows promise for applications requiring persistent carbon-based materials. These findings are crucial for optimising the use of agricultural by-products in energy production and material applications (
Table 7).
3.7. Nuclear Magnetic Resonance (NMR) Analysis of Bio-Oil Sample
The complex composition of bio-oil results from the extensive network of reactions during lignocellulosic biomass liquefaction, in which holocellulose and lignin break down into a wide range of smaller compounds. These intermediates, such as acids, alcohols, ketones, aldehydes, and phenolics, can further react to form new products, including esters and stable aromatic structures. Together, these successive transformations yield a chemically diverse, highly heterogeneous mixture characteristic of bio-oil [
59].
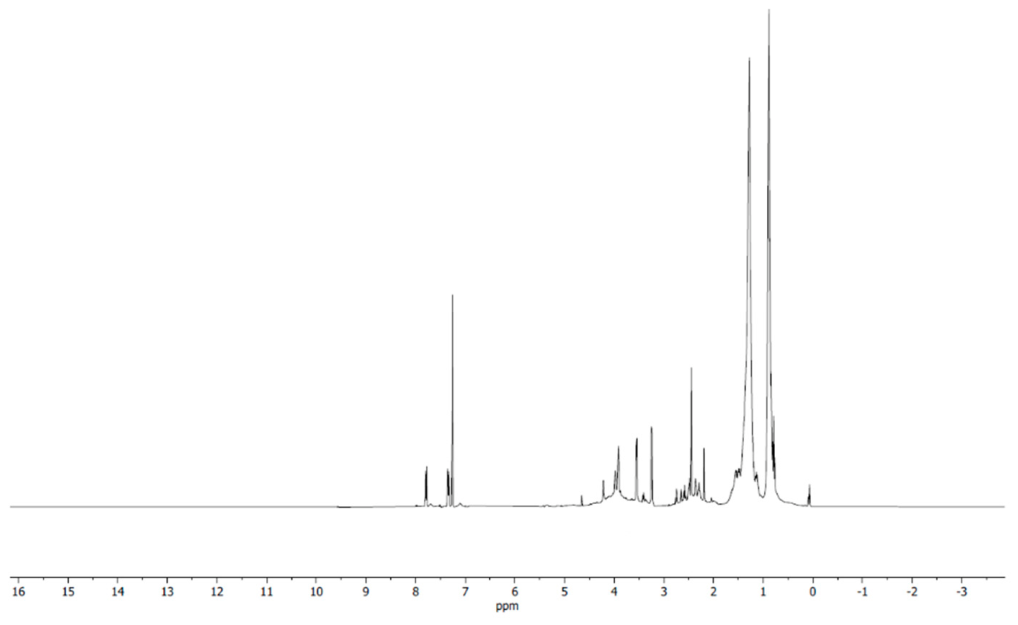
The proton NMR analysis of the bio-oil shows that the largest fraction of protons (around 58%) appears between 0.5 and 1.5 ppm, a region characteristic of aliphatic protons on carbon atoms distant from C=C bonds or heteroatoms, indicating a high aliphatic content and possible solvent retention (
Figure 10 and
Table 8). The following region, from 1.5 to 3.0 ppm, corresponds to protons on aliphatic carbons adjacent to heteroatoms or bonded to aromatic or olefinic centres, accounting for approximately 10% of the total and suggesting the presence of functionalised aliphatic segments.
Between 3.0 and 4.4 ppm, about 26% of the protons were assigned to groups adjacent to aliphatic alcohols or ethers, as well as methylene units linking aromatic rings, consistent with partially degraded lignin oligomers. The region from 4.4 to 6.0 ppm, associated with carbohydrate-type protons and aromatic ethers (including methoxyphenols), was observed at low abundance (3.4%), as typically observed in bio-oils derived from woody biomass.
The aromatic region, spanning 6.0 to 8.5 ppm, accounted for 2.3% of the protons, reflecting the presence of aromatic and heteroaromatic compounds likely originating from lignin or secondary reactions. Notably, the abundance of aromatic protons does not correlate directly with the biomass’s lignin content or the bio-oil’s energy content, suggesting that the liquefaction conditions strongly influence aromatic structures.
3.8. Scanning Electron Microscopy (SEM) Analysis of Biomass and Solid Residue Samples
The fresh biomass exhibited a network of porous, irregularly shaped fibres, with morphological variability clearly visible under scanning electron microscopy (SEM). Following the liquefaction process, this fibrous structure underwent extensive disruption and disaggregation, although some voids associated with the liquefaction yield remained visible.
Among the solid residues obtained after the reaction, the sample with the highest conversion yield displayed a lighter consistency, with fibres still discernible and already detached from the structure that originally bound them. In contrast, the residue from the reaction with the lowest conversion yield showed a surface with fewer pores than the fresh biomass and remained comparatively unaltered, as seen in
Figure 11.
4. Conclusions
This study demonstrated the potential of thermochemical liquefaction as an effective valorisation pathway for H. sericea, an invasive shrub widely established in Mediterranean ecosystems. Whole plant biomass, including leaves, branches, and trunk, was successfully converted into liquid products through acid-catalysed liquefaction in 2-ethylhexanol, with process optimisation performed using the Response Surface Methodology. Conversion efficiencies ranged from 44.37% to 82.70%, with the highest yields obtained at elevated temperatures and catalyst concentrations. Conversions above 70% were achieved within 30 min at 160 °C with 3% catalyst loading, confirming the dominant influence of temperature and catalyst concentration on liquefaction performance, while reaction time exerted a comparatively smaller effect. The statistical model we developed exhibited strong predictive capacity, with a repeatability value of 0.875, supporting the robustness of the optimisation framework and its suitability for future process control and scale-up.
Chemical analyses of the products confirm the extensive breakdown of lignocellulosic structures. FTIR spectra revealed the loss of holocellulose bands and the emergence of carbonyl and aliphatic signals in the bio-oil, confirming the transfer of functional groups from the solid to the liquid phase. The 1H NMR results further highlight the predominance of aliphatic compounds (≈58%), indicating that the liquefaction process favours the formation of reduced, energy-rich molecules.
Physicochemical analyses confirmed extensive degradation of the lignocellulosic matrix, consistent with the observed high conversion levels. Elemental composition (42.44% C, 6.22% H, 51.34% O) and spectroscopic and thermal data indicated the formation of aliphatic and oxygenated compounds derived from depolymerised lignin and solvent-related reactions. Although residual solvent in the bio-oil can affect FTIR and NMR signals, influence elemental composition, and bias HHVs, the unrecovered fraction is only about 4%, which is sufficiently low to have a negligible impact on these analytical results.
The bio-oil exhibited an HHV of 31.91 MJ kg−1, corresponding to an energy densification ratio of 2.00 relative to the raw biomass, demonstrating the effectiveness of the process in concentrating energy through deoxygenation and volatilisation. Thermogravimetric analysis confirmed the presence of lighter, thermally labile compounds in the bio-oil, which degraded at lower temperatures than the original biomass. In contrast, the solid residue exhibited greater thermal stability and a higher fixed carbon content, suggesting potential applications as a carbonaceous material.
Microscopic observations further revealed severe disruption of the fibrous plant structure, corroborating the efficiency of the liquefaction process. Processing the entire shrub reduced preprocessing requirements and improved resource efficiency compared with fraction-based approaches.
Overall, thermochemical liquefaction represents a promising strategy for the sustainable management of H. sericea biomass, integrating biomass valorisation with invasive species control and wildfire fuel-load reduction. Future work should focus on bio-oil upgrading, sustainable solvent systems, process optimisation, pilot-scale validation, and life-cycle assessment.