
Article

Valorization of Vinasse and Ethanol Stillage in Bioelectrochemical Systems via Sequential Microbial Sulfate Reduction and Biomethanation

Department of Engineering Geoecology, Faculty of Geological Survey, University of Mining and Geology “St. Ivan Rilski”, Prof. Boyan Kamenov Str., Studentski Grad, 1700 Sofia, Bulgaria
*
Author to whom correspondence should be addressed.
Biomass 2026, 6(2), 21; https://doi.org/10.3390/biomass6020021
Submission received: 21 December 2025 / Revised: 5 February 2026 / Accepted: 3 March 2026 / Published: 5 March 2026

Abstract

In laboratory installations, wastewater from the distillery industry (ethanol stillage and vinasse) is treated via a two-stage combination of microbial sulfate reduction (MSR) and biomethanation, assisted by bioelectrochemical systems (BESs). In the first stage, a sulfidogenic bioreactor with an integrated microbial fuel cell (MFC) is used, which partially oxidizes the produced H2S and facilitates the conversion of organic compounds. Sulfate removal reaches 95.4% (stillage) and 92.8% (vinasse), with corresponding COD reductions of 30.6% and 36.5%, respectively. The polarization curves, power density, generated current, and coulombic efficiency are analyzed. The sulfidogenic bioreactor consortium is dominated by Deltaproteobacteria, which contributes to acetate accumulation during the MSR stage. Methanogens are dominated by the genus Methanofolis. In the second stage of anaerobic digestion, three treatment options are investigated: direct biomethanation, biomethanation after preliminary MSR, and biomethanation after MSR with a microbial electrolysis cell (AD-MEC). The highest COD conversion rates are achieved in the AD-MEC variants: 91.36% for ethanol stillage and 92.8% for vinasse. Microbial communities are dominated by acetoclastic methanogens of the genus Methanothrix. For stillage treated after MSR, biogas production is nearly double that from direct methanation. For vinasse, the largest amount of biogas is generated during by the integrated MEC system, followed direct methanation. Methane content is the highest in methanation after MSR in AD-MEC (93.4–93.6%).

1. Introduction

Ethanol stillage and vinasse, as major waste products of the distilling industry, pose a serious environmental challenge and rank among the most difficult industrial wastewaters to treat. These waste products are marked by a high level of acidity (pH 3.0–4.2), considerable organic matter (chemical oxygen demand (COD) 50–150 g/L), a dark hue, and frequently include nitrogen compounds, sulfates, and persistent organic compounds such as melanoidins and phenols [1,2,3]. Vinasse and stillage are by-products of ethanol production, with vinasse originating from grapes and stillage from corn or wheat. Compared to ethanol stillage, vinasse has a more balanced composition, containing small amounts of unfermented sugars, high levels of amino acids, organic acids, potassium, nitrogen, and phosphorus. Approximately 10–15 L of vinasse or stillage are generated per liter of ethanol produced [3]. In some countries, such as Brazil, vinasse is applied as a soil fertilizer, whereas in others, its use is strictly prohibited due to risks of soil degradation, groundwater contamination, and increased emissions of methane and nitrous oxide, depending on the soil type [4].
Conventional anaerobic processes for wastewater treatment, such as up-flow anaerobic sludge blanket (UASB) reactors or anaerobic lagoons, often fail to achieve sufficient removal of organic compounds and biogas production, primarily due to the inhibitory effects of high sulfate and sulfide concentrations on methanogens [5]. Anaerobic digestion (AD) is a well-established biotechnology for stabilizing organic waste streams while simultaneously recovering energy in the form of biogas. Despite its wide applicability, the energy recovery efficiency of AD typically remains limited to around 40% of the energy contained in the substrates, largely due to thermodynamic constraints and incomplete hydrolysis of polymeric organic compounds [6].
High sulfate concentrations in wastewater (2.1–5.8 g/L) promote sulfate-reducing bacteria (SRB), which can outcompete methanogens for shared electron donors, lowering methane yields and increasing the risk of sulfide toxicity [2,3,7,8,9]. Sulfides are toxic to methanogenic archaea at concentrations above 200–300 mg/L, and the presence of hydrogen sulfide also deteriorates biogas quality [10]. In general, anaerobic digestion is not inhibited by sulfides when the COD/SO4 ratio in the wastewater exceeds 10 g/g, whereas strong inhibition occurs at ratios below 0.5 g/g [1].
In practice, the inhibitory effects of sulfides are commonly mitigated by chemical precipitation using reagents such as ferric chloride or calcium hydroxide, or by sorption methods employing activated carbon, iron filings, and other sorbents [11]. However, these approaches often increase operational costs and the environmental footprint. Recently, an innovative technological solution has been proposed, involving the capture of hydrogen sulfide on a carbon-based sorbent followed by its regeneration in a fuel cell mode, where sulfides are oxidized to various forms of sulfur in the anodic zone [12].
Alternately, microbial sulfate reduction (MSR) is widely applied in the treatment of mining wastewater, as it reduces sulfate concentrations and precipitates heavy metals as insoluble metal sulfides through the generation of hydrogen sulfide [13,14]. Sulfate-reducing bacteria use lactate, acetate, ethanol, glucose, and other diverse wastewater-containing organic compounds as sources of carbon and energy [15,16,17,18]. Based on their ability to degrade organic substances, SRB are classified as either complete or incomplete oxidizers. Species of the genera Desulfobacter and Desulfotomaculum fully oxidize organic compounds to carbon dioxide, whereas representatives of the genera Desulfovibrio, Desulfomicrobium, Desulfobulbus, and others incompletely oxidize substrates such as lactate, ethanol, glycerol, and propionate to acetate and bicarbonate ions [19].
In many MSR applications, incomplete oxidation predominates due to the composition of the microbial consortium, resulting in the accumulation of acetate at high concentrations [20,21,22]. Acetate production represents a major limitation in some sulfidogenic bioreactors, as it contributes significantly to residual COD [23]. However, acetate is also a key intermediate product in anaerobic degradation, serving as a carbon and energy source for methanogenic archaea and enabling high COD removal rates. Numerous studies investigate the structure of microbial communities and the complex interactions among fermentative, syntrophic, sulfate-reducing, and methanogenic bacteria using different electron donors [24,25,26]. The competition between SRB and methanogens in anaerobic digestion largely depends on the type of substrate and COD/SO4 ratio.
Sequential separation of MSR and methanogenesis can be regarded as a rational strategy to optimize both sulfate reduction and methane production. The first treatment stage allows sulfate reduction and formation of volatile fatty acids (primarily acetate), while the subsequent methanogenic stage uses these intermediates as substrates, leading to increased COD removal and higher biogas yield. A similar concept is implemented by Jun Li et al., 2024 [27], who describe a novel two-phase internal circulation (IC) reactor in which sulfate reduction and methanogenesis are separated into two distinct zones with different pH values and microbial activities: the first zone is optimized for MSR and the second for methanogenesis. This approach achieves higher COD removal efficiency and reduces competition between SRB and methanogens, while facilitating stable operation of both processes in a phase-separated configuration.
Bioelectrochemical systems (BESs), including microbial fuel cells (MFCs) and microbial electrolysis cells (MECs), have been successfully applied for the removal of both organic and inorganic pollutants from wastewater [28]. The primary mechanism relies on the oxidation of organic compounds, which serve as electron donors, with the released electrons captured by an insoluble anode rather than by natural electron acceptors such as oxygen, sulfates, iron, or nitrates [29].
BESs also offer attractive applications in MSR and biomethanation processes. In heterotrophic MSR occurring in the anodic chamber of an MFC, the hydrogen sulfide formed as a metabolic product acts as a natural electron mediator. This facilitates electron flow to the anode without additional chemical mediators, while part of the hydrogen sulfide is oxidized directly on the anode surface, contributing to electrogenesis [30]. MEC-assisted processes can enhance methane production by improving electron transfer and redirecting electrons from competing pathways, such as sulfate reduction. For instance, MECs alleviate sulfide inhibition by promoting sulfide oxidation at the anode [31] and foster syntrophic interactions between fermentative bacteria and methanogens, further improving biogas yield [32].
The aim of this study is to maximize the utilization of organic waste substrates from the distillery industry through the sequential implementation of MSR and biomethanation in combination with BESs. The proposed technology targets are as follows: (a) purification of wastewater from high concentrations of organic compounds and sulfates, (b) enhancement of methane yield, and (c) increased overall system efficiency through the additional energy generated. Through the synergy between microbial and electrochemical processes, this study aims to propose a sustainable approach for managing difficult-to-treat wastewater, while enabling energy recovery and reducing environmental pollution.

2. Materials and Methods

2.1. Design of the Laboratory Installation

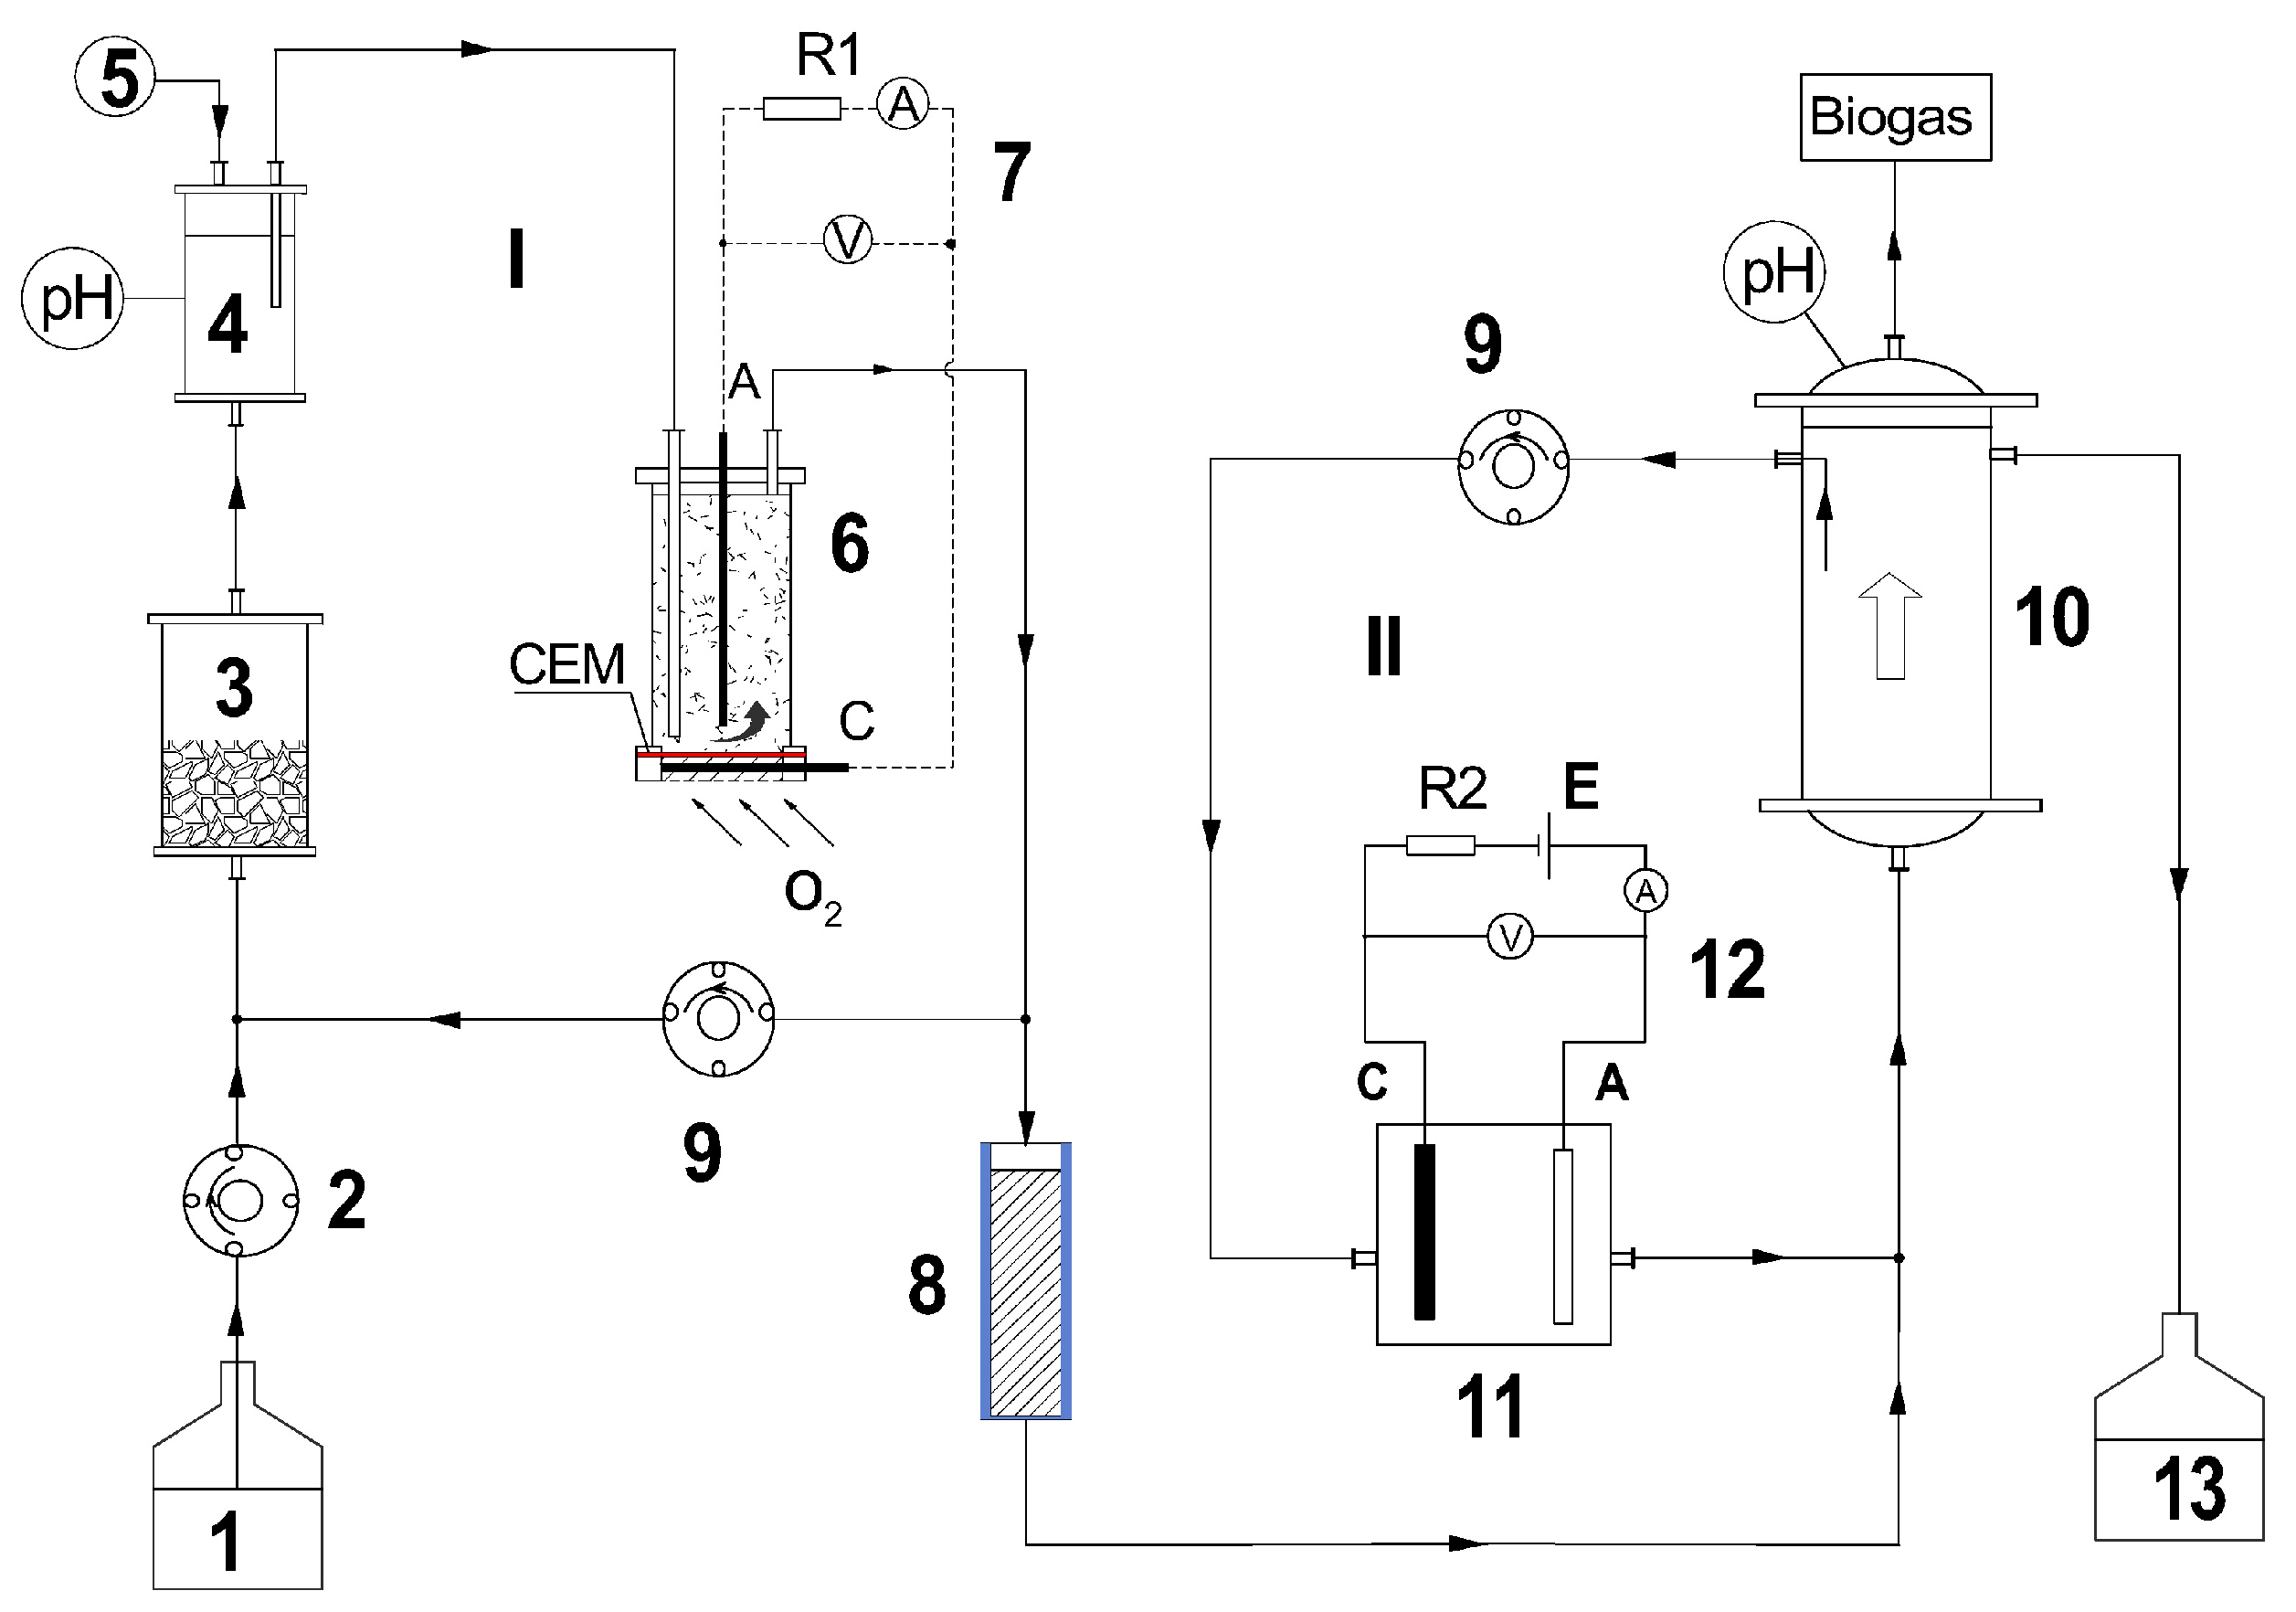
To implement the sequential processes of microbial sulfate reduction and biomethanation with integrated bioelectrochemical systems, a laboratory installation (Figure 1) was configured, consisting of two technological circuits: the MSR circuit (I) and the biomethanation circuit (II).
Circuit I, intended for the MSR stage, comprised the following main components: a feed tank (1); dosing pump (2); anaerobic bioreactor with biomass carrier (3); buffer vessel for pH correction (4); microbial fuel cell (MFC) with air cathode (6); MFC load circuit (7); recirculation pump (9). The anaerobic bioreactor (3) had a geometric volume of 0.5 dm3, with 0.3 dm3 as the liquid phase. Modified zeolite (clinoptilolite, 2.5–5.0 mm) served as the biomass carrier, as described in Angelov et al. [30]. The liquid phase was recirculated by the recirculation pump (9) at a flow rate of 5 dm3/h, which led to the homogenization of the treated water in the sulfidogenic bioreactor (with operational volume of 0.3 dm3)–microbial fuel cell system. The buffer vessel (4) had a volume of 0.4 dm3 and allowed periodic sampling for chemical analyses. The integrated MFC partially utilized H2S to generate additional energy. The MFC was cylindrical, 3D-printed from PETG filament, and consisted of two chambers, an anode (0.10 dm3) and a cathode (0.068 dm3), separated by a cation exchange membrane (CMI-7000S, Membrane International Inc., Ringwood, NJ, USA) with an area of 0.0028 m2. A graphite rod (8 mm diameter, 120 mm length; surface area 0.0302 m2) served as the anode, while pressed activated carbon (2–4 mm) formed the cathode layer, 24 mm thick, with an embedded graphite rod (8 mm diameter, 40 mm length). The hydraulic retention time (HRT) of the treated water through the sulfidogenic bioreactor, microbial fuel cell, and buffer vessel system was 22 h; the HRT through the anode zone of the MFC was 2.75 h. Residual hydrogen sulfide was removed in an adsorption column (8), with a diameter of 110 mm, height of 450 mm, and a working volume of 2 dm3, filled with 1 kg of iron filings, providing an HRT of 96 h. The iron absorbent in the sorption column (8) was replaced once every 35 days, following the completion of the experiments under the specific investigated operating regime.
Circuit II, intended for the biomethanation stage, included a stainless steel UASB reactor (10); working volume of 4.1 dm3, microbial electrolysis cell (MEC, 11); recirculation pump (9); MEC load circuit (12); biogas collection balloon (7); and outlet vessel (8). The MEC was a single-chamber, “sandwich”-type cell made of plexiglass without a separator/membrane, with a chamber operational volume of 0.2 dm3. Graphite plates (100 × 100 × 6 mm; geometric area 0.021 m2) were used as electrodes, with an interelectrode distance of 15 mm.
MEC electrodes could be supplied with a constant external voltage (0.8 V) and allowed continuous monitoring of electrical parameters. Through the recirculation pump, water from the anaerobic methanation reactor was fed into the MEC, while effluent from the MEC was returned to the reactor. The recirculation pump (9) provided an upward flow of 10 dm3/h in the bioreactor. The total HRT through the anaerobic methanation reactor and MEC was approximately 10 days (240 h), while the HRT through the MEC alone is 11.4 h.
The dosing pump (2) sequentially supplied both circuits. For direct methanation studies, the pump supplied the substrate solely to the biomethanation stage.

2.2. Microbial Cultures

The anaerobic MSR reactor (3) was inoculated with an enriched culture of sulfate-reducing bacteria cultivated on modified Postgate B medium, using lactate as the carbon and energy source [16]. The dominant SRB genera in the microbial consortium were Desulfomicrobium and Desulfovibrio. The procedure for biofilm formation on the modified zeolite had been described previously [15].
The methanogenesis reactor was inoculated with activated sludge obtained from a UASB reactor treating wastewater from a bioethanol plant. The microbial culture was granular, forming spherical flocs with diameters of 2–3 mm, which enhanced its mechanical stability.

2.3. Process Operation

Two types of wastewater were used in the study: vinasse (from wine brandy production) and ethanol stillage (from an ethanol production plant using hydrolyzed wheat with sulfuric acid). Both types of wastewater were characterized by high COD (vinasse: 62.2 g/L; ethanol stillage: 57.6 g/L) and low pH (3.33 and 3.46, respectively). Sulfate concentrations were 0.169 g/L in vinasse and 0.465 g/L in ethanol stillage. The high COD values would impede microbial processes and the operation of MFCs and MECs; therefore, both vinasse and stillage were diluted 1:1 with distilled water, and the pH was adjusted to 7.5 using 4 N NaOH. The diluted wastewater was used as a control in the biomethanation stage.
According to the literature [2,3,7,8,9], wastewater from the distilling industry typically contains high sulfate concentrations in the range 2.1–5.8 g/L. To simulate biowastewater with high sulfate content, anhydrous Na2SO4 was added to the wastewater until the sulfate concentration reached 3.2 g/L. These sulfate-enriched water was used in experiments involving sequential microbial sulfate reduction and biomethanation. During the experiments, the substrate solutions were stored at 4 °C in a refrigerator.
The sulfidogenic bioreactor (3) in circuit I was fed with wastewater enriched with sulfates at a hydraulic retention time of 22 h, established as optimal for the studied substrates in a previous study [18], while the temperature was maintained at approximately 23 °C.
The methanation reactor (10) in circuit II was fed with effluents from the microbial sulfate reduction reactor that had passed through an adsorption column. The HRT of the water treated in the biomethanation reactor was 240 h. Because the consortium used includes mesophilic methanogenic bacteria, the temperature was maintained at ~35 °C using a thermal heater. To assess the effect of performing microbial sulfate reduction on methane yield and COD reduction when the two anaerobic processes were performed sequentially, control experiments were carried out consisting of biomethanation of only the diluted vinasse and stillage (without added sulfates) at the same HRT of 240 h.
Experiments were conducted by feeding the sulfidogenic bioreactor with both substrates in an MFC operating in open-circuit (OC) and closed-circuit (CC) modes. Three operational modes of the methanation reactor were investigated: direct biomethanation, biomethanation after MSR without MEC, and biomethanation after MSR with MEC. Each operational mode was maintained for 35 days.
After reaching dynamic equilibrium for each mode, the pH, oxidation–reduction potential (ORP), electrical conductivity (EC), sulfates, COD, and H2S were measured in 10 samples of the feed solution and in 10 effluent samples from each anaerobic reactor (30 samples in total). The concentration of hydrogen sulfide in the water after passing through the adsorption column was measured. Concentrations of sugars, organic acids, and alcohols in the influent wastewater and effluent from the sulfate reduction and methanogenesis reactors were measured 5 times after reaching dynamic equilibrium for each mode. The volume of produced biogas was monitored online, and its composition was measured once a week.
Standard statistical parameters were used, including mean and standard deviation (for 5–20 data points, depending on the parameter studied). The experimental data were analyzed using Statgraphics Centurion Version 19.7.01 software.
At the end of the experiments with vinasse, two samples were taken from both anaerobic bioreactors (zeolite with formed biofilm and anaerobic activated sludge) for metagenomic analysis.

2.4. Analytical Methods

At the sampling points (outlets of circuits I and II), the pH, ORP, and EC of the treated water were measured using a Revio meter (Giorgio Bormac S.r.l., 41012 Carpi (MO), Italy). Total sulfide concentrations (immediately after sampling using the Nanocolor test 1-88/05.09, Macherey-Nagel, Düren, Germany), sulfate concentrations (spectrophotometrically using BaCl2 precipitation), and chemical oxygen demand (with COD Ultra-High Range Reagent Vials, HANNA Instruments, Woonsocket, RI, USA) were determined via the APHA’s standard methods [33]. The volume of produced biogas was monitored using a microflowmeter (MGC-1, Ritter GmbH, Bochum, Germany), and its composition was analyzed with a gas analyzer (Dräger X-am 7000, Drägerwerk AG & Co. KGaA, Lübeck, Germany).
Organic acids and alcohols were analyzed via high-performance liquid chromatography (Perkin-Elmer Inc. production, Waltham, MA, USA), an Aminex HPX-87H column (Bio-Rad, Laboratories, Hercules, CA, USA), and an RI detector (LC-25RI, Perkin-Elmer Inc., Waltham, MA, USA) at 50 °C, using 0.01 N sulfuric acid as the eluent with a flow rate of 0.6 mL/min. The sugar composition was measured using a Dionex HPLC system (Dionex Inc., Sunnyvale, CA, USA), a Shodex RI-101 RI detector (Showa Denko KK, Kawasaki, Japan), and a Hi-Plex H column, 7.7 mm × 300 mm (Agilent Technologies, Santa Clara, CA, USA) at 65 °C using ultrapure water (Simplicity® water purification system, Merck KGaA, Darmstadt, Germany) as the eluent with a flow rate of 0.5 mL/min [18].

2.5. Electrochemical Analysis

The electrical parameters of the MFC (6) and MEC (11) were measured using a digital multimeter (Uni-T UTG1022X, UNI-T (UNI-TREND Technology Co., Ltd.), Dongguan, Guangdong, China). A precision potentiometer with a resistance range of 10 Ω to 11 kΩ was used to vary the external load. The time required to reach steady-state values for current and power depends on both the external resistance and the type of organic substrate. Within this range of external resistances, polarization curves and power curves were recorded. During the experiments, a fixed external load resistance of R1 = 100 Ω was applied for the MFC, based on the optimal value determined from the MFC power curves. For the MEC, an external resistance of R2 = 10 Ω was used.
The power density (P) is normalized to the geometric anodic surface area and calculated using the equation P = U2/(RT·A), where A (m2) is the anodic surface area, RT (Ω) is the external load resistance, and U (V) is the voltage of the MFC.
The coulombic efficiency (CE) is calculated based on the COD in the anolyte, as the difference between the COD values measured with and without an external load. This allows differentiation between the fraction of organic compounds oxidized biologically and the fraction oxidized electrochemically to generate electricity.
The CE is calculated using the following equation:
CE = M . I . t F · b · V a n · Δ C O D · 100 %
where M = 32 is the molar mass of O2; t (s) is the HRT; I is the average current value during the experiment (A); F (Faraday constant) is 96,845 C/mol; b = 4 is the number of electrons required for oxidation of 1 mol O2; ΔCOD is the difference between the initial and final COD values (gO2/L); and Van is the volume of the anodic chamber.

2.6. Metagenomic Analyses

The mixed microbial communities present in the two anaerobic bioreactors (for microbial sulfate reduction and biomethanation) were investigated using 16S rRNA gene amplicon sequencing. Using metagenomic analysis of isolated total DNA from the mixed microbial communities, the composition of microbial communities was determined when feeding the bioreactor with different substrates: ethanol stillage and vinasse. For interpreting the results and preparing the samples, the following designations are introduced: SRV—reactor for MSR on vinasse; SRE—reactor for MSR on ethanol stillage; MV—vinasse methanation reactor; and ME—ethanol stillage methanation reactor. Microbial DNA was extracted with DNeasy® Power Soil® Pro Kit (QIAGEN—Hilden, Germany), and 100 µL of it is frozen and sent for sequencing to Eurofins Medigenomix GmbH (Ebersberg, Germany). Taxonomic profiling was performed using MetaPhlAn (Huttenhower Lab, Department of Biostatistics, Harvard T.H. Chan School of Public Health, Boston, MA, USA).

3. Results and Discussion

3.1. Investigation of MFC’s Influence on MSR Process Using Distillery Industry Wastewater

The first part of the study focuses on the MSR process in the first circuit of the laboratory installation (Figure 1). The composition and characteristics of the wastewater enriched with sulfates used in the MSR process, ethanol stillage and vinasse, are summarized in Table 1. The substrates exhibited highly variable chemical compositions, which explains some deviations from values reported in previous studies using the same type of wastewater [18].
To evaluate the influence of the MFC (6) on the MSR process, experiments were conducted in two operational modes of the microbial fuel cell: open-circuit (OC), where R1 = ∞, and closed-circuit (CC), where R1 = 100 Ω (Figure 1). During the first 35 days, the MSR circuit operated in OC mode, and during the subsequent 35 days, in CC mode. Basic physicochemical and chemical parameters of the effluent after the MSR process are presented in Table 1. An HRT of 22 h was used for the MSR process, which had been established as optimal for the carbon and energy sources in stillage and vinasse in previous research [18].
Both types of wastewater showed effective MSR, with sulfate reduction rates of 135 ± 4.1 to 142.3 ± 4.3 mg/L·h, comparable to published values for SRB systems operating in MFCs [34]. In OC mode, a decrease in pH was observed for both substrates, more pronounced for vinasse. This is due to its organic composition, which favored diverse fermentations and increased production of organic acids. Although the sulfate reduction rate is similar for both substrates, higher S2− concentrations (621 ± 25 mg/L) were found during the utilization of ethanol stillage. The lower S2− concentrations (471 ± 18 mg/L) in the effluent from vinasse resulted from the pH dropping below 7.0 and the protonation of a large part of the microbially generated sulfides to H2S, which was released into the gas phase. When a load resistor (CC) was applied between the anode and the cathode, a significant decrease in sulfide anions was observed: 50.2 ± 2.47% for ethanol stillage and 56.3 ± 4.0% for vinasse (Table 1). The increase in sulfates and the decrease in S2− in the anolyte under CC mode are related to the oxidation of H2S in the anodic chamber, which acts as a mediator for electron transfer at the anode. Similar results have been reported by Hemalatha et al. [35] in CC and OC modes of an MFC using the MSR process.
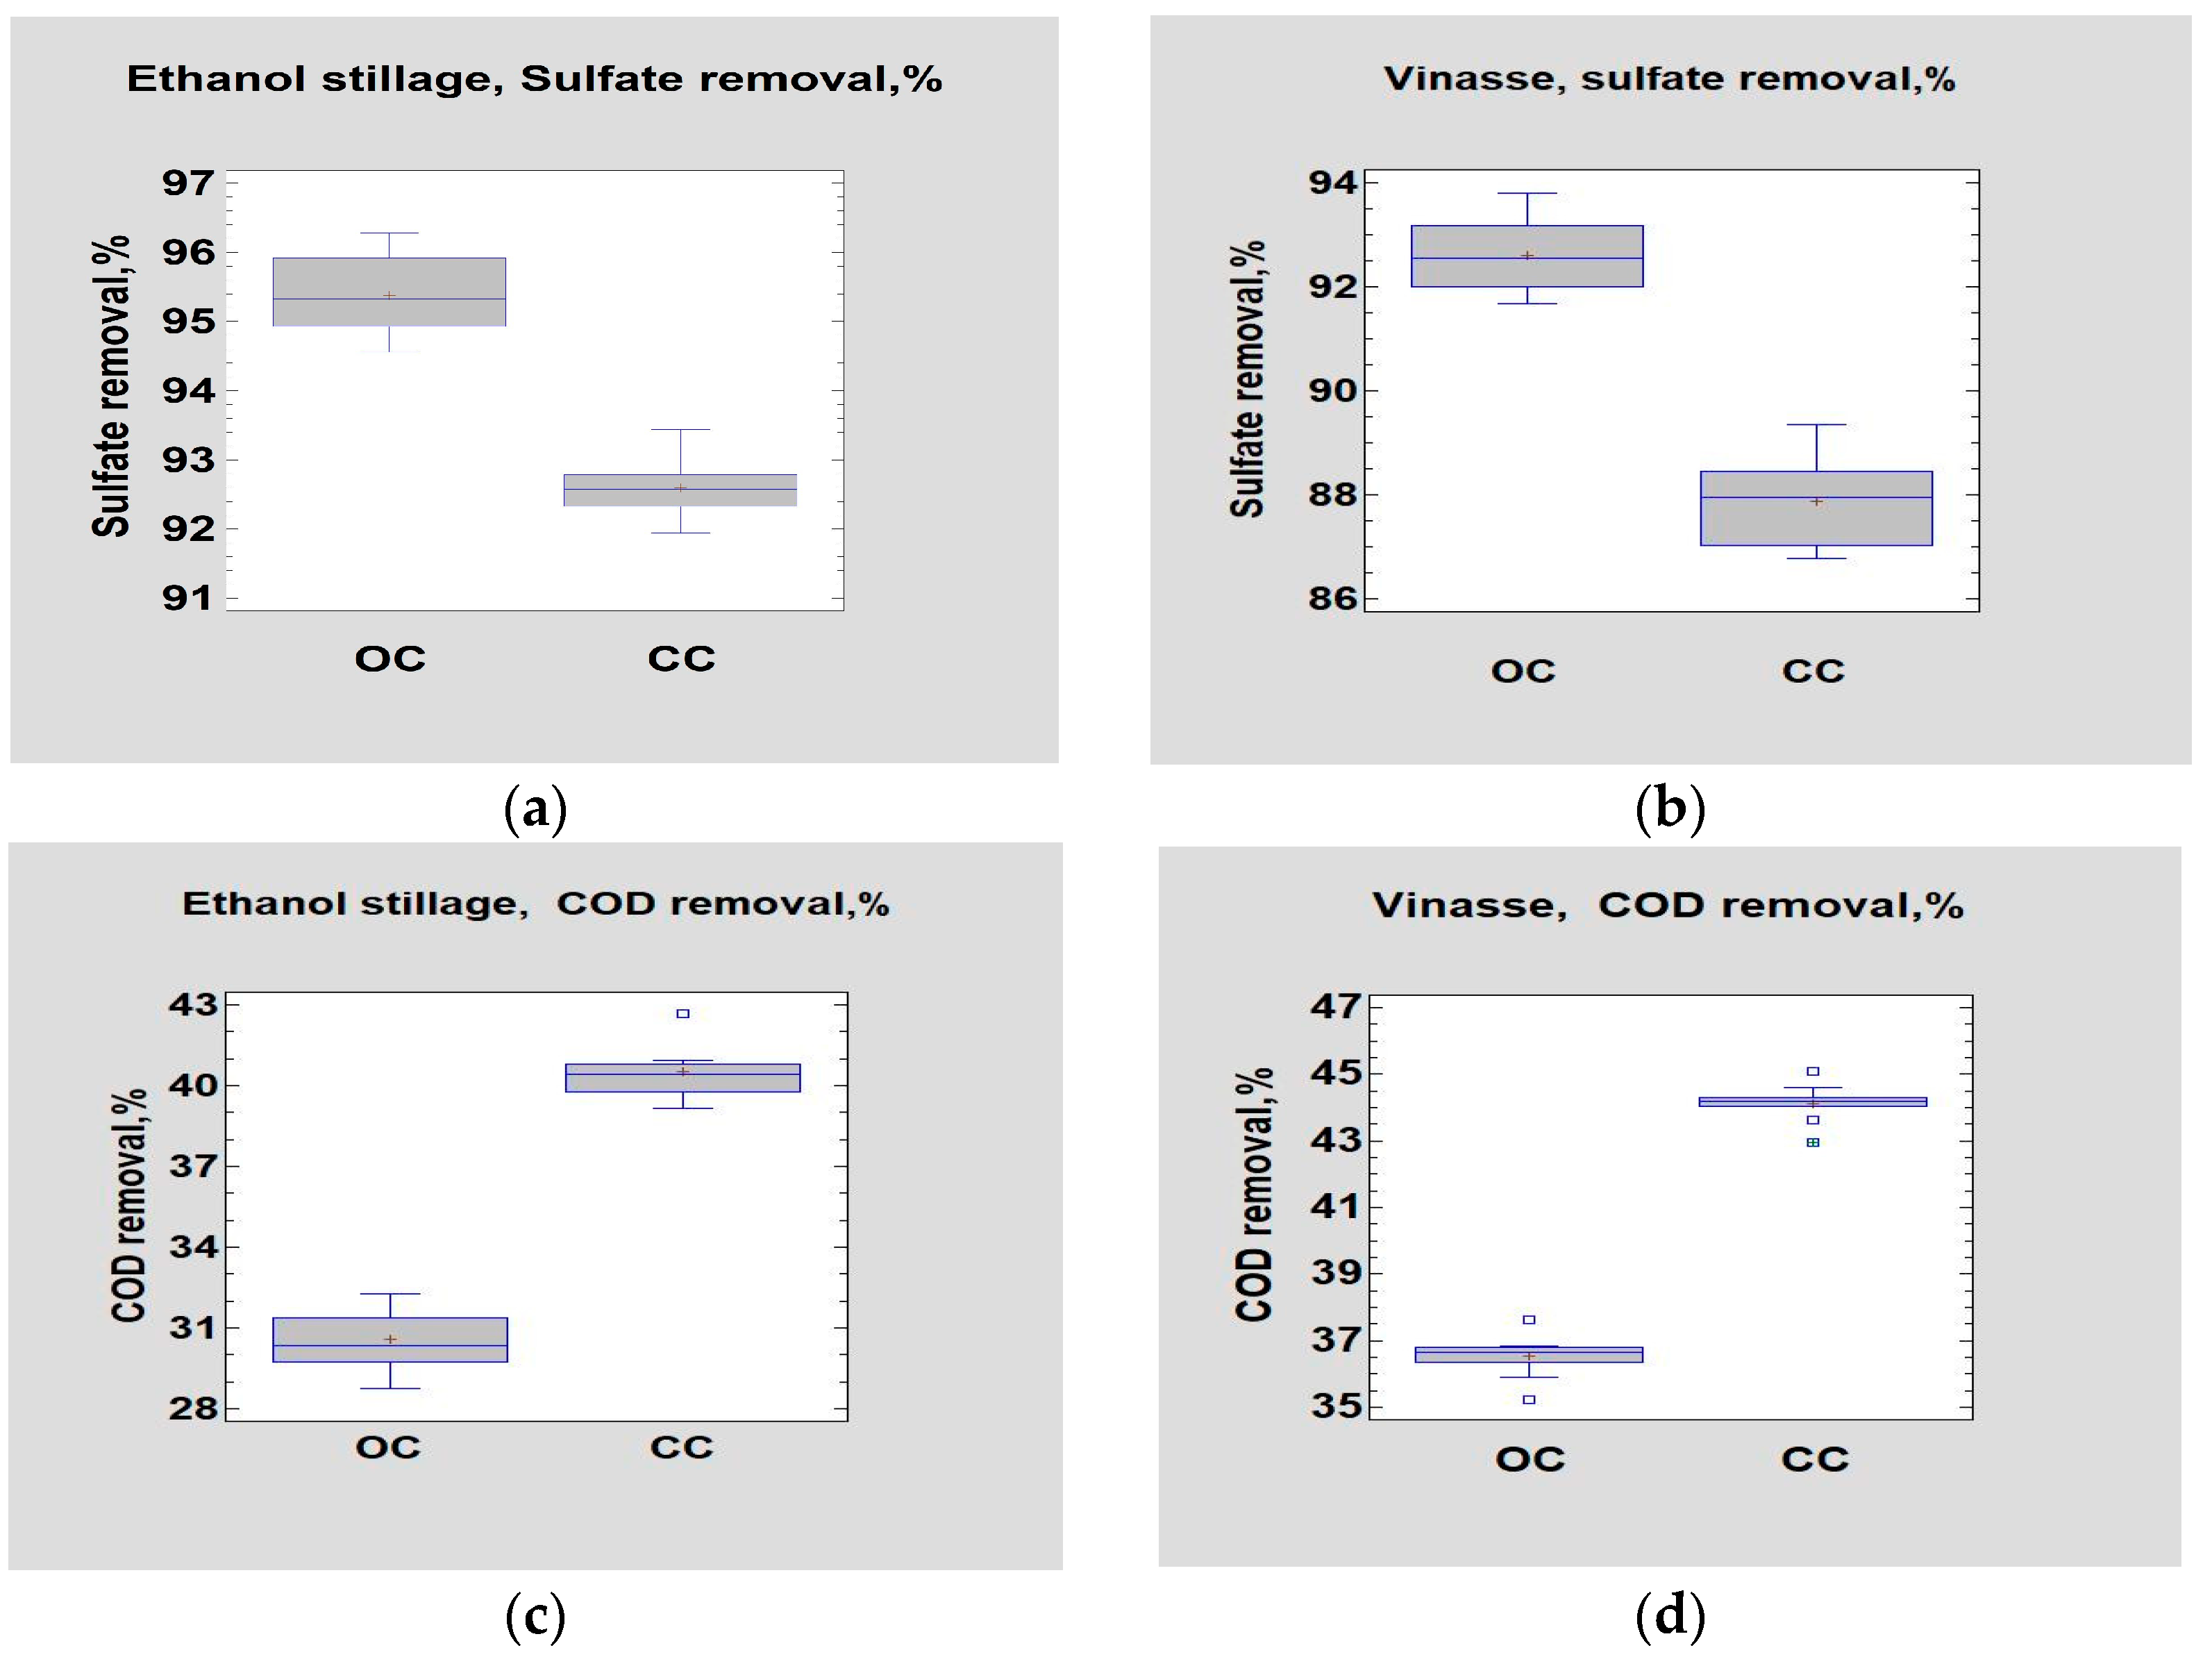
An important technological parameter in MSR is the COD/SO4 ratio, which in the feed solutions was 8.4 for stillage and 8.9 for vinasse. These high ratios resulted from the elevated COD values of these substrates. Despite exceeding the stoichiometric COD/SO4 ratio of 0.67, the sulfate removal rate in MFC-OC mode remained high: 92.6% for vinasse and 95.4% for ethanol stillage. In MFC-CC mode, sulfate removal was slightly lower due to the oxidation of sulfide ions to sulfate in the anodic zone. The high efficiency of MSR was supported by the presence of lactate and ethanol in the wastewater, which served as preferred electron donors for SRB performing incomplete oxidation of organic compounds. Fermentation of sugars in the substrates further promoted microbial sulfate reduction, as a large fraction of the resulting organic acids and alcohols served as a carbon and energy source for SRB. The ongoing microbial and electrochemical processes occurring in circuit I in the MFC-OC mode resulted in COD reductions of 30.6% in ethanol stillage and 36.5% in vinasse. In the CC mode, COD removal increased by 9.9% for ethanol stillage and 7.6% for vinasse. Figure 2 shows mean values and standard deviations of variables in the sulfate-reduction process: sulfate removal, %, for ethanol stillage (Figure 2a) and vinasse (Figure 2b); and COD removal, %, for stillage (Figure 2c) and vinasse (Figure 2d). This operating mode also led to higher production of acetic and propionic acids. The elevated COD and acetate concentrations in the effluents after the sulfate reduction stage make them highly suitable for subsequent methanogenesis and biogas production.
The Supplementary Materials (Tables S1–S37) include the statistical analysis data for the parameters presented in Table 1.

3.2. Investigation of the Wastewater Type on the Electrochemical Characteristics of the MFC

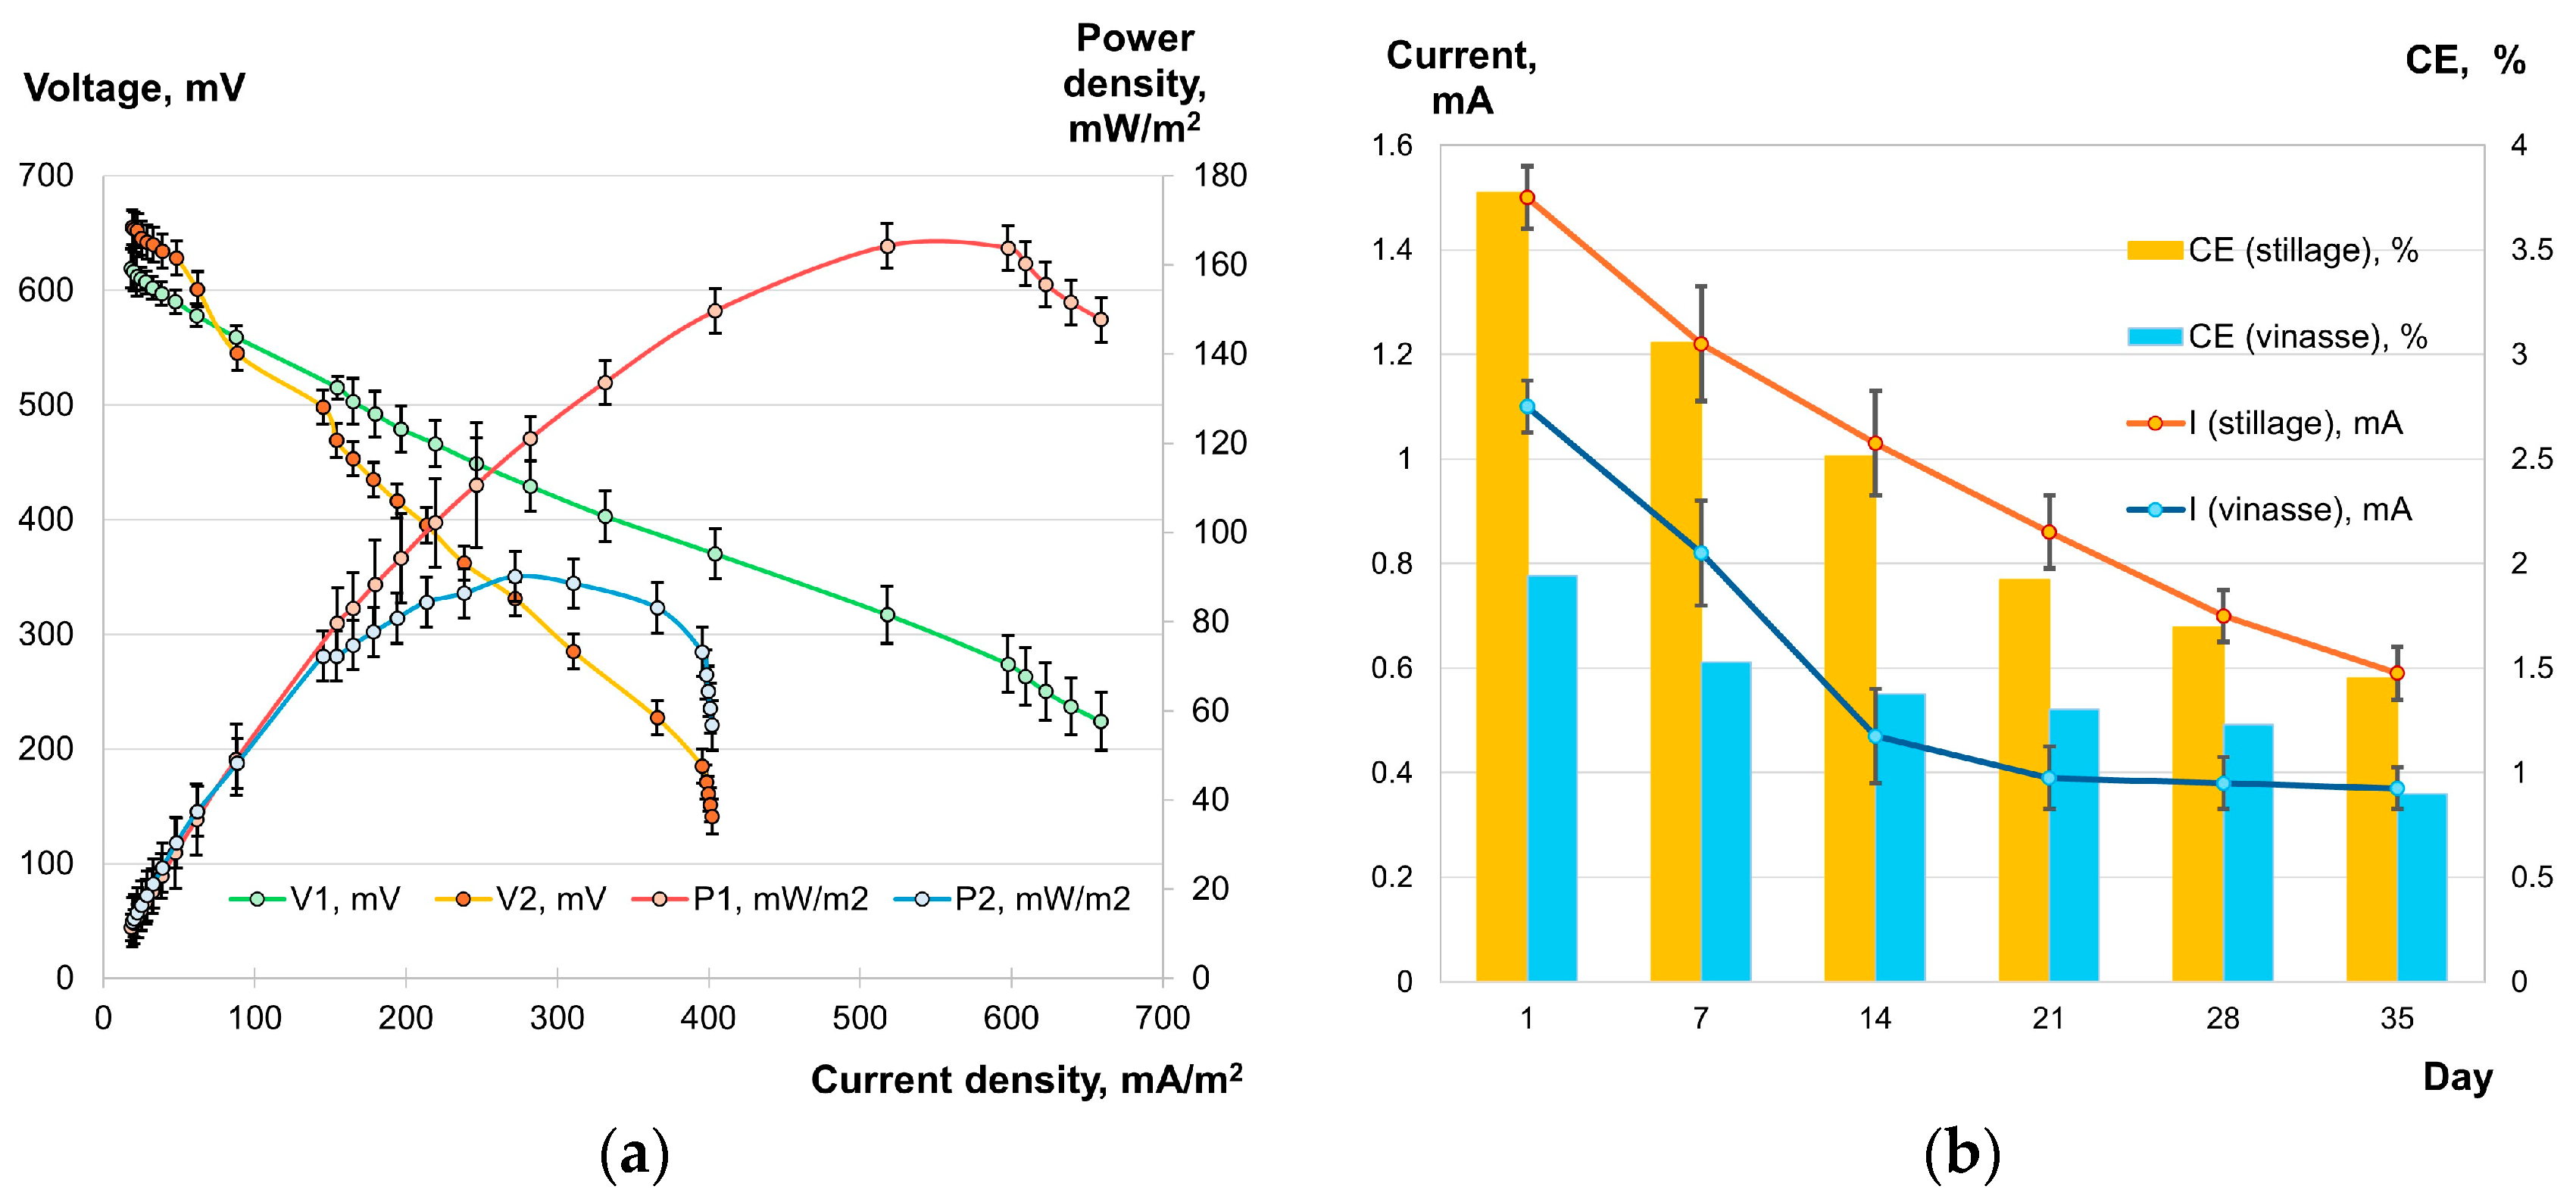
To assess the influence of the wastewater used in the anodic chamber of the MFC on its performance, polarization, and power curves were determined for ethanol stillage and vinasse (Figure 3a), and the anode current dynamics were monitored over 35 days (Figure 3b).
From the power curves (Figure 3a), the maximum power density was 164 mW/m2 for ethanol stillage and 90 mW/m2 for vinasse. The corresponding current densities were 518 mA/m2 (ethanol stillage) and 272 mA/m2 (vinasse). Those values were obtained at fixed external load resistances of 100 Ω for ethanol stillage and 300 Ω for vinasse, indicating that the internal resistances of the MFC were approximately equal to these values. The lower internal resistance observed with ethanol stillage compared to vinasse was likely due to the significant difference in their electrical conductivities (Table 1), both in the initial substrates and in the anolyte with or without an applied load.
This observation is further supported by the dynamics of the MFC anode current (Figure 3b), where significantly higher values were recorded for ethanol stillage compared to vinasse in CC mode. The average current over the 35-day period was 0.84 mA for ethanol stillage and 0.45 mA for vinasse.
The obtained results allow the estimation of the fraction of the electron donor (ethanol stillage or vinasse) that was oxidized during microbial sulfate reduction versus the fraction used for electrogenesis when an external load (CC) was applied between the anode and cathode of the microbial fuel cell. To distinguish between the electron flows directed toward sulfate reduction and toward electricity generation, the COD values measured in OC and CC modes were used (Table 1).
Using the measured COD values and the average current in CC mode, the Coulombic efficiency (CE) of the MFC over the 35-day period is calculated. For ethanol stillage, the CE decreased from 3.5% at the beginning to 1.5% at the end of the operational period, while for vinasse, it ranged from 1.9% to 0.9%. These values are directly correlated with the anode current (Figure 3b). The relatively low CE values indicate that sulfates and the anode were in constant competition as electron acceptors for both substrates, with sulfates being the preferred electron acceptor. Similar observations have been reported by Morris and Jin [36].

3.3. Microbial Community Analysis of the Formed Biofilms in the MSR Bioreactor for Both Types of Wastewater

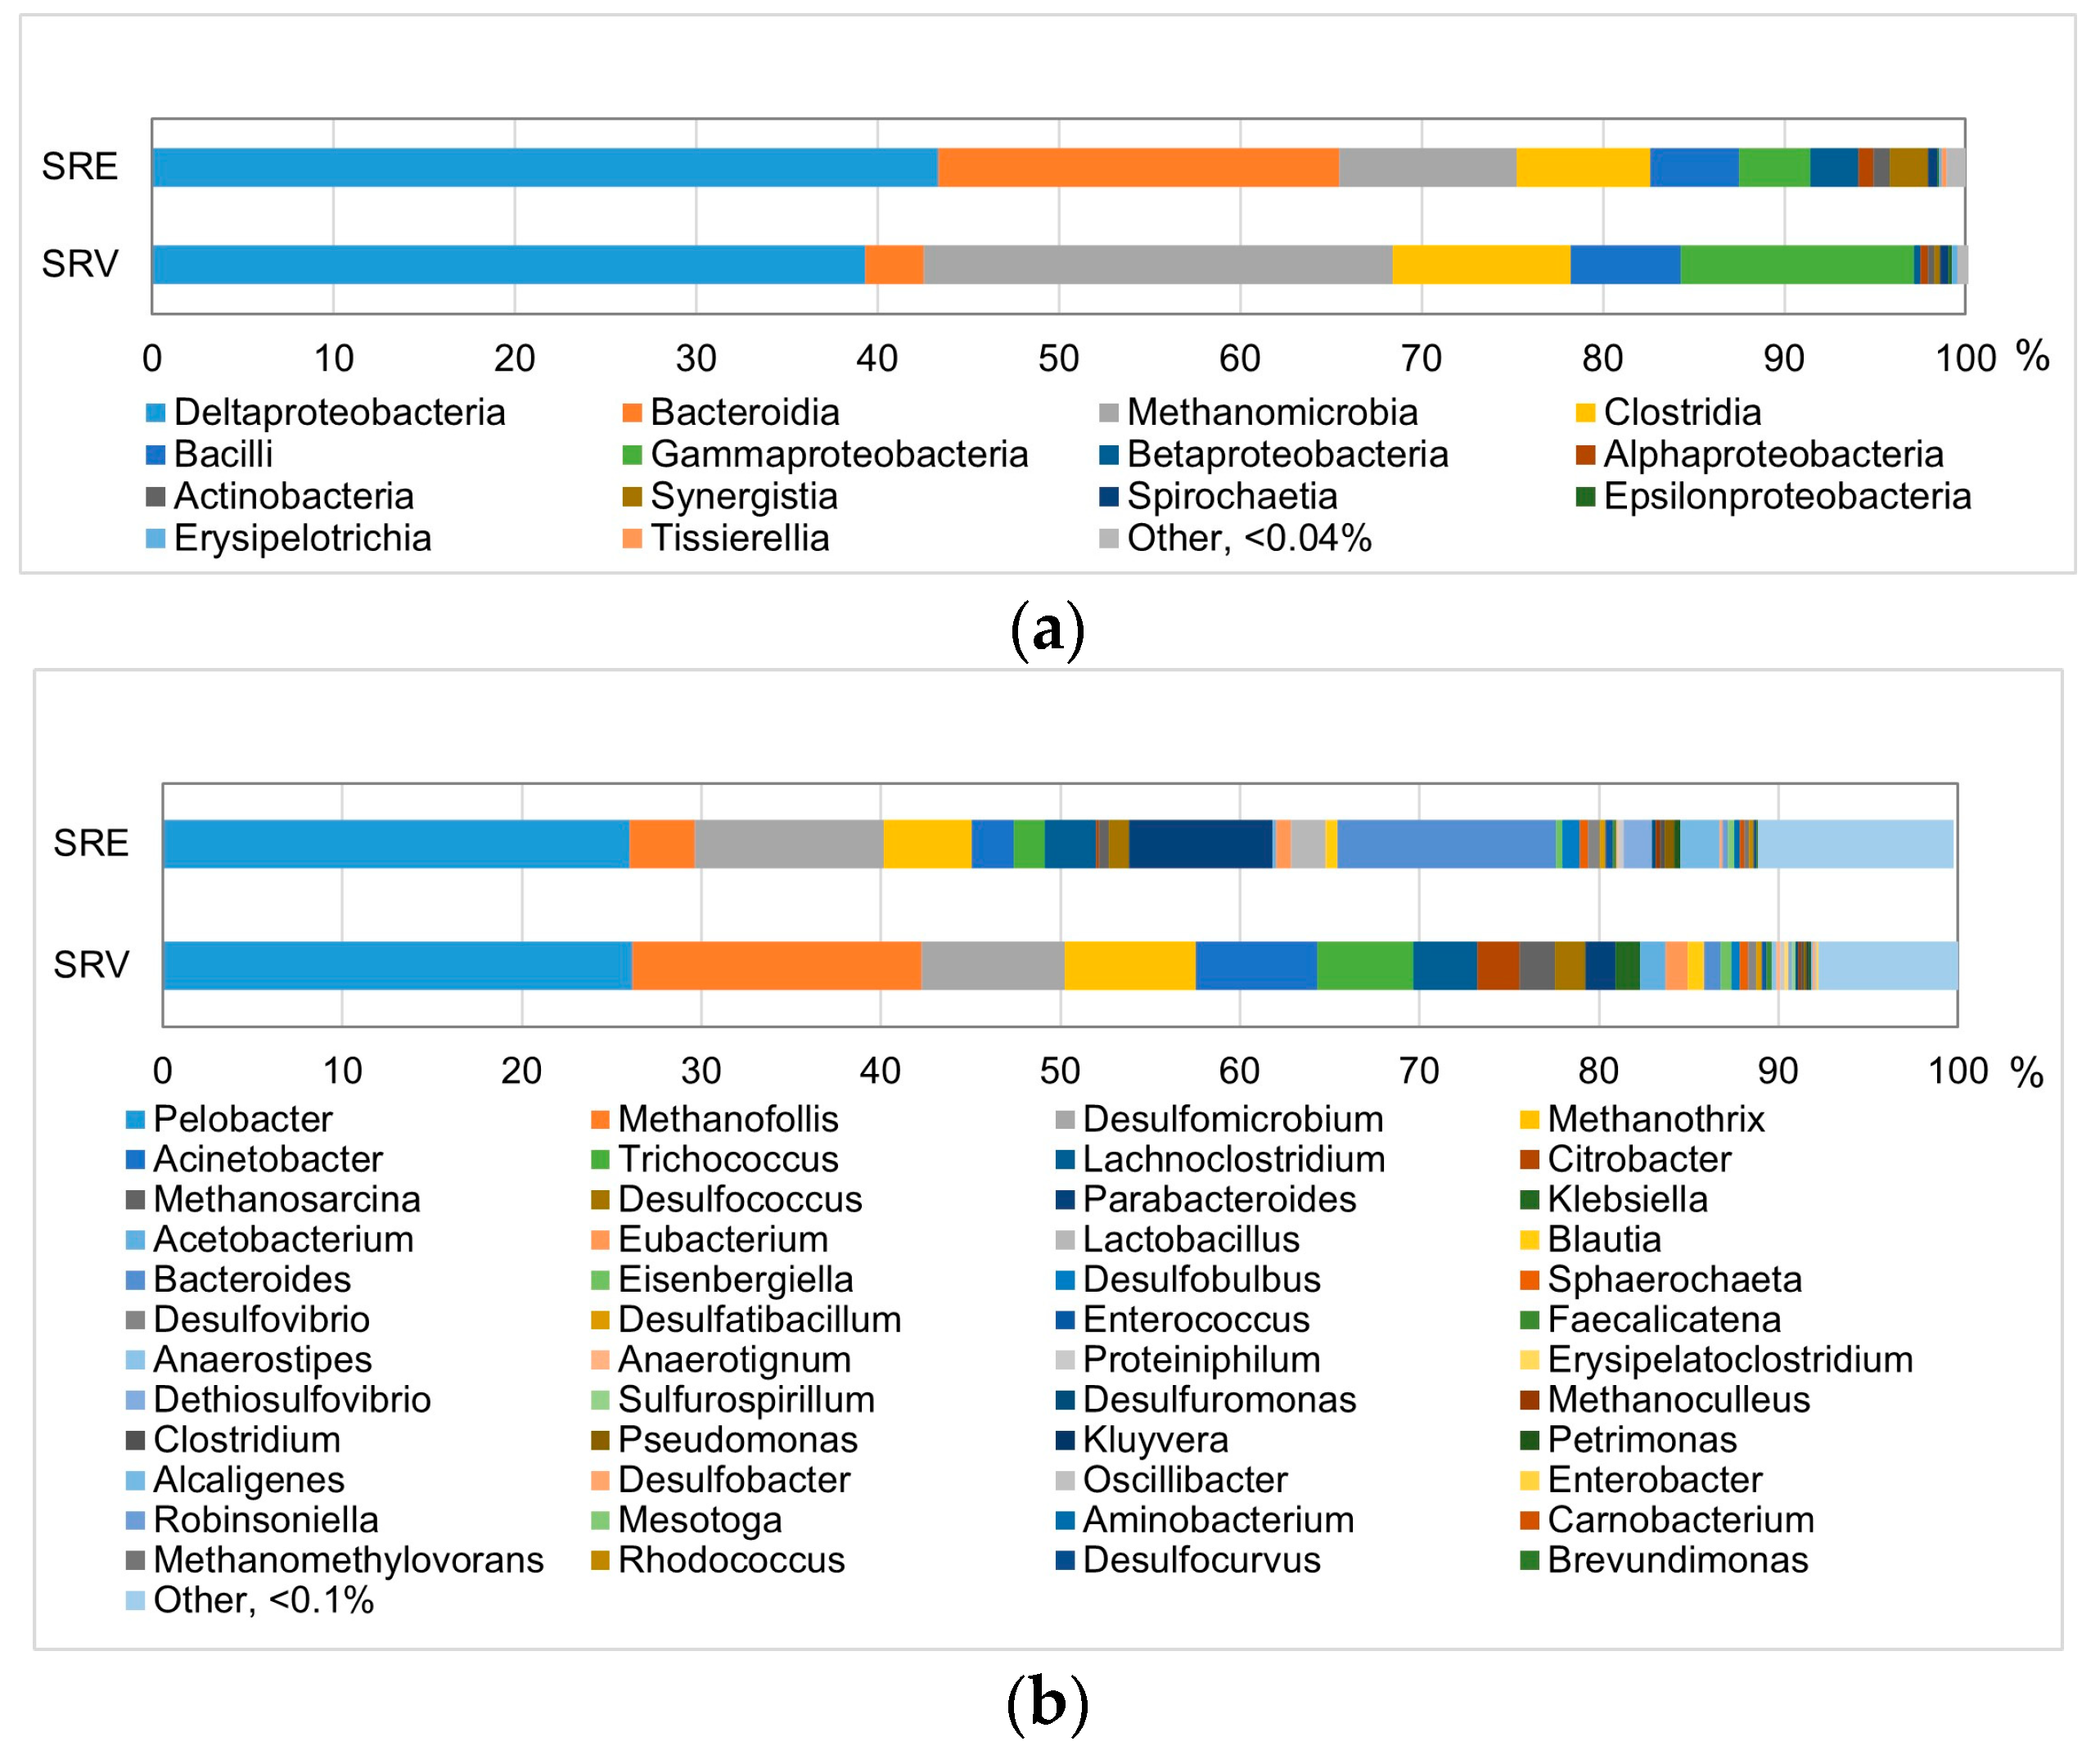
Using metagenomic analysis of total DNA isolated from the biofilm formed on zeolite, the composition of the microbial communities was determined when feeding the microbial sulfate reduction bioreactor with different substrates, ethanol stillage (SRE) and vinasse (SRV). The results are presented in Figure 4.
For both substrates, Deltaproteobacteria were identified as the dominant bacterial class, accounting for 43.4% of the community in SRE and 39.3% in SRV (Figure 4a). This group includes sulfate-reducing bacteria, which play a key role in anaerobic degradation processes. The high residual content of starch, dextrin, sugars, and fibrous materials in ethanol stillage favored the proliferation of the class Bacteroidia (22.1% relative abundance in SRE), reflecting their strong enzymatic capacity for polysaccharide breakdown [37]. In contrast, during vinasse treatment, the relative abundance of this class was only 3.2%. Another notable difference between the microbial communities of the two substrates was the relative abundance of the class Methanomicrobia, which reached 25.9% in SRV compared to 9.8% in SRE. Additional bacterial classes detected in both samples included Clostridia (7.4–9.8%), Bacilli (4.9–6.1%), and Gammaproteobacteria (3.9% in SRE and 12.8% in SRV).
As shown in Figure 4b, the dominant genus in both microbial communities was Pelobacter (25.9% in SRE and 26.1% in SRV). The species Pelobacter acetylenicus is predominant; it ferments ethanol to acetate in syntrophic coculture with hydrogen-consuming anaerobes [38].
It is noteworthy that 25.9% of the identified species in the SRV biofilm belong to the class Methanomicrobia. The methanogens detected included the genera Methanofollis (M. liminatans, 15.96%), Methanothrix (M. soehngenii, 7.27%), and Methanosarcina (M. mazei, 1.93%). The species Methanofollis liminatans uses not only H2/CO2 and formate for growth but also 2-propanol/CO2, 2-butanol/CO2, and cyclopentanol/CO2. The high relative abundance of Methanofollis liminatans probably resulted from significant hydrogen production by some members of the microbial community, such as Pelobacter acetylenicus and the genera Enterobacter, Clostridium, Lactobacillus, Klebsiella, Bacillus, etc. [39]. The species Methanothrix soehngenii and Methanosarcina mazei are acetoclastic methanogens that decarboxylate acetate, producing methane and carbon dioxide [40].
In the microbial community, during ethanol stillage treatment, the proportion of methanogens was lower compared to SRV: Methanofollis (M. liminatans, 3.62%), Methanothrix (M. soehngenii, 4.87%), and Methanosarcina (M. mazei, 0.57%). On the other hand, the much higher abundance of the genera Bacteroides (12.18%) and Parabacteroides (P. chartae, 7.99%) compared to SRV (0.88% and 1.66%, respectively) is remarkable. The genus Bacteroides degrades complex organic compounds and produces acids during sugar fermentation; its dominant species was identified as Bacteroides reticulotermitis, which ferments xylan, starch, carboxymethylcellulose, and pectin. It produces succinic and acetic acids, with small amounts of propionic acid, from L-arabinose, cellobiose, glucose, lactose, maltose, D-mannose, raffinose, L-rhamnose, salicin, sucrose, and D-xylose [41]. The species Parabacteroides chartae is an obligately anaerobic bacterium that produces lactic, propionic, formic, and acetic acids from various sugars, including glucose, lactose, sucrose, maltose, D-xylose, L-arabinose, and cellobiose [42]. The differences in the composition of the microbial communities in the two samples is related to the presence of more complex organic substances and sugars in ethanol stillage compared to vinasse.
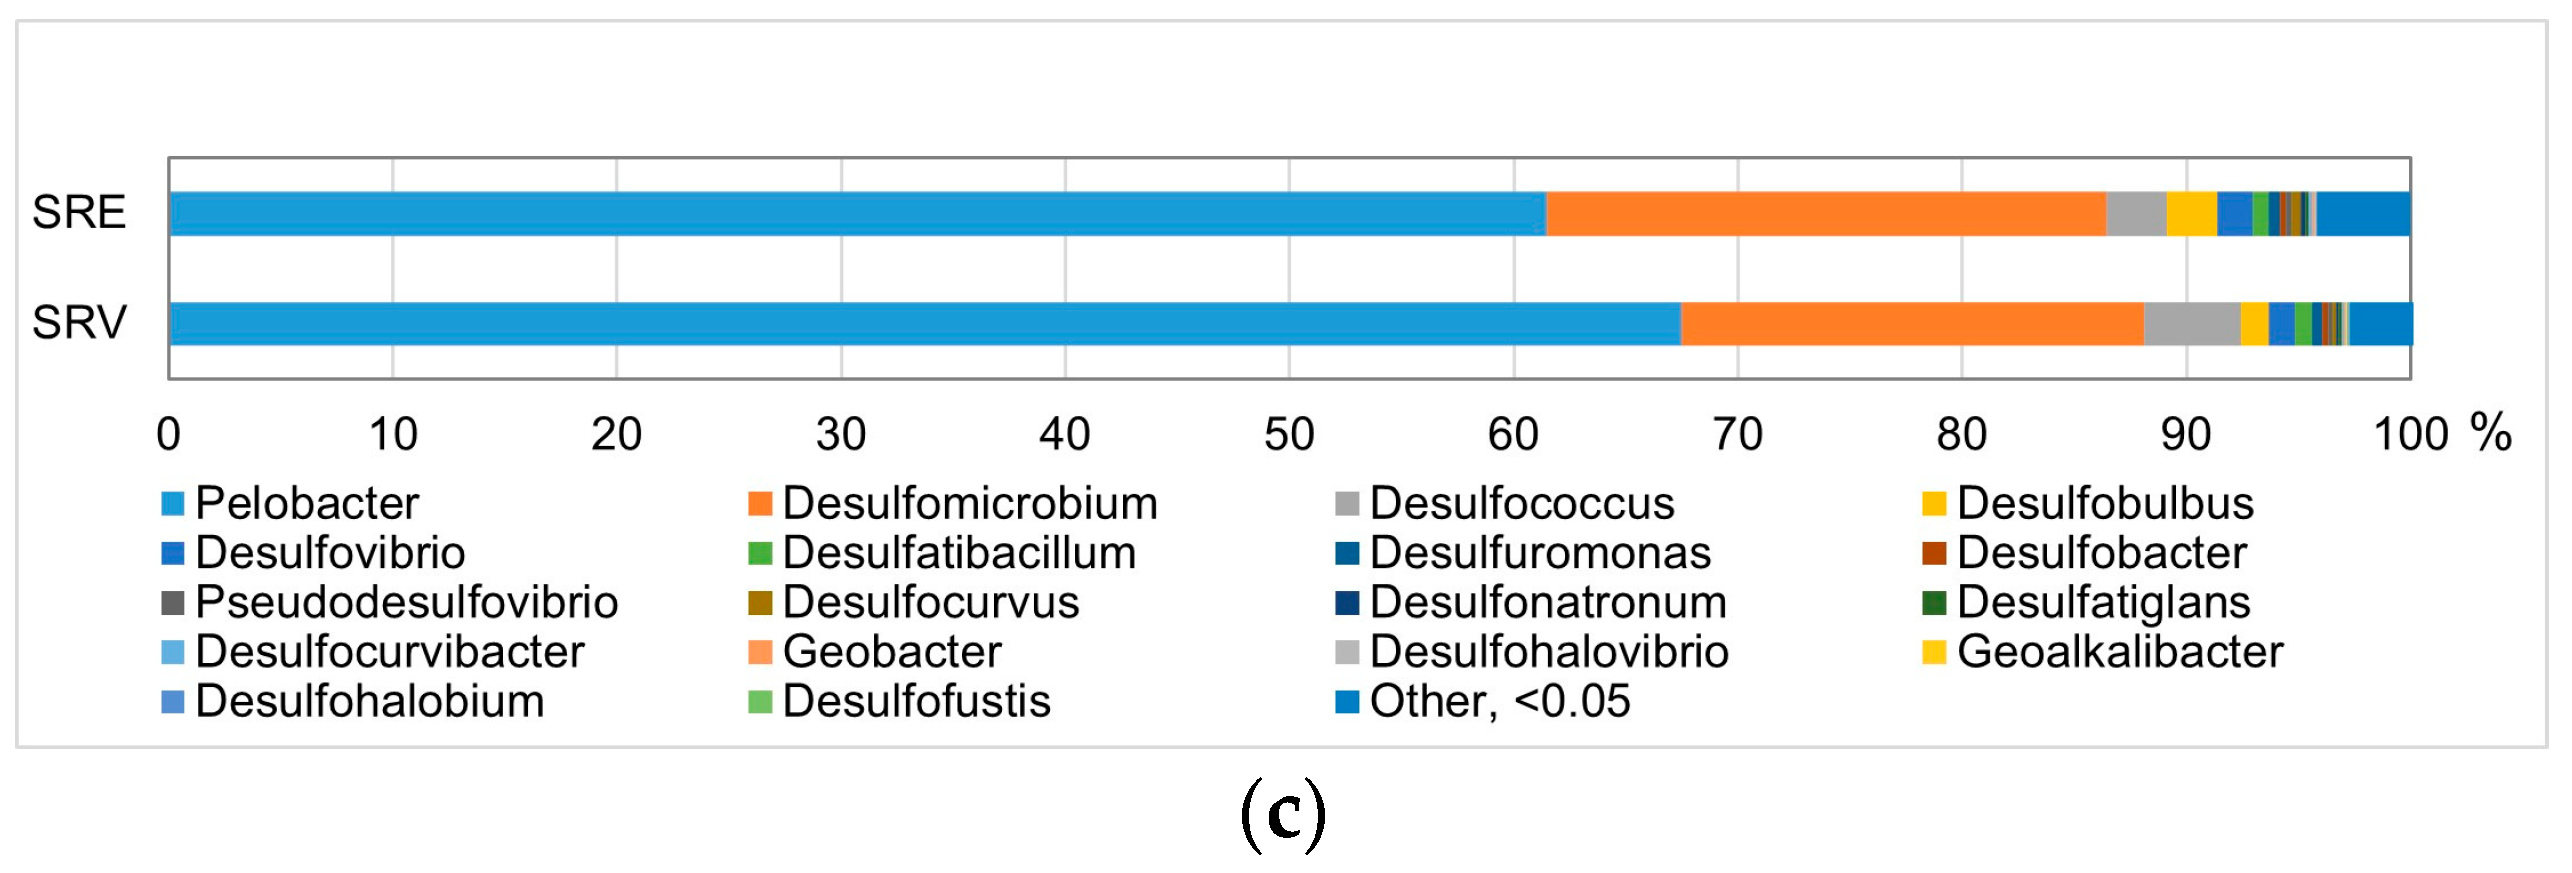
Figure 4c illustrates the relative proportion (%) of the identified genera belonging to Deltaproteobacteria. In both substrates, the dominant genera were Pelobacter (61.4% and 67.5% of Deltaproteobacteria) and Desulfomicrobium (20.6% and 25.0% of Deltaproteobacteria). The prevailing species within the genus Desulfomicrobium was D. baculatum, with a relative abundance of 7.41% in SRE and 5.66% in SRV, respectively. This species represented the dominant sulfate-reducing bacterium in the inoculum. A characteristic feature of D. baculatum is that, in the presence of sulfate, pyruvate and lactate undergo incomplete oxidation to acetate and CO2 [43]. The species Desulfomicrobium escambiense was also detected in both microbial communities (relative abundance 1.5–2%). It can utilize electron donors such as lactate, pyruvate, ethanol, and malate [44]. In contrast, the abundance of other sulfate-reducing genera, including Desulfovibrio, Desulfobulbus, Desulfococcus, and Desulfobacter, was considerably lower. Species present at low abundance (<1.5%) in both samples included Dethiosulfovibrio salsuginis, Desulfobulbus elongatus, and Desulfococcus multivorans. D. salsuginis ferments peptides, amino acids, and a few organic acids, but does not grow on carbohydrates, lactate, formate, acetate, propionate, butyrate, succinate, ethanol, methanol, glycerol, or mannitol [45]. This strain reduces thiosulfate and elemental sulfur to sulfide but does not use sulfate or sulfite as electron acceptors. Desulfobulbus elongatus is a propionate-degrading sulfate reducer. The identified strain Desulfococcus multivorans is capable of completely oxidizing acetate, using sulfate as an electron acceptor.
Overall, when both substrates were used, most sulfate-reducing bacteria performed incomplete oxidation of organic matter to acetate and carbon dioxide. This behavior is linked to the presence of lactate and ethanol in the treated wastewater. It has been established that Desulfomicrobium, Desulfovibrio, and Desulfobulbus are commonly found in sulfate-rich wastewater [46]. According to Pan et al. [47], Desulfomicrobium and Desulfovibrio are the dominant SRB during the treatment of ethanol-containing effluents.

3.4. Investigation of the Biomethanation Process of Stillage and Vinasse Before and After MSR

Direct methanation of both wastewater types was first performed without added sulfates to obtain control data. Each treatment lasted for 35 days, and after reaching dynamic equilibrium, ten inlet and ten outlet samples were taken and analyzed for major physical–chemical and chemical parameters.
The biomethanation process of ethanol stillage and vinasse with added sulfates was investigated following microbial sulfate reduction during operation of the MFC in closed-circuit (CC) mode.
The digestate remaining after the MSR process was characterized by both high residual COD values and hydrogen sulfide concentrations unsuitable for biomethanation, primarily present as hydrogen sulfide anions (HS) (Table 1). The presence of the MFC in the MSR loop contributed to a significant decrease in sulfide anion concentrations, almost by half (Table 1), although their levels remained relatively high (265 ± 15 and 312 ± 20 mg/L). The remainder of the hydrogen sulfide was removed through an adsorption column (8) packed with iron filings. The designed hydraulic retention time of 96 h proves to be sufficient for the complete removal of H2S.
Data for physical–chemical and chemical parameters of treated ethanol stillage and vinasse by direct methanation and after microbial sulfate reduction in two modes—anaerobic degradation with and without a microbial electrolysis cell—are presented in Table 2 and Table 3. The tables show the minimum, maximum, and mean values of the examined parameters after statistical processing of data from 10 inlet and 10 outlet samples for each mode, collected after reaching dynamic equilibrium.
When comparing stillage and vinasse, COD removal was highest in the variant with prior sulfate reduction, followed by use of an MEC in AD (MSR_AD-MEC), exceeding 90%. This is likely due to the higher biodegradability of vinasse’s organic matrix, whereas stillage contained substantial amounts of high-molecular-weight polymers (proteins and lipids) and fractions that were resistant to direct biomethanation and therefore required pretreatment to become available for anaerobic fermentation [9].
This result is attributed to the transformation of the diverse and abundant polymeric compounds present in the stillage into low-molecular-weight soluble organic substances by hydrolytic and fermentative bacteria in the microbial consortium. The lactate contained in the stillage (4.08 g/L) serves as a preferred carbon and energy source for the SRB, with acetate being the main end product of this process. After sulfate depletion, the accumulated low-molecular-weight organics were more easily metabolized by the anaerobic bioreactor’s microbial community, leading to increased biogas production.
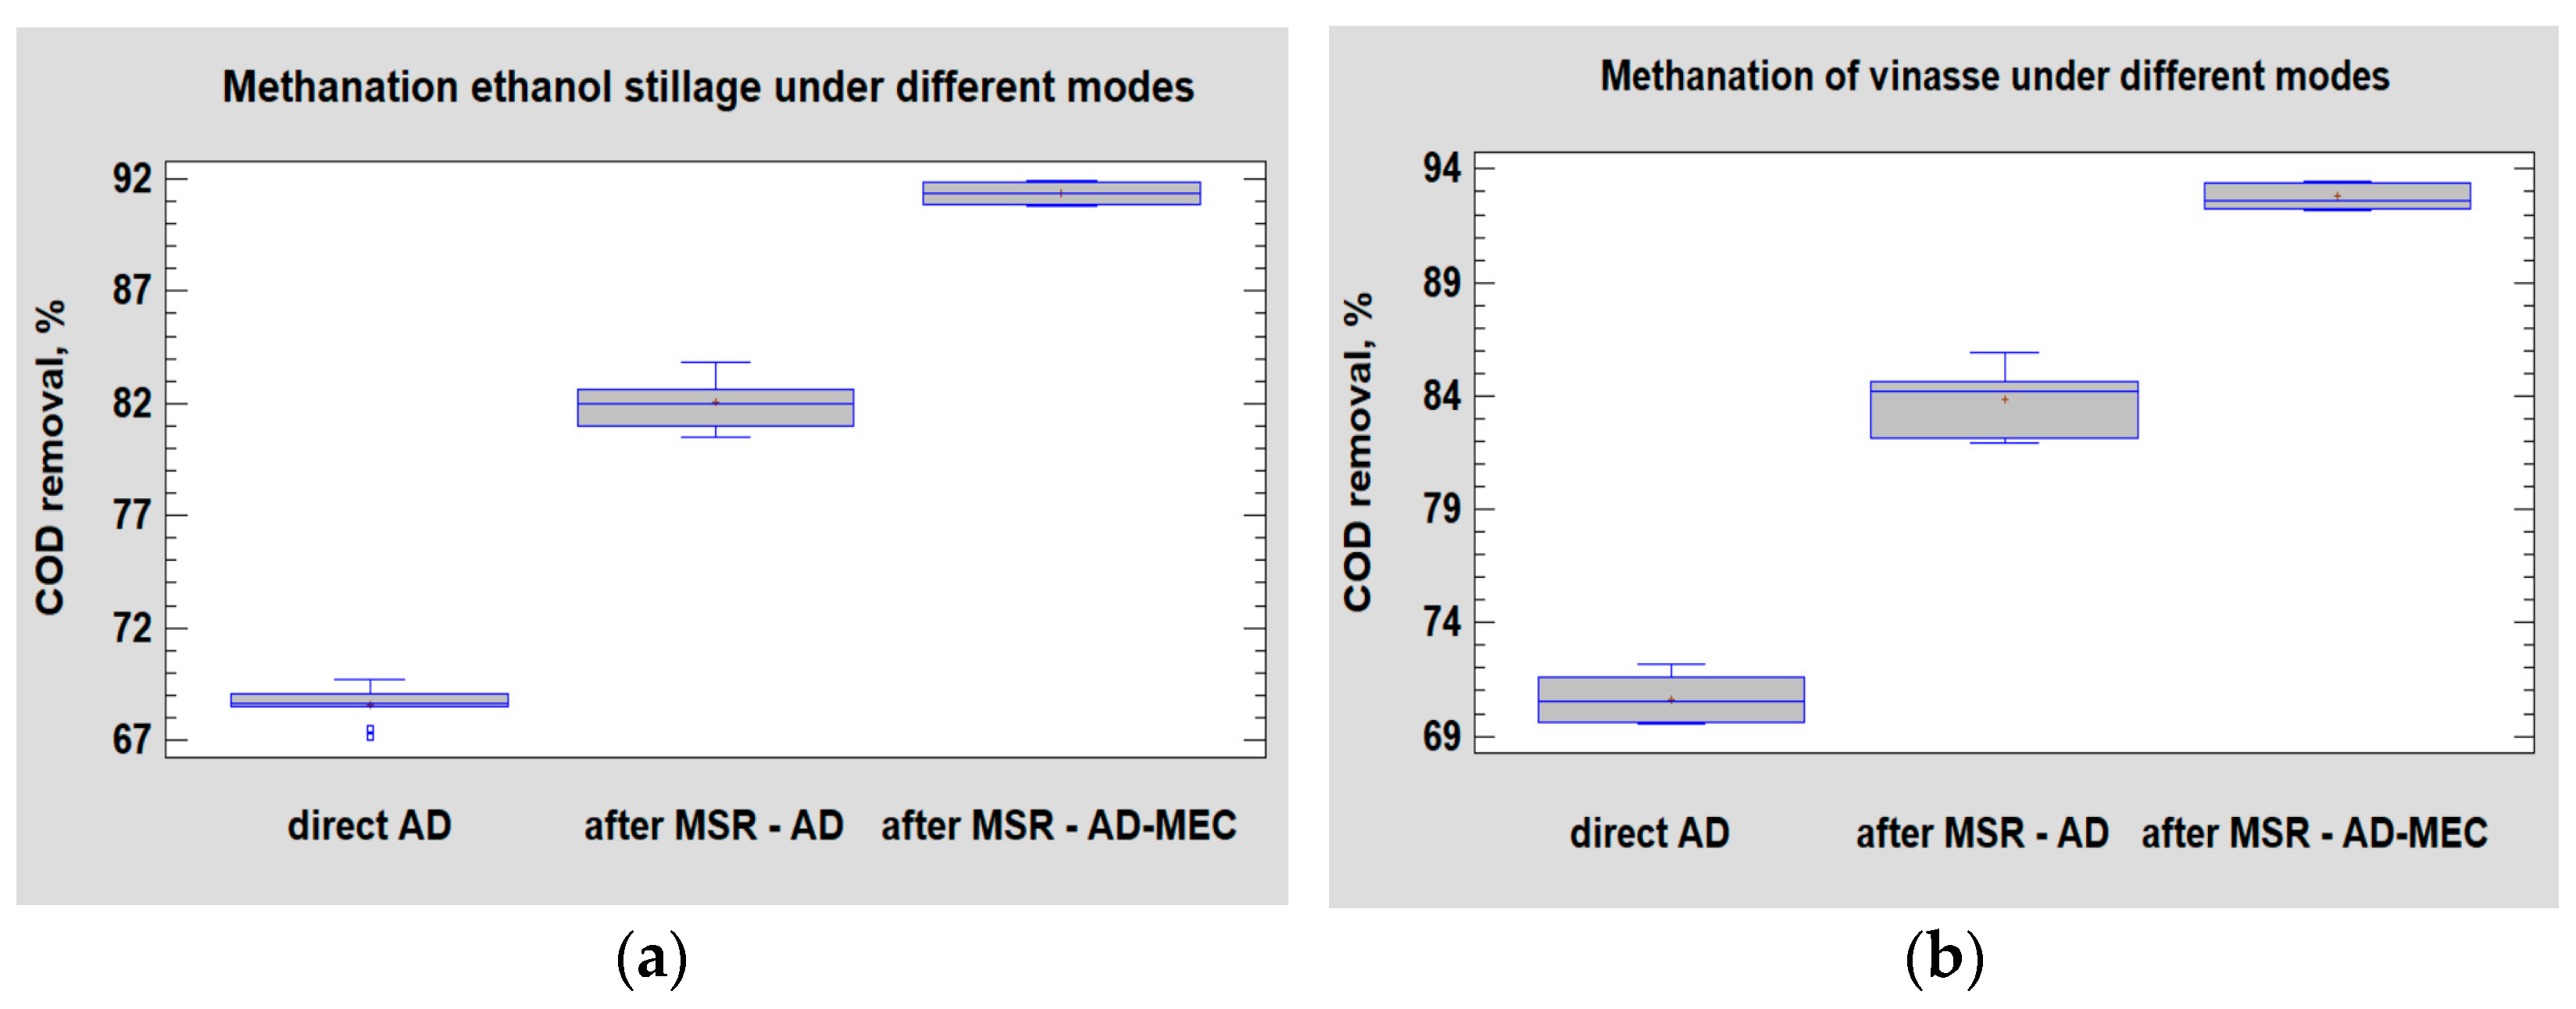
An important parameter for evaluating the process of utilization of ethanol stillage and vinasse is the organic matter conversion rate. Table 2 and Table 3 show the COD values at the inlet and outlet of the anaerobic reactor for biogas production. Figure 5 shows the mean values and standard deviations of COD removal (%). It could be seen that the organic matter conversion rate was 68.6% for direct methanation, 82.04% for methanation after MSR, and 91.36% for AD-MEC after MSR of stillage (Figure 5a). The results are similar for the vinasse (Figure 5b), with values of 70.6, 83.8, and 92.8%, respectively. Obviously, the microbial communities involved in the preliminary MSR process supported the degradation of more complex compounds, which led to a more complete utilization of the organic substrate in the overall conversion process.
The Supplementary Materials (Tables S46–S79) include the statistical analysis data for the parameters presented in Table 2 and Table 3.
The kinetics of biogas production were monitored in an anaerobic reactor with and without a microbial electrolysis cell, and the results are compared to those obtained from direct methanation of ethanol stillage and vinasse.
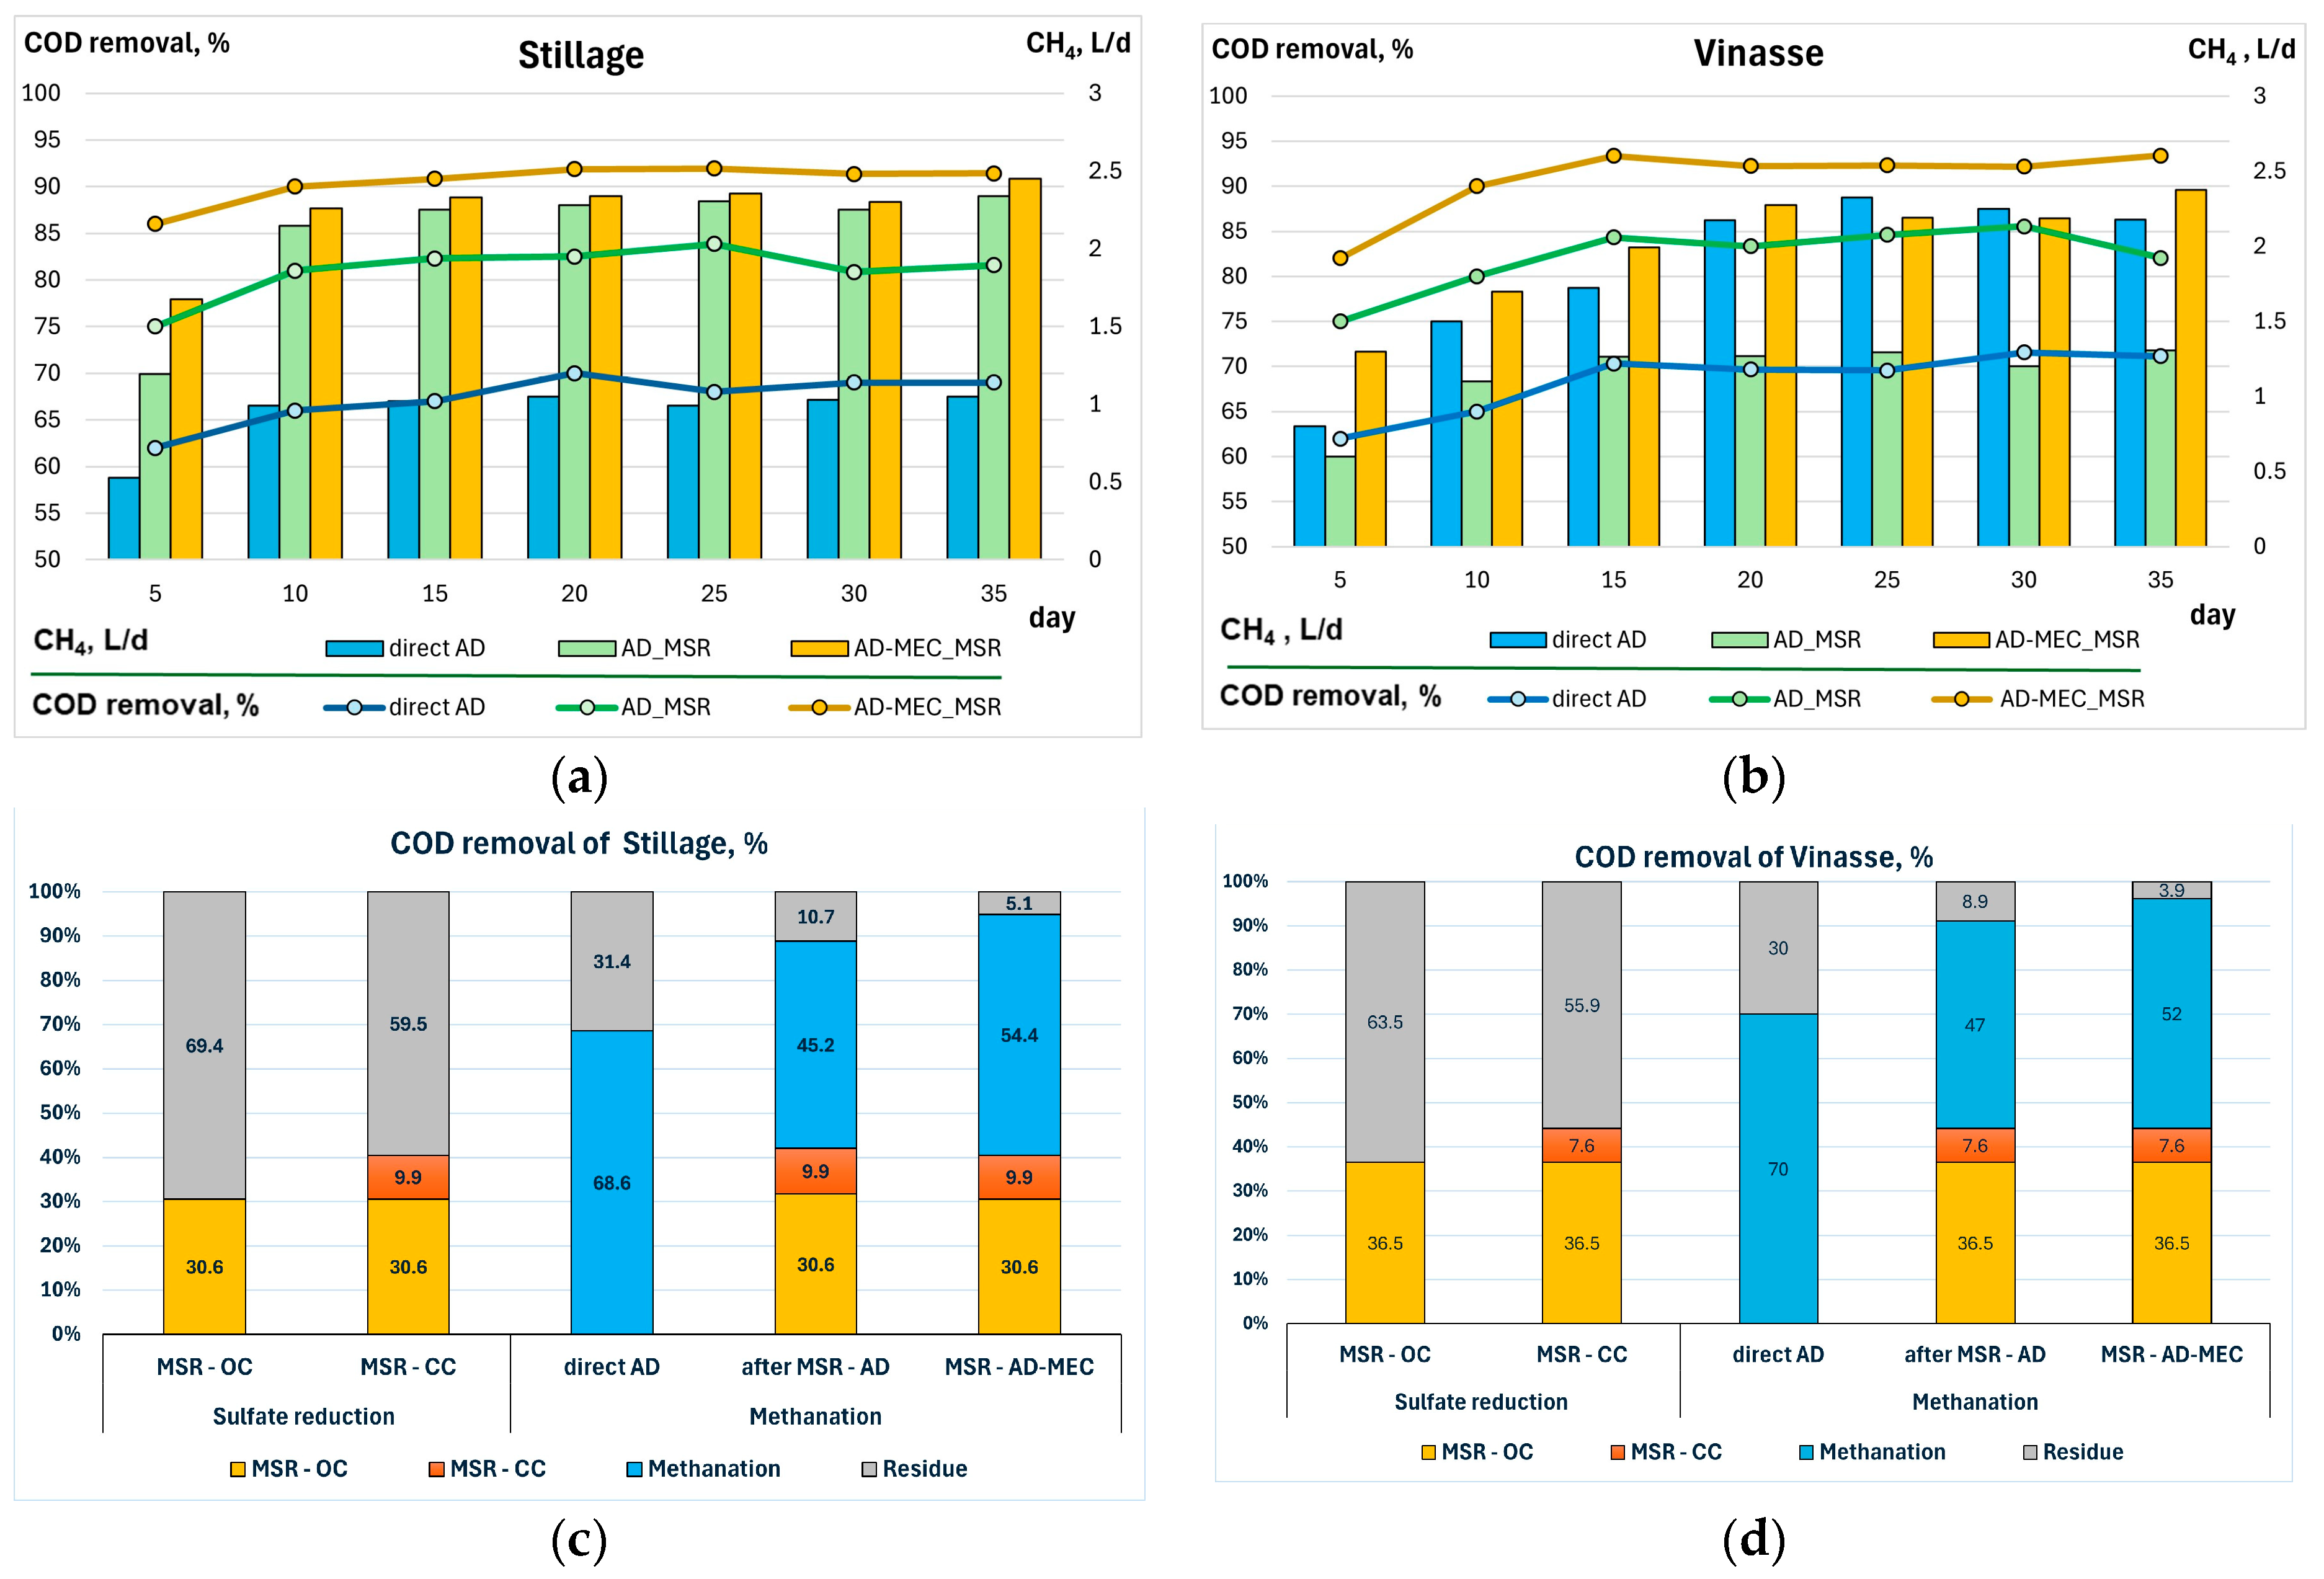
The results shown in Figure 6a,b indicate that combining microbial sulfate reduction with bioelectrochemical systems (MFC and MEC) significantly improves the efficiency of subsequent biomethanation, both in terms of COD removal and methane yield.
Methane yield from direct methanation of ethanol stillage is lower compared to the sequential implementation of the two processes, with the highest values observed in the AD-MEC mode (Figure 6a). In direct methanation of ethanol stillage, 68.6% of COD was consumed. During the preliminary sulfate reduction with the MFC in CC mode, 40.5% of COD was consumed, leaving less COD available for subsequent methanation. Figure 6c shows the effect of the MFC on sulfate reduction in stillage: COD removal increased by 9.9% under CC operation.
In anaerobic degradation without and with MEC, 45.2% and 54.4% of the total COD were consumed, respectively. The higher methane yield obtained despite consumption of less COD was attributed to hydrolysis and fermentation of polymeric organic compounds present in stillage (starch, dextrin, sugars, and fibrous materials) occurring in the sulfidogenic bioreactor [2]. These processes were also supported by the observed microbial community composition (Figure 4). Accumulation of low-molecular-weight organics, mainly volatile fatty acids, in the first phase promoted biogas production during methanation. Similar results have been reported for sequential microbial sulfate reduction and methanogenesis in the treatment of wastewater with high sulfate content [27].
For vinasse, a higher methane yield was observed with direct methanation compared to the sequential processes without MEC. The results in Figure 6d show COD consumption of 70% during direct methanogenesis. With preliminary MSR using an MFC (CC mode), 44.1% of the total COD was consumed, representing a COD removal increase of 7.5% compared to OC mode. This behavior reflected the different composition of the two wastewater types. It is likely that a large portion of the easily biodegradable organics in vinasse were consumed during the MSR process, resulting in a significantly lower concentration of available substrates for subsequent methanation. Consequently, the remaining more complex compounds had to undergo hydrolysis and fermentation before being converted into substrates suitable for methanogenic activity.
The results are noteworthy; biogas production increases when vinasse is treated after microbial sulfate reduction in the anaerobic bioreactor with a microbial electrolysis cell, such that methane yield becomes comparable to that from direct methanation. This is likely related to the effective channeling of electrons toward methanogenesis in the MEC.
Similar findings have been reported by other researchers [48,49]. According to Wang et al. [48], the increase in methane yield is linked to the enrichment of fermentative bacteria, which enhance the hydrolysis of macromolecular organics and the fermentation of proteins and polysaccharides, as well as the enrichment of electroactive microorganisms and acetoclastic methanogens in the anode biofilm and hydrogenotrophic methanogens in the cathode biofilm.
The highest COD removal during biomethanation was achieved using an MEC following prior MSR aided by an MFC, with residual COD fractions of 5.1% (stillage) and 3.9% (vinasse).
The composition of the generated biogas was also compared, and the data are shown in Table 4.
The methane content when using stillage was 91.8% with a preliminary MSR in a non-integrated system, and increases to 93.4% with the integrated system. In the direct stillage methanation, the methane content was 71.6%. When using vinasse after a microbial sulfate reduction process in a MEC mode, the highest methane content was found to be 93.6%. When implementing the process in a non-integrated system after MSR, the methane content was 90.8%, and in direct methanation, it was 75.4%. Also, in the direct methanation of both substrates, high values of hydrogen sulfide were observed, which were absent in the other two modes with preliminary MSR, due to its removal in the adsorption column. Similar values of the methane fraction during anaerobic treatment of distillery streams have been reported by España-Gamboa et al., 2012 [8], and Zielińska et al., 2021 [9], with 65–75% CH4 reported for the anaerobic treatment of vinasse and 55–70% CH4 for stillage. The H2 content (Table 4) remained low (1.6–2.1%) in the AD-MEC configuration, which can be explained by the activity of hydrogenotrophic methanogens and the applied voltage (0.8 V), which is below the optimum for hydrogen evolution (1.0–1.2 V), directing the electron flow toward methanogenesis [50].
The Supplementary Materials (Tables S38–S45) include the statistical analysis data for the biogas composition parameters presented in Table 4.
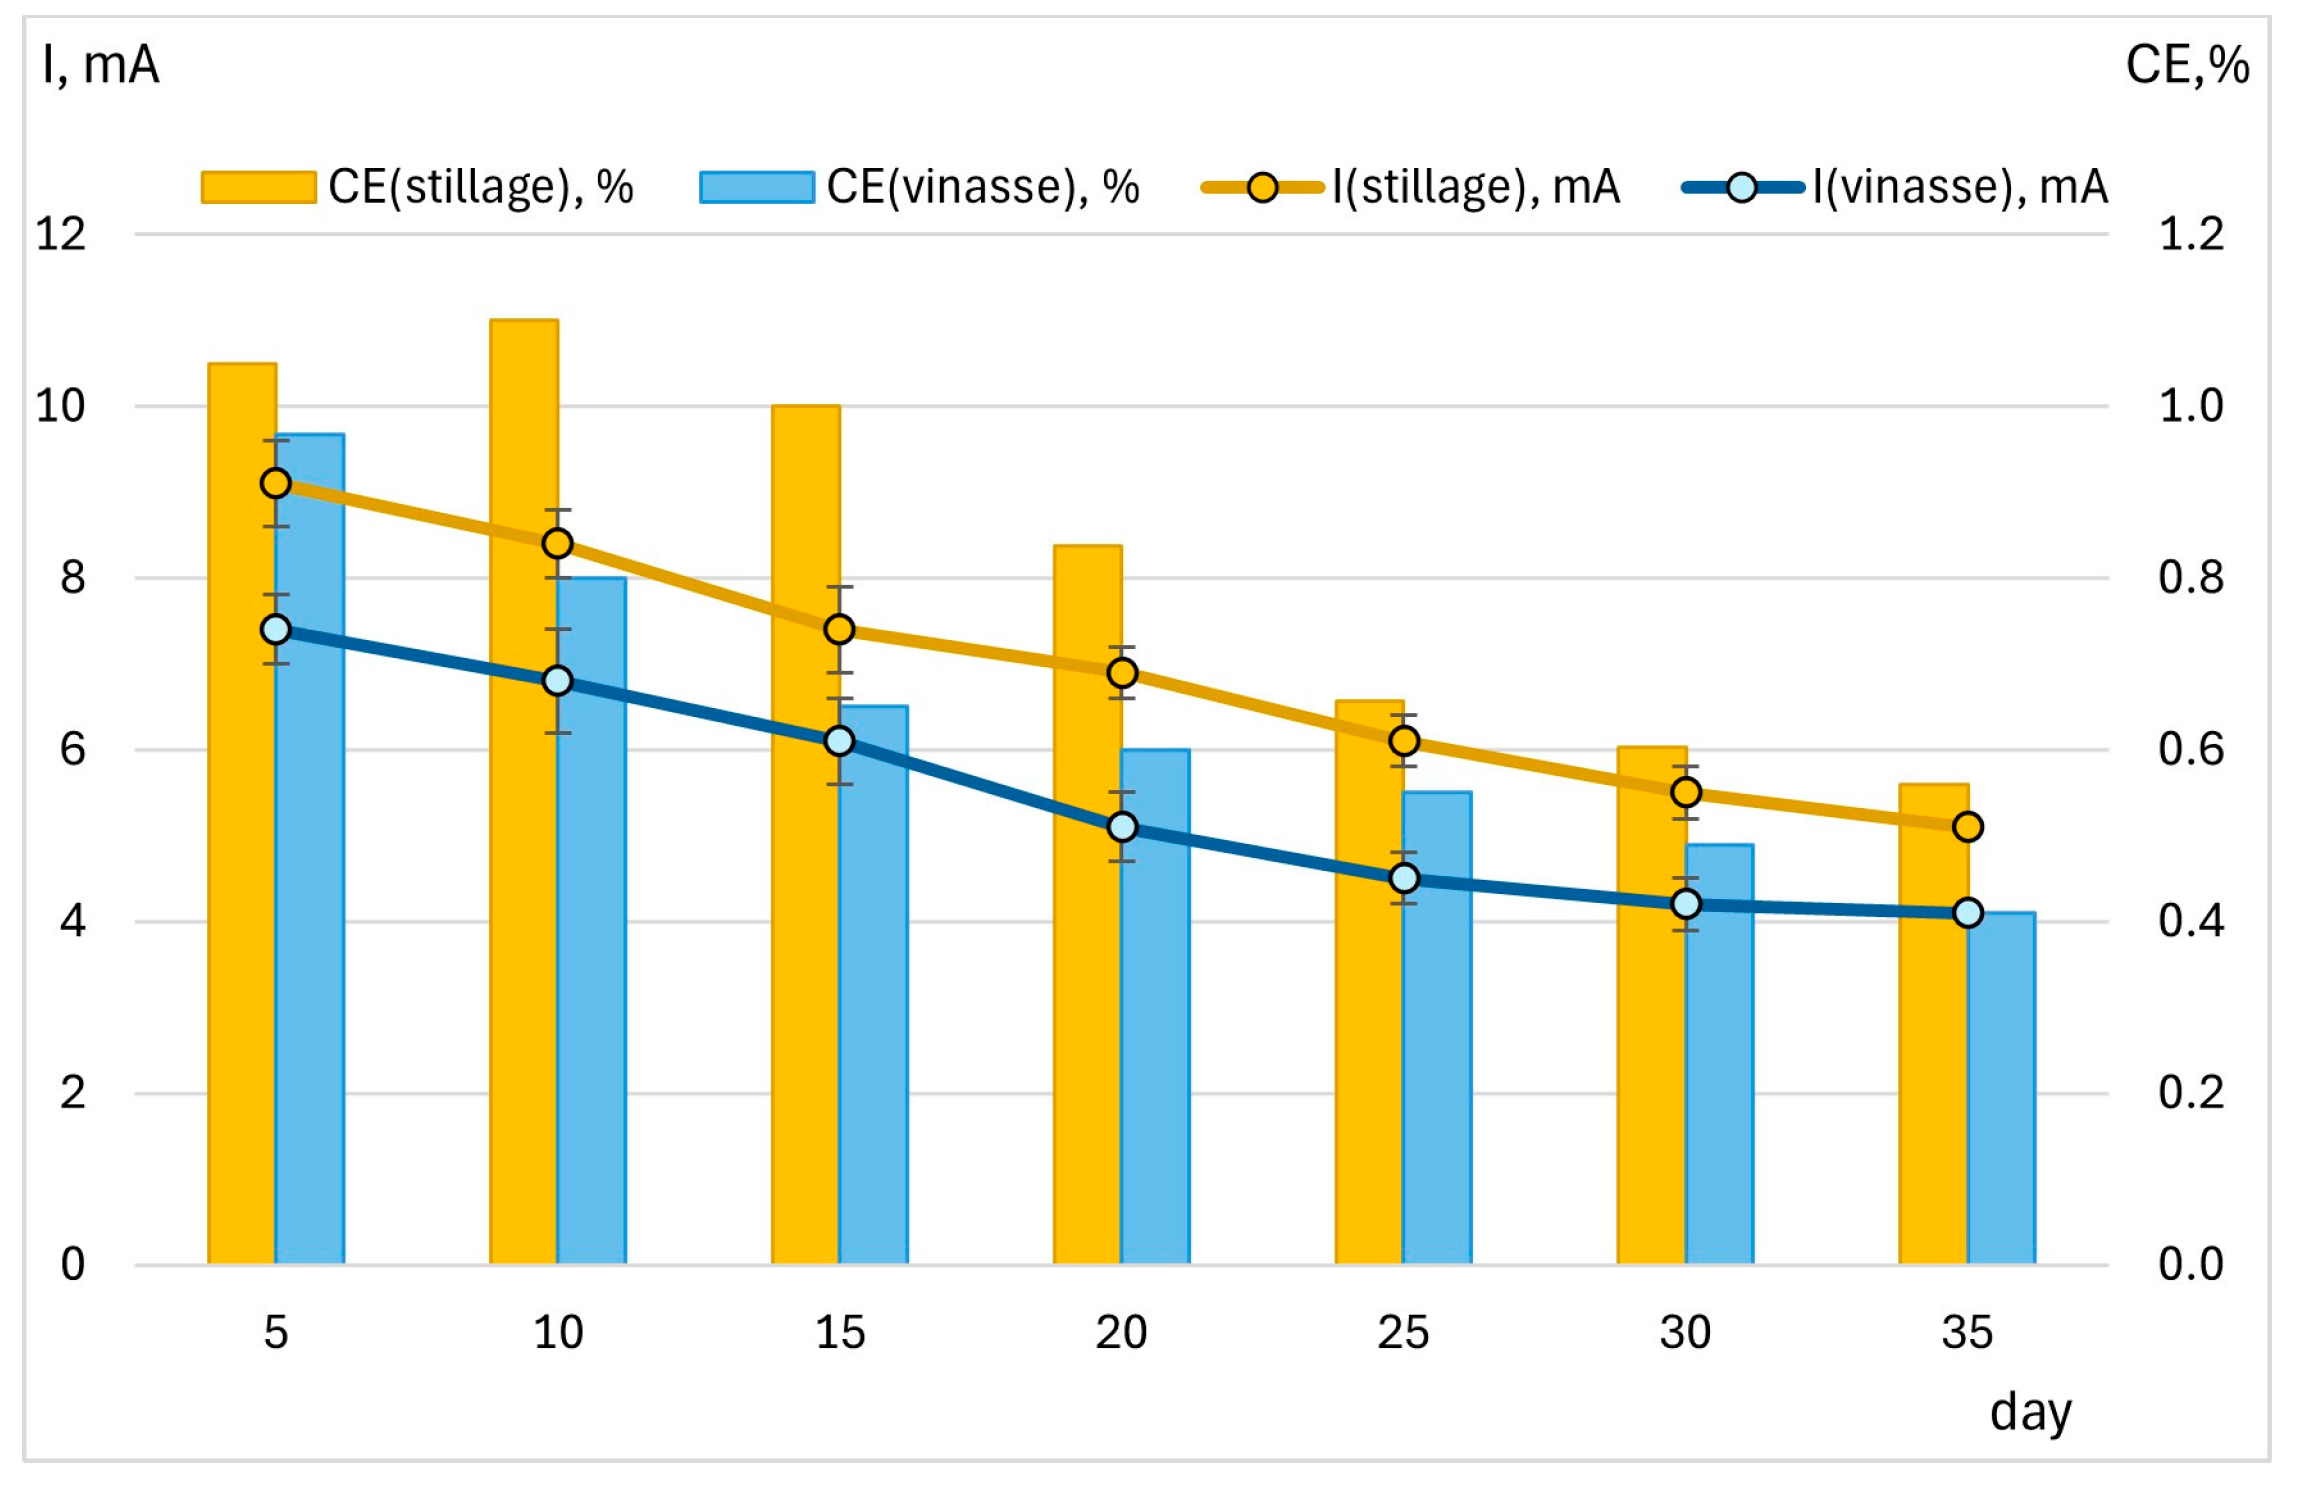
In the AD-MEC experiments with ethanol stillage and vinasse over 35 days (Figure 7), higher current values were observed for stillage (5.2–9.4 mA) compared to vinasse (4.1–7.5 mA), which correlates with its higher electrical conductivity (Table 3 and Table 4). For both substrates, current gradually decreased over the 35-day period, likely due to biomass accumulation on the electrodes and a consequent reduction in their conductivity.
Coulombic efficiency remained low (stillage: 0.5–1.1%; vinasse: 0.4–0.9%), which is typical for AD-MEC systems where a large fraction of electrons is consumed directly by methanogens instead of passing through the external circuit [51]. This did not limit methane formation but rather indicated effective channeling of electrons toward methanogenesis. Similar findings are reported by Lee et al., 2022 [52], who observed increased methane yields (~259–267 mL CH4/g COD removed) in MECs operated at 0.3 V or in OC mode—1.2–2.1 times higher than in standalone AD, without a significant increase in COD removal.

3.5. Analysis of Microbial Communities in the Anaerobic Bioreactor During the Treatment of Ethanol Stillage and Vinasse After the MSR Process

Using metagenomic analysis of the total DNA isolated from activated sludge from the anaerobic methanogenic bioreactor, the microbial communities were identified when the bioreactor was fed with ethanol stillage (ME) and vinasse (MV). The samples were collected during the operation of the laboratory installation with preliminary sulfate reduction and an integrated microbial fuel cell in OC mode.
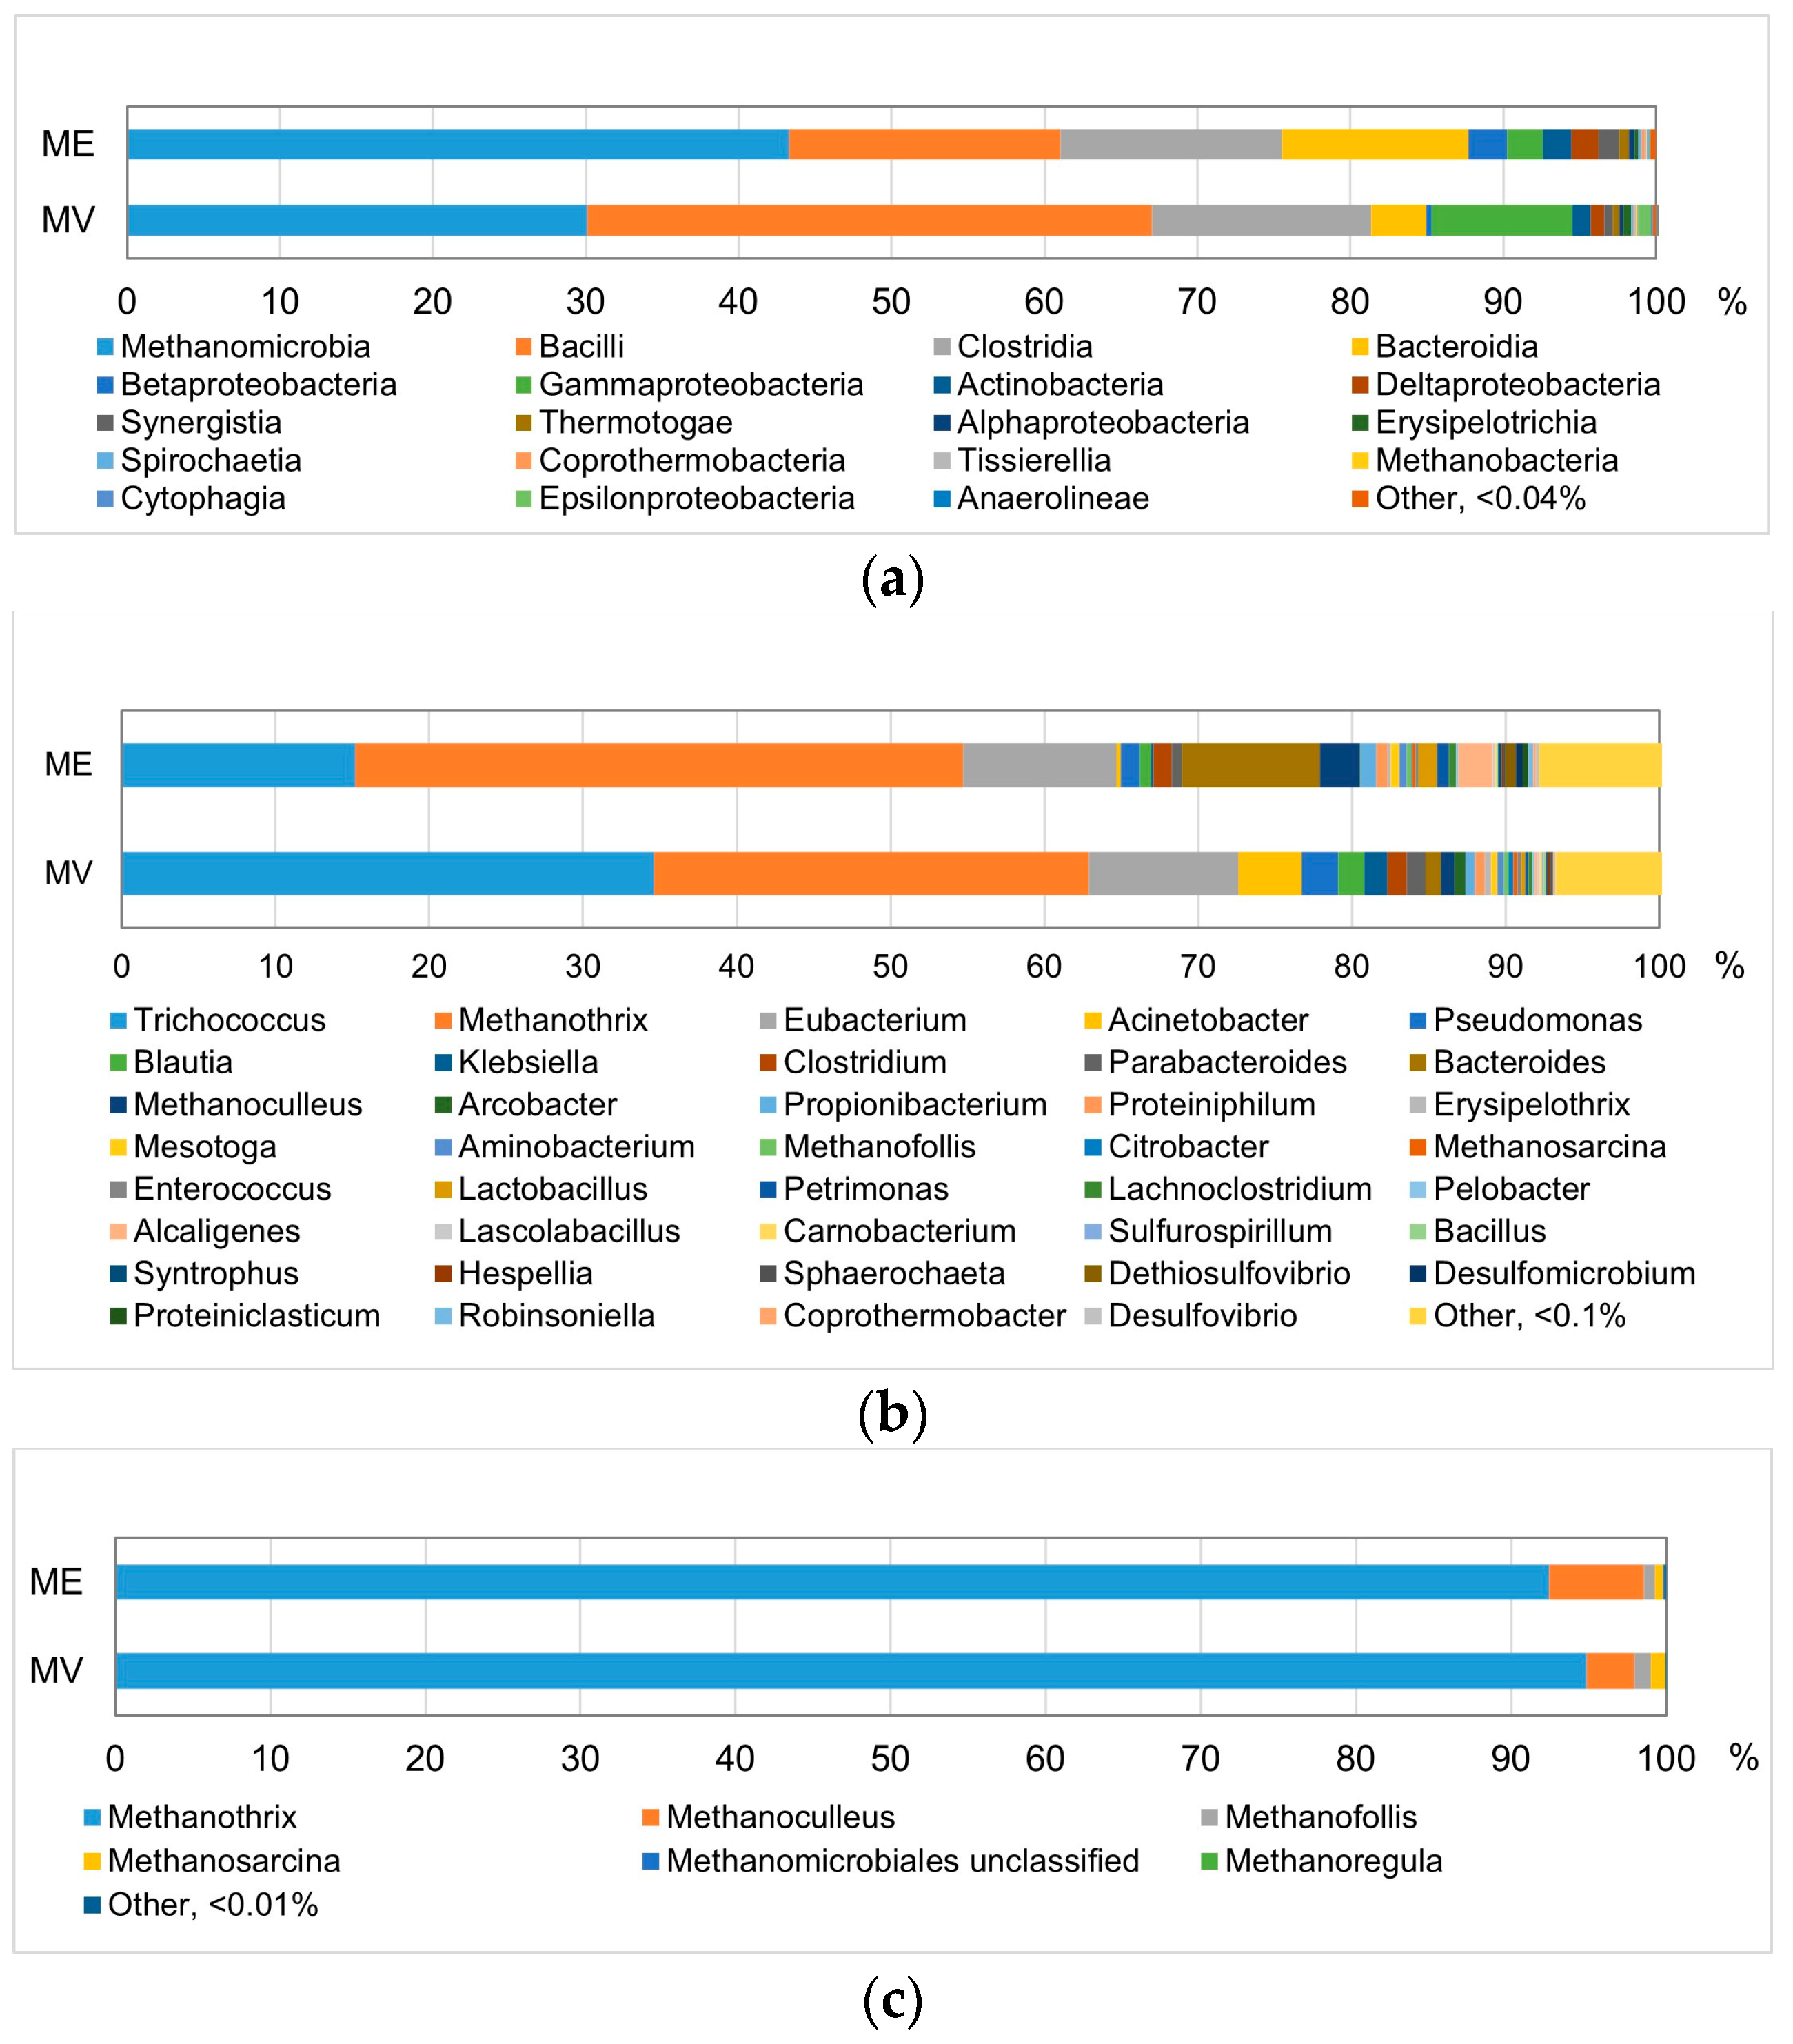
It was found that the microbial communities differ significantly between the two samples (Figure 8a). When treating stillage, the dominant classes in the microbial community were Methanomicrobia (relative abundance 43.32%), Bacilli (17.70%), Clostridia (14.52%), and Bacteroidia (12.17%).
In vinasse, the proportion of Methanomicrobia decreased to 30.11%, while the class Bacilli increased to 36.88%. Within class Bacilli, the family Carnobacteriaceae was mainly present (relative abundance 35.06%). In the MV sample, the proportion of class Bacteroidia decreased to 3.57%, but class Gammaproteobacteria increased almost fourfold (relative abundance 9.17%).
Figure 8b shows that the dominant genus in the microbial community in the treated ethanol stillage was Methanothrix (39.52%). The genera Trichococcus, Eubacterium, and Bacteroides were also present in high numbers in ME, with relative abundances of 15.2%, 9.96%, and 8.96%, respectively. In the MV sample, genus Methanothrix had a relative abundance of 28.25%, while genus Trichococcus dominated with 34.63%. The species T. pasteurii, T. collinsii, and T. ilyis were present at 16.82%, 6.09%, and 3.9%, respectively. The genus Trichococcus consists of aerotolerant anaerobes that ferment carbohydrates. The fermentation products are lactate, acetate, formate, ethanol, CO2, and small amounts of H2 [53]. Two other genera in higher abundance in the MV sample were Eubacterium (9.75%) and Acinetobacter (4.07%). In both microbial communities, the dominant representative of the genus Eubacterium is Eubacterium aggregans. This species metabolizes glucose, fructose, sucrose, arabitol, lactate, methanol, formate, betaine, and methoxyl groups. The end-products of carbohydrate fermentation are acetate, formate, butyrate, H2, and CO2. The end-products from lactate and methoxylated aromatic compounds are acetate and butyrate [54].
Figure 8c presents the percentage distribution of methanogenic bacterial genera within the class Methanomicrobia during the treatment of the two types of organic substrates. Acetoclastic methanogens predominated, with genus Methanothrix accounting for 92.44% and 94.88% of methanogens in ME and MV, respectively. In both samples, the dominant species was Methanothrix soehngenii. The high abundance of acetoclastic methanogens is expected, considering the high acetate concentrations in the effluent after microbial sulfate reduction.
Representatives of the genus Methanothrix often predominate in methanogenic communities in anaerobic reactors fed with various substrates, including wastewater from the distillery industry. In a two-stage anaerobic reactor for biogas generation from Corn Steep Liquor, the dominant methanogenic bacteria are genus Methanothrix and Methanosarcina [55]. When acetate concentrations are low, filamentous species from Methanosaeta dominate. High concentrations of ammonia, hydrogen sulfide, and volatile fatty acids inhibit genus Methanosaeta, but under these conditions, Methanosarcina species develop [56]. The presence of genera Methanosarcina, Methanospirillum, Methanobacterium, and Methanoculleus in anaerobic methanogenic reactors has also been reported by other authors [57,58].

4. Conclusions

The combination of BES-assisted microbial sulfate reduction and biomethanation achieved maximum utilization of organic waste substrates (ethanol stillage and vinasse) from the distillery industry. During the MSR stage, sulfates were almost completely removed. The organic content was significantly reduced, with COD decreases ranging from 30.6% to 44.1% under different operational modes. The integrated MFC enhanced the utilization of organic compounds and oxidized part of the produced biogenic H2S. Acetate accumulation during MSR resulted from the activity of sulfate-reducing bacteria, which partially oxidized organic substances. Within the microbial consortium, the dominant genera of Deltaproteobacteria were Pelobacter and Desulfomicrobium. The high relative abundance of the genus Methanofollis when using vinasse likely resulted from substantial hydrogen production by some members of the microbial community, such as Pelobacter acetylenicus and the genera Enterobacter, Clostridium, Lactobacillus, Klebsiella, and Bacillus. When treating ethanol stillage, the proportion of methanogens in the microbial community was lower, but a significantly higher abundance of the genera Bacteroides and Parabacteroides was observed. Differences in microbial community composition are related to the presence of more complex organic compounds and sugars in ethanol stillage compared to vinasse.
During the anaerobic degradation stage, the highest COD conversion was achieved when biomethanation followed MSR in combination with a microbial electrolysis cell (AD-MEC): 91.14% for ethanol stillage and 89.87% for vinasse. The methane content in the biogas was also highest under these conditions, reaching 94% for stillage and 95% for vinasse. When treating alcohol stillage, the dominant classes in the microbial community were Methanomicrobia (43.32%), with the genus Methanothrix dominating at 39.52%. The genera Trichococcus, Eubacterium, and Bacteroides were also present in high numbers in ME, with relative abundances of 15.2%, 9.96%, and 8.96%, respectively. When vinasse was used, genus Trichococcus dominated the microbial community (34.63%), while genus Methanothrix had a relative abundance of 28.25%. Trichococcus species ferment carbohydrates, producing lactate, acetate, formate, ethanol, and CO2. In both microbial consortia, acetoclastic methanogens were predominant, which correlated with acetate accumulation during the microbial sulfate reduction phase.
These results demonstrate the feasibility of using distillery wastewater for sequential anaerobic processes. In the treatment of ethanol stillage, a significantly higher methane yield was achieved with the application of both anaerobic processes. The composition of the digestates after microbial sulfate reduction provides a favorable basis for subsequent biomethanation. The results obtained from vinasse treatment indicate that when the wastewater contains low sulfate concentrations, the application of direct methanation is the most appropriate approach. The integration of bioelectrochemical systems (BESs) into the anaerobic treatment of distillery wastewater provides additional opportunities to enhance methane recovery, improve COD utilization, promote H2S removal, and increase overall process efficiency, enabling the sustainable valorization of sulfate-rich effluents.

Supplementary Materials

The following supporting information can be downloaded at https://www.mdpi.com/article/10.3390/biomass6020021/s1. Tables S1–S37 include the statistical analysis data for the parameters presented in Table 1 in this paper; Tables S38–S45 include the statistical analysis data for the biogas composition parameters presented in Table 4 in this paper; Tables S46–S79 include the statistical analysis data for the parameters presented in Table 2 and Table 3 in this paper.

Author Contributions

A.A. and S.B. conceived and designed the research. A.A., S.B., P.V., and K.N. wrote the manuscript. A.A., S.B., P.V., K.N., P.G., R.I., and S.P. conducted experiments and analyzed the data. In particular, S.B. and P.V. analyzed the metagenomics data. A.A. and S.B. critically revised the manuscript. All authors have read and agreed to the published version of the manuscript.

Funding

This research was funded by the Bulgarian National Science Fund, grant number KP-06-N67/3, 12 December 2022.

Data Availability Statement

The data that support the findings of this study are available from the corresponding author, A.A., upon reasonable request.

Conflicts of Interest

The authors declare no conflicts of interest.

Abbreviations

The following abbreviations are used in this manuscript:
BESsBioelectrochemical systems
MFCMicrobial fuel cell
OCOpen-circuit
CCClosed-circuit
MECMicrobial electrolysis cell
CEMCation exchange membrane
MSRMicrobial sulfate reduction
SRBSulfate-reducing bacteria
CODChemical oxygen demand
ADAnaerobic digestion
AD-MECAnaerobic digester with microbial electrolysis cell
UASBUp-flow anaerobic sludge blanket
HRTHydraulic retention time
ORPOxidation–reduction potential
ECElectrical conductivity
CECoulombic efficiency
HPLCHigh-performance liquid chromatography
rRNARibosomal ribonucleic acid
DNADeoxyribonucleic acid
SRESample from MSR reactor with ethanol stillage
SRVSample from MSR reactor with vinasse
MESample from methanation reactor with ethanol stillage
MVSample from methanation reactor with vinasse

References

  1. Vlyssides, A.; Barampouti, E.M.; Mai, S.; Stamatoglou, A.; Tsima, E. Alternative biological systems for the treatment of vinasse from wine. Water Sci. Technol. 2010, 62, 2899–2904. [Google Scholar] [CrossRef] [Scilit]
  2. Mikucka, W.; Zielińska, M. Distillery Stillage: Characteristics, treatment, and valorization. Appl. Biochem. Biotechnol. 2020, 192, 770–793. [Google Scholar] [CrossRef] [Scilit]
  3. Naspolini, B.F.; Machado, A.C.O.; Cravo Junior, W.B.; Freire, D.M.G.; Cammarota, M.C. Bioconversion of Sugarcane Vinasse into High-Added Value Products and Energy. BioMed Res. Int. 2017, 2017, 8986165. [Google Scholar] [CrossRef] [Scilit]
  4. Moran-Salazar, R.G.; Sanchez-Lizarraga, A.L.; Rodriguez-Campos, J.; Davila-Vazquez, G.; Marino-Marmolejo, E.N.; Dendooven, L.; Contreras-Ramos, S.M. Utilization of vinasses as soil amendment: Consequences and perspectives. SpringerPlus 2016, 5, 1007. [Google Scholar] [CrossRef] [Scilit] [PubMed]
  5. Muyzer, G.; Stams, A. The ecology and biotechnology of sulphate-reducing bacteria. Nat. Rev. Microbiol. 2008, 6, 441–454. [Google Scholar] [CrossRef] [Scilit] [PubMed]
  6. Rittmann, B.E. Opportunities for renewable bioenergy using microorganisms. Biotechnol. Bioeng. 2008, 100, 203–212. [Google Scholar] [CrossRef] [Scilit] [PubMed]
  7. Fortney, N.W.; Hanson, N.J.; Rosa, P.R.F.; Donohue, T.J.; Noguera, D.R. Diverse Profile of Fermentation Byproducts From Thin Stillage. Front. Bioeng. Biotechnol. 2021, 9, 695306. [Google Scholar] [CrossRef] [Scilit]
  8. España-Gamboa, E.I.; Mijangos-Cortés, J.O.; Hernández-Zárate, G.; Maldonado, J.A.D.; Alzate-Gaviria, L.M. Methane production by treating vinasses from hydrous ethanol using a modified UASB reactor. Biotechnol. Biofuels 2012, 5, 82. [Google Scholar] [CrossRef] [Scilit]
  9. Zielińska, M.; Bułkowska, K.; Mikucka, W. Valorization of Distillery Stillage for Bioenergy Production: A Review. Energies 2021, 14, 7235. [Google Scholar] [CrossRef] [Scilit]
  10. Chen, Y.; Cheng, J.J.; Creamer, K.S. Inhibition of anaerobic digestion process: A review. Bioresour. Technol. 2008, 99, 4044–4064. [Google Scholar] [CrossRef] [Scilit]
  11. Mutegoa, E.; Sahini, M.G. Approaches to mitigation of hydrogen sulfide during anaerobic digestion process—A review. Heliyon 2023, 9, 19768. [Google Scholar] [CrossRef] [Scilit]
  12. Beschkov, V.; Angelov, I.; Stefanov, S.; Ljutzkanov, L. An integrated sulfide removal approach from a substrate for biogas production and the simultaneous production of electricity. Clean Technol. 2025, 7, 77. [Google Scholar] [CrossRef] [Scilit]
  13. Kaksonen, A.H.; Puhakka, J.A. Sulfate reduction based bioprocesses for the treatment of acid mine drainage and the recovery of metals. Eng. Life Sci. 2007, 7, 541–564. [Google Scholar] [CrossRef] [Scilit]
  14. Mafane, D.; Ngulube, T.; Mphahlele-Makgwane, M.M. Anaerobic Bioremediation of Acid Mine Drainage Using Sulphate-Reducing Bacteria: Current Status. Challenges, and Future Directions. Sustainability 2025, 17, 3567. [Google Scholar] [CrossRef] [Scilit]
  15. Bratkova, S.; Alexieva, Z.; Angelov, A.; Nikolova, K.; Genova, P.; Ivanov, R.; Gerginova, M.; Peneva, N.; Beshkov, V. Efficiency of microbial fuel cells based on the sulfate reduction by lactate and glucose. Int. J. Environ. Sci. Technol. 2019, 16, 6145–6156. [Google Scholar] [CrossRef] [Scilit]
  16. Angelov, A.; Bratkova, S.; Ivanov, R.; Velichkova, P. Treatment of acid mine drainage in a bioelectrochemical system, based on an anodic microbial sulfate reduction. J. Ecol. Eng. 2023, 24, 175–186. [Google Scholar] [CrossRef] [Scilit] [PubMed]
  17. Diao, C.; Ye, W.; Yan, J.; Hao, T.; Huang, L.; Chen, Y.; Long, J.; Xiao, T.; Zhang, H. Application of microbial sulfate-reduction process for sulfate-laden wastewater treatment: A review. J. Water Process Eng. 2023, 52, 103537. [Google Scholar] [CrossRef] [Scilit]
  18. Velichkova, P.; Bratkova, S.; Angelov, A.; Nikolova, K.; Genova, P.; Ivanov, R. Utilization of Distillery Wastewater in a Microbial Fuel Cell Based on Microbial Sulfate Reduction. J. Ecol. Nat. Resour. 2025, 9, 000410. [Google Scholar] [CrossRef] [Scilit]
  19. Brenner, D.J.; Krieg, N.R.; Staley, J.T. Class IV. Deltaproteobacteria class nov. In Bergey’s Manual® of Systematic Bacteriology; Chapter 3; Springer: Boston, MA, USA, 2005; pp. 922–1144. [Google Scholar] [CrossRef]
  20. Jing, Z.; Hu, Y.; Niu, Q.; Liu, Y.; Li, Y.-Y.; Wang, X.C. UASB performance and electron competition between methane-producing archaea and sulfate-reducing bacteria in treating sulfate-rich wastewater containing ethanol and acetate. Bioresour. Technol. 2013, 137, 349–357. [Google Scholar] [CrossRef] [Scilit]
  21. Timmers, P.H.A.; Vavourakis, C.D.; Kleerebezem, R.; Damsté, J.S.S.; Muyzer, G.; Stams, A.J.M.; Plugge, C.M. Metabolism and Occurrence of Methanogenic and Sulfate-Reducing Syntrophic Acetate Oxidizing Communities in Haloalkaline Environments. Front. Microbiol. 2018, 9, 3039. [Google Scholar] [CrossRef] [Scilit]
  22. Zhou, X.; Fernández-Palacios, E.; Dorado, A.D.; Gamisans, X.; Gabriel, D. Assessing main process mechanism and rates of sulfate reduction by granular biomass fed with glycerol under sulfidogenic conditions. Chemosphere 2022, 286, 131649. [Google Scholar] [CrossRef] [Scilit] [PubMed]
  23. Lens, P.; Vallerol, M.; Esposito, G.; Zandvoort, M. Perspectives of sulfate reducing bioreactors in environmental biotechnology. Rev. Environ. Sci. Biotechnol. 2002, 1, 311–325. [Google Scholar] [CrossRef] [Scilit]
  24. Santos, A.M.; Costa, J.M.; Braga, J.K.; Flynn, T.M.; Brucha, G.; Sancinetti, G.P.; Rodriguez, R.P. Lactate as an effective electron donor in the sulfate reduction: Impacts on the microbial diversity. Environ. Technol. 2021, 43, 3149–3160. [Google Scholar] [CrossRef] [Scilit] [PubMed]
  25. Hessler, T.; Harrison, S.T.; Banfield, J.F.; Huddy, R.J. Harnessing Fermentation May Enhance the Performance of Biological Sulphate-Reducing Bioreactors. Environ. Sci. Technol. 2024, 58, 2830–2846. [Google Scholar] [CrossRef] [Scilit]
  26. Ye, Y.; Ye, J.; Xu, Z.; Kang, J.; Liu, D.; Ren, Y.; Ngo, H.H.; Guo, W.; Huang, S.; Jiang, W. Influence of ethanol supplementation on sulfate reduction and methanogenesis in UASB reactors. J. Water Process Eng. 2025, 74, 107754. [Google Scholar] [CrossRef] [Scilit]
  27. Li, J.; Feng, Y.; Wang, D.; Li, Y.; Cai, M.; Tian, Y.; Pan, Y.; Chen, X.; Zhang, Q.; Li, A. Optimization of sulfate reduction and methanogenesis via phase separation in a two-phase internal circulation reactor for the treatment of high-sulfate organic wastewater. Water Res. 2024, 260, 121918. [Google Scholar] [CrossRef] [Scilit]
  28. Ahmad, A.; Priyadarshani, M.; Das, S.; Ghangrekar, M.M. Role of bioelectrochemical systems for the remediation of emerging contaminants from wastewater: A review. J. Basic Microbiol. 2022, 62, 201–222. [Google Scholar] [CrossRef] [Scilit]
  29. Zhang, X.; Li, X.; Zhao, X.; Li, Y. Factors affecting the efficiency of a bioelectrochemical system: A review. RSC Adv. 2019, 9, 19748–19761. [Google Scholar] [CrossRef] [Scilit]
  30. Angelov, A.; Bratkova, S.; Loukanov, A. Microbial fuel cell based on electroactive sulfate-reducing biofilm. Energy Convers. Manag. 2013, 67, 283–286. [Google Scholar] [CrossRef] [Scilit]
  31. Chen, X.; Xiao, B.; Tang, X.; Bian, C.; Liu, J.; Li, L. Microbial electrolysis cell simultaneously enhancing methanization and reducing hydrogen sulfide production in anaerobic digestion of sewage sludge. Chemosphere 2023, 337, 139445. [Google Scholar] [CrossRef] [Scilit]
  32. Zhao, Q.; Wang, H.; Liu, R.; Yuan, H.; Li, X. Enhancing Biomethane Yield and Metabolic Pathways in Kitchen Waste Anaerobic Digestion Through Microbial Electrolysis Cell Integration. Energies 2025, 18, 1629. [Google Scholar] [CrossRef] [Scilit]
  33. APHA. Standard Methods for the Examination of Water and Wastewater; American Public Health Association: New York, NY, USA, 1989. [Google Scholar]
  34. Hu, J.; Zeng, C.; Liu, G.; Lu, Y.; Zhang, R.; Luo, H. Enhanced sulfate reduction accompanied with electrically-conductive pili production in graphene oxide modified biocathodes. Bioresour. Technol. 2019, 282, 425–432. [Google Scholar] [CrossRef] [Scilit]
  35. Hemalatha, M.; Shanthi Sravan, J.; Venkata Mohan, S. Self-induced bioelectro-potential influence on sulfate removal and desalination in microbial fuel cell. Bioresour. Technol. 2020, 309, 123326. [Google Scholar] [CrossRef] [Scilit]
  36. Morris, J.M.; Jin, S. Influence of NO3 and SO4 on power generation from microbial fuel cells. Chem. Eng. J. 2009, 153, 127–130. [Google Scholar] [CrossRef] [Scilit]
  37. Pan, X.; Raaijmakers, J.M.; Carrión, V.J. Importance of Bacteroidetes in host–microbe interactions and ecosystem functioning. Trends Microbiol. 2023, 31, 959–971. [Google Scholar] [CrossRef] [Scilit] [PubMed]
  38. Schink, B. Fermentation of acetylene by an obligate anaerobe, Pelobacter acetylenicus sp. nov. Arch. Microbiol. 1985, 142, 295–301. [Google Scholar] [CrossRef] [Scilit]
  39. Kapdan, I.K.; Kargi, F. Bio-hydrogen production from waste materials. Enzym. Microb. Technol. 2006, 38, 569–582. [Google Scholar] [CrossRef] [Scilit]
  40. Welte, C.; Deppenmeier, U. Bioenergetics and anaerobic respiratory chains of aceticlastic methanogens. Biochim. Biophys. Acta (BBA)-Bioenerg. 2014, 1837, 1130–1147. [Google Scholar] [CrossRef] [Scilit]
  41. Sakamoto, M.; Ohkuma, M. Bacteroides reticulotermitis sp. nov., isolated from the gut of a subterranean termite (Reticulitermes speratus). Int. J. Syst. Evol. Microbiol. 2013, 63, 691–695. [Google Scholar] [CrossRef] [Scilit]
  42. Tan, H.-Q.; Li, T.-T.; Zhu, C.; Zhang, X.-Q.; Wu, M.; Zhu, X.-F. Parabacteroides chartae sp. nov., an obligately anaerobic species from wastewater of a paper mill. Int. J. Syst. Evol. Microbiol. 2012, 62, 2613–2617. [Google Scholar] [CrossRef] [Scilit]
  43. Copeland, A.; Spring, S.; Göker, M.; Schneider, S.; Lapidus, A.; Del Rio, T.G.; Tice, H.; Cheng, J.F.; Chen, F.; Nolan, M.; et al. Complete genome sequence of Desulfomicrobium baculatum type strain (X). Stand. Genom. Sci. 2009, 1, 29–37. [Google Scholar] [CrossRef] [Scilit]
  44. Dias, M.; Salvado, J.C.; Monperrus, M.; Caumette, P.; Amouroux, D.; Duran, R.; Guyoneaud, R. Characterization of Desulfomicrobium salsuginis sp. nov. and Desulfomicrobium aestuarii sp. nov., two new sulfate-reducing bacteria isolated from the Adour estuary (French Atlantic coast) with specific mercury methylation potentials. Syst. Appl. Microbiol. 2008, 31, 30–37. [Google Scholar] [CrossRef] [Scilit]
  45. Díaz-Cárdenas, C.; López, G.; Patel, B.K.C.; Baena, S. Dethiosulfovibrio salsuginis sp. nov., an anaerobic, slightly halophilic bacterium isolated from a saline spring. Int. J. Syst. Evol. Microbiol. 2010, 60, 850–853. [Google Scholar] [CrossRef] [Scilit] [PubMed]
  46. Nogueira, E.W.; Godoi, L.A.G.; Yabuki, L.N.M.; Yabuki, L.N.M.; Brucha, G.; Damianovic, M.H.R.Z. Sulfate and metal removal from acid mine drainage using sugarcane vinasse as electron donor: Performance and microbial community of the down-flow structured-bed bioreactor. Bioresour. Technol. 2021, 330, 124968–124978. [Google Scholar] [CrossRef] [Scilit] [PubMed]
  47. Pan, J.-J.; Tan, L.-Y.; Fan, Q.-Q.; Cao, X.-Y.; Huang, J.; Gu, Y.-K.; Chen, T.-M. Effect of different carbon sources on sulfate reduction and microbial community structure in bioelectrochemical systems. Environ. Sci. Pollut. Res. 2023, 30, 18312–18324. [Google Scholar] [CrossRef] [Scilit]
  48. Xu, X.J.; Wang, W.Q.; Chen, C.; Xie, P.; Liu, W.Z.; Zhou, X.; Wang, X.T.; Yuan, Y.; Wang, A.J.; Lee, D.J.; et al. Bioelectrochemical system for the enhancement of methane production by anaerobic digestion of alkaline pretreated sludge. Bioresour. Technol. 2020, 304, 123000. [Google Scholar] [CrossRef] [Scilit] [PubMed]
  49. Wang, X.-T.; Zhao, L.; Chen, C.; Chen, K.-Y.; Yang, H.; Xu, X.-J.; Zhou, X.; Liu, W.-Z.; Xing, D.-F.; Ren, N.-Q.; et al. Microbial electrolysis cells (MEC) accelerated methane production from the enhanced hydrolysis and acidogenesis of raw waste activated sludge. Chem. Eng. J. 2021, 413, 127472. [Google Scholar] [CrossRef] [Scilit]
  50. Lim, S.S.; Fontmorin, J.-M.; Izadi, P.; Daud, W.R.W.D.; Scott, K.; Yu, E.H. Impact of Applied Cell Voltage on the Performance of a Microbial Electrolysis Cell Fully Catalysed by Microorganisms. Int. J. Hydrogen Energy 2020, 45, 2557–2568. [Google Scholar] [CrossRef] [Scilit]
  51. He, W.; Zhang, D.; Zhang, L.; Ai, Z.; Guo, Z.; Yang, T.; Zhai, L.; Huang, C. Enhanced Methanogenesis of Waste-Activated Sludge (WAS) in a Continuous Stirring Tank Reactor with Stealth Electrodes. Fermentation 2024, 10, 158. [Google Scholar] [CrossRef] [Scilit]
  52. Lee, M.E.; Ahn, Y.; Shin, S.G.; Chung, J.W. Enhancement of Biogas Production in Anaerobic Digestion Using Microbial Electrolysis Cell Seed Sludge. Energies 2022, 15, 7042. [Google Scholar] [CrossRef] [Scilit]
  53. Holzapfel, W.H.; Wood, B.J.B. The genus Trichococcus. In Lactic Acid Bacteria (Biodiversity and Taxonomy); John Wiley & Sons, Ltd.: Hoboken, NJ, USA, 2014; pp. 135–145. [Google Scholar] [CrossRef] [Scilit]
  54. Mechichi, T.; Labat, M.; Woo, T.H.S.; Thomas, P.; Garcia, J.; Patel, B.K.C. Eubacterium aggreganssp. nov., a New Homoacetogenic Bacterium from Olive Mill Wastewater Treatment Digestor. Anaerobe 1998, 4, 283–291. [Google Scholar] [CrossRef] [Scilit] [PubMed]
  55. Stoyancheva, G.; Kabaivanova, L.; Hubenov, V.; Chorukova, E. Metagenomic Analysis of Bacterial, Archaeal and Fungal Diversity in Two-Stage Anaerobic Biodegradation for Production of Hydrogen and Methane from Corn Steep Liquor. Microorganisms 2023, 11, 1263–1276. [Google Scholar] [CrossRef] [Scilit] [PubMed]
  56. Demirel, B.; Scherer, P. The roles of acetotrophic and hydrogenotrophic methanogens during anaerobic conversion of biomass to methane: A review. Rev. Environ. Sci. Biotechnol. 2008, 7, 173–190. [Google Scholar] [CrossRef] [Scilit]
  57. Vítězová, M.; Kohoutová, A.; Vítěz, T.; Hanišáková, N.; Kushkevych, I. Methanogenic Microorganisms in Industrial Wastewater Anaerobic Treatment. Processes 2020, 8, 1546. [Google Scholar] [CrossRef] [Scilit]
  58. Zhao, Z.; Wang, J.; Li, Y.; Zhu, T.; Yu, Q.; Wang, T.; Liang, S.; Zhang, Y. Why do DIETers like drinking: Metagenomic analysis for methane and energy metabolism during anaerobic digestion with ethanol. Water Res. 2020, 171, 115425. [Google Scholar] [CrossRef] [Scilit]
Figure 1. A schematic of the laboratory installation. 1—feed solution; 2—dosing pump; 3—MSR bioreactor; 4—buffer vessel for pH correction; 5—1 N NaOH solution; 6—MFC with air cathode and cation exchange membrane (CEM); 7—MFC load circuit; 8—adsorption column for H2S removal with iron filings; 9—recirculation pumps; 10—bioreactor for biomethanation; 11—microbial electrolysis cell (MEC); 12—MEC load circuit; 13—outlet solution.
Biomass 06 00021 g001
Figure 2. Mean values and standard deviations of the variables in the sulfate reduction process: (a) sulfate removal (%)—ethanol stillage treatment; (b) sulfate removal (%)—vinasse treatment; (c) COD removal (%)—ethanol stillage treatment; (d) COD removal (%)—vinasse treatment.
Biomass 06 00021 g002
Figure 3. Polarization curve/power density and current generation/columbic efficiency in MFC: (a) polarization curves and power curves; U1, P1—voltage and power density in ethanol stillage; U2, P2—voltage and power density in vinasse; (b) dynamics of CE and anode current in MFC for 35 days in CC mode.
Biomass 06 00021 g003
Figure 4. Microbial community structure at SRE and SRV: (a) bacterial communities at the class level; (b) relative abundance (%) of identified bacterial genera; (c) proportion of class Deltaproteobacteria.
Biomass 06 00021 g004aBiomass 06 00021 g004b
Figure 5. Mean values and standard deviations of COD removal (%) in the methanation process: (a) COD removal (%)—ethanol stillage treatment; (b) COD removal (%)—vinasse treatment.
Biomass 06 00021 g005
Figure 6. Methane (CH4) production and COD removal during the treatment of (a) stillage and (b) vinasse in AD-based systems, and COD removal distribution across process stages with (c) stillage and (d) vinasse. MSR-OC—microbial sulfate reduction with open-circuit MFC; MSR-CC—microbial sulfate reduction with closed-circuit MFC; AD—direct methanation; AD_MSR—anaerobic digestion after MSR; AD-MEC—anaerobic digestion after microbial sulfate reduction.
Biomass 06 00021 g006
Figure 7. Coulombic efficiency and current output during AD-MEC operation with stillage and vinasse.
Biomass 06 00021 g007
Figure 8. Microbial community structure at ME and MV: (a) bacterial communities at the class level; (b) relative abundance (%) of identified bacterial genera; (c) proportion of class Methanomicrobia.
Biomass 06 00021 g008
Table 1. Data on basic physicochemical and chemical parameters (mean ± standard deviation) in the microbial sulfate reduction process with an HRT of 22 h.
ParameterEthanol StillageVinasse
Feed SolutionOutlet SolutionFeed SolutionOutlet Solution
OCCCOCCC
pH7.55 ± 0.087.03 ± 0.097.84 ± 0.087.58 ± 0.076.81 ± 0.087.45 ± 0.08
ORP, mV21 ± 7.28−412 ± 13.35−433 ± 11.1322.5 ± 8.1−420 ± 12.2−425 ± 10.8
EC (mS/cm)17.52 ± 0.116.03 ± 0.1015.73 ± 0.0616.16 ± 0.0715.49 ± 0.0814.96 ± 0.1
SO42−, g/L3.24 ± 0.070.15 ± 0.020.24 ± 0.023.38 ± 0.060.25 ± 0.030.41 ± 0.03
S2−, mg/LNA621 ± 17.1312 ± 14.9NA471 ± 10.7265 ± 11.3
COD, gO2/L27.2 ± 0.3118.9 ± 0.2316.2 ± 0.1230.1 ± 0.3119.1 ± 0.1816.8 ± 0.15
COD removal,%NA30.6 ± 1.1740.5 ± 0.95NA36.5 ± 0.6344.1 ± 0.56
Sulfate reduction rate,
SO42−, mg/L·h
NA140.5 ± 2.49136.4 ± 2.59NA142.3 ± 2.98135 ± 2.54
Sulfate removal,%NA95.4 ± 0.5592.8 ± 0.65NA92.6 ± 0.7687.9 ± 0.89
Sulfide removal,%NANA50.2 ± 2.47NANA56.3 ± 2.22
Lactic acid, g/L4.08 ± 0.07001.26 ± 0.090.06 ± 0.020
Acetic acid, g/L0.49 ± 0.063.86 ± 0.14.68 ± 0.120.06 ± 0.013.99 ± 0.164.04 ± 0.19
Propionic acid, g/L0.64 ± 0.110.91 ± 0.111.15 ± 0.0700.65 ± 0.080.72 ± 0.08
Ethanol, g/L0.61 ± 0.090.21 ± 0.060.11 ± 0.022.56 ± 0.10.69 ± 0.080.66 ± 0.06
D(+)glucose, g/L0.12 ± 0.030.03 ± 0.020.02 ± 0.010.2 ± 0.030.06 ± 0.020.03 ± 0.02
D(+)xylose, g/L0.09 ± 0.020.01 ± 0.0101.08 ± 0.120.22 ± 0.050.01 ± 0.01
D(+)mannose, g/L7.55 ± 0.087.03 ± 0.097.84 ± 0.087.58 ± 0.076.81 ± 0.087.45 ± 0.08
D(+)galactose, g/L0.02 ± 0.0100000
L(+)arabinose, g/L0.03 ± 0.0100000
D(+)cellobiose, g/L0.24 ± 0.020.0100.22 ± 0.040.03 ± 0.010
NA = not applicable.
Table 2. Physical–chemical and chemical parameters (mean ± standard deviation) of treated ethanol stillage under different methanation modes.
ParameterEthanol Stillage Direct ADEthanol Stillage After MSR
Feed SolutionOutlet Solution After ADFeed Solution
After MSR
Outlet Solution After ADOutlet Solution After AD-MEC
pH7.58 ± 0.078.15 ± 0.077.84 ± 0.087.53 ± 0.067.97 ± 0.06
ORP, mV22 ± 8.2−358 ± 9.4−433 ± 11−352 ± 9.8−372 ± 9.8
EC, mS/cm17.5 ± 0.1113.05 ± 0.0715.73 ± 0.0612.68 ± 0.0712.41 ± 0.06
SO42−, g/L0.465 ± 0.050.148 ± 0.060.24 ± 0.0100
H2S, mg/LNA92 ± 3.712 ± 60.05 ± 0.010
COD, gO2/L27.4 ± 0.178.6 ± 0.2416.2 ± 0.152.9 ± 0.211.4 ± 0.08
COD removal, %NA68.6 ± 0.75NA82.04 ± 1.1791.36 ± 0.44
Lactic acid, g/L4.10 ± 0.090.31 ± 0.04000
Acetic acid, g/L0.46 ± 0.040.04 ± 0.014.68 ± 0.10.03 ± 0.010.01 ± 0.01
Propionic acid, g/L0.65 ± 0.10.15 ± 0.021.15 ± 0.070.06 ± 0.010.02 ± 0.01
Ethanol, g/L0.64 ± 0.1100.11 ± 0.0300
D(+)glucose, g/L0.14 ± 0.0200.02 ± 0.0100
D(+)xylose, g/L0.09 ± 0.050.06 ± 0.01000
D(+)mannose, g/L0.26 ± 0.050.10 ± 0.02000
D(+)galactose, g/L0.02 ± 0.020.01 ± 0.01000
L(+)arabinose, g/L0.03 ± 0.010.02 ± 0.01000
D(+)cellobiose, g/L0.25 ± 0.020.16 ± 0.03000
NA = not applicable.
Table 3. Physical–chemical and chemical parameters (mean ± standard deviation) of treated vinasse under different methanation modes.
ParameterVinasse Direct ADVinasse After MSR
Feed SolutionOutlet Solution After ADFeed Solution
After MSR
Outlet Solution After ADOutlet Solution After AD-MEC
pH7.56 ± 0.078.06 ± 0.077.45 ± 0.077.42 ± 0.077.86 ± 0.08
ORP, mV23.4 ± 6.76−365 ± 11.58−425 ± 12.28−371 ± 11.5−375 ± 10.5
EC, mS/cm16.18 ± 0.0810.67 ± 0.0714.96 ± 0.110.43 ± 0.0510.36 ± 0.07
SO42−, g/L0.17 ± 0.070.12 ± 0.050.41 ± 0.0300
H2S, mg/LNA15 ± 0.428.4 ± 3.060.03 ± 0.020
COD, gO2/L30.0 ± 0.288.8 ± 0.3716.8 ± 0.142.7 ± 0.231.2 ± 0.1
COD removal, %NA70.6 ± 1.02NA83.8 ± 1.4492.8 ± 0.59
Lactic acid, g/L1.28 ± 0.110.10 ± 0.04000
Acetic acid, g/L0.06 ± 0.010.07 ± 0.014.04 ± 0.150.08 ± 0.020.06 ± 0.01
Propionic acid, g/L00.08 ± 0.040.72 ± 0.080.04 ± 0.010.02 ± 0.01
Ethanol, g/L2.58 ± 0.0900.64 ± 0.0600
D(+)glucose, g/L0.2 ± 0.0400.02 ± 0.0100
D(+)xylose, g/L1.10 ± 0.10.80 ± 0.020.02 ± 0.0100
D(+)mannose, g/L0.1 ± 0.020.05 ± 0.01000
D(+)galactose, g/L00000
L(+)arabinose, g/L00000
D(+)cellobiose, g/L0.23 ± 0.030.15 ± 0.02000
NA = not applicable.
Table 4. Composition of the produced biogas (mean ± standard deviation) in different modes of methanation of ethanol stillage and vinasse.
WastewaterComposition of BiogasDirect MethanationMethanation After MSRMethanation After MSR in AD-MEC
StillageCH4,%71.6 ± 491.8 ± 293.4 ± 1.5
CO2,%26.6 ± 2.46.9 ± 1.64.5 ± 0.4
H2S, ppm962 ± 3703 ± 32.1 ± 2
H2,%1.6 ± 1.61.4 ± 0.52.1 ± 1.2
VinasseCH4,%75.4 ± 290.8 ± 193.6 ± 3
CO2,%20.6 ± 47.3 ± 1.13.9 ± 1.5
H2S, ppm463 ± 2054.8 ± 2.52.6 ± 2.5
H2,%2.6 ± 1.21.1 ± 0.91.6 ± 0.5
Disclaimer/Publisher’s Note: The statements, opinions and data contained in all publications are solely those of the individual author(s) and contributor(s) and not of MDPI and/or the editor(s). MDPI and/or the editor(s) disclaim responsibility for any injury to people or property resulting from any ideas, methods, instructions or products referred to in the content.