Abstract
This paper aims to present the phenotypic characteristics, such as length, width, circular diameter, volume, surface area to cross-sectional area ratio, surface uniformity, and surface texture, of the foodborne pathogens Salmonella enterica serovar Agona, Salmonella enterica serovar Enteritidis, Listeria monocytogenes, and Campylobacter jejuni. It is a novel “field-guide” presentation of the observable morphological characteristics of these four species in the form of a Dichotomous Key. Phenotypic values of the pathogens were measured using a high-accuracy, nano-level-resolution 3D laser confocal scanning microscope. All samples were fixed with glutaraldehyde and stained with methylene blue, ensuring morphological preservation. The images of the pathogens were captured under various imaging modes, including 3D, laser, and transmission electron microscopy resolutions. Results show that these pathogens exhibit distinct morphological and surface properties, with Campylobacter jejuni showing unique features. The dichotomous key shows a simplified way of classifying selected foodborne pathogens from their morphometric properties. The morphometric measurements, in many instances first reported in the literature, and images provide a readily observable way to identify and classify microorganisms, allowing researchers to potentially study evolutionary relationships, assess species diversity, and understand how organisms interact with their environment, especially when genetic information is limited or difficult to obtain.
Keywords:
foodborne; pathogens; phenotypes; length; width; surface texture; surface roughness; bacteria; TEM; 3D laser confocal microscopy 1. Introduction
Foodborne illnesses remain a pervasive public health issue, with the Centers for Disease Control and Prevention (CDC) estimating approximately 48 million cases annually in the United States, resulting in 128,000 hospitalizations and 3000 deaths [1]. Globally, the World Health Organization reports that foodborne diseases cause approximately 600 million illnesses and 420,000 deaths each year [2]. Among the most common culprits are Salmonella, Listeria, and Campylobacter, which have been linked to outbreaks in fresh produce, poultry, and dairy products [3]. These pathogens are increasingly studied due to their adaptability to food environments and resistance to control measures [4]. Phenotypic profiles of bacteria are important for identifying and classifying bacterial species, assessing their potential pathogenicity, and studying their adaptability to different environments, thereby enabling the for monitoring their behavior in diverse situations.
Recent studies suggest that certain phenotypic traits, such as surface roughness, cell size, and structural uniformity, can indicate a pathogen’s ability to form biofilms, resist antimicrobials, or evade host immune defenses [5]. For instance, rough surface textures in fungus, such as Candida albicans, have been linked to increased biofilm formation, a known virulence factor that enhances persistence in food processing environments [6,7]. Additionally, the ability of Salmonella to modify its cell surface under stressful conditions has been shown to enhance its survival in acidic environments, such as the stomach, thereby facilitating host colonization [8]. Thus, this paper presents phenotypic measurements and images of the foodborne pathogens Salmonella enterica serovar Agona, Salmonella enterica serovar Enteritidis, Listeria monocytogenes, and Campylobacter jejuni. The phenotypic profiles will enhance the scientific understanding of these pathogens and support the development of targeted mitigation strategies, especially given the increasing burden of foodborne illness and the need for improved surveillance and intervention tools.
2. Materials and Methods
2.1. Instrumentations
Advanced imaging techniques were used, such as transmission electron microscope (TEM, JEM-1400 Flash, Jeol, Nieuw-Vennep, Tokyo, Japan, in the Center for Advanced Microscopy, Michigan State University) and 3D laser scanning confocal microscope (3D-LSCM, Keyence VK-X1000, Itasca, IL, USA, in the Nano-Biosensors Lab, Michigan State University). In addition to 3D imaging, several parameters were measured: length (L, µm), width (W, µm), circular diameter (CD, µm), surface area to cross-sectional area ratio (SA/CSA, unitless), volume (V, µm3), surface uniformity ratio (Str), and surface texture ratio (Sdr).
2.2. Sample Preparation for 3D Measurements and Imaging
The bacterial samples were prepared using a standard glutaraldehyde fixation protocol. Briefly, Salmonella and Listeria cultures were grown on selective media agar (CHROMagarTM Salmonella and CHROMagarTM Listeria, respectively) and then isolated to grow in Tryptic Soy Broth overnight at 37 °C in a shaking incubator. Campylobacter jejuni was plated on Tryptic Soy Agar (TSA) and incubated in a microaerophilic chamber at 42 °C for 18–24 h. The microaerophilic growth conditions were set up using a 0.4 L rectangular jar equipped with one sachet of Pouch-Micro Aero microaerophilic gas-generating system (Mitsubishi Gas Chemical America, Inc., New York, NY, USA). The bacterial mat that formed on the plate was collected using a sterile inoculation loop and resuspended in 1 mL PBS. Following incubation, Salmonella, Campylobacter, and Listeria cells were recovered by removing 1 mL of the Tryptic Soy Broth (McFarland = 2; ~6.0 × 10⁸ colony forming units/mL [CFU/mL]) and centrifuging at 6000× g for 3 min. The supernatant was then discarded. Then, cells were washed twice with 0.1 M cacodylate buffer and fixed with 5% glutaraldehyde for one hour and then washed an additional two times for 10 min with 0.1 M cacodylate buffer to prepare them for visualization while preserving their morphological structure [6]. After fixation, the samples were plated on a 1 mm thick microscope slide and stained with Loeffler’s methylene blue for 10 min to enhance contrast for imaging [6]. A total of 160 bacterial cells were measured from two cultures for each bacterial species.
2.3. Sample Preparation for Transmission Electron Microscope (TEM) Imaging
Sample preparation for TEM imaging was performed similarly to the preparation for 3D-LSCM imaging. Following sample preparation, a 10 µL aliquot of the resuspended fixed cells was placed in formvar-coated copper grids and incubated for 10 min. The grids were carefully blot-dried and stained with 0.1% uranyl acetate solution. Cells were then viewed in the TEM.
2.4. Sample Measurement
The 3D-LSCM was used to measure morphological parameters in 160 cells per bacterial species. Statistical analysis was conducted using the One-Way ANOVA test using Microsoft Excel [9].
2.5. Statistical Analysis
The one-way analysis of variance (ANOVA) test was performed at a 5% confidence level to determine if the bacterial sample means were statistically different from one another. Since the dichotomous classification occurred in a cascading fashion, the one-way ANOVA test was conducted at every cascade. The statistical results are presented in Figure 1.
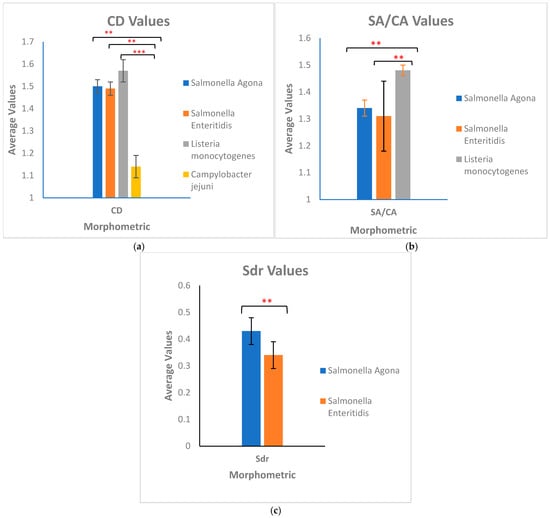
Figure 1.
Results of statistical analysis. The graphs show the differences between morphometrics used to classify the bacteria. The error bars represent the variance in Table 1. *** indicates high significance p < 0.001, ** indicates moderate significance p < 0.01. (a) p-values from left to right are 2.2 × 10⁻¹⁶, 2.2 × 10⁻¹⁶, and 2.2 × 10⁻¹⁶, respectively. (b) p-values from left to right are 5.5 × 10⁻¹¹ and 5.6 × 10⁻¹⁶, respectively. (c) p-value is 5.3 × 10⁻¹⁴.
2.6. Morphometrics
Data collected from the 3D-LSCM included feret horizontal (µm), feret vertical (µm), volume (V, µm3), circular diameter (CD, µm), surface area to cross-sectional area ratio (SA/CA, unitless), surface uniformity ratio (Str), and surface texture ratio (Sdr). Str represents uniformity of the surface, where a surface with a uniform texture has a value close to 0, while a surface with a non-uniform texture has a value close to 1. Sdr is the percentage of additional surface area contributed by the texture compared to the planar area. The Sdr value of a completely level surface is 0, while a surface with slopes has a higher Sdr value [10]. Length was calculated as the maximum of the feret data (horizontal or vertical). Width was calculated as one-half of the circular diameter. The 3D-LSCM also collected 3D images of the bacteria.
3. Results and Field Guide Dichotomous Classification
Data presented in Table 1 show that C. jejuni has the most non-uniform surface (Str), followed by the two Salmonella strains and L. monocytogenes. The surface of L. monocytogenes has the most slopes (Sdr), followed by C. jejuni and the two Salmonella strains. C. jejuni has the smallest volume, followed by S. Agona, L. monocytogenes, and S. Enteritidis. C. jejuni has the smallest width, shortest length, and smallest circular diameter. Figure 2 presents the dichotomous key for classifying the four pathogens as a field guide. The TEM images in Figure 2 show that C. jejuni is helical- or spiral-shaped, with one polar flagellum on both ends. L. monocytogenes, S. Agona, and S. Enteritidis are rod-shaped. Both S. Agona and S. Enteritidis are highly flagellated. The first step in the dichotomous classification was based on the shape observed from the TEM images of the four bacterial species: either spiral or rod. Figure 1 shows that C. jejuni has a spiral shape, while L. monocytogenes and the two Salmonella strains are rod-shaped. In Table 1, the average CD of C. jejuni is 1.14 (column 5), which confirms its uniqueness from the other three bacteria. The second step used the SA/CA values to differentiate the three rod-shaped bacteria. L. monocytogenes has an average SA/CA of 1.48 (column 4), differentiating it from the two Salmonella species. The third step used Sdr values, where S. Agona has an average Sdr of 0.43 (column 1), while the average Sdr of S. Enteritidis is 0.34.

Table 1.
Average morphometric values of Salmonella enterica serovar Agona, Salmonella enterica serovar Enteritidis, Listeria monocytogenes, and Campylobacter jejuni.
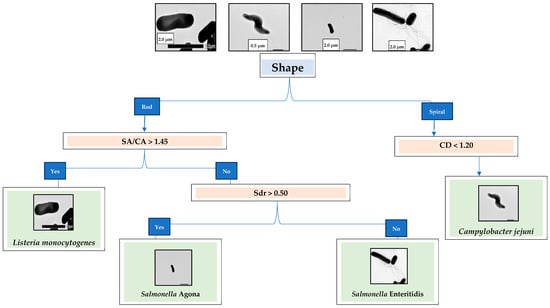
Figure 2.
Dichotomous key for classifying Salmonella enterica serovar Agona, Salmonella enterica serovar Enteritidis, Listeria monocytogenes, and Campylobacter jejuni.
Figure 3, Figure 4, Figure 5 and Figure 6 show the TEM and 3D images of the four bacteria, as a singular cell, interacting cells, and aggregate cells. The images confirm that the morphometric properties are differentiable from one another.
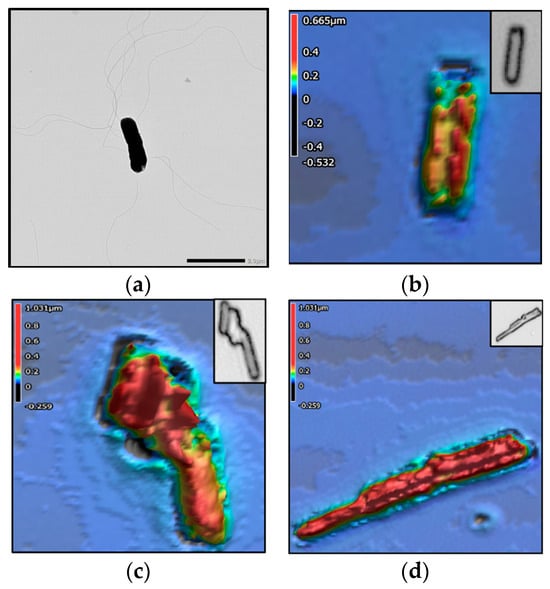
Figure 3.
Salmonella enterica serovar Agona. The colors in the 3D images represent height values (µm) stated in the scale on the left-hand side of each image. (a) TEM image; 3D images of (b) singular cell, (c) 3 interacting cells, and (d) aggregate of 2–3 cells.
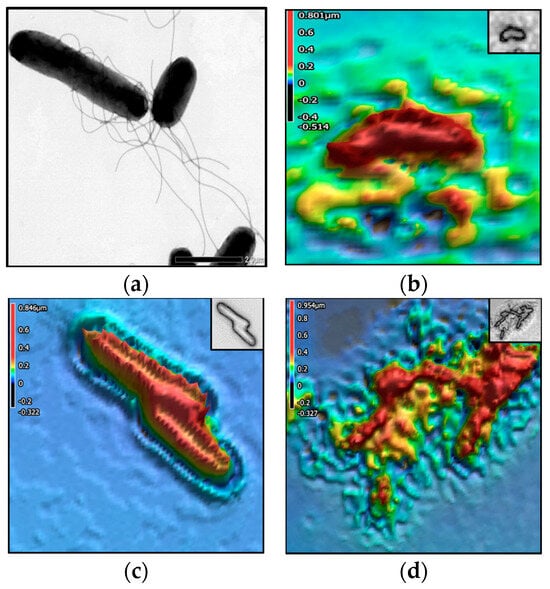
Figure 4.
Salmonella enterica serovar Enteritidis. The colors in the 3D images represent height values (µm) stated in the scale on the left-hand side of each image. (a) TEM image; 3D images of (b) singular cell, (c) 3 interacting cells, and (d) aggregate of 2–3 cells.
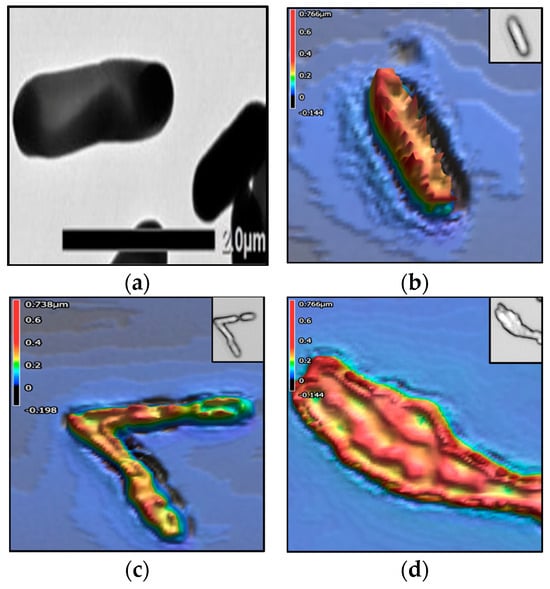
Figure 5.
Listeria monocytogenes. The colors in the 3D images represent height values (µm) stated in the scale on the left-hand side of each image. (a) TEM image; 3D images of (b) singular cell, (c) 3 interacting cells, and (d) aggregate of 2–3 cells.
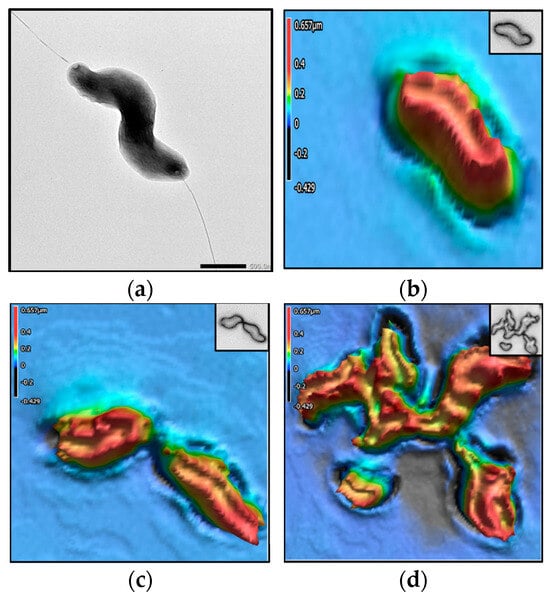
Figure 6.
Campylobacter jejuni. The colors in the 3D images represent height values (µm) stated in the scale on the left-hand side of each image. (a) TEM image; 3D images of (b) singular cell, (c) 3 interacting cells, and (d) aggregate of 2–3 cells.
4. Conclusions
This paper presents a novel first-in-class bacterial morphometrics field guide for the phenotypic profiling of key foodborne pathogens, including Salmonella enterica serovar Agona, Salmonella enterica serovar Enteritidis, Listeria monocytogenes, and Campylobacter jejuni. The dichotomous key system provides a simple method of classifying these bacteria based on their morphological phenotypic characteristics. The measurements and images provide a readily observable way to identify and classify microorganisms, allowing researchers to potentially study evolutionary relationships, assess species diversity, and understand how organisms interact with their environment, especially when genetic information is limited or difficult to obtain. They offer a visible representation of an organism’s genetic makeup and its adaptation to its surroundings. Morphological traits can be observed directly using visual cues like size, shape, and structure, making them accessible for field studies and initial species identification.
Author Contributions
Conceptualization, L.A.H., A.J.F., K.K. and E.C.A.; methodology, L.A.H., A.J.F. and K.K.; software, L.A.H.; validation, L.A.H., A.J.F. and K.K.; formal analysis, L.A.H. and E.C.A.; data curation, L.A.H.; writing—original draft preparation, L.A.H.; writing—review and editing, L.A.H., K.K., A.J.F. and E.C.A.; supervision, E.C.A.; project administration, E.C.A.; funding acquisition, EA. In addition, L.A.H. performed all measurements using the Keyence 3D Laser Confocal Scanning VK-X1000 Microscope, while A.J.F. and K.K. conducted all TEM imaging. All authors have read and agreed to the published version of the manuscript.
Funding
Research related to this article was supported by the USDA Hatch MICL 02782, USDA Hatch Multistate NC1194 MICL 04233 (RA101064), and USDA-NIFA project 2022-67017-36982.
Institutional Review Board Statement
Not applicable.
Data Availability Statement
The raw data supporting the conclusions of this article will be made available by the corresponding author on request.
Acknowledgments
We thank Alicia Withrow for assisting with taking the TEM images.
Conflicts of Interest
The authors declare no conflicts of interest.
References
- Centers for Disease Control and Prevention (CDC). Estimates of Foodborne Illness in the United States. 2018. Available online: https://www.cdc.gov/foodborneburden/index.html (accessed on 1 December 2024).
- World Health Organization (WHO). WHO Estimates of the Global Burden of Foodborne Diseases. 2015. Available online: https://www.who.int/publications/i/item/9789241565165 (accessed on 27 November 2024).
- Scallan, E.; Hoekstra, R.M.; Angulo, F.J.; Tauxe, R.V.; Widdowson, M.A.; Roy, S.L.; Jones, J.L.; Griffin, P.M. Foodborne illness acquired in the United States—Major pathogens. Emerg. Infect. Dis. 2011, 17, 7–15. [Google Scholar] [CrossRef] [PubMed]
- Gould, L.H.; Walsh, K.A.; Vieira, A.R.; Herman, K.; Williams, I.T.; Hall, A.J.; Cole, D. Surveillance for foodborne disease outbreaks—United States, 1998–2008. Morb. Mortal. Wkly. Rep. 2013, 62, 1–34. Available online: https://www.cdc.gov/mmwr/preview/mmwrhtml/ss6202a1.htm (accessed on 12 December 2024).
- Bridier, A.; Sanchez-Vizuete, P.; Guilbaud, M.; Piard, J.C.; Naïtali, M.; Briandet, R. Biofilm-associated persistence of food-borne pathogens. Food Microbiol. 2015, 45, 167–178. [Google Scholar] [CrossRef] [PubMed]
- Dassanayake, R.P.; Falkenberg, S.M.; Stasko, J.A.; Shircliff, A.L.; Lippolis, J.D.; Briggs, R.E. Identification of a reliable fixative solution to preserve the complex architecture of bacterial biofilms for scanning electron microscopy evaluation. PLoS ONE 2020, 15, e0233973. [Google Scholar] [CrossRef]
- Le, P.H.; Nguyen, D.H.; Aburto-Medina, A.; Linklater, D.P.; Crawford, R.J.; MacLaughlin, S.; Ivanova, E.P. Nanoscale surface roughness influences Candida albicans biofilm formation. ACS Appl. Bio Mater. 2020, 3, 8581–8591. [Google Scholar] [CrossRef] [PubMed]
- Gahan, C.G.; Hill, C. The relationship between acid stress responses and virulence in Salmonella typhimurium and Listeria monocytogenes. Int. J. Food Microbiol. 1999, 50, 93–100. [Google Scholar] [CrossRef] [PubMed]
- Rayat, C.S.; Rayat, C.S. Applications of Microsoft Excel in statistical methods. In Applications of Microsoft Excel in Statistical Methods; Springer: Singapore, 2018; pp. 139–146. [Google Scholar]
- KEYENCE International Belgium. (n.d.). Area roughness parameters. Str (Texture aspect ratio)|Area Roughness Parameters|Surface Roughness Parameters in ISO 25178|List of Parameters Useful for Design/Inspection Other than Sa and Sz|Solving the Questions About Profile and Surface Roughness Measurements! Introduction to “Roughness”. Available online: https://www.keyence.eu/ss/products/microscope/roughness/surface/tab02_b.jsp#:~:text=This%20parameter%20expresses%20the%20isotropy,does%20not%20depend%20on%20directions (accessed on 12 December 2024).
Disclaimer/Publisher’s Note: The statements, opinions and data contained in all publications are solely those of the individual author(s) and contributor(s) and not of MDPI and/or the editor(s). MDPI and/or the editor(s) disclaim responsibility for any injury to people or property resulting from any ideas, methods, instructions or products referred to in the content. |
© 2025 by the authors. Licensee MDPI, Basel, Switzerland. This article is an open access article distributed under the terms and conditions of the Creative Commons Attribution (CC BY) license (https://creativecommons.org/licenses/by/4.0/).