Abstract
An Abramson-type oblique-incident interferometer was used for the surface-form measurement of hand-scraped marks consisting of rough surfaces. Although the Abramson interferometer could measure the rough surface of hand-scraped marks under noncontact conditions, the inconsistency in the measurement results was caused by the differences in the incident direction of the measuring light. This study investigated the inconsistency in the measurement results of the Abramson interferometer caused by the oblique incidence of the measuring light. The reproducibility of inconsistencies due to the difference in the incident direction of the measuring light was confirmed, and the relationship between the inconsistency of the measurement results and the incident angle of the measuring light was investigated. Consequently, it was confirmed that the inconsistency of the measurement results due to the difference in the incident direction of the measuring light could be reduced by decreasing the incident angle of the measuring light. To avoid the overcrowding of the interference fringes caused by the reduction in the incident angle of the measuring light, an oblique-incident interferometer with a near-infrared laser was constructed. The validity of the developed oblique-incident interferometer was evaluated by comparison with a commercially available contour measurement instrument. The surface form obtained by the developed oblique-incident interferometer was confirmed to be consistent with the envelope of the cross-sectional profile measured by the contour measurement instrument.
1. Introduction
Hand-scraping is a finishing process to create precision flat surfaces [1]. Hand-scraping can produce a broader range of precision flat surfaces than lapping or grinding; thus, it has been applied to large high-precision workpieces, such as the sliding parts of machine tools, surface plates of precision-measuring instruments, and the matching surface of precision parts [2,3]. Hand-scraping does not require the clamping of the workpiece; therefore, high machining accuracy can be achieved without deformation. As hand-scraping can produce a highly precise large flat surface without a machine tool, it should be reviewed from the perspective of energy conservation and Sustainable Development Goals. However, developing a high-precision flat surface by hand-scraping requires skilled workmanship, and it takes a long time to acquire hand-scraping skills [4]. One reason for the difficulty in acquiring hand-scraping skills is the qualitative evaluation of scraped surfaces. In the general inspection method, the finish condition of a hand-scraped surface is evaluated based on the transfer of pigments, such as Prussian blue, coated onto the workpiece surface upon contact with the standard surface plate. Although this method can qualitatively detect convex positions on a workpiece, it cannot quantitatively estimate the height of a convex position or the fine shapes of the hand-scraped marks. Several previous studies on scraping automation proposed evaluation methods based on the observation of pigment transfer on scraped surfaces [2,5]. These methods can efficiently identify areas to be scraped by automatically determining the pigment transfer, which is visually performed by skilled technicians. However, quantitatively determining the height or surface form of scraping marks using finish evaluation methods based on pigment transfer detection is challenging. Surface profilers, or surface roughness testers, that employ tactile probes can measure the profile of hand-scraped marks consisting of a rough surface. However, measurements based on tactile probes are time-consuming because they are line measurements.
Optical measurement methods facilitate noncontact surface measurements of rough surfaces within a short duration. The measured light tended to scatter on the hand-scraped marks because of the rough surface. Optical probe methods are effective approaches for minimizing the influence of scattered light owing to rough surfaces. An evaluation system for scraping a surface using a computer numerical control machine tool and laser triangulation sensor was proposed [6]. An optical probe using a DVD pickup was developed for the rapid measurement of scraped surfaces [7]. Although these methods can measure the profiles of rough surfaces, they are time-consuming because they require individual measurements at each point. The fringe projection techniques project a pattern onto a workpiece using a laser or LED light source and observe the pattern reflected from the workpiece surface [8]. This can measure the three-dimensional form of the workpiece in a short time under noncontact conditions.
Interferometric measurement methods are effective for the rapid measurement of the surface forms. These methods allow for highly accurate measurements because they calculate the surface form based on a highly accurate reference surface and light wavelength. However, when a typical commercially available vertical incident interferometer is used, unmeasurable regions are observed during hand-scraped mark measurements owing to the scattering of the measuring light [9]. Therefore, the ingenuity of the optical system is crucial during the measurement of rough surfaces because the intensity and contrast of the interference fringes decrease. A digital signal-processing algorithm was used to analyze interference fringes to achieve fast, accurate, and repeatable three-dimensional measurements of rough surface profiles [10]. Other methods based on heterodyne interferometry have also been developed to measure the surface profile of speckle fields [11]. Although these methods can effectively measure rough-surface forms, they require specialized signal-processing algorithms and complex optical systems.
An oblique-incident interferometer based on Abramson interferometry [12] can measure the surface form using a simple optical system because a single right-angle prism acts as both a beam splitter and reference surface in the interferometer. In addition, because the oblique-incident interferometer is less susceptible to the influence of the measured light scattering, a sufficiently reflected light intensity can be obtained to generate interference fringes, even on a rough surface. Consequently, the oblique-incident interferometer enables three-dimensional surface-form measurements of hand-scraped marks [9,13]. However, inconsistencies in the surface-form measurement results due to differences in the incident direction of the measuring light were observed in the oblique-incident interferometer [9]. The reason for this inconsistency has not been experimentally elucidated. If the inconsistency in the measurement results is caused by an oblique-incident light, it may change by changing the incident angle of the measuring light. However, as explained in Section 2, when the incident angle of the measuring light decreases, the interval between the interference fringes decreases. Therefore, it is challenging to capture interference fringes using an imaging sensor, and the surface form cannot be calculated based on the interference fringes. Consequently, it is difficult for the oblique-incident interferometer used in previous studies [9,13] to reduce the incident angle of the measuring light for measuring the surface form of hand-scraped marks.
In this study, the light source of the oblique-incident interferometer was changed to a near-infrared laser, which was a longer wavelength than that in previous studies, to expand the interval of the interference fringes. Consequently, the incident angle of the measuring light could be reduced without the overcrowding of the interference fringes. This study investigated inconsistencies in the surface-form measurement results, which were obtained by the oblique-incident interferometer, by changing the incident direction and angle of the measuring light. The surface form of the same hand-scraped marks was measured by changing the incident direction and angle of the measuring light to evaluate the relationship between the inconsistency in the surface-form measurement results and the incident angle of the measuring light. The measurement position on each surface was identified using pattern matching, and the inconsistency in the measurement results was evaluated based on the cross-sectional profiles of the hand-scraped mark at the same measurement position. The inconsistency in the measurement results due to differences in the incident direction of the measuring light was investigated using the correlation coefficient and the difference between profiles acquired at the same incident angle of the measuring light. The validity of the measurement results obtained using the oblique-incident interferometer was evaluated based on comparisons with those of a commercially available optical noncontact contour profilometer.
2. Methods
Figure 1 shows the principle of Abramson interferometry used in this study [9,13]. Abramson interferometry is a type of oblique-incident interferometry that uses a right-angle prism (RAP). The B-C plane of the RAP was mounted to face the measured surface of the workpiece. A collimated laser beam was incident on the B-C plane of the RAP through the A-B plane. Part of the incident laser beam was reflected by the B-C plane and becomes the reference light for the interferometer. The other part of the incident laser beam was transmitted to the B-C plane and reflected onto the measured surface of the workpiece. The light incident on the measured surface of the workpiece is called measuring light. Angle θ, shown in Figure 1, indicates the incident angle of the measuring light with respect to the measured surface. When the measured light is reflected on the measured surface and incident on the B-C surface of the RAP, the reference and measured lights generate interference fringes on the B-C plane. Because the RAP can be used as a beam splitter and the reference surface of an interferometer, the Abramson interferometer enables the construction of a simple and compact interferometer. The distance between the measured surface and the B-C plane of the RAP, h, can be expressed by Equation (1):
where m is the order of the interference fringes and λ is the wavelength of the laser beam. Therefore, the relationship between the interference fringe sensitivity, S, and the incident angle of the measuring light, θ, can be expressed by Equation (2).
According to Equation (2), as the incident angle θ decreases, the interference fringe sensitivity S increases. Consequently, the fringe interval decreases with decreasing incident angle θ, resulting in an overcrowding of the interference fringes. When the interference fringe interval was smaller than the resolution of the imaging sensor, the interference fringes could not be captured. However, when the fringe sensitivity remained constant, the incident angle θ could be reduced by increasing the wavelength λ of the light source. Therefore, a laser light source with a longer wavelength can simultaneously decrease the incident angle of the measured light and increase the interval between interference fringes. In previous studies [9,13], a visible-light laser with a wavelength of 632.8 nm or 635 nm was used, and the incident angle of the measuring light was set from 77° to 78°. In this study, a near-infrared laser with a wavelength of 880 nm was used. When interference fringes with the same interval as those in previous studies were generated, the incident angle of the measured light could decrease to 73.2° using a near-infrared laser source. Consequently, the reduction in the interference fringe interval caused by the reduction in the incident angle θ can be avoided, and the overcrowding of the interference fringes can be prevented.
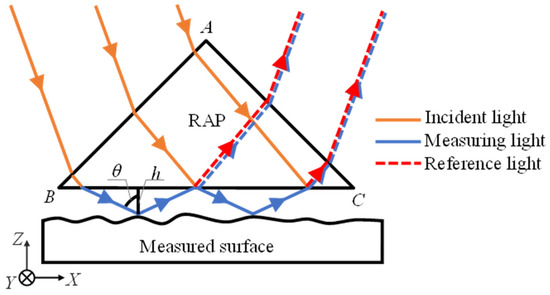
Figure 1.
Principle of Abramson interferometer.
In this experiment, the surface form was calculated from the interference fringe images using the same procedure as in previous studies [9,13] to eliminate the possibility that the surface form calculation algorithm may induce changes in the measurement results. The surface forms of the measured workpiece were calculated using phase-shifting interferometry for the interference fringe images. Phase-shifting of the interference fringes was conducted based on the displacement of the distance between the measured surface of the workpiece and the B-C surface of the RAP. A five-step phase-shifting method [14,15] was used to reduce the influence of displacement errors during phase-shifting. The phase distribution, , obtained by the five-step phase-shifting method, was convolved within the range of . Phase unwrapping was performed by applying the unweighted least-squares phase-unwrapping (ULSPU) method [16,17]. The ULSPU method can reduce the influence of phase singularity by minimizing the difference between the primary partial differential of the phase distribution before and after the phase connection. The surface form of the measured surface can be calculated by converting the unwrapped phase distribution, into the height of the measured surface. The relationship between the unwrapped phase distribution of the interference fringes and the height of the measured surface, h(x, y) can be expressed as follows:
3. Results
3.1. Experimental Methods
Figure 2 shows the configuration of the oblique-incident interferometer used in this study. A commercially available hand-scraped surface plate (OS-105, Ohnishi Sokutei, Higashiosaka, Japan) was used as the measurement surface. Multiple hand-scraped marks are present on the surface of the plate. The nominal flatness accuracy of the plate surface used in the study was 15 μm. A near-infrared laser with a wavelength of 880 nm (TCSQ2-08800010-4-CL, NEOARK, Hachioji, Japan) was used as the light source. The intensity of the laser light was adjusted using a neutral-density (ND) filter, and the laser beam was passed through a spatial filter (SF) consisting of a 40× objective lens and a 25 μm diameter pinhole. The laser beam was expanded into a collimated beam through the lens and incident on the A-B plane of the RAP (RPB-20-10H, SIGMA KOKI, Hidaka, Japan). The size of the B-C plane of the RAP was 40 mm × 56 mm, and the surface accuracy of the RAP was λ/10. The interference fringes generated on the B-C plane of the RAP were captured using an imaging sensor (EO1312LE, Edmund Optics, NJ, USA) through a tilt-shift camera lens (TS-E 90 mm F2.8L Macro, Canon, Tokyo, Japan). The number of pixels in the imaging sensor was 1280 × 1024. The tilt-shift camera lens facilitated the focusing of the entire area of the inclined plane because the B-C plane of the RAP and the imaging sensor satisfied the Scheimpflug principle. The size of the field of view captured by the imaging sensor was 18.1 mm × 11.7 mm; thus, the estimated lateral resolution of the interferometer was 14.1 μm × 11.4 μm. Phase-shifting of the interference fringes was achieved by moving the surface plate in the Z-direction using piezoelectric actuators (AE0203D08DF, MESS-TEK, Wako, Japan). Four piezoelectric actuators were placed under the plate on which the surface plate was mounted, expanded, and contracted in response to the driving signal from the piezoelectric drivers, controlled using a personal computer. A homemade PZT-driven Z axis positioning stage was mounted on a manual XY linear stage (LD-947-S1, Chuo Precision Industrial, Tokyo, Japan) and a manual Z axis rotation stage (KSPA-986M, SIGMA KOKI, Hidaka, Japan). The displacement of the piezoelectric actuator was monitored during the phase shift using a calibrated cantilever-type displacement sensor (TELEMICRO ESM-01, Ogasawara Precision Laboratory, Yamakita, Japan). The nominal resolution and accuracy of the displacement sensor are 10 nm and 75 nm, respectively. Red solid and dashed lines in Figure 2 indicate incident measuring light and interference light, respectively.
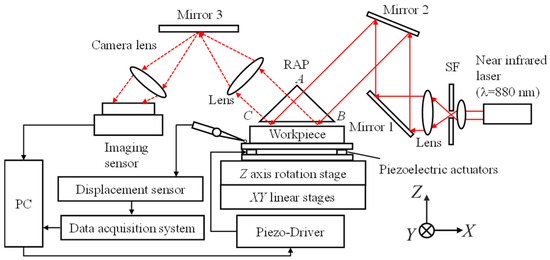
Figure 2.
Experimental configuration of oblique-incident interferometer.
The incident angle of the measuring light can be changed by adjusting the height along the Z-direction and the angle around the Y-axis of Mirror 2. Because the measured light was refracted at the A-B and B-C planes of the RAP, it was not easy to precisely calculate the incident angle θ from the incident angle of the laser beam to the A-B plane of the RAP. In addition, it was necessary to evaluate the Z-directional displacement of the measured surface corresponding to the phase-shifting of the interference fringe of π/2 rad for the use of the five-step phase-shifting method. In this experiment, the surface plate was displaced in the Z-direction using piezoelectric actuators, while the interference fringes generated on the smooth surface of the surface plate were observed using the imaging sensor. The phase of the interference fringes was shifted to 6π rad while the Z-directional displacement of the surface plate was measured using the displacement sensor. Based on Equations (1) and (2), the interval and sensitivity of the interference fringes change with the incident angle of the measuring light. The relationship between the Z-directional displacement of a certain point on the measured surface, Δh, and the incident angle of the measuring light, θ can be expressed by Equation (4).
Consequently, the incident angle of the measuring light θ can be calculated from the displacement Δh, which corresponds to the phase of the interference fringe of 2π. The incidence angle θ was calculated from the interference fringe phase-shifting on a smooth surface, which was the dark area shown in Figure 3a, and the displacement of the PZT-driven Z-stage.
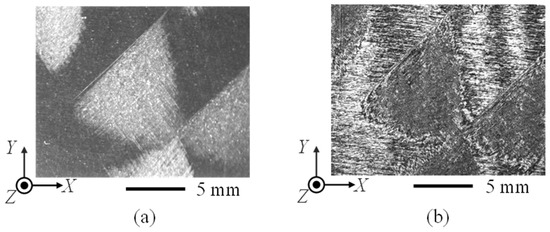
Figure 3.
Observation of the hand-scraped marks. (a) Hand-scraped marks observed under incoherent light. The dark area is a ground smooth surface. (b) Interference fringes on the hand-scraped marks.
3.2. Experimental Results and Discussions
The reproducibility of the surface-form measurements using the oblique-incident interferometer was investigated by measuring the same hand-scraped marks while changing the direction and angle of incidence of the measuring light. Figure 3 shows the hand-scraped marks observed using the developed oblique-incident interferometer. Figure 3a shows the hand-scraped marks observed under incoherent light. The hand-scraped marks appeared brighter than the smooth surface because the incident light was scattered on the rough surface created by hand-scraping. Figure 3b shows an example of interference fringes on a hand-scraped surface irradiated by a near-infrared laser. The incident angle of the measuring light was 76.0°. The incident direction of the measuring light was changed by rotating the surface plate by 180° around the Z-axis. Because the surface form of the hand-scraped marks was rotated around the Z-axis after the rotation of the surface plate, the surface form data were rotated around the Z-axis so that they were the same as before the rotation. The rotational alignment of the workpiece was adjusted to within 0.1° using the Z axis rotation stage and the images captured by the imaging sensor under incoherent light. The rotational error of the workpiece corresponded to an alignment error of ±1 pixel of at most.
Figure 4 shows the surface forms of the hand-scraped marks calculated from the interference fringes generated when the incident angle of the measured light was set to approximately 77°. The incident angle of the measured light was the maximum angle achievable with the constructed oblique-incident interferometer. At larger incident angles, it was difficult to illuminate the entire measurement surface because of the interference between the laser beam and optical components. The arrowheads in Figure 4 indicate the incident direction of the measured light. It can be observed that the hand-scraped marks are lower than the surrounding smooth surface. The incident angle of the measuring light and the Z-directional displacement per step of the phase-shifting shown in Figure 4a were set to 77.4° and 0.51 μm, respectively. Figure 4b shows the surface form of the same hand-scraped marks measured by changing the incident direction of the measuring light. In the case of measurement results presented in Figure 4b, the incident angle of the measuring light and the Z-directional displacement per one step of the phase-shifting were set to be 76.0° and 0.46 μm. Although Figure 4 shows the measurement results of the same hand-scraped marks, the right side of the hand-scraped mark in Figure 4a is slightly deeper. However, the left side of the hand-scraping mark is somewhat deeper, as shown in Figure 4b. Even when a near-infrared laser source was used, inconsistencies in the surface-form measurement results due to the incident direction of the measuring light were confirmed, as in a previous study [8].
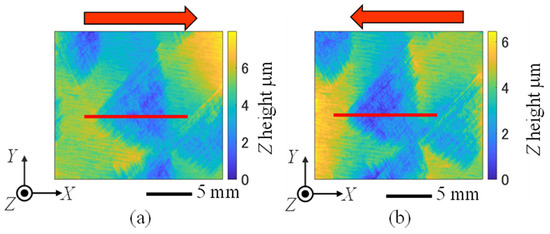
Figure 4.
Surface form obtained with incident angle of approximately 77°. (a) Incident angle of 77.4°. (b) Incident angle of 76.0°.
Figure 5 shows the surface forms of the hand-scraped marks measured at smaller incident angles of the measuring light. The incident angle of the measuring light was set to approximately 70°, which was the minimum incident angle in the oblique-incident interferometer used in this experiment. When the incident angle was smaller than 70°, phase-shifting of the interference fringes could not be detected because of the increase in the scattered light intensity on the rough surface of the hand-scraped marks. In addition to Figure 4, the arrowheads in Figure 5 indicate the direction of the incident light. In Figure 5a, the incident angle of the measuring light and the Z-directional displacement per step of the phase-shifting were set to 70.1° and 0.32 μm, respectively. Similarly, in Figure 5b, the incident angle of the measuring light and the Z-directional displacement per step of the phase-shifting were set to 70.5° and 0.33 μm, respectively.
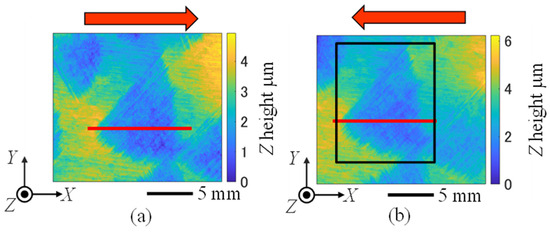
Figure 5.
Surface form obtained with incident angle of approximately 70°. (a) Incident angle of 70.1°. (b) Incident angle of 70.5°.
To investigate the effects of the incident angles of the measuring light, the cross-sectional profiles of the same position on the hand-scraped marks were compared. The measurement position on each surface form was identified pixel-by-pixel by pattern matching, using the area surrounded by the black frame indicated in Figure 5b as a template. As for the pattern matching, the method from previous research shown in Reference 13 was applied. Template matching using the normxcorr2 function in MATLAB 2023a was used. The template area was set to include the entire the hand-scraped mark near the center of Figure 3a because it includes the lowest position of the hand-scraped mark. The red lines in Figure 4 and Figure 5 represent the same positions on the same hand-scraped mark identified by pattern matching. Figure 6 shows the cross-sectional profiles represented by the red lines in Figure 4 and Figure 5. The number of measurement points for each profile was 786. The correlation coefficients between the template of the pattern matching and identified locations extracted from Figure 4a,b were evaluated as 0.80 and 0.77, respectively. Similarly, the correlation coefficient between the template location and the identified location extracted from Figure 5a was 0.94. The correlation coefficients were larger than 0.7, and each location indicated a strong correlation with the template of pattern matching. Therefore, the profiles shown in Figure 6 are considered to be at the same position on the surface plate. As shown in Figure 6a, when the incident angle of the measured light was approximately 77°, a significant difference in the cross-sectional profiles was observed. The correlation coefficient between the two profiles, shown in Figure 6a, was estimated to be 0.78. However, when the incident angle of the measuring light was approximately 70°, the two profiles shown in Figure 6b exhibited good agreement. The correlation coefficient between the two profiles, shown in Figure 6b, was estimated to be 0.96. Figure 7 shows the absolute values of the differences between the two cross-sectional profiles shown in Figure 6a,b. The green plots in Figure 7 indicate the difference in the cross-sectional profiles when the incident angle of the measuring light is approximately 77°, and the average and the maximum difference are 0.71 μm and 1.91 μm, respectively. In contrast, the yellow plots in Figure 7 represent the difference between the cross-sectional profiles when the incident angle of the measuring light is approximately 70°, and the average and the maximum difference are 0.20 μm and 0.75 μm, respectively. It can be observed that the discrepancy in the measurement results due to the incidence direction is significantly reduced by decreasing the incidence angle of the measurement light.
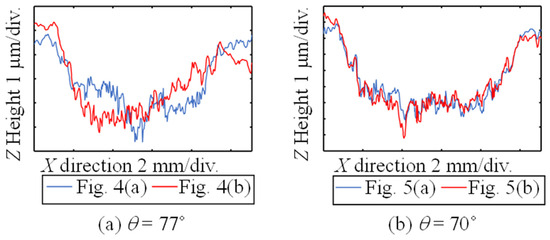
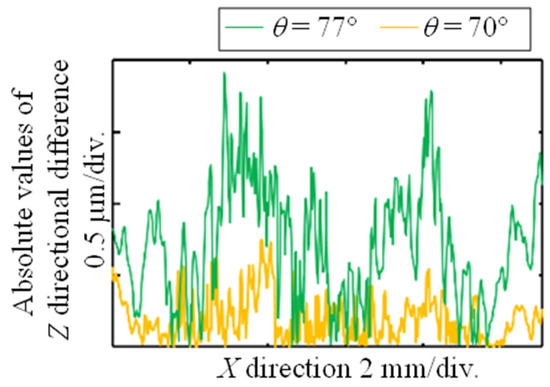
Figure 7.
Absolute values of the difference in the cross-sectional profiles shown in Figure 6.
The cross-sectional profile of the same hand-scraped mark was measured using a commercially available noncontact contour-measuring instrument (Mitaka Koki, NH-3s) to confirm the validity of the surface-form measurement using the developed oblique-incident interferometer. Figure 8 shows a comparison of the cross-sectional surface profiles. The orange line represents the average cross-sectional profile shown in Figure 6b, measured using the developed oblique-incident interferometer with an incident angle of 70°. The black line represents the surface profile obtained using NH-3s. The green line represents the peak envelope of the surface profile obtained by NH-3s. The envelope was calculated using the envelope function in MATLAB 2023a. The number of samples in the envelope calculation was set to 30, which is the condition where the difference between the envelope and the oblique incidence interferometer profile was the smallest. The surface form was measured using a point autofocus probe [18] with a 100× objective lens (numerical aperture: 0.80). The number of measurement points and measurement intervals of the NH-3s were set to 1108 and 10 μm, respectively. The measurement interval of the NH-3s was almost the same as the lateral resolution of the oblique-incident interferometer. The root-mean-square heights Pq of the surface profiles measured using the oblique-incident interferometer and NH-3s were 0.93 μm and 2.71 μm, respectively. The maximum difference between the cross-sectional profile obtained by the oblique-incident interferometer and the envelope was evaluated to be 3.6 μm. NH-3s could measure finer and deeper groove shapes on the hand-scraped surface than the oblique-incident interferometer. These differences are attributed to the difference in the lateral resolution and incident angle of the measuring light between the oblique-incident interferometer and the NH-3s. The lateral resolution of the oblique-incident interferometer was determined from the field of view of the oblique-incident interferometer and the number of pixels of the imaging sensor, which was determined to be 14.1 μm × 11.4 μm. The laser spot diameter of the NH-3s in this experiment was 1 μm, which corresponded to the lateral resolution of the NH-3s. Since the laser spot diameter of the NH-3s was smaller than the lateral resolution of the oblique-incident interferometer, it was possible to measure finer grooves on the hand-scraped marks. Furthermore, the incident angle of the measuring light of the NH-3s is 53°, which is smaller than that of the oblique-incident interferometer. Consequently, the measured light of the NH-3s can reach deeper into the grooves than the oblique-incidence interferometer, facilitating measurements inside the deep grooves. However, the cross-sectional profile obtained using the oblique incidence interferometer was almost the same as the envelope of the surface-shaped profile measured using the NH-3s. Therefore, it is assumed that the developed oblique-incident interferometer can adequately measure the surface of hand-scraped marks to a depth of several micrometers. It was confirmed that the inconsistencies in the measurement results of the surface form of the hand-scraped marks using the oblique-incident interferometer could be improved by reducing the incident angle of the measuring light. As shown in the measurement results using NH-3s in Figure 8, the hand-scraped marks are several μm deep, and their surfaces consist of steep undulations. In the surface-form measurement using the oblique-incident interferometer, it was assumed that the measurement results changed depending on the incident direction of the measuring light because part of the measuring light was blocked by depressions and steep undulations of the hand-scraped marks. It is believed that a reduction in the incident angle of the measuring light reduces the partial blocking of the measuring light near the surface, thereby improving the inconsistency in the measurement results.
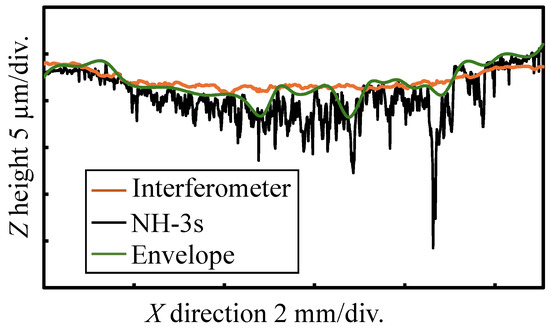
Figure 8.
Comparison of the cross-sectional profiles.
Although the horizontal resolution of the oblique-incident interferometer was inferior to that of the NH-3s used in this study, it had an advantage in terms of measurement time. NH-3s is a line measurement, and the measurement time for one line, as shown in Figure 8, is approximately 5 min. In contrast, the developed oblique-incidence interferometer is a surface measurement, and the measurement time for each surface form was shorter than 1 min. This is expected to achieve the rapid measurement of hand-scraped surfaces in the range of tens to hundreds of square millimeters.
The surface-form measurement using the oblique-incident interferometer consists in area scanning. In this method, discontinuities in the phase of the interference fringes make it difficult to calculate the surface form. On the other hand, since measurements are taken simultaneously in all measurement directions, errors due to drift, creep, and so on during the measurement are very small. The commercially available profiler (NH-3s) performs point scanning, which means that profiles can be obtained even if there are partially unmeasurable areas. The profile acquired in the probe scanning direction as shown in Figure 8 shows high measurement accuracy. However, the profile in the direction perpendicular to the probe scanning direction in two-dimensional measurement is significantly affected by measurement errors due to drift, creep, and so on. Therefore, the proposed method using the oblique-incident interferometer is expected to be effective for the wide-area scan measurement of hand-scraped surfaces. Furthermore, the developed oblique-incident interferometer may be applicable to other rough surfaces as long as the intensity of the specular reflected light is sufficient to detect the interference fringes.
On the other hand, although this study qualitatively clarified the inconsistencies in the measurement results of the oblique-incident interferometer, it has not yet elucidated the cause. In particular, the quantitative relationship between the measurement accuracy and the angle of incidence of the measurement light, surface roughness, shape, and so on has not yet been clarified. In order to analyze these phenomena, the introduction of ray-tracking simulations is planned as a future direction of this study. The reflection of the measuring light on the microtopography of the workpiece surface or phase difference with the reference light will be simulated, and the relationship between the incident angle of the measuring light, the workpiece surface microtopography, and the interference fringe phase distribution will be clarified.
4. Conclusions
This study investigated the inconsistency in the surface-form measurement results, which were obtained by the Abramson-type oblique-incident interferometer, by changing the incident direction and angle of the measuring light. An oblique-incident interferometer with a near-infrared laser was developed to expand the interval of the interference fringes. The expansion of the interference fringe interval prevented the overcrowding of the interference fringes on the rough surface by hand-scraping and enabled a reduction in the angle of incident angle of the measuring light. The inconsistency in the measurement results due to the difference in the incident direction of the measuring light was also confirmed by the measurement using the oblique-incident interferometer with a near-infrared laser. Therefore, it was confirmed that the cause of the inconsistency was the oblique incidence of the measuring light. The relationship between the incident angle of the measuring light of the oblique-incident interferometer and the inconsistency in the measurement results of the hand-scraping surface form was investigated. The forms of the same hand-scraped surface were measured at the maximum and minimum incident angles of the measuring light, which could be realized using the developed oblique-incident interferometer. It was confirmed that the inconsistency in the measurement results due to the incident direction of the measuring light could be improved by reducing the incident angle of the measuring light. The validity of the measurement results obtained using the oblique-incident interferometer was evaluated by comparison with the results obtained using a commercially available noncontact contour measurement instrument. The cross-sectional profile of the surface form measured by the oblique-incident interferometer was in agreement with the envelope of the contour form measured by the noncontact contour measurement instrument, confirming the validity of the oblique-incident interferometer.
The method proposed in this study enables the area scanning of rough surface forms in a short time. Attempts to expand the measurement range of oblique incidence interferometers by stitching surface profile data have already been reported [13]. The oblique incidence interferometer developed in this study may be applicable to other rough surface profile measurements, especially for on-machine or in-process measurements, and is expected to be applied to quality control and automated measurements.
Author Contributions
Conceptualization, S.I. and K.K.; methodology, S.I. and T.Y.; software, T.Y.; validation, S.I. and T.Y.; investigation, T.Y.; resources, K.M.; writing—original draft preparation, S.I.; writing—review and editing, S.I.; visualization, T.Y.; project administration, S.I.; funding acquisition, S.I. All authors have read and agreed to the published version of the manuscript.
Funding
This research was supported by the Japan Society for the Promotion of Science (JSPS), KAKENHI (Grant Number: 23K03606).
Data Availability Statement
Data is contained within the article.
Conflicts of Interest
The authors declare no conflicts of interest.
References
- Moore, W.R. Foundations of Mechanical Accuracy; The Moore Tool Company: Bridgeport, CT, USA, 1970; pp. 16–90. ISBN 9780262130806. [Google Scholar]
- Oßwald, K.; Lochmahr, I.; Bagci, Y.; Saile, P. Investigation into hand scraping: A microanalysis. J. Manuf. Mater. Process. 2018, 2, 76. [Google Scholar] [CrossRef]
- Tsutsumi, H.; Kyusojin, A.; Fukuda, K. Tribology characteristics estimation of slide-way surfaces finished by scraping. Trans. JSME Ser. C 2006, 72, 3009–3015. [Google Scholar] [CrossRef]
- Ito, Y. Thought-Evoking Approaches in Engineering Problems; Springer: Berlin/Heidelberg, Germany, 2014; pp. 277–295. ISBN 3319041193. [Google Scholar]
- Tsutsumi, H.; Yamada, R.; Kyusojin, A.; Nakamura, T. Development of an Automatic Scraping Machine with Recognition for Bearing of Scraped Surfaces (3rd report). J. Jpn. Soc. Precis. Eng. 2005, 71, 358–362. [Google Scholar] [CrossRef][Green Version]
- Hsieh, T.H.; Jywe, W.Y.; Huang, H.L.; Chen, S.L. Development of a laser-based measurement system for evaluation of the scraping workpiece quality. Opt. Lasers Eng. 2011, 49, 1045–1053. [Google Scholar] [CrossRef]
- Fan, K.C.; Torng, J.; Jywe, W.; Chou, R.C.; Ye, J.K. 3-D measurement and evaluation of surface texture produced by scraping process. Measurement 2012, 45, 384–392. [Google Scholar] [CrossRef]
- Feng, X.; Du, Z.; Yang, J. Non-scanning techniques. In Advanced in Optical Surface Texture Metrology; Leach, R., Ed.; IOP ebooks: Bristol, UK, 2020; pp. 5-1–5-22. ISBN 978-0-7503-2526-4. [Google Scholar]
- Caber, P.J. Interferometric profiler for rough surfaces. Appl. Opt. 1993, 32, 3438–3441. [Google Scholar] [CrossRef] [PubMed]
- Fercher, A.F.; Hu, H.Z.; Vry, U. Rough surface interferometry with a two-wavelength heterodyne speckle interferometer. Appl. Opt. 1985, 24, 2181. [Google Scholar] [CrossRef] [PubMed]
- Ito, S.; Kameoka, D.; Matsumoto, K.; Kamiya, K. Design and development of oblique-incident interferometer for form measurement of hand-scraped surfaces. Nanomanuf. Metrol. 2021, 4, 69–76. [Google Scholar] [CrossRef]
- Abramson, N. The interferoscope: A new type of interferometer with variable fringe separation. Optik 1969, 30, 56–71. [Google Scholar]
- Aruga, M.; Ito, S.; Tsugawa, F.; Matsumoto, K.; Kamiya, K. Expansion of measurement area of hand-scraped surface using stitching method for oblique-incident interferometer. J. Adv. Mech. Des. Syst. Manuf. 2023, 17, JAMDSM0010. [Google Scholar] [CrossRef]
- Hariharan, P.; Roy, M. A geometric-phase interferometer. J. Mod. Opt. 1992, 39, 1811–1815. [Google Scholar] [CrossRef]
- Malacara, M. Optical Shop Testing. In Wiley Series in Pure and Applied Optics; Wiley: Hoboken, NJ, USA, 2007; ISBN 9780471484042. [Google Scholar]
- Ghiglia, D.C.; Romero, L.A. Robust two-dimensional weighted and unweighted phase unwrapping that uses fast transforms and iterative methods. J. Opt. Soc. Am. A 1994, 11, 107–111. [Google Scholar] [CrossRef]
- Ghiglia, D.C.; Pritt, M.D. Two-Dimensional Phase Unwrapping, Theory, Algorithms, and Software; Wiley: Hoboken, NJ, USA, 1998; pp. 188–190. ISBN 9780471249351. [Google Scholar]
- ISO 25178-605:2025; Geometrical Product Specifications (GPS)—Surface Texture: Areal. Nominal Characteristics Non-Contact (Point Autofocus Probe) Instruments. International Organization for Standardization: Geneva, Switzerland, 2025; p. 605.


Disclaimer/Publisher’s Note: The statements, opinions and data contained in all publications are solely those of the individual author(s) and contributor(s) and not of MDPI and/or the editor(s). MDPI and/or the editor(s) disclaim responsibility for any injury to people or property resulting from any ideas, methods, instructions or products referred to in the content. |
© 2025 by the authors. Licensee MDPI, Basel, Switzerland. This article is an open access article distributed under the terms and conditions of the Creative Commons Attribution (CC BY) license (https://creativecommons.org/licenses/by/4.0/).