1. Introduction
Smart textiles have emerged as a promising platform for medical applications, offering the potential for continuous and non-invasive health monitoring [
1]. These textiles, embedded with advanced technologies like organic electrochemical transistors (OECTs), provide a bridge between electronic devices and the human body. The integration of smart textiles in medical wearables enables real-time data collection, fostering improved patient comfort and more effective disease management, particularly in conditions like diabetes.
Diabetes has become one of the major public health challenges around the world, with the number of affected individuals increasing steadily. Diabetic patients show defects in insulin production, insulin action, or both. Thereby, the pancreas underproduces or does not produce insulin, which is needed for the cells to absorb blood sugar (glucose). The cells of people with diabetes suffer from a shortage of glucose, while glucose levels build up in the blood [
2]. The treatment of diabetes comprises invasive self-monitoring techniques to control blood glucose level, that is often carried out by finger stick. Thereby, an increased frequency of blood glucose measurements coupled with intensive therapy leads to improved disease progression [
2,
3]. However, invasive self-monitoring is painful and inconvenient, which is why research suggests the correlation between blood and saliva [
4] or sweat glucose level [
5], so that non-invasive treatment measures are conceivable. The pursuit of non-invasive glucose sensing has been a longstanding objective in the field of health monitoring, driven by the desire to enhance patient comfort and improve the efficiency of diabetes management [
6,
7].
Among the numerous technologies available, organic electrochemical transistors (OECTs) stand out as versatile tools for biomolecular sensing, effectively linking the electronic and biological domains.
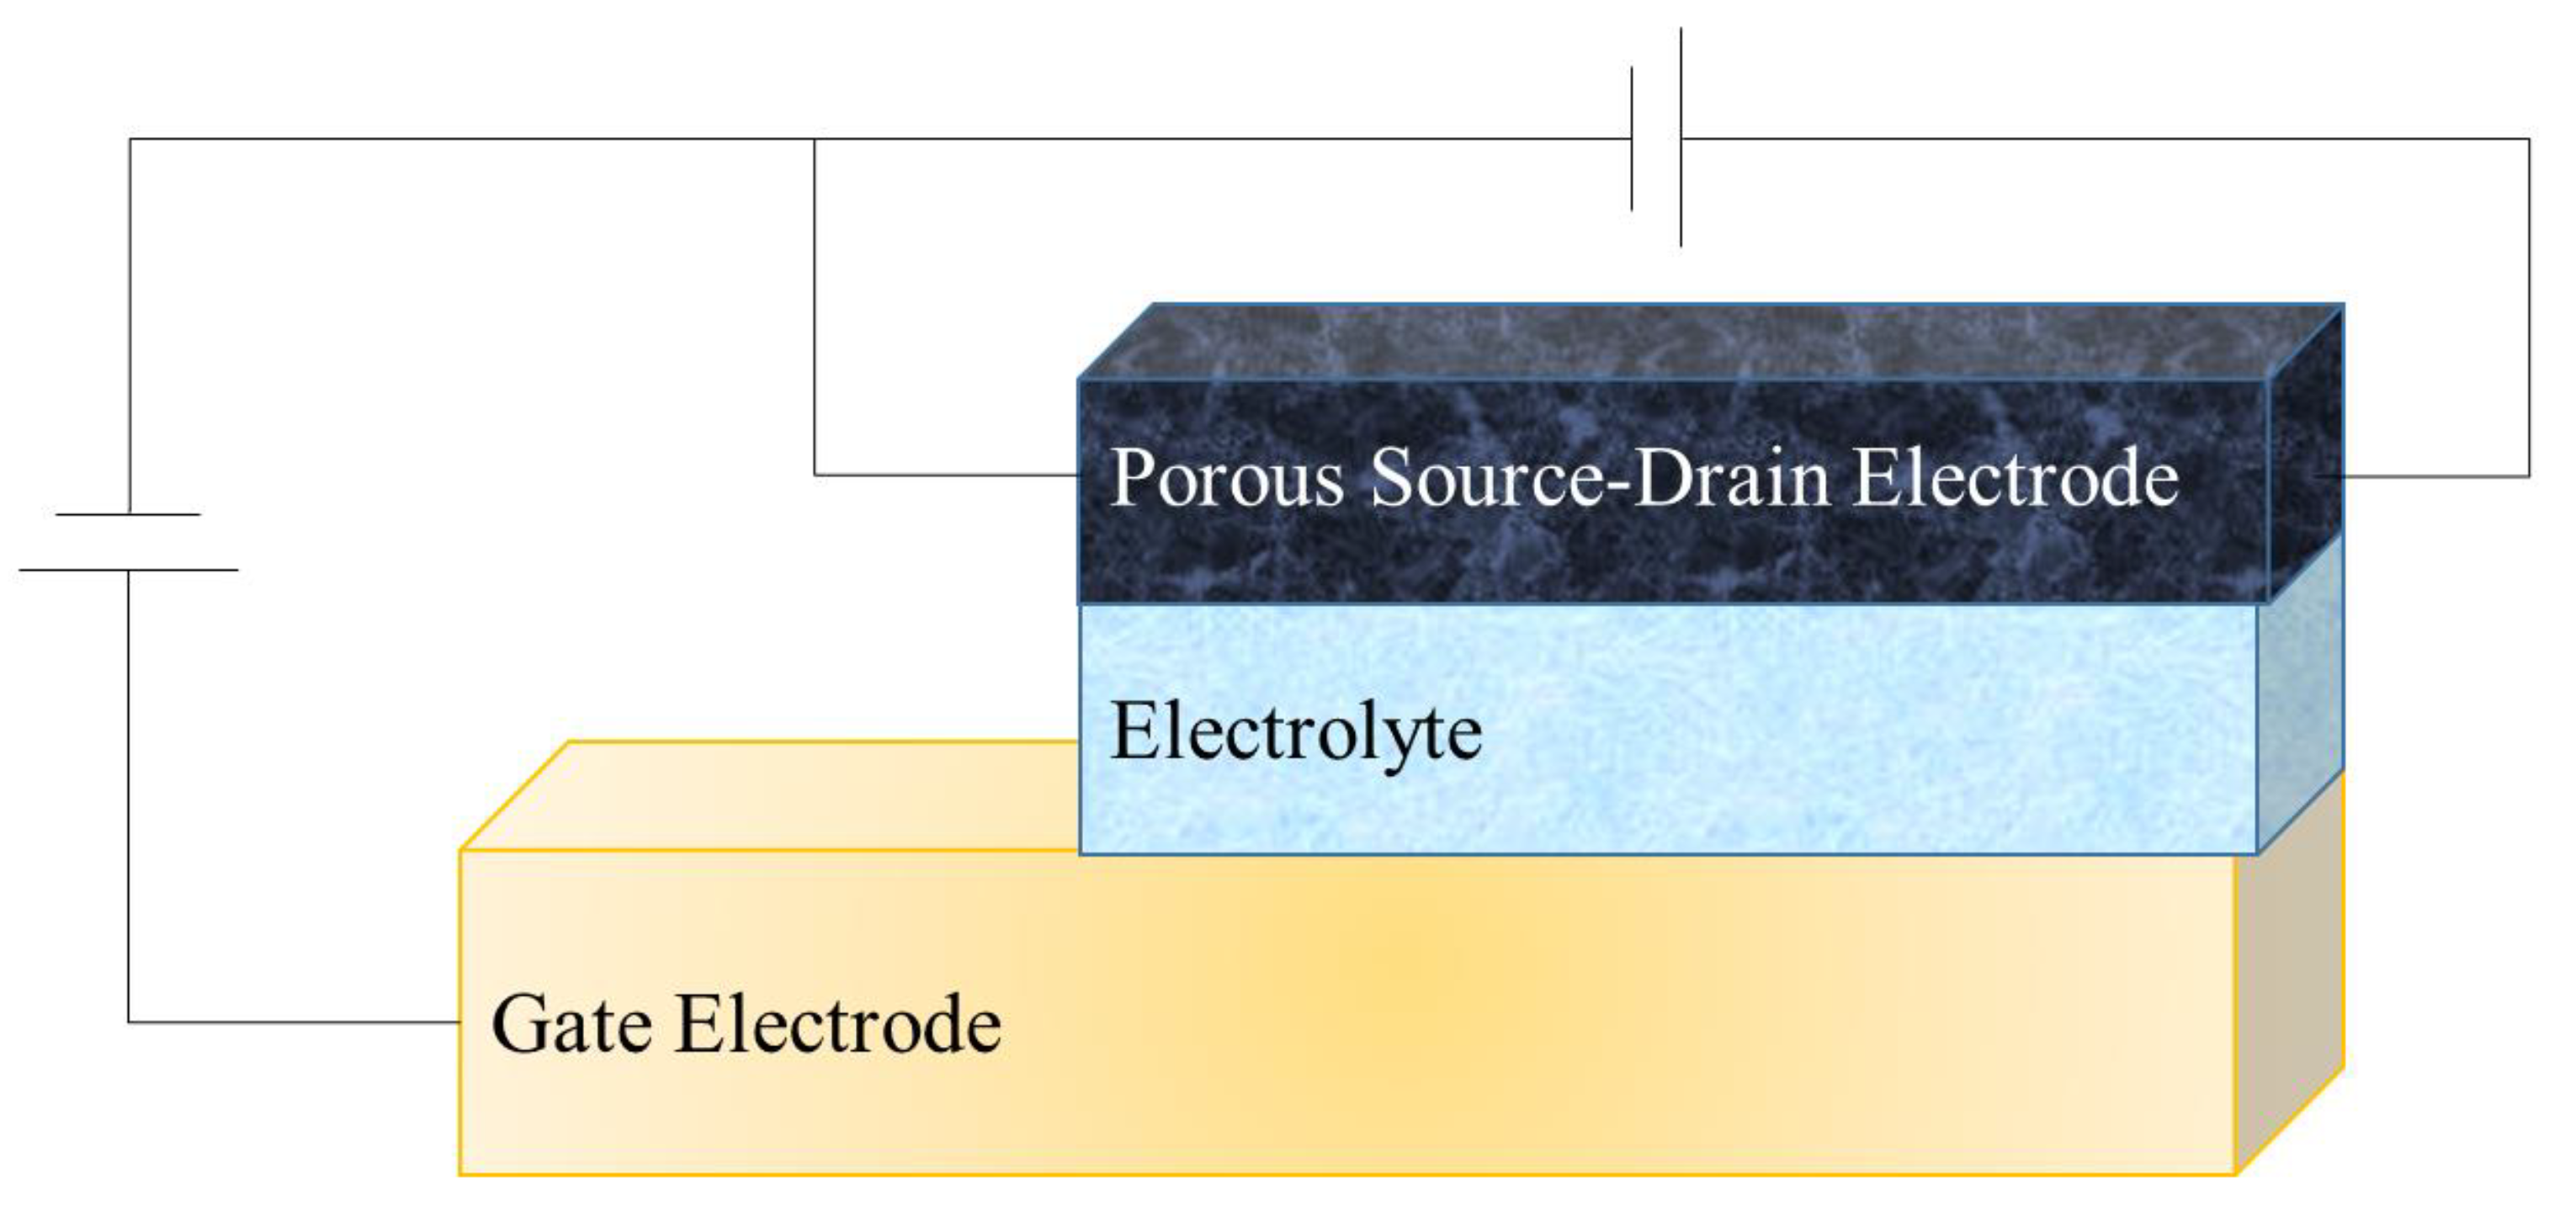
OECTs operate based on the modulation of conductivity in an organic semiconductor channel, typically composed of conductive polymers like poly(3,4-ethylenedioxythiophene) polystyrene sulfonate (PEDOT:PSS). Unlike a simple electrode, a transistor is a three-terminal device that can amplify or switch electronic signals, playing a crucial role in controlling the flow of electrical current. Central components of OECTs include the electrolyte, source, drain, and gate electrodes. These transistors utilize the electrochemical modulation of organic semiconductor conductivity to control the flow of current between the source and drain electrodes. This modulation is achieved by adjusting the gate voltage, facilitating the flow of ions from the electrolyte into the channel of the source-drain electrode. When the electrolyte is enriched with specific ions from various body fluids, variations in ion concentration can be detected in the current flow between the source and drain electrodes, making OECTs versatile devices for various applications, including sensing biomolecules in human systems [
8,
9].
Glucose oxidase (
GOx) is an ideal enzyme for use in biosensors as it features properties like high specificity, high turnover, and high stability. Therefore, it is one of the most widely used enzymes in the field of biosensors that not only comprise OECTs but also other electrochemical sensors [
10,
11,
12]. Next to
GOx, there are three other enzymes to sense glucose that lack either stability or specificity, which rules out the widespread use of this group of enzymes in biosensors for glucose [
13].
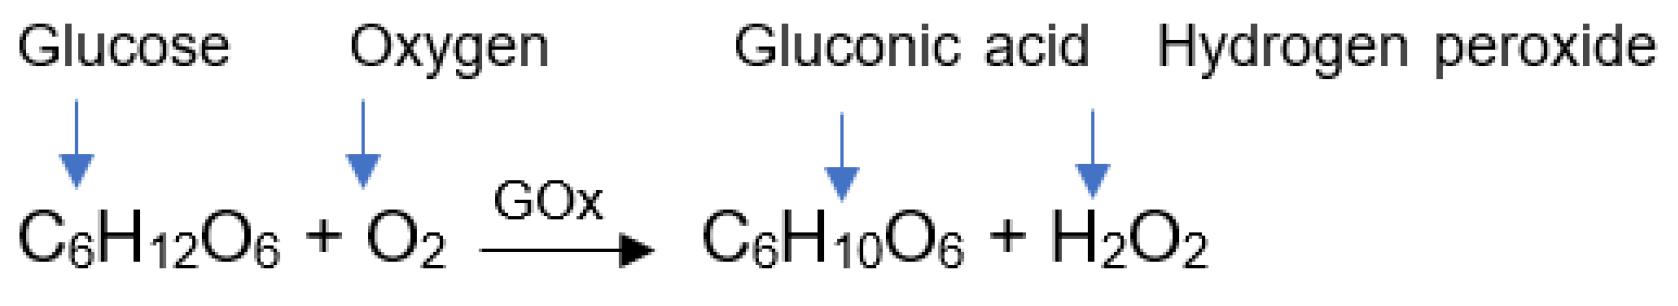
GOx catalyzes the oxidation of glucose to gluconic acid (D-glucono-δ-lactone) and hydrogen peroxide (H
2O
2) using molecular oxygen as an electron acceptor (
Figure 1) [
13,
14], as follows:
Glucose oxidase is already being applied in non-textile biosensors that trace the number of electrons that pass through an enzyme and measure the resultant charge by connecting the enzyme to an electrode. Often these are amperometric biosensors, whereby a constant potential is applied between the working and reference electrode. The catalytic reaction caused by
GOx drives the current flow that is proportional to the concentration of the target molecule. This change in current is then measured by the electrodes [
14,
15]. Other papers also suggest the development of a thermistor [
16,
17] or thermopile-based sensor [
18,
19,
20] as the oxidation of glucose releases a significant amount of heat. Fluorescent-based glucose sensors have been developed that utilize either the different oxidative states, the oxygen consumption or the hydrogen peroxide production formed during the reaction with
GOx coupled with an appropriate fluorophore [
21,
22,
23,
24]. When those biosensors are employed in a continuous monitoring system, the frequent measurements show a better representation of the glycemic history and status of the patient. Linked with an insulin pump, for example, it allows closer control of hypo- and hyperglycemia [
2].
Ideally, the long-term monitoring of blood glucose levels of diabetic patients would take place non-invasively. Therefore, a correlation between blood glucose and sweat glucose needs to be established. J. Moyer et al. (2012) stated that glucose in sweat is at a concentration that is about 1–2% of the corresponding blood value [
5]. H. Lee et al. (2017) mentioned that the glucose concentration in sweat is between 10 µM and 1 mM (precisely 0.01–1.11 × 10
−3 M [
25]), which covers both hypoglycemic and hyperglycemic sweat glucose concentrations of diabetic patients as well as of healthy persons [
10]. However, for the accurate estimation of the blood glucose level based on the sweat glucose level, the correlation factor between the glucose concentration of blood and sweat should be found for each individual subject with enough data. Therefore, they suggested future investigations about the correlation of blood and sweat glucose levels before application to diabetic people [
10].
In the literature, OECTs for glucose sensing are well presented. S. Kanakamedala et al. (2011) developed a glucose sensor with micromolar sensitivity based on an OECT structure [
26]. Thereby all electrodes, gate, source, and drain, were made of PEDOT:PSS and the electrolyte consisted of
PBS with calcium- and magnesium chloride. In a next step, the electrolyte was loaded into the transistor well and subsequently a prepared solution containing
GOx was added to the electrolyte. For glucose sensing experiments, glucose solutions with concentrations from 1 µM to 10 mM were added to the electrolyte enriched with
GOx. Simultaneously, the output characteristics were measured and the combination of glucose and
GOx in the electrolyte led to the oxidation of glucose to hydrogen peroxide (H
2O
2). The oxidation reaction of H
2O
2 was further catalyzed at the gate electrode, which resulted in a reduction in PEDOT:PSS in the channel and thereby a decrease in channel conductivity [
26].
N. Y. Shim et al. (2009) demonstrate a similar approach, whereby all electrodes were also made from PEDOT:PSS and the enzyme
GOx was used. Additionally, a ferrocene mediator was introduced for electron transfer to improve the catalytic properties [
27]. Y. Kim et al. (2010) suggested a similar approach with the addition of an acid sensitive fluorescent layer providing the OECT sensor with dual sensitivity of electrochemical and optical sensitivity. The OECT was built of PEDOT as channel, a platinum (Pt) wire as gate and
GOx in the electrolyte [
28]. The combination of a Pt gate electrode, a channel made of PEDOT:PSS, and
GOx to confer specificity was also used by D. J. Macaya et al. (2007) and investigations showed that the sensor’s response to glucose was well within the clinical range of glucose levels in human saliva [
29]. Another highly sensitive glucose biosensor was prepared by H. Tang et al. (2011) using a Pt gate electrode modified with
GOx and nanomaterials, such as multi-wall carbon nanotubes or Pt nano-particles. The incorporation of these nanomaterials resulted in higher sensitivity of the sensor. This improvement was attributed to the electro catalytic properties of the nanomaterials [
30]. Nanoparticles were used by J. Liao et al. (2014) as well. In this paper, titanium dioxide nanotube arrays were used as the gate electrode of the OECT device. Thereby, highly sensitive and selective OECTs were obtained by incorporating Pt nanoparticles and
GOx into the gate electrode [
31].
J. Zhao et al. (2019) developed a self-powered smartwatch for continuous sweat glucose monitoring [
32]. The smartwatch consisted of flexible photovoltaic cells, rechargeable batteries, customized circuits, display units, and an electrochemical glucose sensor. The electrodes for the flexible glucose sensor were patterned on polyester (PET) substrates and the enzyme membrane solution (electrolyte) was made by mixing agarose and glucose oxidase 1:1. This solution was then cast over the working electrode and dried over night at ambient temperature. The electrochemical sensor was integrated into the smart watch and with all other components, the device delivered desirable sensitivity and selectivity for sweat glucose monitoring [
32].
The OECT configurations presented so far have not been based on textile materials. However, textile-based OECTs offer key advantages over conventional ones, particularly for wearable applications. Their flexibility and comfort enable seamless integration into clothing, improving user acceptance for continuous health monitoring. Unlike rigid devices, textile OECTs are more adaptable and maintain functionality during daily movements. Additionally, they can provide a larger surface area for more precise sensor networks, enhancing real-time monitoring capabilities [
33]. For example, Y. Wang et al. (2017) developed a woven fiber OECT based on polypyrrole (PPy) nanowires and reduced graphene oxide (rGO) [
34]. The base substrate for the fiber-based OECT was a polyamide 6 filament that was functionalized with rGO and PPy. This filament was used as source-drain electrode and another one of these filaments was further functionalized with
PBS and
GOx to be used as gate electrode. Those two filaments were then assembled in a cross-junction, such as present in weaving, and connected by an electrolyte gel. The response of sensor to the addition of glucose was measured by changing the channel current. The textile-based OECT was exposed to glucose but also other human body fluids such as uric and ascorbic acid and showed high sensitivity and selectivity solely towards glucose. Moreover, the sensor characteristics were examined in repeated series and the fiber-based OECT demonstrated high cycle stability with fast response times [
34].
Textile-based OECTs are frequently described in the literature with a configuration where the gate electrode and the source-drain electrode are separate yarns, connected by a liquid or gel-like electrolyte solution [
35,
36,
37]. In contrast, in this study, the aim is to integrate the gate electrode, electrolyte, and source-drain electrode into a single device. This integration not only simplifies the incorporation of the OECTs into garments for future biosensor applications but also holds potential for improving long-term sensitivity and enhancing washability. By consolidating these components, the design reduces the complexity of maintaining stable connections, minimizing the risk of performance degradation over time, which helps ensure consistent and reliable sensor readings. Additionally, the integrated structure may be more resistant to damage during washing cycles, addressing a key challenge in the development of durable, washable smart textiles. To achieve this integrated structure, the electrolyte must form a solidified layer, while a porous, electrically conductive polymer film is essential for allowing the permeation of ionic substances into the electrolyte layer. In this research, the device layout, inspired by R. Brendgen et al. (2022) [
38], is further refined by the incorporation of distinct porous PEDOT:PSS structures [
38], and modification of the electrolyte with glucose oxidase (
GOx) to enhance specificity. While maintaining the original OECT layout, the functionalization of the electrolyte demonstrates the selectivity of the devices and their effectiveness as glucose sensors. Additionally, integrating various porous structures shows that device properties can be adjusted by tuning the composition of individual components, such as the source-drain electrode, electrolyte, and gate electrode.
In this publication, the development and optimization of textile-based organic electrochemical transistors for non-invasive glucose sensing are explored, highlighting the potential of this technology to revolutionize diabetes management by integrating seamless, comfortable, and effective health monitoring solutions into everyday wear.
2. Materials and Methods
The following sections describe the materials and methods used in the production of textile-based OECTs for glucose sensing. The materials are categorized into those used for the gate electrode, electrolyte, and source-drain electrode (channel material). The methods cover both the fabrication of the transistor components and the various characterization techniques employed.
2.1. Gate Electrode
The gate electrode consists of the commercially available metal-coated fabric Shieldex Porto RS from Statex Produktions- und Vertriebs GmbH (Bremen, Germany). It is a copper/tin-coated ripstop fabric made of 100% polyester and has a surface resistance of ≤0.02 Ω/□ according to the datasheet of the manufacturer [
39].
2.2. Electrolyte
The electrolyte comprised a mixture of tylose type H 100000 YP2 from SE Tylose GmbH + Co. KG (Wiesbaden, Germany) [
40], ECG contact gel from Gello GmbH Geltechnik (Ahaus, Germany) [
41], glycerol (≥98%) from Carl Roth GmbH + Co. KG (Karlsruhe, Germany), and lithium chloride from Alfa Aesar/Fisher Scientific GmbH (Schwerte, Germany). For the adjustment of the electrolyte layer for glucose detection, phosphate-buffered saline (
PBS) was necessary for diluting the glucose oxidase. Therefore, potassium dihydrogen phosphate (KH
2PO
4) and di-potassium hydrogen phosphate (K
2HPO
4) were procured from Carl Roth GmbH + Co. KG (Karlsruhe, Germany), and
GOx from Aspergillus niger was acquired from Sigma Alderich/Merck KGaA (Darmstadt, Germany) [
42]. Additionally, glucose and sodium chloride (NaCl) from Carl Roth GmbH + Co. KG (Karlsruhe, Germany) were obtained for solutions used in characterization.
The electrolyte layer was produced by first dissolving 5% tylose in distilled water and mixing it for 2 h in the dispermat of VMA-Getzmann GmbH (Reichshof, Germany). This solution was then manually combined with commercial ECG-gel in a 1:1 ratio. Next, 10 wt.% glycerol and 1 wt.% LiCl were added, and the mixture was blended for 20 min in the dispermat. A drop of Lyoprint Air defoamer was added to minimize bubbling. This method is based on R. Brendgen et al. (2022) [
38].
To modify the electrolyte for glucose detection, glucose oxidase (
GOx) was incorporated. A
PBS solution with pH 5.6 was prepared by dissolving 2.72 g KH
2PO
4 and 0.348 g K
2HPO
4 in 100 mL distilled water each. Then, 93.5 g KH
2PO
4 solution was mixed with 6.5 g K
2HPO
4 solution and 100 mL distilled water. A pH of 5.6 was chosen based on the literature, where the enzyme shows optimal activity within a pH range of 3.5 to 6.5 [
43].
GOx was dissolved in
PBS at 5 mg/mL [
34], and this concentration was matched in the electrolyte solution, assuming 1 mL equals 1 g. The resulting mixing ratios were as follows:
Objective: To prepare a total of 50 g of a solution containing an electrolyte and glucose oxidase (GOx) at a ratio of 5 mg GOx per 1 g of electrolyte solution. GOx is initially dissolved in PBS at a concentration of 5 mg/mL. The goal is to determine how much GOx needs to be dissolved in PBS to achieve the required concentration of 5 mg GOx per 1 g of electrolyte in the final 50 g solution.
- →
Total quantity GOx (n) in electrolyte solution:
- →
Dissolving GOx previously in PBS in a mixing ratio of 5 mg/mL:
Based on the calculations, 250 mg GOx was dissolved in 50 mL PBS, stirred with a magnetic stirrer for 30 min, and subsequently mixed with 50 g of the electrolyte in the dispermat for 5 min.
2.3. Source-Drain Electrode
The source-drain electrode for the OECT structure was made from different porous PEDOT:PSS structures, presented in [
44]. Best-suited samples in terms of porosity, electrical resistance (1 cm measuring distance), water resistance, and thickness were selected, freshly prepared, and cut into 1 cm
2 pieces for subsequent integration into the OECT structure.
Table 1 shows the selected samples and their characteristics.
2.4. Assembly of OECT
The assembly process for the OECT follows the methodology outlined by R. Brendgen et. al. (2022) [
38]. The electrolyte served as an adhesive, binding the gate and source-drain electrode. Using a hand squeegee with a wet-film thickness of 500 µm, the electrolyte solution was applied to the nickel-tin fabric. This layer was then dried in an oven at 60 °C for 10 min before applying another layer of electrolyte (500 µm). The porous PEDOT:PSS samples were cut into 1 cm
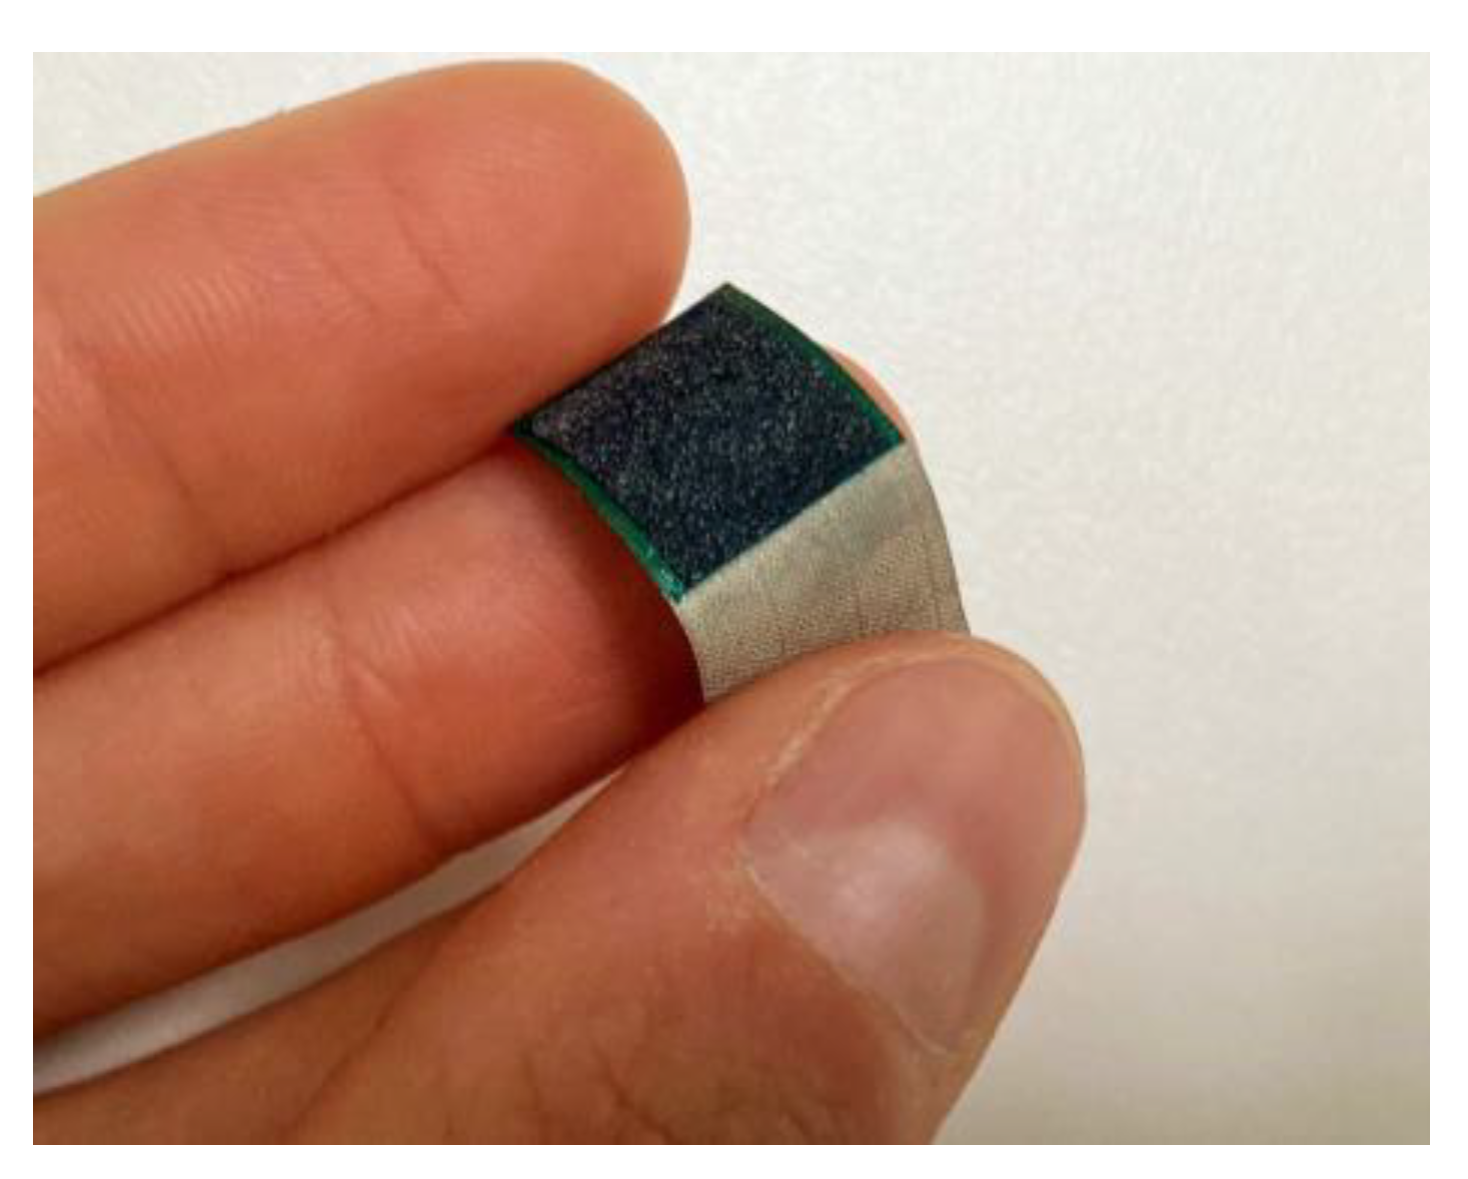
2 pieces and were introduced into the still liquid electrolyte solution. The assembled OECT structures were placed in the oven for an additional 10 min at 60 °C. This process allowed the electrolyte solution to solidify, effectively bonding all three layers. By laminating the metal-coated textile with the electrolyte solution twice, it ensured that no electrical contact was established between the gate and source-drain electrode—crucial for the transistor’s performance. The final dimensions of the textile-based OECT were 1 × 3 cm. It can be seen in
Figure 2.
Three transistors were manufactured from each distinct porous structure. Additionally, transistors with unmodified and
GOx-modified electrolytes were prepared, resulting in the following OECTs (
Table 2).
2.5. Analyte Solutions
To conduct later characterization, glucose solutions were prepared with mass concentrations of 10 µM, 100 µM, and 1 mM. These concentrations cover typical glucose levels found in the sweat of individuals with hypo- and hyperglycemia, as well as those of healthy individuals, as reported by H. Lee et al. (2017) [
10]. Glucose solutions were prepared as follows:
Given molar mass of glucose: ~180.16 g/mol
Calculated glucose quantities were dissolved in 10 mL di. H2O. However, larger volumes were necessary to make glucose amounts measurable on the scale. Lastly, 0.9% saline solution was prepared by mixing 0.09 g sodium chloride (NaCl) with 10 g di. H2O.
2.6. Optical Characterization
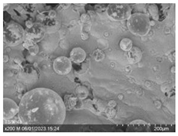
The fabricated OECTs underwent optical characterization, including longitudinal and cross-sectional views, using the SEM TM4000 from Hitachi High-Tech Europe GmbH (Krefeld, Germany). Additionally, EDS spectroscopy was performed with the EDS unit from Bruker Corporation (Billerica, MA, USA). During cross-sectional analysis, the layer thickness of the electrolyte was measured.
During electrical measurements, a change in color of the porous PEDOT:PSS electrodes was noticed. Hence, color measurements using the ColorReaderPRO and the ColorReader App from DataColor (Lawrence, KS, USA) were conducted. Color measurements were performed at −1.0 Vg and +1.0 Vg with a constant +0.5 Vsd. To measure the color, the ColorReaderPRO stick was placed onto the samples, and measurements were completed in just a few seconds. Lab values were obtained and subsequently ΔE was calculated using Equation (1), as follows:
Equation (1): DeltaE (
ΔE)
In this equation, the terms L1, a1, and b1 represent the color measurements taken at one voltage (e.g., −1.0 Vg), while L2, a2, and b2 correspond to measurements taken at a different voltage (e.g., +1.0 Vg). Each coefficient represents a specific dimension in the CIELab color space (L = luminance, a = red-green-values, b = yellow-blue-values).
2.7. Electrical Characterization
The electrical performance of the transistors was evaluated using a measurement set-up following the scheme in
Figure 3. One voltage source controlled the voltage of the source electrode, while another one controlled the gate voltage. The multimeter measured the current output at the drain electrode of the OECT. For this set-up, the PeakTech 6210 voltage source and the PeakTech 4000 multimeter from PeakTech Prüf- und Messtechnik GmbH (Ahrensburg, Germany) were employed.
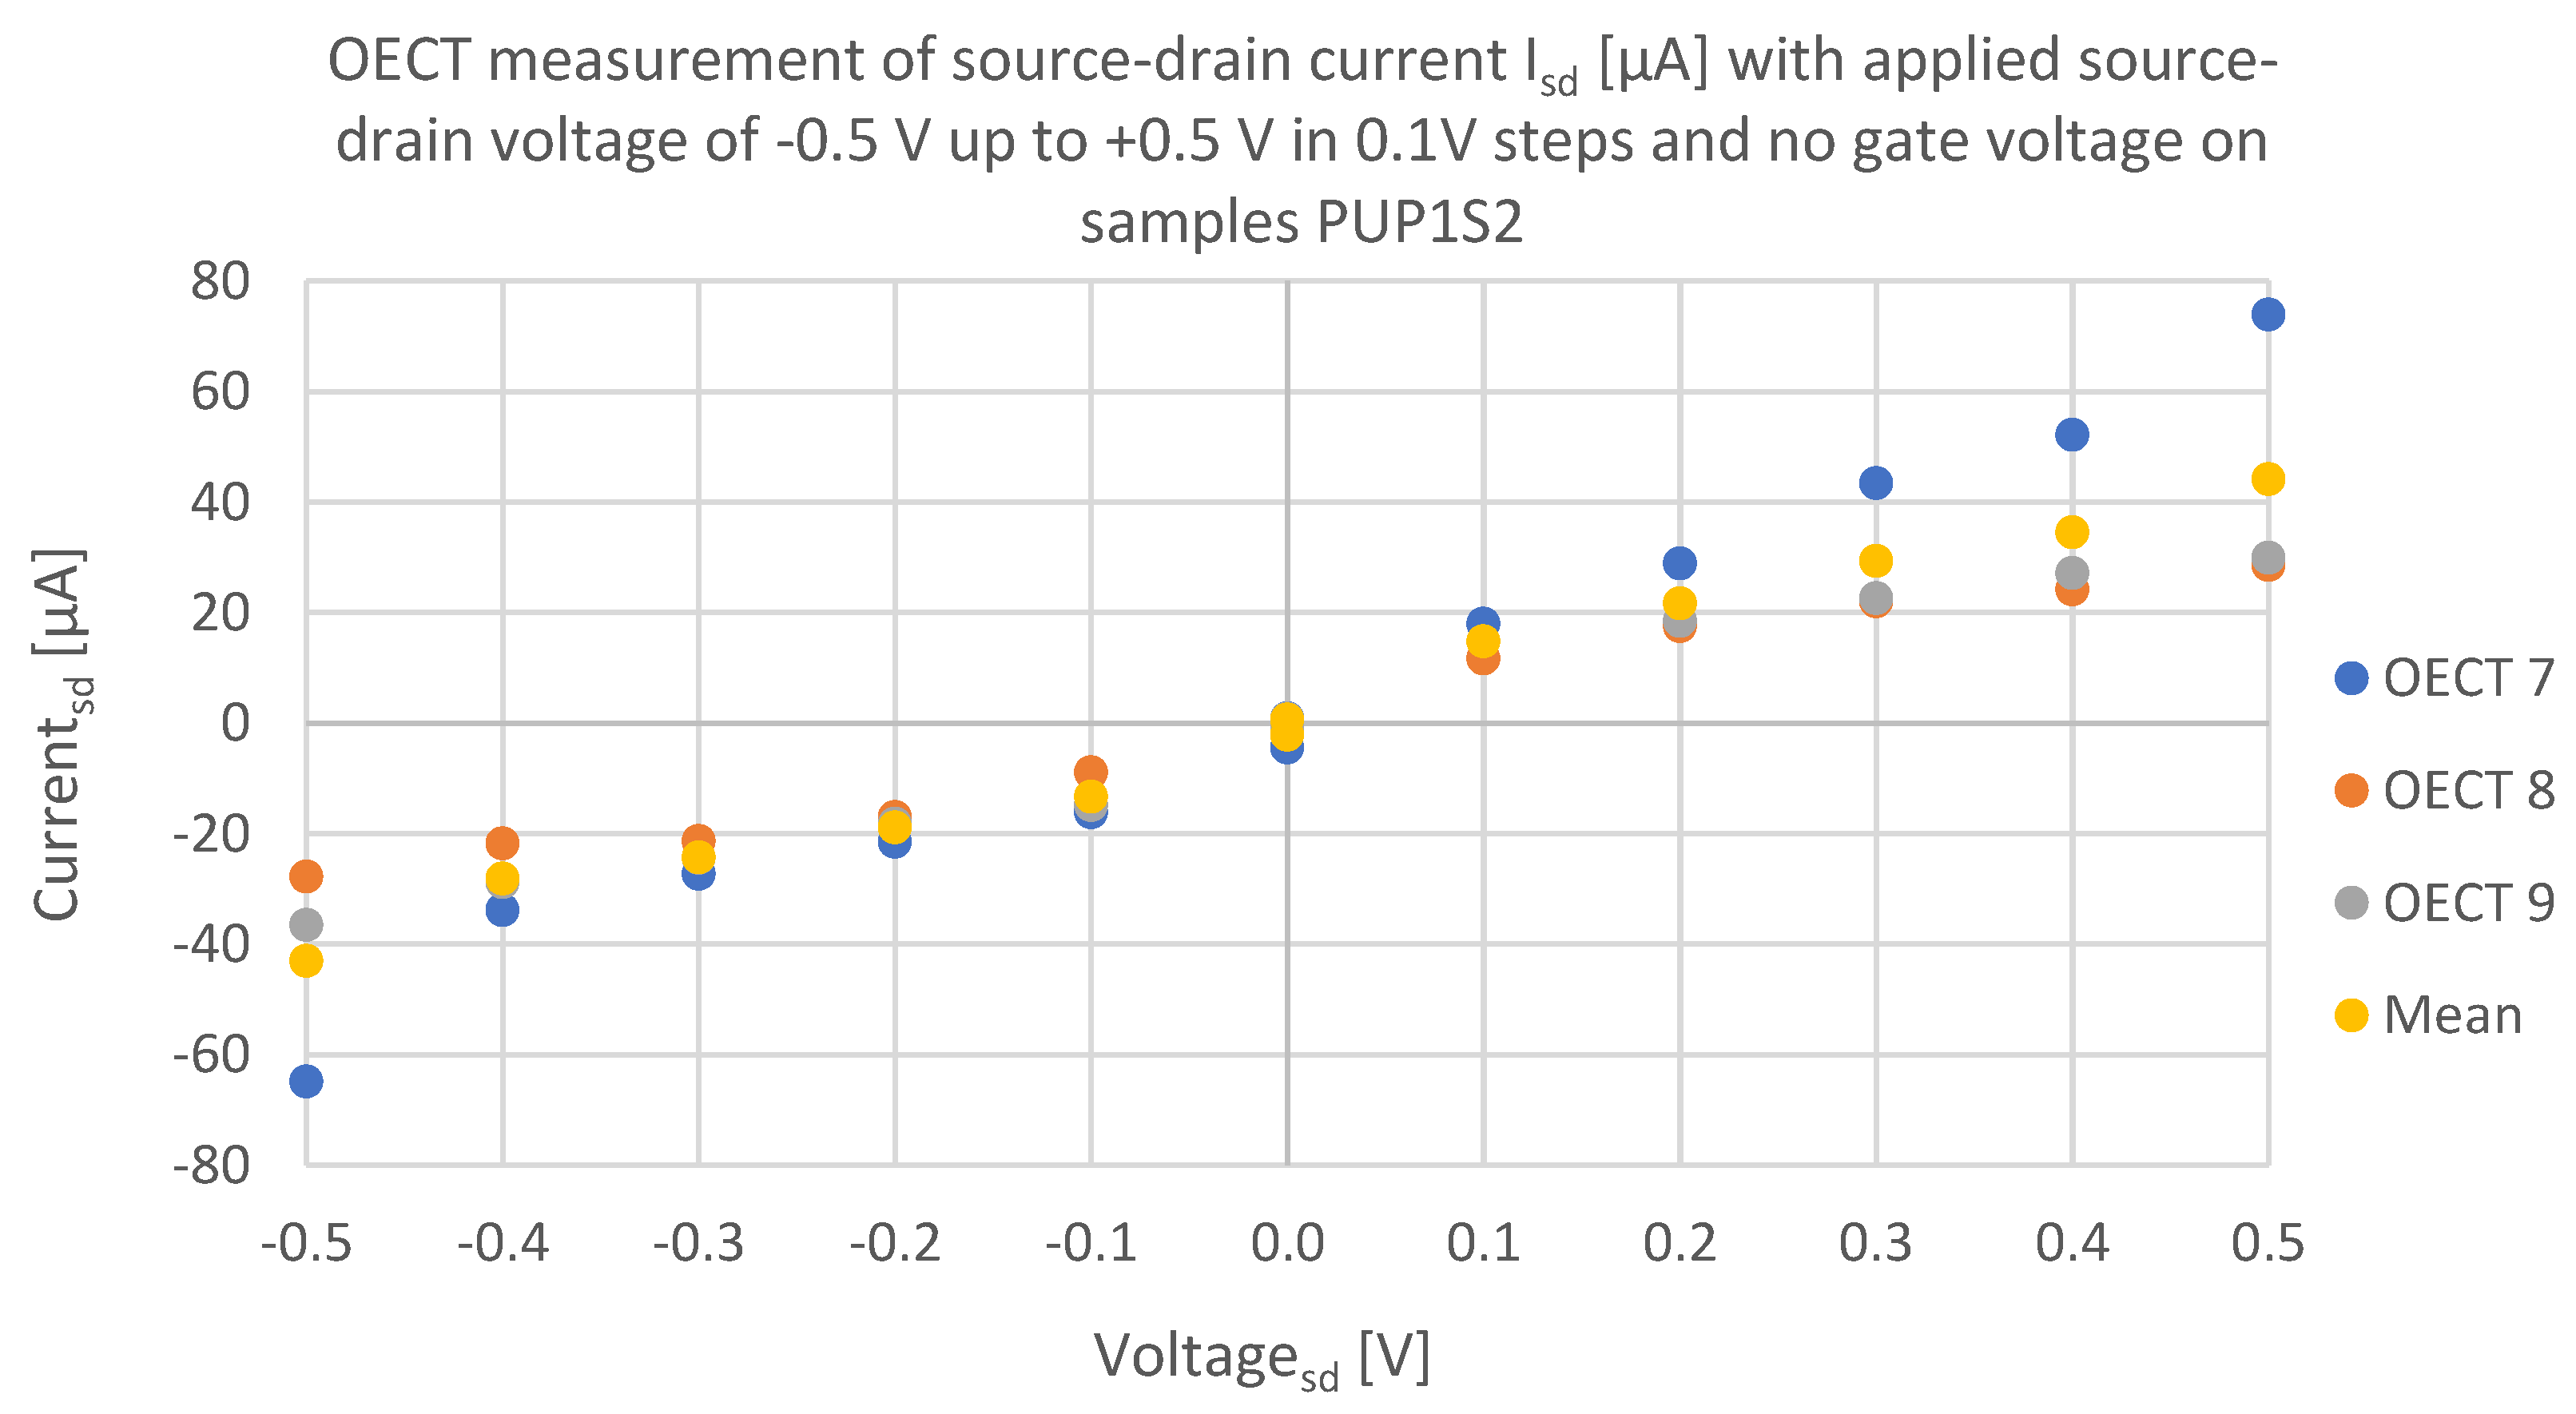
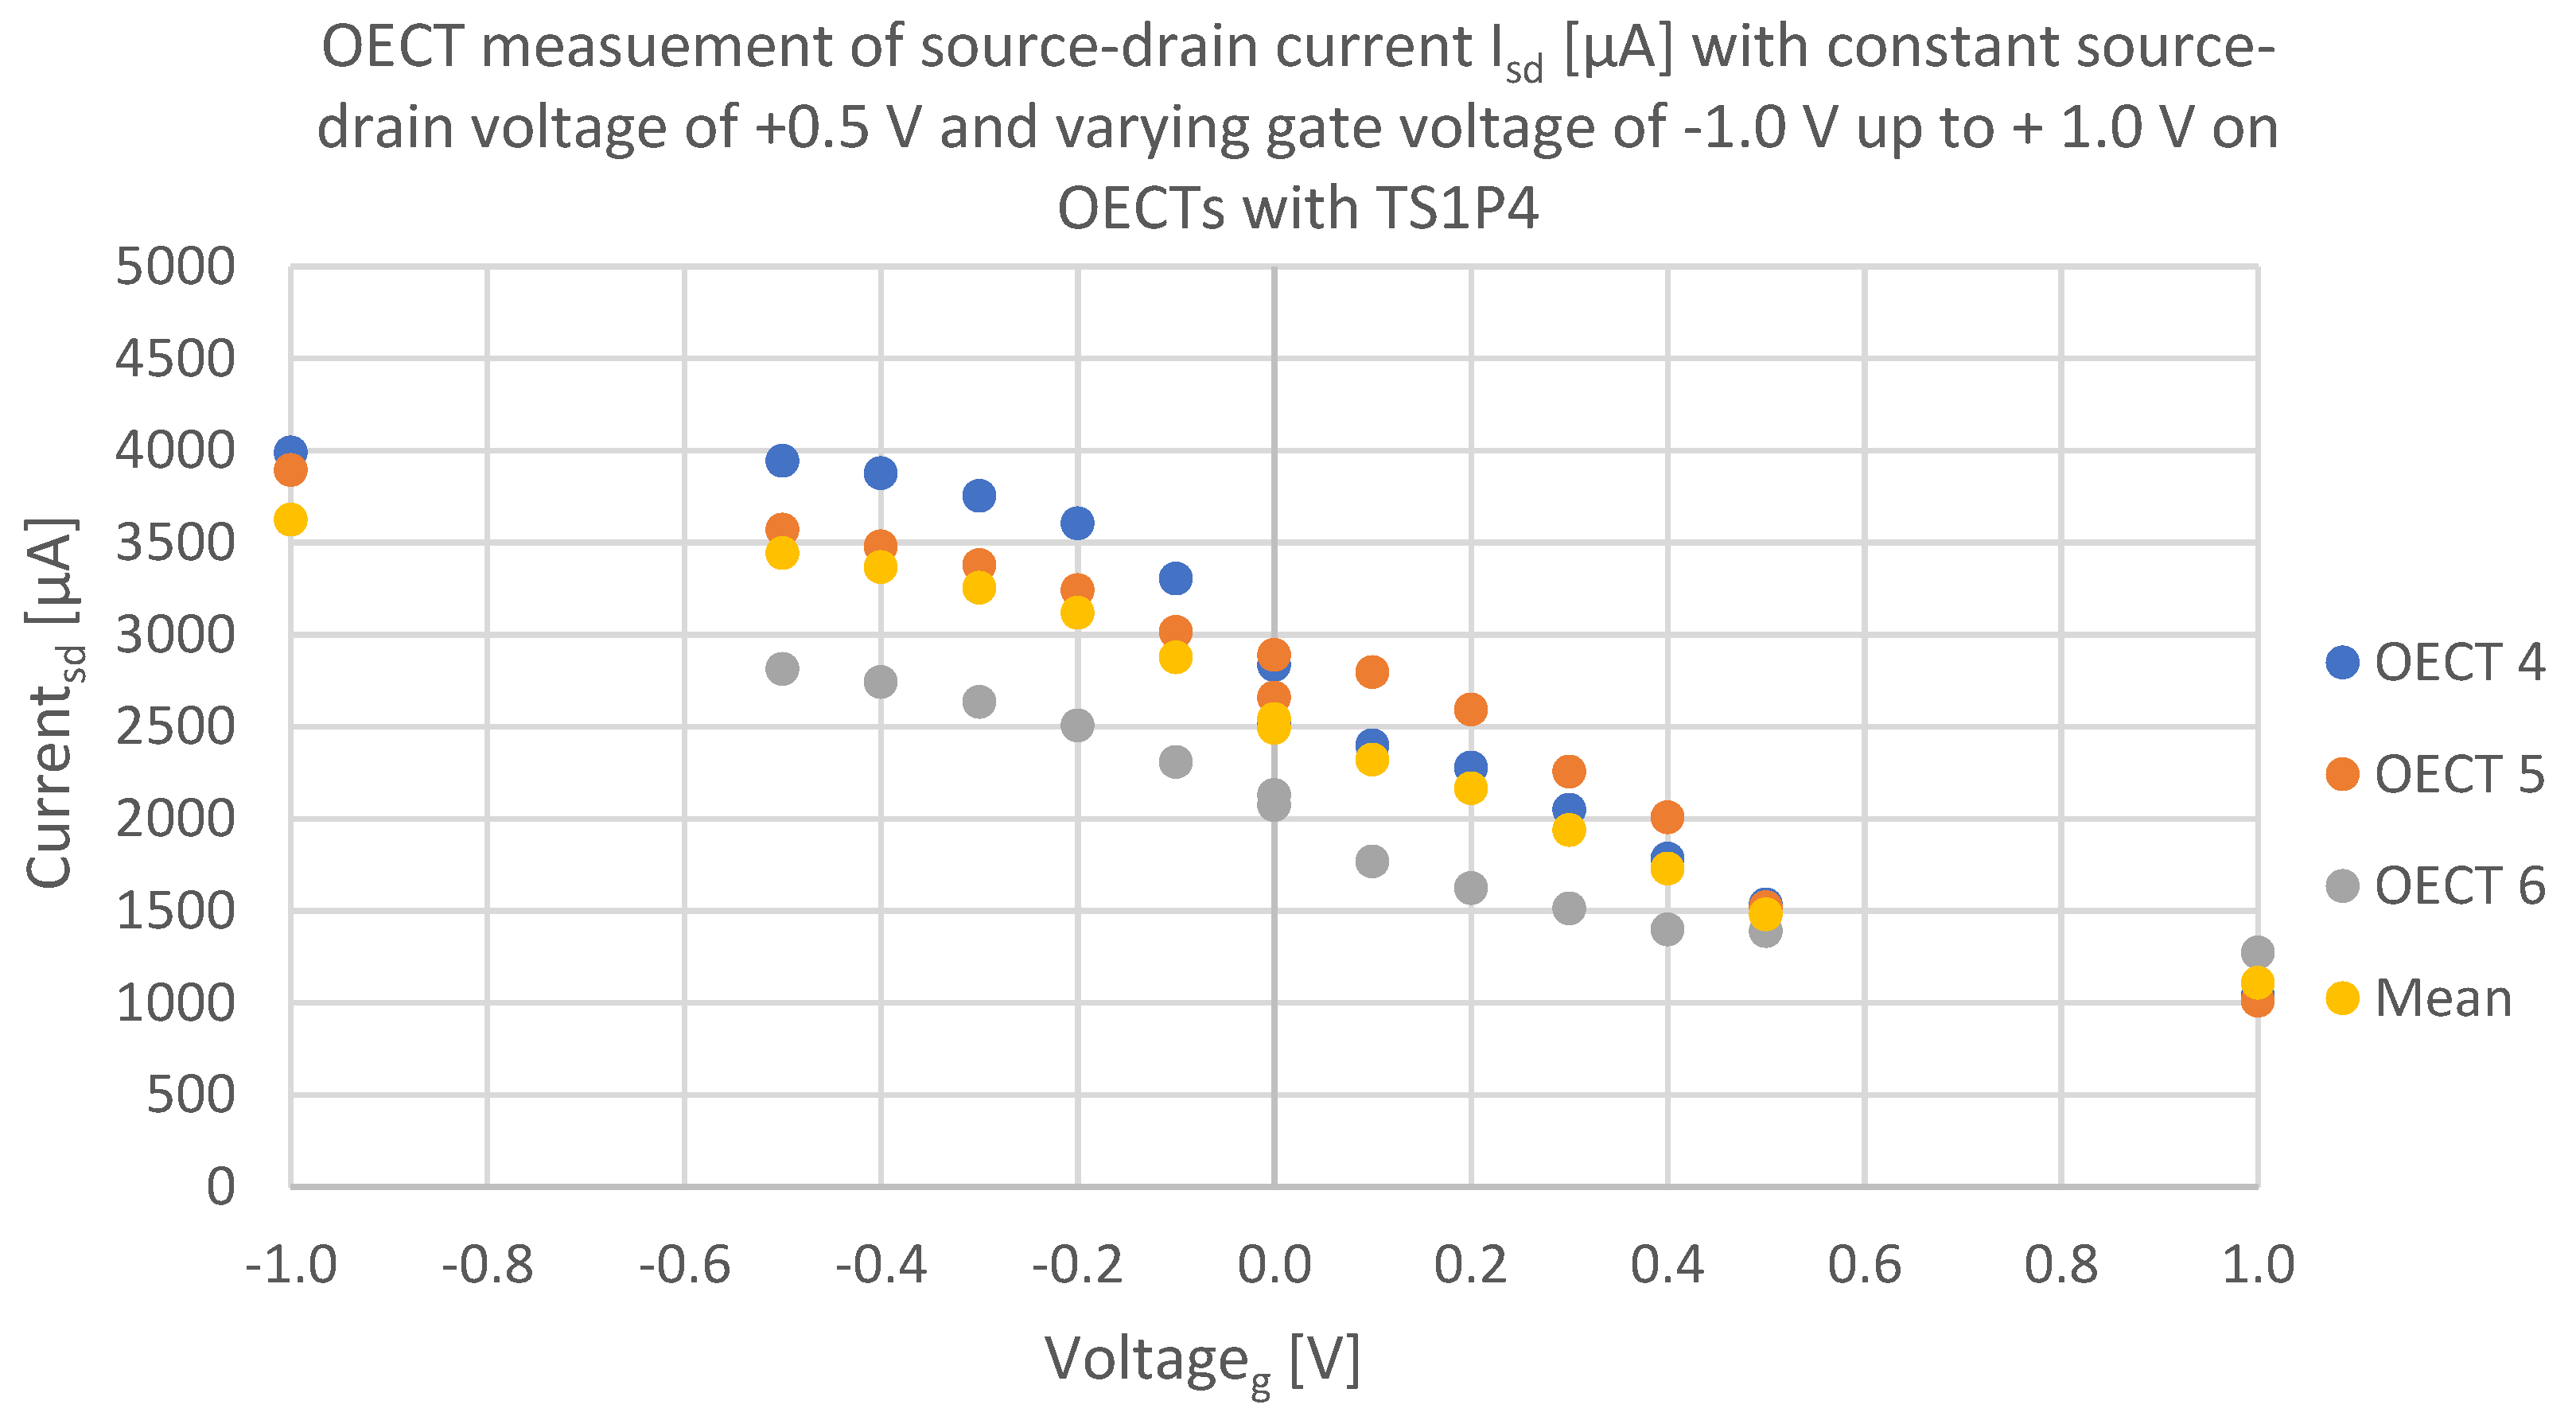
The measurements were conducted on three samples from each batch. Initially, only the source-drain voltage (Vsd) was applied with no voltage on the gate electrode. The source-drain voltage was increased in 0.1 V increments from −0.5 V to +0.5 V, and the corresponding source-drain current (Isd) was recorded in μA. Subsequently, the gate voltage (Vg) was applied, while the source-drain voltage was held constant at +0.5 V. The gate voltage was varied in 0.1 V steps from −0.5 V to +0.5 V, and in 0.5 V steps from ±0.5 V to ±1.0 V. The changing source-drain current was recorded by the multimeter.
Using Ohm’s law formula (Equation (2)), the variance in electrical resistance of the source-drain electrode at different gate voltages can be calculated. Resistance values for all samples were calculated based on Isd at a constant Vsd of 0.5 V and Vg of −1.0 V and +1.0 V.
2.8. Glucose Measurement
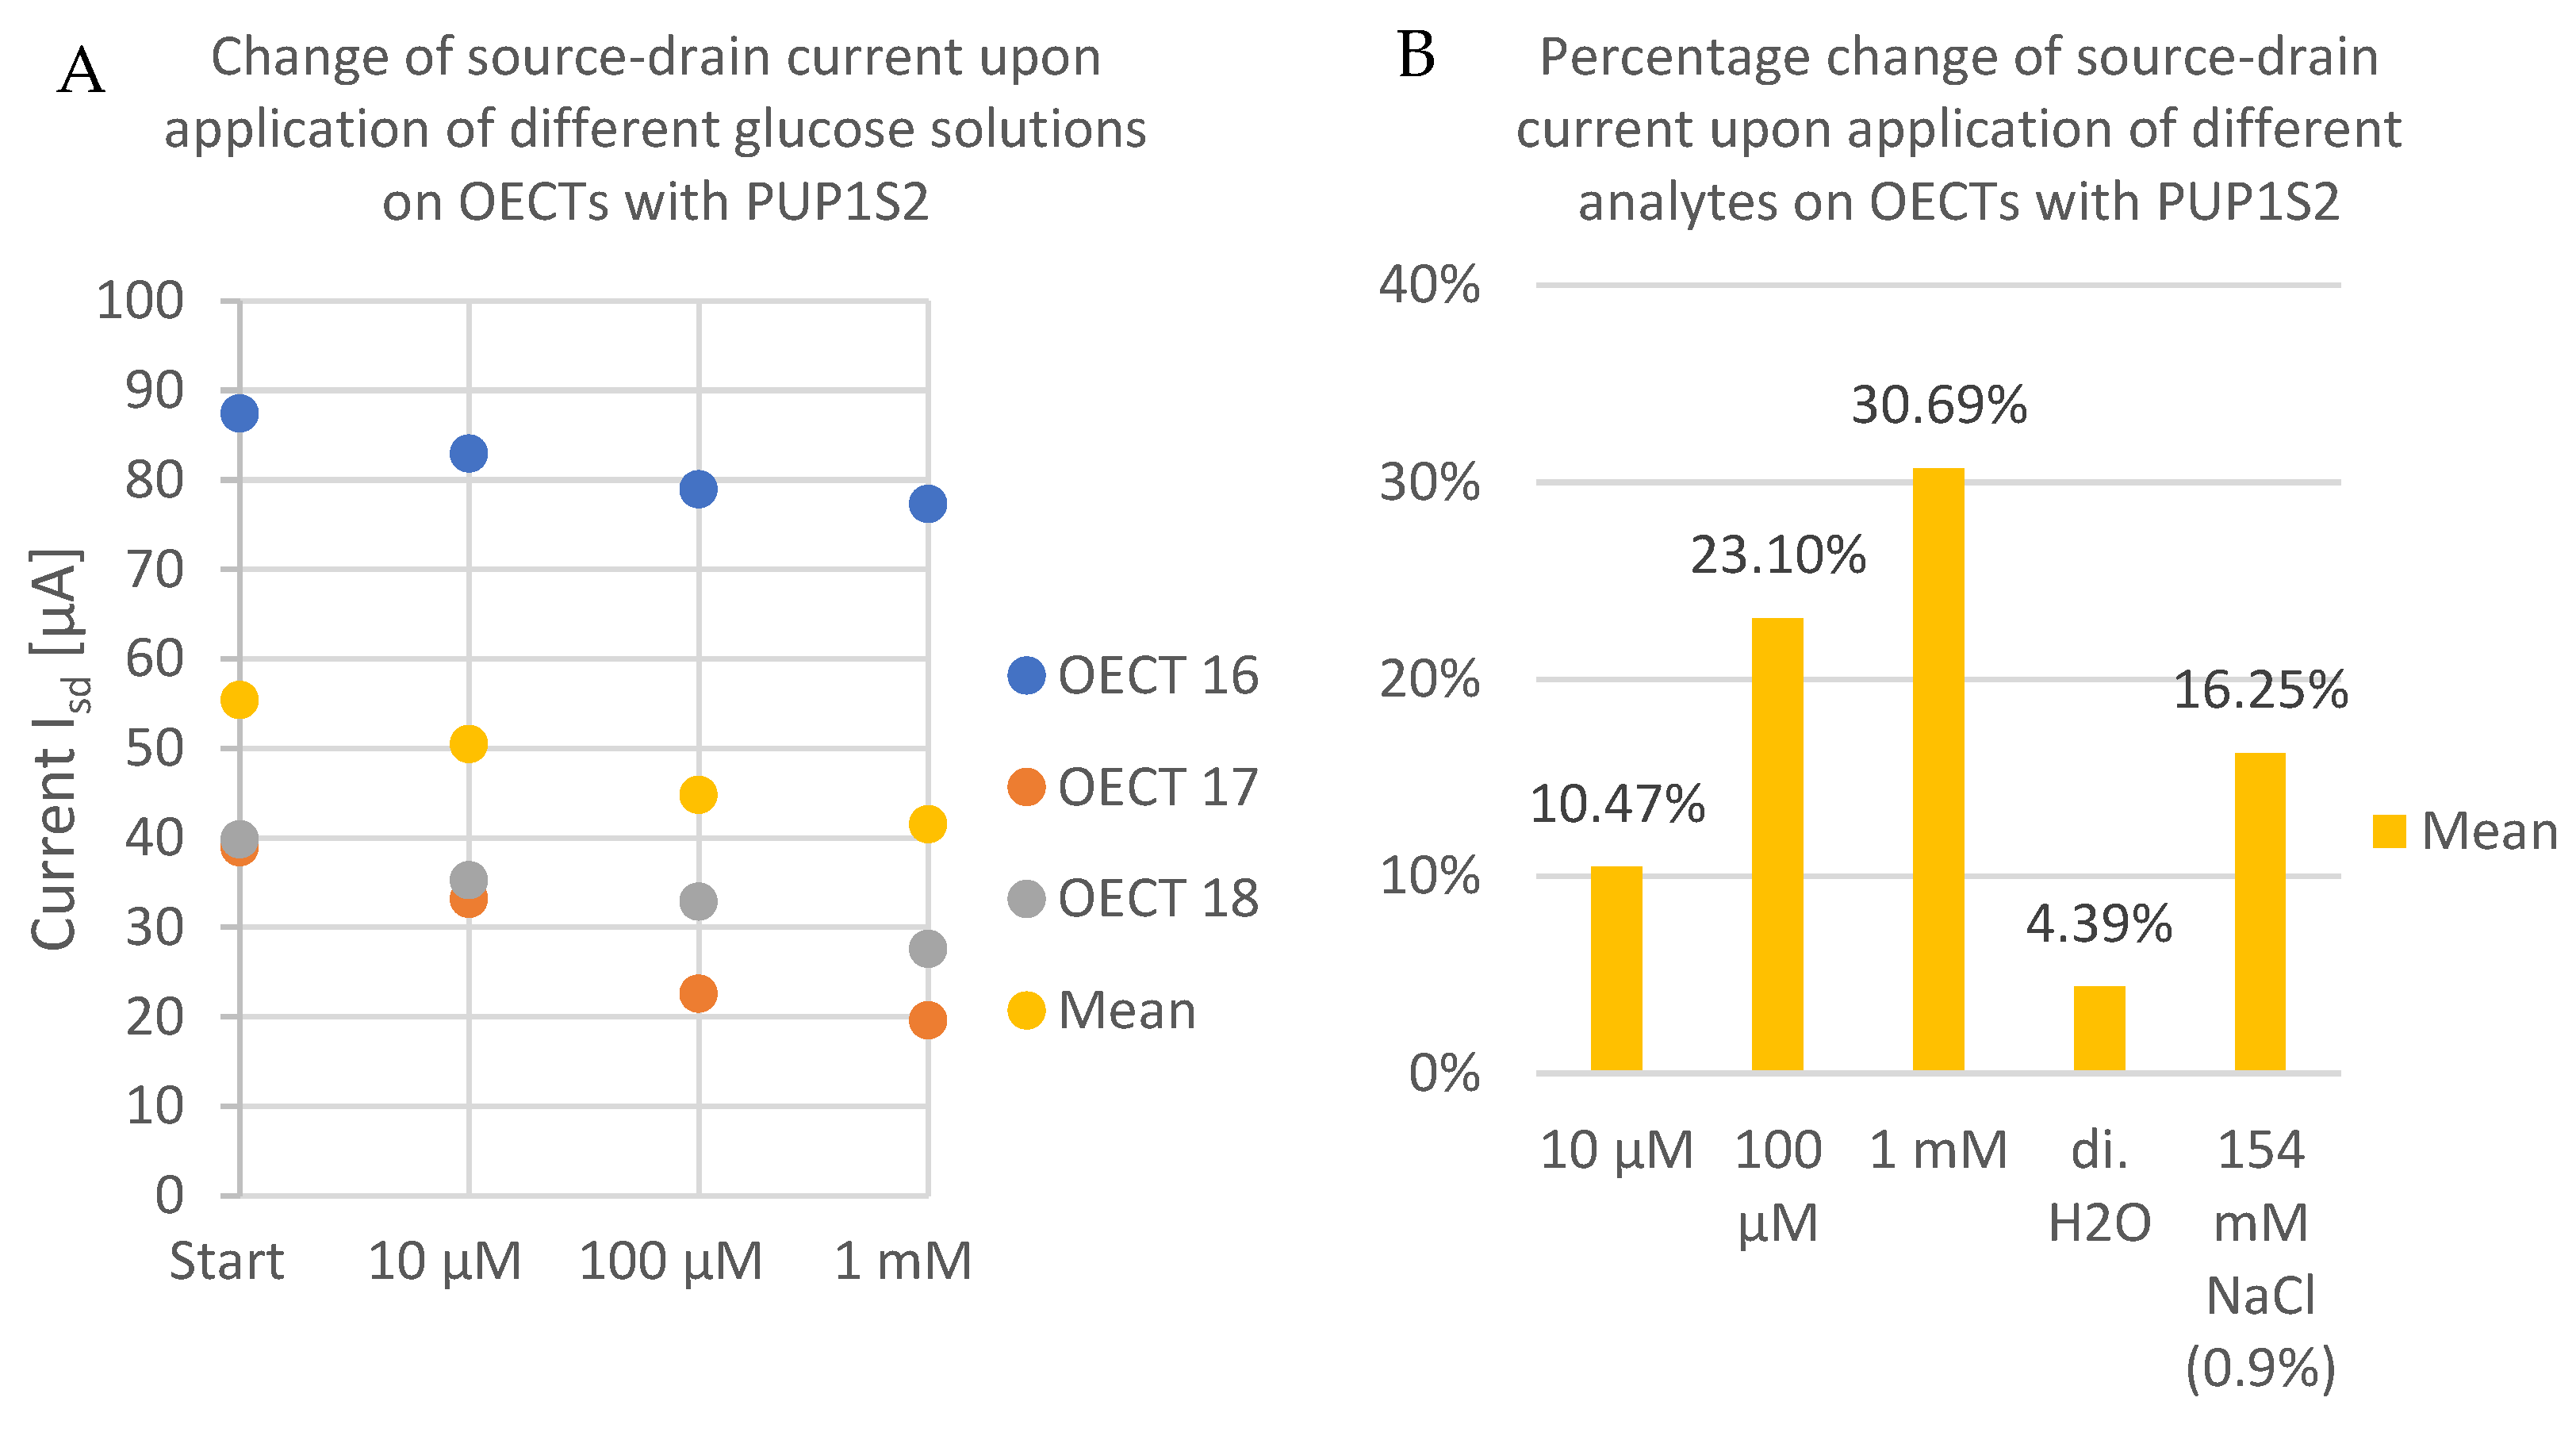
Finally, the detection of glucose was investigated. The measurement set-up involved the constant application of +0.5 Vsd and −0.5 Vg while measuring Isd when solutions with different glucose concentrations (10 µM, 100 µM, 1 mM) were pipetted in an amount of 10 µL to the source-drain electrodes of the OECTs. Various glucose concentrations were sequentially applied with a retention time of 1 min before the next concentration was used. Additionally, in contrast to glucose, simple saline solution (0.9%) as well as di. H2O were applied to the samples. This experimental set-up then allowed statements about the sensing specificity of the OECTs.
4. Discussion
OECTs featuring various porous PEDOT:PSS structures are fabricated according to the procedure outlined by R. Brendgen et al. (2022) [
38]. The assembly process comprises the squeegeeing of an ECG-gel-based electrolyte that is modified with the enzyme
GOx. Small cut-out sections of porous PEDOT:PSS structures are placed within the still liquid electrolyte layer to serve as the source-drain electrode. A slight modification is made to the process compared to R. Brendgen et al. (2022) [
38], wherein two layers of electrolyte are laminated onto the copper–tin-coated fabric (gate electrode). These two layers should ensure the complete separation of gate and source-drain electrode.
Despite the simplicity of the assembly process, potential inaccuracies arise due to the manual handling of the components. These inaccuracies manifest in the measurement of layer thickness of the electrolyte, as depicted in
Figure 4,
Figure 5 and
Figure 6. Factors such as the weight, absorption behavior, and pore size of the PEDOT:PSS structures contribute to these variations. It is plausible that the heavier and more absorbent samples may sink deeper into the moist electrolyte layer, thereby reducing the overall layer thickness.
During application of the analyte solutions, distinct absorption behaviors of porous PEDOT:PSS samples in response to aqueous media were observed. For instance, on NWP2-16, the droplet briefly remains on the surface before slowly penetrating, while on TS1P1-4, the applied droplet is immediately absorbed. Moreover, differences in layer thickness emerge due to the cavities of the ripstop fabric and the pores of the PEDOT:PSS structures being filled with the electrolyte. A potential correlation between pore size and layer thickness is suggested, as OECTs produced with NWP8 exhibit the greatest layer thickness (mean layer thickness: 200 µm) but the smallest pores (mean pore size: 16.4 µm). Conversely, OECTs produced with PUP1S2 have the smallest layer thickness (mean layer thickness: 107.5 µm) but the largest pores (mean pore size: 169.9 µm).
The different absorptive properties, pore sizes, and the perceived weight of PUP1S1-2.5, in addition to manual handling, may collectively explain the observed variations in layer thickness of the electrolyte. While a hypothesis regarding a dependency between pore size, absorption capacity, weight, and layer thickness can be proposed, further comprehensive investigations are necessary to make precise statements and confirm dependencies.
In addition to microscopic examination using SEM, elemental analysis through EDS is conducted, revealing the elemental composition of the OECTs (
Figure 4,
Figure 5 and
Figure 6). This analysis highlights the organic nature of the source-drain electrode and electrolyte in contrast to the inorganic nature of the gate electrode.
For the electrical characterization of the OECTs, a special measurement set-up is implemented. The task of establishing contact between the measurement tips and the porous structures is crucial. Insufficient contact leads to poor measurement data, while excessive force results in the destruction of the porous PEDOT:PSS structures. Lastly, this applies in particular to the OECTs with TS1P4. Their mechanical properties are poor as they tear easily, and this is noticeable when contacting with the pointed measuring tips. Ensuring effective contact between the measuring tips and the PEDOT:PSS structure is particularly crucial for the OECTs featuring PUP1S2, further complicated by the presence of large pores in the structure.
In addition to the contact-related challenges, setting the applied voltage proves to be a delicate process. Achieving precision in the second decimal places is extremely challenging on the voltage sources used, and variations in applied voltage have a notable impact on the resulting current.
Nonetheless, all tested OECTs exhibit typical transistor properties, wherein the current output at the source-drain electrode is controlled by the gate voltage. The OECTs produced in this study operate in depletion mode, signifying that in the absence of a positive gate voltage or when a negative gate voltage is applied, a hole current flows in the channel, leading to an increase in conductivity. However, upon applying a positive gate voltage, positively charged cations are injected from the electrolyte into the channel, recombining with the negatively charged anions of the PEDOT:PSS. This recombination reduces the number of mobile holes in the channel, causing the conductive polymer to become dedoped, and consequently, the drain current decreases (
Figure 11,
Figure 12 and
Figure 13). This reduction in drain current is also reflected in the increased electrical resistance observed when applying a positive gate voltage (
Table 4).
Moreover, this doping and dedoping mechanism manifests in the color of the porous PEDOT:PSS structures. In its reduced state (dedoped), PEDOT:PSS appears in dark blue, while in its oxidized state (doped), PEDOT:PSS appears light blue. This color change is not only visually apparent but also quantifiable through color measurements. The color change is particularly pronounced in the OECTs with NWP8, displaying dark blue at +1.0 V
g and light blue at −1.0 V
g, representing a distinctly different color perception. These OECTs exhibit the largest
ΔE, followed by those from PUP1S2 (
Table 3). A stronger color change correlates with greater variation in current output upon application of different gate voltages. OECTs 1–3 (NWP8) exhibit a mean change of 18.08 orders and a mean
ΔE of 10.73. In contrast, OECTs 4–7 (TS1P4) show a 3.27-fold change and a
ΔE of 1.93.
The OECTs exhibit significant variations in output signal. OECTs 4–6 (TS1P4) display the highest current values, yet they demonstrate the lowest magnitude of change. OECTs made from PUP1S2 (OECT 7–9) show the lowest current and OECTs made from NWP8 (OECTs 1–3) exhibit the highest magnitude of change. On the one hand, these differences can be explained looking at the electrical resistance measurement of the sole porous PEDOT:PSS structures (
Table 1). PUP1S2 (64.42 kΩ) exhibits significant higher electrical resistance than samples TS1P4 (0.9 kΩ) and NWP8 (0.102 kΩ). A high electrical resistance implies diminished conductivity, resulting in a reduced flow of current between source and drain electrode and can explain the low current output of the OECTs made from PUP1S2. However, the electrical resistance cannot be used to explain the differences between OECTs of TS1P4 (OECTs 4–6) and NWP8 (OECTs 1–3). Once again, explanations for the different current output of those samples could be found in the different absorption behavior of the porous PEDOT:PSS structures. Assuming that PEDOT:PSS structures produced from puffy printing paste (TS1P4) exhibit a higher absorption behavior and sink deeper into the electrolyte solution, would enrich the porous PEDOT:PSS structure with electrically conductive ions, thus enhancing conductivity. This hypothesis would also explain the comparatively few changes upon application of the gate voltage. When applying a positive gate voltage, positively charged cations are injected from the electrolyte into the channel; however, this channel is presumably already quite saturated.
Finally, the electrolyte is modified with the enzyme glucose oxidase (GOx) to impart specificity. OECTs are subsequently tested under constant Vg and Vsd with the addition of various analytes, including differently concentrated glucose solutions, 0.9% saline solution (NaCl), and distilled water (di. H2O). The experimental results demonstrate that the electrolyte modification enables the transistors to be employed for the detection of substances dissolved in body fluids. With the exception of OECTs 7–9, all OECTs exhibit a stronger response to glucose solutions compared to 0.9% NaCl or di. H2O. These higher responses can be attributed to an oxidation reaction that is stimulated by the presence of GOx. In essence, the addition of glucose to the GOx-containing electrolyte leads to the oxidation of glucose to hydrogen peroxide (H2O2). The oxidation of H2O2 is catalyzed at the gate electrode, further reducing the PEDOT:PSS channel, and this reduction is proportional to the glucose concentration.
The variations in current output among OECTs with diverse PEDOT:PSS electrodes relate to the distinct electrical performance characteristics outlined in
Figure 8,
Figure 9,
Figure 10,
Figure 11,
Figure 12 and
Figure 13. However, their percentage change when exposed to different analytes is within the same order of magnitude for all OECTs. In this experiment, as already mentioned, variations in absorption behavior are observed when pipetting the analytes onto the porous PEDOT:PSS structures. This causes different reaction times of the OECTs, so that an exposure time of 1 min is assigned. OECTs 1–3 (NWP8) exhibit the slowest absorption behavior, with the droplet remaining on the surface for a while before slowly sinking in.
In summary, the incorporation of diverse porous PEDOT:PSS structures [
44] into OECT proves to be straightforward, serving effectively as a semi-conducting source-drain electrode. The properties of these porous PEDOT:PSS structures, along with their integration in the transistor (specifically the distance between the gate and source-drain electrode equaling the thickness of the electrolyte layer), play a significant role in determining the device properties. Their porosity allows for the penetration of aqueous media, facilitating the detection of analytes.
With the deployment of
GOx in the electrolyte, it is demonstrated that specificity for detecting various body fluids can be achieved. The developments outlined herein exhibit substantial potential for non-invasive monitoring of substances dissolved in body fluids. However, essential points need to be addressed in future studies. It is important to note that textile-based devices, such as the ones explored here, face unique challenges related to washability. As highlighted in previous studies [
45], textile cleaning can negatively affect the longevity of smart textiles, hindering their long-term viability. Maintaining sensor sensitivity over time, especially under the rigors of daily use and potential exposure to washing processes, poses a significant challenge for long-term practicality. Ensuring adequate sensitivity and robustness, particularly when detecting glucose levels in sweat, is essential.
Moreover, one of the critical aspects to emphasize in sensor development is achieving the required sensitivity for practical application, particularly in alternative measurement methods such as the textile-based OECTs proposed here. Glucose concentrations in sweat, as noted, tend to be significantly lower than in blood, often in the range of 10–1000 µM. Thus, sensors must be finely tuned to detect concentrations in this range. In future work, also achieving a detection limit below 10 µM should be investigated, as this would enable precise glucose measurement, especially in low-sweat conditions, making it more suitable for practical applications. Additionally, the non-linear relationship between sweat and blood glucose levels complicates data interpretation. Sensors must, therefore, account for potential temporal discrepancies and time lags between these biological fluids, which may require innovative data processing methods to ensure accurate health monitoring. Given the critical nature of diabetes monitoring, accuracy and precision are essential, with acceptable deviations of ±10–15% according to DIN EN ISO 15197 [
46] from actual glucose concentrations similar to those seen in conventional blood glucose meters. Additionally, the complexity of sweat as a biological fluid, containing electrolytes, proteins, and varying pH levels, introduces potential interferences that must be addressed in the design of the sensors to prevent cross-sensitivity and ensure reliability. Overcoming these interference challenges is crucial for developing reliable glucose monitoring systems based on sweat analysis.


