Abstract
This study presents an innovative lateral flow microfluidic paper-based analytical device (μPAD) designed for conducting quantitative paper-based enzyme-linked immunosorbent assays (p-ELISA), seamlessly executing conventional ELISA steps in a paper-based format. The p-ELISA device utilizes a passive fluidic circuit with functional elements such as a multi-bi-material cantilever (B-MaC) assembly, delay channels, and a buffer zone, all enclosed within housing for autonomous, sequential loading of critical reagents onto the detection zone. This novel approach not only demonstrates a rapid assay completion time of under 30 min, but also boasts reduced reagent requirements, minimal equipment needs, and broad applicability across clinical diagnostics and environmental surveillance. Through detailed descriptions of the design, materials, and fabrication methods for the multi-directional flow assay (MDFA), this manuscript highlights the device’s potential for complex biochemical analyses in a user-friendly and versatile format. Analytical performance evaluation, including a limit of detection (LOD) of 8.4 pM for Rabbit IgG, benchmarks the device’s efficacy compared to existing p-ELISA methodologies. This pioneering work lays the groundwork for future advancements in autonomous diagnostics, aiming to enhance global health outcomes through accessible and reliable testing solutions.
1. Introduction
The development of microfluidic paper-based analytical devices (μPADs) has marked a significant evolution in the field of diagnostics, offering accessible, affordable, and accurate tools for point-of-care testing. These devices, exemplified by the widespread use of home pregnancy tests and rapid COVID-19 diagnostics, leverage the principles of microfluidics to facilitate rapid, on-site health assessments without the need for sophisticated infrastructure or highly skilled personnel [1,2]. Utilizing the gold nanoparticle (AuNP) lateral flow immunoassay (LFIA) method, these assays allow for the colorimetric detection of various analytes, showcasing the effectiveness of rapid diagnostics. Despite their versatility, μPADs traditionally fall short in automating complex, multi-step assays such as ELISAs, which require precise control over reagent delivery [3]. The inclination towards paper-based enzyme-linked immunosorbent assay (p-ELISA) over lateral flow immunoassay (LFIA) is driven by the former’s enhanced specificity and quantifiability [4,5]. While LFIAs offer the advantage of rapid, qualitative results, p-ELISA extends this by enabling the quantification of analyte concentrations crucial for disease diagnostics and management, where the magnitude of response is as significant as the presence of the analyte itself. This quantitative capability, combined with the cost-effectiveness and portability of μPADs, positions p-ELISA as a superior choice for a broader range of diagnostic applications, catering to the growing demand for more informative and precise point-of-care testing solutions.
The integration of μPADs with enzyme-linked immunosorbent assays (ELISAs) represents a novel approach that combines the high sensitivity and specificity of ELISA with the portability and affordability of paper-based systems [6]. Paper-based platforms have emerged as a compelling alternative to conventional methods, offering distinct advantages in terms of scalability and usability [7,8]. Initial studies on p-ELISA techniques showcased their potential for detecting biomarkers, such as C-reactive protein (CRP), which is pivotal in diagnosing neonatal sepsis and inflammatory bowel diseases [6,7,8,9]. Further innovation led to an optimized paper-based ELISA that could effectively detect E. coli, a common foodborne pathogen, demonstrating its versatility in detection and broader applications, such as food safety [10,11]. The utility of these devices is not confined to biochemical assays alone. For instance, various types of paper-based analytical devices have shown promise in applications such as clinical analysis and humanitarian aid [12,13]. Furthermore, the application of μPADs extends beyond infectious disease diagnostics to the monitoring of environmental pollutants and the assessment of food safety, illustrating the versatility of this technology [14,15].
In the quest for automation of diagnostic devices, several studies have ventured into advanced valve technologies. We developed and modeled one such advancement: the use of bi-material cantilever (B-MaC) valves that allow autonomous control over fluid flow in p-ELISA systems [16,17,18]. Fluid flow delay mechanisms using absorbent pad-based shunts have shown great promise in achieving reproducible delays for sequential fluid delivery [19]. Moreover, μPADs integrated with shape-memory polymer (SMP)-actuated valves have successfully demonstrated multi-step ELISAs, emphasizing the progress towards reliable and accurate diagnostic platforms [20]. Most recently, the incorporation of hydrophobic wax barriers has been investigated as a flow-control mechanism to enable multistep analysis on μPADs [21,22]. Our previous research groups developed and utilized fluidic diodes and wax valves, enabling the transformation of traditional lateral flow immunoassays into multi-step, semi-autonomous assays [23,24]. This motivated a recent study to introduce an automated, one-step ELISA with wax-printing on nitrocellulose, requiring a significant sample volume for assay conduction [25]. Precise fluid actuation has also been introduced, using a timing-valve mechanism to regulate fluid flow in multiple channels, automating complex assays such as competitive ELISAs [26]. The numerical and experimental analysis of fluidic systems in µPADs, including the examination of fluid flow and the modeling of paper-based actuators, provides insights for the optimization of the design and function of these devices [27,28].
The use of rabbit IgG as a model analyte is imperative in the development of paper-based assays, due to its well-characterized immune response, facilitating accurate and reliable evaluation of the system’s capability for autonomous operation [17,20,23,29,30]. From these studies, the detection limit for rabbit IgG using the p-ELISA method is reported to range from 1.016 μg/mL to 2.27 ng/mL. Additionally, gold–platinum nanoflowers (AuPt NFs) in lateral flow immunoassays (LFIA) have been shown to achieve a detection limit for rabbit IgG of 5 pg/mL under optimized experimental conditions, representing a 100-fold improvement over the conventional gold nanoparticle (AuNP)-based LFIA [31]. Furthermore, enzyme–antibody-modified gold nanoparticle probes utilizing rabbit polyclonal antibodies have demonstrated a remarkable detection limit of 0.9 pg/mL [32], significantly exceeding the sensitivity of traditional plate-based ELISA methods, which typically have a sensitivity of around 230 pg/mL [33].
In this complex landscape, a multitude of variables affect the ELISA process when conducted in uncontrolled environments, including temperature and humidity, alongside the characteristics of the paper substrate used [16,18,28]. To ensure quantitative work is effective in the field or at home, the integration of housing and a reader is essential. The housing provides a controlled environment for the diagnostic test, and the reader’s incorporation of digital image analysis and quantification techniques further enhances the functionality of paper-based diagnostics, enabling the accurate measurement of analyte concentrations directly from the device [34,35].
To advance the μPAD technology for quantitative ELISA, our approach introduces a pivotal innovation: the integration of a multi-B-MaC assembly aimed at meticulously controlling fluid dynamics. This innovation facilitates the autonomous sequential introduction of a wash solution, a substrate, and a stop solution, enabling us to conduct ELISA in a paper-based format. Such an advancement sets our device apart, imbuing it with a degree of control and automation previously unseen in the domain of paper-based diagnostic platforms, thereby enhancing its applicability and user-friendliness. Along with the housing, it incorporates all necessary reagents, facilitating on-site diagnostics without the need for extensive laboratory infrastructure. The significance of this work extends beyond technical achievements; by integrating traditional ELISA techniques with state-of-the-art microfluidic innovations in a multi-directional flow assay (MDFA) format, we have developed a device that operates without onboard power. In comparison, other devices either lack automation or, if automated, require external power sources to operate, whereas our device not only meets the immediate needs of low-resource settings, but also establishes a new standard for the future of diagnostics.
This study introduces the inaugural microfluidic paper-based device capable of autonomously performing quantitative ELISA in under 30 min, a critical feature for maintaining the efficacy and relevance of point-of-care testing (POCT). It offers a cost-effective, rapid, and sensitive alternative that is suitable for field applications, overcoming the limitations of conventional diagnostic methods that rely on complex infrastructure and skilled personnel. The manuscript meticulously outlines the device’s design, materials, and fabrication methods for the p-ELISA platform and evaluates its performance rigorously using rabbit IgG as a test analyte. By facilitating complex biochemical analyses, including pathogen and biomarker detection, in a user-friendly and adaptable manner, the device showcases its wide-ranging potential for clinical diagnostics and environmental monitoring.
2. Materials and Methods
This section details the fabrication of a state-of-the-art device featuring a p-ELISA assay, a significant advancement in microfluidic technology for biomolecular assays. Central to this platform is MDFA, which ensures precise multi-directional fluid patterns, a buffer zone to prevent co-axial flow of reagents, and delay channels that meticulously control fluid timing, which is essential for accurate sequential reagent loading and reaction kinetics. This section provides an in-depth look at the materials, construction processes, and methods employed to optimize the functionality and efficiency of these key components, which collectively enhance the accuracy and effectiveness of the p-ELISA platform.
2.1. Materials
To fabricate the p-ELISA platform, as illustrated in Figure 1, we employed Whatman filter paper grade 4 (GE Healthcare 1004917), blotting paper GB003 (GE Healthcare, 10547922), and a nitrocellulose membrane (REF 88025), all of which were supplied by Thermo Fisher Scientific (Waltham, MA, USA). Additionally, glass fiber conjugate pad strips (GFCP103000) were sourced from Millipore Sigma (Burlington, MA, USA).
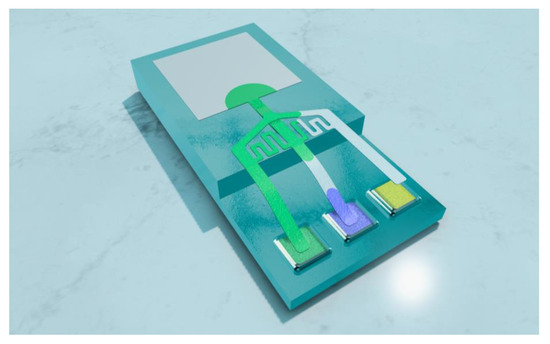
Figure 1.
The p-ELISA platform demonstrating sequential loading of reagents.
The assembly process was facilitated with the use of 0.010 inch thick backing cards from DCN (Carlsbad, CA, USA). ASTM Type 1 deionized water, characterized by high resistivity and procured from LabChem-LC267405 (Zelienople, PA, USA), served as the activation fluid. The design and planning of sub-assemblies were conducted using CorelDraw X6 2022 v24.1 and Shapr3D v5.552.0. Precise cutting was accomplished with an Epilog Mini 40 W 800 laser system and an X-ACTO guillotine cutter. The fluid flow dynamics of the assay were meticulously recorded and analyzed using an 8 megapixel video camera, capturing 30 frames per second. For playback and data acquisition, Avidemux 2.8.1 was utilized.
To conduct the ELISA, the following reagents were obtained from Thermo Fisher Scientific (Waltham, MA, USA): rabbit IgG isotype control (REF 02-6102), SuperBlock™ T20 (TBS) blocking buffer (REF 37543), Invitrogen™ phosphate-buffered saline (PBS) (REF AM9624), hydrochloric acid (HCl) (REF A144-212), D-trehalose dihydrate (REF A19434.14), and Sucrose (REF J65148.36). The immobilized capture antibody, monoclonal mouse anti-rabbit IgG (γ-chain specific) (SKU R1008-.5ML), was acquired from Millipore Sigma (Burlington, MA, USA). The detection antibody, mouse monoclonal [SB62a] anti-rabbit IgG light chain labeled with alkaline phosphatase (ab99696), was procured from Abcam® (Waltham, MA, USA). The chromogenic substrate for the alkaline phosphatase label, 5-bromo-4-chloro-3-indolyl phosphate (BCIP)/nitro blue tetrazolium (NBT) (SKU 90537-0100), was purchased from Scripps Laboratories (San Diego, CA, USA).
The device housing was 3D-printed using a CREALITY K1 Max 3D Printer. Specifications included a maximum power of 1000 W and employed a PLA+ filament of 1.75 mm diameter, with a printing speed of 30–70 mm/s, at temperatures between 190–230 °C. Slicing for printing was managed using Ultimaker Cura software, ensuring precise fabrication to meet the exact requirements of the housing design.
2.2. Fabrication of Assay
The fabrication process of the LOP multi-directional flow assay (MDFA) for p-ELISA involved several critical steps designed to integrate the various components into a cohesive and functional assay platform. This section outlines the methodology employed to construct the device and ensure it met the necessary criteria for effective antigen detection and analysis.
2.2.1. Design and Layout
The design of the microfluidic device was conceptualized using Shapr3D software, focusing on creating a multi-directional flow pattern to optimize reagent flow and interaction with the target analyte. The layout includes multiple B-MaCs (C1, C2, and C3), assembled to enable an autonomous assay, designated zones for sample application, assay activation, reagent pads (R1, R2 and R3), and a detection zone, along with other functional components such as loading zones (L1, L2, and L3), delay channels (D1, and D2), and a waste pad, as illustrated in Figure 2.
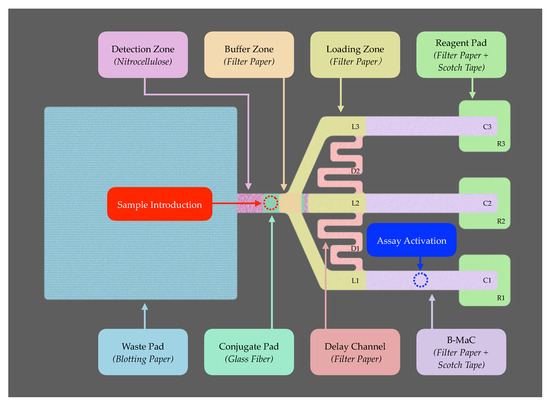
Figure 2.
Design layout and materials utilized in p-ELISA platform fabrication.
The B-MaC utilizes Whatman filter paper Grade 4, chosen for its fast flow characteristics, which are critical for minimizing flow timing throughout the assay. This filter paper is also employed in other components of the system, such as the delay channels, loading zones, reagent pads, and buffer zone to maintain uniformity in fluid flow across the assay. The detection zone is fabricated from a nitrocellulose membrane, favored for its uniform pore structure, which enhances antibody immobilization and ensures even fluid distribution, crucial for achieving reliable and sensitive detection. The conjugate pad is constructed from a glass fiber, selected for its high surface area, excellent capillary action, and chemical inertness. These properties are essential for the efficient immobilization and subsequent release of detection antibodies, thereby facilitating the assay’s sensitivity and specificity. Lastly, the waste pad is made from blotting paper, known for its high absorption capacity. It serves as a micro-pump within the assay, supporting a continuous and controlled fluid flow through the device.
The design aims for an autonomous assay capable of performing ELISA on paper, where the user only needs to pipette the sample and activate the assay, with no further intervention required. Results are obtained within 30 min, to meet the POCT timing requirements for an LOP device. To achieve this, the design minimizes the distance between these zones and optimizes the use of reagents to reduce assay time and enhance sensitivity.
2.2.2. Antibody Immobilization and Reagent Storage
The antibodies were prepared and passively adsorbed onto the designated areas of fabricated sub-assemblies, as illustrated in Figure 3. The capture antibody was immobilized at the detection zone, while the enzyme-tagged detection antibody was loaded onto the conjugate pad to facilitate sequential deployment during the assay. Both capture and detection antibodies were immobilized on the respective nitrocellulose membrane and conjugate pad, with previously optimized concentrations [17,23].
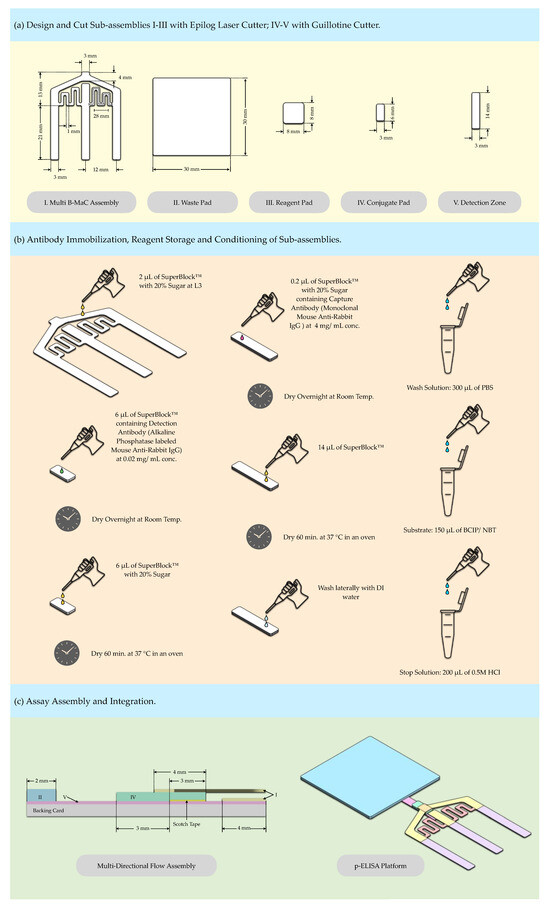
Figure 3.
Preparation of p-ELISA platform. (a) Fabrication; (b) Conditioning; (c) Assembly.
The capture antibody, monoclonal mouse anti-rabbit IgG, at a concentration of 4 mg/mL, contained in 0.2 μL of superblock with 20% sugar (10% D-trehalose and 10% sucrose), was dispensed at the desired location of the high-flow nitrocellulose membrane (3 mm × 14 mm) by a 10 μL micro-syringe, with a least count of 0.1 μL, and stored overnight at room temperature for conditioning steps. For loading of the conjugate pad, 6 μL of superblock containing the detection antibody, mouse anti-rabbit IgG labeled with alkaline phosphatase, at a concentration of 0.02 mg/mL, was pipetted onto the conjugate pad (6 mm × 3 mm) and stored overnight at room temperature for the conditioning steps.
Three reagents: 300 μL PBS solution, 150 μL BCIP/NBT substrate, and 200 μL of 0.5 N HCl acting as a stop solution for the assay, were prepared and temporarily stored in vials at room temperature until their release onto the reagent pad, contingent upon the activation of the release mechanism.
2.2.3. Paper Conditioning
The nitrocellulose membrane, immobilized with the capture antibody, was treated with 14 μL of superblock solution and dried at 37 °C for 60 min in an oven. After drying, the membranes were washed laterally with deionized (DI) water and subsequently air-dried at room temperature. The nitrocellulose membrane, chosen for its high protein-binding affinity, serves as the optimal substrate for the immobilization of the capture antibody, ensuring efficient and stable antibody attachment.
Simultaneously, the conjugate pad, infused with the enzyme-tagged detection antibody, was treated with 6 μL of superblock containing 20% sugar (10% D-trehalose and 10% sucrose) and similarly dried at 37 °C for 60 min in an oven. This procedure was essential to preserve the functionality and stability of the detection antibody, facilitating effective interaction with the target analyte during the assay. It is crucial to pre-cut both the nitrocellulose and conjugate pad using a guillotine cutter to maintain the integrity of the materials, as exposure to heat from the laser cutter can compromise their material properties.
Following these steps, the Whatman Grade 4 filter paper and blotting paper were precisely cut to the required dimensions using an Epilog laser cutter, as illustrated in Figure 3a. In addition, the loading zone (L3), as illustrated in Figure 3b, is subject to a modification step. This is achieved by pipetting 2 μL of superblock solution with 20% sugar (10% D-trehalose and 10% sucrose) directly onto it. This step further optimizes the device’s functionality, fluid management, and assay accuracy.
2.2.4. Lamination and Integration
Following conditioning, the sub-assemblies, including the conjugate pad and nitrocellulose membrane, were assembled in layers onto the backing card, as illustrated in Figure 3c. They were partially laminated using tape to create a sealed environment that prevents the delamination of the layers when exposed to fluidic loading and helps prevent evaporation. The conjugate pad was integral to the sample application zone, preconditioning the glass fiber to enhance fluid flow and distribution into and across the detection zone.
This fabrication process underscores the intricate balance between material selection, chemical modification, design precision, and functional integration required to develop a lab-on-paper microfluidic device for p-ELISA. Through careful optimization of each step, the developed device promises to offer a rapid, sensitive, and user-friendly platform for the detection of pathogens and biomarkers in diverse settings.
2.3. Multi-Directional Flow Assay
Lateral flow assays (LFAs) primarily employ capillary action to facilitate the unidirectional flow of sample fluids through a set of reactive zones, culminating in a visual outcome that signifies the presence or absence of the target analyte. However, the conventional LFA model, despite its widespread application and success, is limited by its unidimensional flow path, which can restrict the assay’s capability for complexity.
Our device significantly innovates upon the traditional LFA framework by implementing a multi-directional flow assay (MDFA) methodology. Figure 4 illustrates the MDFA setup, highlighting the flow directions within the bi-material cantilever (B-MaC) assemblies in the x and y planes, along with the delay channels that regulate the timing of reagent delivery to the detection zones. At the junction, specifically at the buffer zone, conjugate pad, and the nitrocellulose membrane, the flow diverges into the z-direction, enabling the interaction of the wash fluid, sample, and the detection antibody. Red lines indicate flow direction in the x-axis, green lines show the flow in the y-axis, and blue lines denote the flow in the z-axis. Additionally, the yellow lines represent flow within the x–y plane.
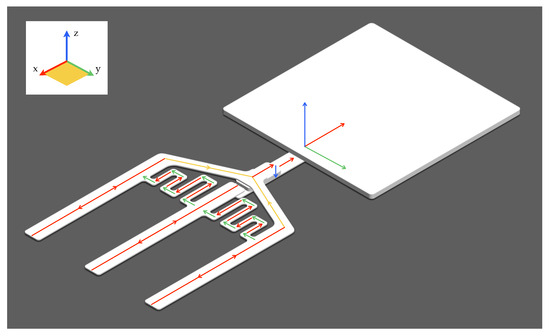
Figure 4.
Multi-directional flow assay (MDFA) configuration with flow direction indicators.
The flow within the B-MaC assemblies (C1, C2, and C3) is primarily horizontal (x-axis), while the flow in the delay channels (D1 and D2) is intricately designed to move in both horizontal (x and y-axis) and vertical (z-axis) directions. This vertical flow crucially promotes interactions between layers at key points, such as the buffer zone, conjugate pad, and nitrocellulose membrane, enhancing the system’s operational efficiency and sensitivity. The MDFA optimizes the paper-based assay’s operational dynamics by creating a more direct path for the substrate solution (R2) to be applied onto the nitrocellulose, circumventing the conjugate pad, which traditionally slows down the flow. This adjustment significantly accelerates the assay process. This innovative adaptation of MDFA presents a substantial enhancement over traditional LFAs, offering a more dynamic and rapid platform for point-of-care diagnostics.
2.4. Paper-Based Assay Performing ELISA
ELISA, an essential analytical method in biomedical research, food allergen testing, and toxicology, typically employs microplates and is designed for high-throughput applications [36]. However, this traditional approach requires significant volumes of analytes and reagents (200–300 μL per well), faces long incubation times, and necessitates costly quantification equipment. In contrast, p-ELISA provides a cost-effective, portable alternative that relies on colorimetric detection of antigen–antibody interactions, facilitated by enzyme-linked conjugates and substrates. This innovative approach aims to reduce the required reagent volumes without sacrificing assay efficacy, making it especially suitable for POC applications.
Figure 5 illustrates the four fundamental steps for autonomous ELISA execution on paper. Step (a) requires an initial sample introduction at the conjugate pad by an untrained user, before the activation of the assay via DI water. The sample interacts with the immobilized enzyme-tagged detection antibody to form an antigen–antibody complex [(rabbit IgG)–(ALP-conjugated mouse anti-rabbit IgG)], until the system is initiated by the first cantilever (C1), which releases the wash solution (PBS) upon being triggered by the DI water. Step (b) involves the wash moving the antigen–antibody complex from the conjugate pad to the detection zone, to form an antibody–antigen–antibody complex [(mouse anti-rabbit IgG)–(rabbit IgG)–(ALP conjugated mouse anti-rabbit IgG)], consistent with the sandwich ELISA principle, where the antigen is sandwiched between the capture and detection antibodies. Simultaneously, a portion of this wash solution navigates through a delay channel (D1) to activate the second cantilever (C2). Step (c) facilitates the release of a substrate (BCIP/NBT), which interacts with the enzyme-tagged detection antibodies upon reaching the detection zone, resulting in a color culmination characterized by a precipitate. The intensity of this coloration at the detection site serves as a quantifiable metric and is directly proportional to the antigen concentration in the sample. Step (d) sees another fraction of the wash solution advancing through the delay channel (D2) to trigger the third cantilever (C3), initiating the release of the stop solution (HCl) towards the detection zone, effectively terminating the enzyme–substrate reaction. This action serves two critical functions: first, it enhances the test’s specificity by setting a definitive reaction time. Second, it reduces background noise by washing away non-specifically bound proteins and any remaining unbound detection antibodies, resulting in a clearer signal at the detection zone. These improvements contribute to the assay’s overall accuracy, offering a more reliable and precise diagnostic output.
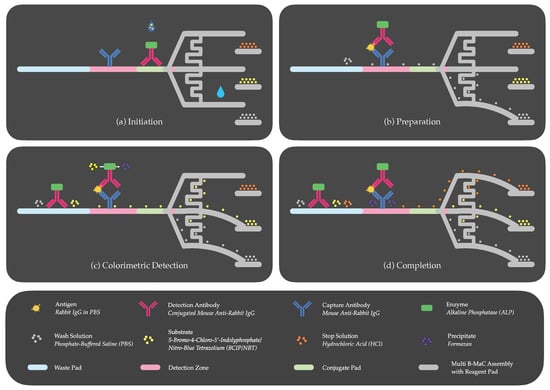
Figure 5.
Sequential steps of autonomous p-ELISA: (a) initiation: activation of the first cantilever by activation fluid after introducing sample; (b) preparation: loading of wash solution onto the first cantilever; (c) colorimetric detection: activation of the second cantilever for substrate loading; (d) completion: activation of the third cantilever for loading of stop solution.
2.5. Assay Housing
The housing for the p-ELISA platform was meticulously developed to support the platform and its ancillary components, ensuring the effective execution of point-of-care testing under controlled conditions, unaffected by environmental or external factors. It plays a crucial role in reducing operational errors when the device is used for biological detection. The initial design included the p-ELISA platform itself, reagent storage vials, a housing cap, and plexiglass windows to monitor assay operations. Given the importance of loading multiple reagents for biological detection, the housing facilitates sequential loading and detection of assays involving three reagents. It accomplishes this by providing a sealed environment that prevents external interference, thereby ensuring the integrity of the testing process. Previous research underscores the vital design considerations necessary for the functionality of the cantilever design [16,17,18].
The geometric dimensions of the proposed platform, illustrated in Figure 6, provide a precise footprint of the device, illustrating its overall size and layout. As shown, the platform encompasses various components: the housing cap, housing-base, release mechanism, reagent storage vials, p-ELISA platform, desiccant pad compartment, and the viewing window. The design of this platform facilitates the autonomous execution of complex, multi-step chemical or biological assays, requiring human input only for the sample and activation fluid introduction.
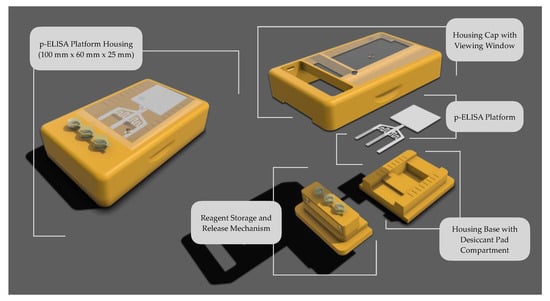
Figure 6.
Schematic representation of housing integrated with p-ELISA Platform.
2.5.1. Reagent Storage and Release Mechanism
Figure 7 illustrates the components of a cartridge-based reagent storage and release mechanism designed for user-assisted, efficient dispensing of reagents. This mechanism, an improvement on prior individual release systems [17], consolidates operations to enhance functionality. Reagents are stored within vials in defined quantities and placed on a vial rack. Activation occurs when the user applies pressure to the vials, which, in turn, are punctured by a release pin. Once punctured, the vial rack is retracted with the help of release springs, creating an unrestricted pathway for the reagent to flow onto the respective reagent pads. These pads temporarily hold the reagents until the assay is initiated, at which point the analytical process commences.
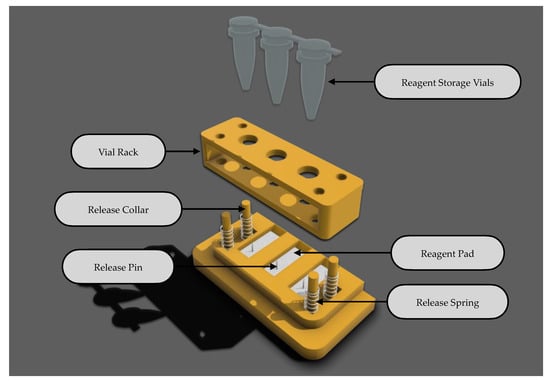
Figure 7.
Cartridge-based reagent storage and release mechanism.
2.5.2. Housing Cap and Viewing Window
The housing cap provides a secure lid for the p-ELISA device, isolating it from the diagnostic environment to maintain a controlled internal space for testing. This isolation is crucial for protecting the device from variations in humidity and mild temperature from the surroundings. As depicted in Figure 8a, the top view of the housing showcases the viewing window—a vital component featuring dedicated sample and activation ports. The sample port allows the introduction of a biological sample by the user, while the activation port is used to initiate the assay for autonomous detection. In addition to its functional purposes, the top glass window permits users to observe the assay and visually detect the signal once it has formed at the detection zone, potentially with the naked eye.
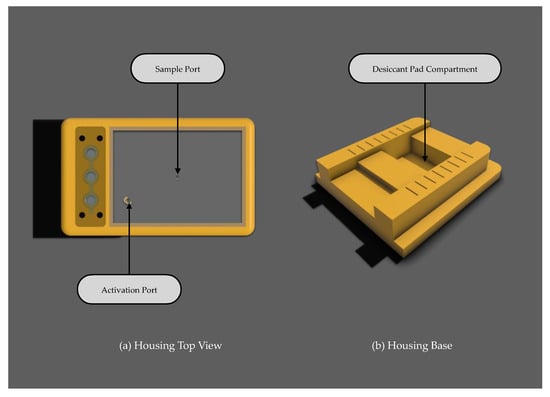
Figure 8.
Other components: (a) housing top view with sample and activation port; (b) housing base with integrated desiccant pad compartment for humidity control.
2.5.3. Housing Based with Desiccant Pad Compartment
The housing base serves as the foundation for the p-ELISA platform, incorporating a compartment beneath for a desiccant pad, as illustrated in Figure 8b. Prior studies [16,18,27,28] have highlighted the impact of humidity on assay functionality. Therefore, a dedicated compartment for a desiccant pad has been integrated to mitigate sudden increases in humidity within the housing after reagent dispensation. The effectiveness of the desiccant pads has not yet been empirically tested; however, this feature is envisioned as a critical component for future iterations of the device. Its purpose is to actively control the microenvironment, ensuring consistent assay conditions, thus preserving the integrity of the reagents and the accuracy of the results.
Moreover, the 3D-printed housing and its components contribute to the device’s portability and user-friendliness, enhancing its suitability for point-of-care diagnostics. An exploded view of the lab-on-paper device, as illustrated in Figure 6, details the key components and their arrangement, offering insight into the device’s functional and structural design.
2.6. Assay Analytical Performance Evaluation
The final phase of the study involved assessing the analytical capabilities of the device, utilizing rabbit IgG as a benchmark analyte. The process began with the application of the sample solution onto the sample port and the initiation of the assay through the activation port using DI water, followed by the autonomous sequential loading of the wash buffer, substrate, and stop solution. Following the assay’s conclusion, the device is opened to remove the assay for analysis. A desktop scanner is then used to scan the assay at 600 DPI resolution. The intensity within the signal zone is analyzed using ImageJ software. This zone, situated in the middle of the nitrocellulose membrane and indicated by a yellow circle in Figure 9, is the focal point for measuring color intensity for the rabbit IgG tests in this study. As illustrated in Figure 9, selected experiment runs are showcased, displaying the corresponding color intensity for the control ( ng/mL), and samples with antigen concentrations of , , and ng/mL. The emergence of color in this area signals a positive result, with the intensity measured through digital image analysis in ImageJ software, thereby determining the device’s limit of detection (LOD) and limit of quantification (LOQ).
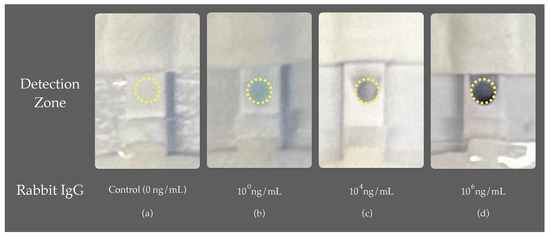
Figure 9.
Assay performance evaluation: highlighted area for color intensity analysis via ImageJ.
Together, these components of the study comprise the LOP device, enabling it to perform POC tests outside of conventional laboratory environments. This integration of protective housing and innovative diagnostic technology facilitates broader access to healthcare diagnostics, aligning with the goals of improving global health outcomes through accessible and reliable testing solutions.
2.7. Assay Optimal Operating Conditions
Enzymatic reactions and fluid dynamics are maintained at optimal efficiency, ensuring accurate and consistent assay results. Our platform incorporates alkaline phosphatase (ALP), which exhibits optimal activity at a temperature of 37 °C and a pH of 8.5 [37]. Importantly, this enzyme retains substantial stability below 32 °C and maintains about 80% of its activity within a pH range of 8–9.5. The PBS buffer provides an alkaline medium for the assay, supporting these conditions. These properties are crucial for the reliable operation of our assays under varied testing conditions.
Relative humidity levels between 30% and 70% are ideal for the operation of our assay. We have designed the B-MaC valve, a critical component of our platform, to function effectively across this range of environmental conditions. Our studies indicate that the valve’s performance in controlling fluid flow is minimally influenced by changes in these humidity levels, particularly at temperatures between 35 °C and 45 °C [16].
Our assay housing effectively manages temperature and humidity fluctuations, providing a controlled environment that supports optimal assay performance across a range of temperatures and humidity levels. Prior studies have shown that our platform housing is critical for point-of-care testing [17], ensuring that environmental and external conditions do not significantly affect test results by maintaining a passive controlled environment for assay conduction.
3. Results
This section presents a detailed account of the findings from our experimental studies, focusing on the performance evaluation of the p-ELISA platform, benchmarked using Rabbit IgG as a model analyte, as well as comparisons with previous studies.
3.1. Performance of p-ELISA Platform
The operational effectiveness of the p-ELISA platform is examined through its autonomous sequential loading of wash, substrate, and stop solutions, following sample introduction and assay activation, to conduct quantitative p-ELISA.
The device is optimized, specifically focusing on the timing of the fluidic circuit, to achieve assay completion within a 30-min window, making it suitable for POC p-ELISA applications.
Figure 10 illustrates the MDFA p-ELISA platform contained within the housing, developed in our lab, and engineered to autonomously administer sequential loading of three reagents for biomarker detection assays after sample introduction and activation. (a) At t = 1 min, the POC testing is initiated by releasing the reagents from vials onto the reagent pads (R1, R2, R3), via the release mechanism. (b) At t = 2 min, a small volume (10 μL) of the sample is applied to the conjugate pad via the sample port. (c) At t = 3 min, the sample fluid interacts with the conjugate pad, where enzyme-tagged detection antibodies bind to the antigens. (d) At t = 4 min, the assay is activated via DI water, which triggers the primary cantilever (C1), subsequently releasing the reagent (PBS), a wash solution, into the system. Concurrently, the wash solution advances the antigen–antibody conjugate toward the detection zone, where they are captured by immobilized capture antibodies. (e) At t = 10 min, part of the wash, directed through a delay channel, actuates the secondary cantilever (C2) and releases the reagent (BCIP/NBT), a substrate solution, into the system. (f) At t = 15 min, the substrate interacts with the detection antibodies at the test site to produce a signal. (g) At t = 20 min, another fraction of wash is directed to the tertiary cantilever (C3) through an extended delay channel, thus releasing another reagent (HCl), a stop solution, into the system. (h) At t = 25 min, the stop solution serves to terminate the enzyme–substrate reaction and remove any remnants of the substrate solution, producing a cleaner background. The entire assay unfolds within a concise 30 min timeframe, aligning well with the requirements for rapid point-of-care p-ELISA applications.
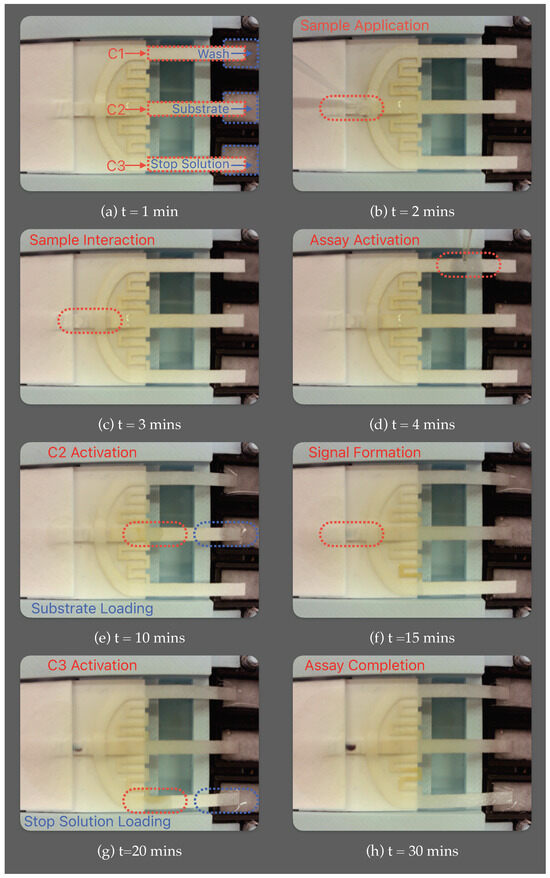
Figure 10.
Multi-directional flow assay (MDFA) μPAD conducting autonomous sequential loading of reagents for biomarker detection.
Additional features include dedicated loading zones L1, L2, and L3, downstream of C1, C2, and C3, which facilitate unobstructed flow for the respective reagents. The loading zone L3, for loading the stop solution to the detection zone, was chemically modified to prevent the PBS wash solution from moving into channel L3 and causing premature activation of the stop solution. Delay channels are calibrated for the timed, sequential release of these reagents. A buffer zone, preceding the detection zone, assists in the transverse loading of the wash and stop solution onto the detection zone via the conjugate pad. Consequently, the system is designed for autonomous, sequential loading of a sample and three distinct reagents onto the detection zone, optimizing the assay’s efficiency and sensitivity.
3.2. Benchmarking of Rabbit IgG
Here, we benchmark the platform’s performance by utilizing rabbit IgG as a model analyte, evaluating the detection limits and quantifying capabilities. To conduct a comprehensive evaluation, we prepared a range of rabbit IgG concentrations in PBS, including 0 (as a control), , , , , , , ng/mL. These were tested in a completely randomized order, with three replicates for each antigen concentration in buffer.
Qualitative detection by eye can be susceptible to inaccuracies, such as false positives, particularly if the reference strip does not exhibit a noticeable contrast difference. To address this concern, we introduced a control as part of our detection strategy. This control acts as a benchmark for comparison, ensuring that any variations in contrast are precisely identified. The implementation of a control aims to reduce the likelihood of false positives, thereby enhancing the accuracy of the qualitative detection method observable by eye.
A calibration curve for quantitative analysis, as presented in Figure 11, was obtained using MATLAB, alongside a visual assessment. Curve fitting was performed to obtain the sigmoidal response, given by:
where is response signal, is the antigen concentration in buffer, and parameters, , , and were experimentally determined and found to be , , , respectively.
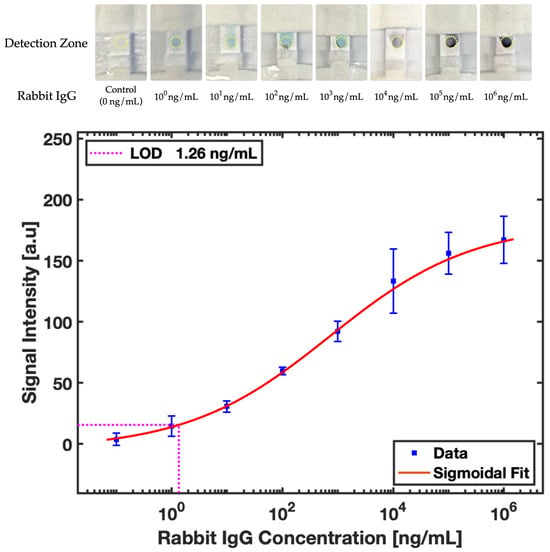
Figure 11.
Colorimetric detection: comparison of increasing concentrations of rabbit IgG and sigmoidal calibration curve correlating signal intensity with rabbit IgG concentration, including standard deviation error bars for .
To determine the limit of detection (LOD) and limit of quantification (LOQ), Equation (1) was utilized to calculate the antigen concentration corresponding to signal intensities obtained at for LOD and for LOQ, where is standard deviation. The limit of detection (LOD) is defined as the minimum analyte concentration that can be distinguished from background noise, whereas the limit of quantification (LOQ) is the lowest concentration at which the analyte can be detected and precisely quantified, given by:
where and are the mean intensity and standard deviation of control, respectively.
The limit of detection (LOD) and limit of quantification (LOQ) were calculated to be 1.26 ng/mL and 2.35 ng/mL, respectively. Given the molecular weight of rabbit IgG is 150 kDa and the use of a 10 μL sample for the assay, this translates to a molar concentration detection limit of 8.4 pM. To assess the device’s consistency, an experiment with 100 ng/mL rabbit IgG in triplicate was performed, achieving a relative standard deviation (RSD) of 1.9%, which showcases the device’s high reproducibility.
3.3. Comparison with Other Studies
Our comparative analysis with existing literature underscores the progress made and identifies areas for enhancement in paper-based ELISA technology. The limit of detection (LOD) achieved in our study sets new benchmarks for sensitivity and demonstrates significant advancement over previously reported values for rabbit IgG detection using paper-based ELISA platforms.
3.3.1. Enhanced Sensitivity and Rapid Assay
The limit of detection (LOD) achieved in this study surpasses previously reported values for rabbit IgG detection using paper-based ELISA platforms. Figure 12 showcases a comparison of calibration curves from various researchers for the p-ELISA, with rabbit IgG as the benchmark.
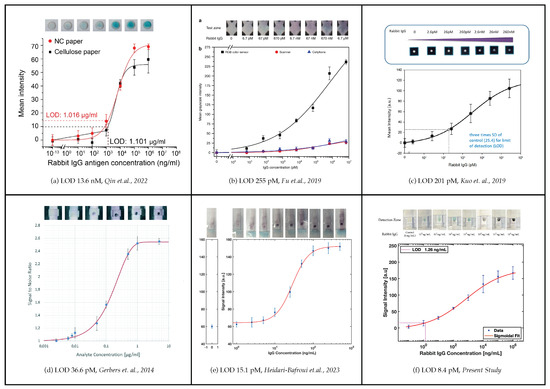
Figure 12.
Comparison of calibration curves for the p-ELISA with Rabbit IgG as the benchmark [17,20,23,29,30].
A previous study reported an LOD of 1.016 μg/mL (13.6 nM) with a 5 μL sample, completing the assay in under 1 h [29]. An LOD of 255 pM was achieved with a 250 μL sample using a desktop scanner, with an assay time of 55 min [20]. Another study reported an LOD of 201 pM with an 8 μL sample, detected by a low-cost desktop scanner in 46 min [30]. Yet, another study achieved an LOD of 5.5 ng/mL (36.6 pM) using a 130 μL sample with a semi-autonomous device, and signal detection via a low-cost desktop scanner in about 1 h [23]. Our previous study reported an LOD of 15.1 pM with a 10 μL sample using an autonomous device and signal detection through a low-cost desktop scanner in 1 h [17]. Comparatively, our study achieved an LOD of 8.4 pM using a 10 μL sample, with signal detection via a low-cost desktop scanner and, remarkably, our assay time was under 30 min, with signal formation occurring in under 15 min.
3.3.2. Superior Accuracy through Advanced Fluid Dynamics
Our p-ELISA platform integrates novel design features that enhance test accuracy, such as the multi-B-MaC assembly, which provides meticulous control over fluid dynamics [28]. This control is critical for reducing variability and potential errors [17]. Our use of autonomous sequential reagent loading ensures precise timing, significantly reducing the margin for error compared to manually intensive assays, such as those reported in studies that use manually controlled paper valves [20] and origami-based designs [30]. These features ensure that each assay component interacts correctly, thus enhancing the reliability of our results.
3.3.3. Streamlined Operation for User-Friendly Diagnostics
The design of our p-ELISA platform emphasizes ease of use. It incorporates pre-loaded reagents and automated fluidic controls, enabling even untrained users to operate the device with minimal instructions. Compared to other studies where complex folding and manual reagent loading are required [30], our platform significantly simplifies the operational procedure. This ease of use is a considerable advantage in point-of-care settings, where training resources and technical skills may be limited. Moreover, the integration of shape-memory polymer-actuated valves in prior studies [20] demonstrates a move towards automation, but our platform extends this by eliminating the need for onboard power, making it simpler and more intuitive for end-users and more suitable for field use.
4. Discussion
The innovative lab-on-paper μPAD for quantitative p-ELISA marks a pivotal advancement in the field of point-of-care diagnostics. This device achieves signal detection within 15 min of assay initiation, completing the entire process in under 30 min. As illustrated in Figure 10, the p-ELISA platform demonstrates an efficient and effective approach to antigen detection, performing all traditional ELISA steps on paper—a novel approach not previously attempted. By utilizing a wash, substrate, and stop solution for autonomous colorimetric detection, the wash prepares the assay for detection, the substrate generates the signal for colorimetric detection, and the stop solution secures a fixed end reaction time, thereby enhancing assay sensitivity by clearing the background noise.
Our research demonstrates the detection of rabbit IgG as a model analyte, leveraging the unique capabilities of the MDFA for quantitative p-ELISA. The precise control over fluid dynamics, afforded by the multi-directional flow paths, enables a more thorough interaction between the analyte and the immobilized antibodies, as illustrated in Figure 11. This results in increased sensitivity and specificity of the assay, highlighting the platform’s potential to detect a wide range of biomarkers with high accuracy.
Compared with traditional LFIA and other contemporary paper-based assays, the MDFA p-ELISA platform exhibits superior performance, particularly in terms of assay timing, utilizing a small sample volume, and employing a low-cost desktop scanner for signal detection. The assay is autonomous beyond the sample introduction and activation, setting a new benchmark in rapid diagnostic test utilizing p-ELISA platform.
The LOP device housing, presented in Figure 6, embodies a portable and cost-effective approach to diagnostics, highlighting the importance of integrating housing for the p-ELISA platform for several key reasons. To protect against contaminants, housing safeguards the device from exposure to dust, unwanted chemicals, and other potential contaminants, ensuring that the integrity of the diagnostic process is maintained. By providing a stable, controlled environment, the housing helps to mitigate the effects of environmental variables such as humidity and mild temperature fluctuations, which could otherwise compromise the accuracy of test outcomes. The housing also plays a crucial role in enhancing user safety by minimizing the risk of accidental exposure to biohazards.
Looking ahead, the MDFA p-ELISA platform opens new avenues for the development of portable, user-friendly, and versatile diagnostic tools. Future work will focus on expanding the range of detectable analytes, including viruses, proteins, and biomarkers, thereby broadening the spectrum of applications in clinical diagnostics, environmental surveillance, and food safety. Additionally, integrating digital image analysis and quantification techniques could further refine the assay’s accuracy and user experience. It is worth noting that the platform can be integrated with a smartphone, to read signals, making the device completely portable.
We acknowledge the importance of addressing the biodegradability and biocompatibility of our paper-based μPAD. Many components of our device are inherently biodegradable due to their paper-based nature. It could be beneficial for future studies to focus on comprehensive evaluations of environmental friendliness and safety, potentially enhancing the device’s usability in diverse contexts.
5. Conclusions
In this study, we have introduced and elaborated on the design, fabrication, and evaluation of a lab-on-paper microfluidic device for quantitative p-ELISA, a novel advancement in the field of diagnostics, addressing the need for accessible, accurate, and rapid diagnostic tools across various settings. Our device utilizes a multi-B-MaC assembly to create a passive fluidic circuit system without onboard power, capable of conducting autonomous assays by sequentially loading reagents onto the detection zone. This design enables signal detection within 15 min and completes the entire assay process in less than 30 min, signifying a remarkable improvement on existing diagnostic methodologies.
To validate the effectiveness of the device, rabbit IgG as a model analyte was utilized, demonstrating the device’s efficiency, with a detection limit of 8.4 pM. This performance is enabled by precise fluid dynamics control through multi-directional flow paths, enhancing the interaction between the analyte and immobilized antibodies.
When compared to traditional lateral flow assays and other current paper-based assays, our p-ELISA platform showcases superior performance, particularly highlighted by its rapid assay completion time, minimal sample requirement, and the use of a low-cost desktop scanner for signal detection. Moreover, the housing assists the assay operation and is essential for maintaining a space that offers protection against contaminants, ensures a stable environment for the assay, and prioritizes user safety.
The study introduces a transformative approach in diagnostics, focusing on portability, ease of use, and the ability to detect a wide range of analytes, significantly impacting various sectors, including clinical diagnostics and environmental monitoring. The integration of digital technologies and smartphone compatibility is poised to improve accuracy and make the system fully portable, addressing critical needs in resource-limited settings and setting the stage for future innovations. This advancement represents a significant step beyond traditional diagnostic methods, enhancing global health outcomes with rapid, accessible, and reliable diagnostics, ultimately promising a future where comprehensive, rapid, and reliable diagnostics are within the reach of all, irrespective of geographic or economic barriers.
Author Contributions
Conceptualization, A.K.; methodology, A.K.; software, A.K.; validation, A.K.; formal analysis, A.K., C.H., S.H. (Stephen Herchen), A.S. and E.C.; investigation, A.K., C.H., S.H. (Stephen Herchen), A.S., E.C. and S.H. (Sophia Harper); resources, N.R., C.A. and M.F.; writing—original draft preparation, A.K.; writing—review and editing, A.K., N.R., C.A. and M.F.; visualization, A.K.; supervision, N.R., C.A. and M.F.; project administration, C.A. and M.F.; funding acquisition, C.A. and M.F. All authors have read and agreed to the published version of the manuscript.
Funding
This research received no external funding.
Institutional Review Board Statement
Not applicable.
Data Availability Statement
Data are contained within the article. Additional data not presented in this article are available on request from the corresponding author.
Acknowledgments
The authors would like to acknowledge the students, research scientists, and visiting scholars at the Microfluidics Laboratory at the University of Rhode Island for their help and support.
Conflicts of Interest
The authors declare no conflicts of interest.
References
- Rahbar, M.; Zou, S.; Baharfar, M.; Liu, G. A customized microfluidic paper-based platform for colorimetric immunosensing: Demonstrated via hCG assay for pregnancy test. Biosensors 2021, 11, 474. [Google Scholar] [CrossRef]
- Li, Z.; Yi, Y.; Luo, X.; Xiong, N.; Liu, Y.; Li, S.; Sun, R.; Wang, Y.; Hu, B.; Chen, W.; et al. Development and clinical application of a rapid IgM-IgG combined antibody test for SARS-CoV-2 infection diagnosis. J. Med. Virol. 2020, 92, 1518–1524. [Google Scholar] [CrossRef] [PubMed] [PubMed Central]
- Jeong, S.-G.; Kim, J.; Jin, S.H.; Park, K.-S.; Lee, C.-S. Flow control in paper-based microfluidic device for automatic multistep assays: A focused minireview. Korean J. Chem. Eng. 2016, 33, 2761–2770. [Google Scholar] [CrossRef]
- Li, W.; Ma, X.; Yong, Y.-C.; Liu, G.; Yang, Z. Review of paper-based microfluidic analytical devices for in-field testing of pathogens. Anal. Chim. Acta 2023, 1278, 341614. [Google Scholar] [CrossRef] [PubMed]
- Cheng, C.M.; Martinez, A.W.; Gong, J.; Mace, C.R.; Phillips, S.T.; Carrilho, E.; Whitesides, G.M. Paper-based ELISA. Angew. Chem. 2010, 49, 4771–4774. [Google Scholar] [CrossRef] [PubMed]
- Liu, X.Y.; Cheng, C.M.; Martinez, A.W.; Mirica, K.A.; Li, X.J.; Phillips, S.T.; Whitesides, G.M. A portable microfluidic paper-based device for ELISA. In Proceedings of the 2011 IEEE 24th International Conference on Micro Electro-Mechanical Systems, Cancun, Mexico, 23–27 January 2011; pp. 75–78. [Google Scholar]
- Hu, J.; Wang, S.; Wang, L.; Li, F.; Pingguan-Murphy, B.; Lu, T.J.; Xu, F. Advances in paper-based point-of-care diagnostics. Biosens. Bioelectron. 2014, 54, 585–597. [Google Scholar] [CrossRef] [PubMed]
- Dou, M.; Sanjay, S.T.; Benhabib, M.; Xu, F.; Li, X. Low-cost bioanalysis on paper-based and its hybrid microfluidic platforms. Talanta 2015, 145, 43–54. [Google Scholar] [CrossRef] [PubMed]
- Verma, M.S.; Tsaloglou, M.-N.; Sisley, T.; Christodouleas, D.; Chen, A.; Milette, J.; Whitesides, G.M. Sliding-strip microfluidic device enables ELISA on paper. Biosens. Bioelectron. 2018, 99, 77–84. [Google Scholar] [CrossRef]
- Pang, B.; Zhao, C.; Li, L.; Song, X.; Xu, K.; Wang, J.; Liu, Y.; Fu, K.; Bao, H.; Song, D.; et al. Development of a low-cost paper-based ELISA method for rapid Escherichia coli O157: H7 detection. Anal. Biochem. 2018, 542, 58–62. [Google Scholar] [CrossRef]
- Shih, C.-M.; Chang, C.-L.; Hsu, M.-Y.; Lin, J.-Y.; Kuan, C.-M.; Wang, H.-K.; Huang, C.-T.; Chung, M.-C.; Huang, K.-C.; Hsu, C.-E.; et al. Paper-based ELISA to rapidly detect Escherichia coli. Talanta 2015, 145, 2–5. [Google Scholar] [CrossRef]
- Martinez, A.W. Microfluidic paper-based analytical devices: From POCKET to paper-based ELISA. Bioanalysis 2011, 3, 2589–2592. [Google Scholar] [CrossRef] [PubMed]
- Kasetsirikul, S.; Umer, M.; Soda, N.; Sreejith, K.R.; Shiddiky, M.J.; Nguyen, N.T. Detection of the SARS-CoV-2 humanized antibody with paper-based ELISA. Analyst 2020, 145, 7680–7686. [Google Scholar] [CrossRef]
- Ortega, G.A.; Pérez-Rodríguez, S.; Reguera, E. Magnetic paper–based ELISA for IgM-dengue detection. RSC Adv. 2017, 7, 4921–4932. [Google Scholar] [CrossRef]
- Choi, J.R.; Yong, K.W.; Choi, J.Y.; Cowie, A.C. Emerging point-of-care technologies for food safety analysis. Sensors 2019, 19, 817. [Google Scholar] [CrossRef]
- Heidari-Bafroui, H.; Kumar, A.; Charbaji, A.; Smith, W.; Rahmani, N.; Anagnostopoulos, C.; Faghri, M. A Parametric Study on a Paper-Based Bi-Material Cantilever Valve. Micromachines 2022, 13, 1502. [Google Scholar] [CrossRef] [PubMed]
- Heidari-Bafroui, H.; Kumar, A.; Hahn, C.; Scholz, N.; Charbaji, A.; Rahmani, N.; Anagnostopoulos, C.; Faghri, M. Development of a New Lab-on-Paper Microfluidics Platform Using Bi-Material Cantilever Actuators for ELISA on Paper. Biosensors 2023, 13, 310. [Google Scholar] [CrossRef] [PubMed]
- Kumar, A.; Heidari-Bafroui, H.; Rahmani, N.; Anagnostopoulos, C.; Faghri, M. Modeling of Paper-Based Bi-Material Cantilever Actuator for Microfluidic Biosensors. Biosensors 2023, 13, 580. [Google Scholar] [CrossRef] [PubMed]
- Toley, B.J.; McKenzie, B.; Liang, T.; Buser, J.R.; Yager, P.; Fu, E. Tunable-delay shunts for paper microfluidic devices. Anal. Chem. 2013, 85, 11545–11552. [Google Scholar] [CrossRef] [PubMed]
- Fu, H.; Song, P.; Wu, Q.; Zhao, C.; Pan, P.; Li, X.; Liu, X.; Liu, X. A paper-based microfluidic platform with shape-memory-polymer-actuated fluid valves for automated multi-step immunoassays. Microsyst. Nanoeng. 2019, 5, 50. [Google Scholar] [CrossRef]
- Tran, B.T.; Rijiravanich, P.; Puttaraksa, N.; Surareungchai, W. Wax gates in laminated microfluidic paper-based immunosensors. Microchem. J. 2022, 178, 107343. [Google Scholar] [CrossRef]
- Chen, C.; Zhao, L.; Zhang, H.; Shen, X.; Zhu, Y.; Chen, H. Novel Wax Valves to Improve Distance-Based Analyte Detection in Paper Microfluidics. Anal. Chem. 2019, 91, 5169–5175. [Google Scholar] [CrossRef] [PubMed]
- Gerbers, R.; Foellscher, W.; Chen, H.; Anagnostopoulos, C.; Faghri, M. A new paper-based platform technology for point-of-care diagnostics. Lab Chip 2014, 14, 4042–4049. [Google Scholar] [CrossRef] [PubMed]
- Chen, H.; Cogswell, J.; Anagnostopoulos, C.; Faghri, M. A fluidic diode, valves, and a sequential-loading circuit fabricated on layered paper. Lab Chip 2012, 12, 2909–2913. [Google Scholar] [CrossRef]
- Preechakasedkit, P.; Siangproh, W.; Khongchareonporn, N.; Ngamrojanavanich, N.; Chailapakul, O. Development of an automated wax-printed paper-based lateral flow device for alpha-fetoprotein enzyme-linked immunosorbent assay. Biosens. Bioelectron. 2018, 102, 27–32. [Google Scholar] [CrossRef] [PubMed]
- Lai, Y.-T.; Tsai, J.-S.; Hsu, J.-C.; Lu, Y.-W. Automated paper-based devices by microfluidic timing-valve for competitive ELISA. In Proceedings of the 2017 IEEE 30th International Conference on Micro Electromechanical Systems (MEMS), Las Vegas, NV, USA, 22–26 January 2017; pp. 1321–1324. [Google Scholar] [CrossRef]
- Kumar, A.; Heidari-Bafroui, H.; Charbaji, A.; Rahmani, N.; Anagnostopoulos, C.; Faghri, M. Numerical and Experimental Modeling of Paper-Based Actuators. Chem. Proc. 2021, 5, 15. [Google Scholar] [CrossRef]
- Kumar, A.; Hatayama, J.; Soucy, A.; Carpio, E.; Rahmani, N.; Anagnostopoulos, C.; Faghri, M. Fluid Flow Dynamics in Partially Saturated Paper. Micromachines 2024, 15, 212. [Google Scholar] [CrossRef]
- Qin, Z.; Huang, Z.; Pan, P.; Pan, Y.; Zuo, R.; Sun, Y.; Liu, X. A Nitrocellulose Paper-Based Multi-Well Plate for Point-of-Care ELISA. Micromachines 2022, 13, 2232. [Google Scholar] [CrossRef]
- Kuo, Z.-K.; Chang, T.-H.; Chen, Y.-S.; Cheng, C.-M.; Tsai, C.-Y. Two Potential Clinical Applications of Origami-Based Paper Devices. Diagnostics 2019, 9, 203. [Google Scholar] [CrossRef] [PubMed]
- Zhang, J.; Yu, Q.; Qiu, W.; Li, K.; Qian, L.; Zhang, X.; Liu, G. Gold-platinum nanoflowers as a label and as an enzyme mimic for use in highly sensitive lateral flow immunoassays: Application to detection of rabbit IgG. Microchim. Acta 2019, 186, 1–9. [Google Scholar] [CrossRef]
- Duan, Y.; Wu, W.; Zhao, Q.; Liu, S.; Liu, H.; Huang, M.; Wang, T.; Liang, M.; Wang, Z. Enzyme-antibody-modified gold nanoparticle probes for the ultrasensitive detection of nucleocapsid protein in SFTSV. Int. J. Environ. Res. Public Health 2020, 17, 4427. [Google Scholar] [CrossRef]
- Abcam. Rabbit IgG ELISA Kit (ab187400). Available online: https://www.abcam.com (accessed on 22 March 2024).
- Zhao, Y.; Zeng, D.; Yan, C.; Chen, W.; Ren, J.; Jiang, Y.; Jiang, L.; Xue, F.; Ji, D.; Tang, F.; et al. Rapid and accurate detection of Escherichia coli O157: H7 in beef using microfluidic wax-printed paper-based ELISA. Analyst 2020, 145, 3106–3115. [Google Scholar] [CrossRef] [PubMed]
- Hsu, M.-Y.; Yang, C.-Y.; Hsu, W.-H.; Lin, K.-H.; Wang, C.-Y.; Shen, Y.-C.; Chen, Y.-C.; Chau, S.-F.; Tsai, H.-Y.; Cheng, C.-M. Monitoring the VEGF level in aqueous humor of patients with ophthalmologically relevant diseases via ultrahigh sensitive paper-based ELISA. Biomaterials 2014, 35, 3729–3735. [Google Scholar] [CrossRef] [PubMed]
- Janik-Karpinska, E.; Ceremuga, M.; Niemcewicz, M.; Podogrocki, M.; Stela, M.; Cichon, N.; Bijak, M. Immunosensors—The Future of Pathogen Real-Time Detection. Sensors 2022, 22, 9757. [Google Scholar] [CrossRef] [PubMed]
- Chu, Y.-H.; Yu, X.-X.; Jin, X.; Wang, Y.-T.; Zhao, D.-J.; Zhang, P.; Sun, G.-M.; Zhang, Y.-H. Purification and characterization of alkaline phosphatase from lactic acid bacteria. RSC Adv. 2019, 9, 354–360. [Google Scholar] [CrossRef] [PubMed]
Disclaimer/Publisher’s Note: The statements, opinions and data contained in all publications are solely those of the individual author(s) and contributor(s) and not of MDPI and/or the editor(s). MDPI and/or the editor(s) disclaim responsibility for any injury to people or property resulting from any ideas, methods, instructions or products referred to in the content. |
© 2024 by the authors. Licensee MDPI, Basel, Switzerland. This article is an open access article distributed under the terms and conditions of the Creative Commons Attribution (CC BY) license (https://creativecommons.org/licenses/by/4.0/).