
Article

Changes in the Physicochemical Characteristics and Antioxidant Activity of Saladette-Type Tomato (Solanum lycopersicum L.) Grown in Soil Supplemented with Zeolite

by
Jessica Lizbeth Ramirez-Tellez
1,
Luis Delgado-Olivares
1,
Nelly del Socorro Cruz-Cansino
1,
Ernesto Alanis-García
1,
Edgar Arturo Chávez-Urbiola
2 and
Esther Ramirez-Moreno
1,*
1
Instituto de Ciencias de la Salud, Área Académica de Nutrición, Universidad Autónoma del Estado de Hidalgo, Circuito Ex Hacienda, La Concepción S/N, Carretera Pachuca Actopan, San Agustín Tlaxiaca 42060, Mexico
2
Instituto Politécnico Nacional, Centro de Investigación en Ciencia Aplicada y Tecnología Avanzada Unidad Querétaro (IPN-CICATA-Qro), Cerro Blanco No. 141, Colinas del Cimatario, Queretaro City 76090, Mexico
*
Author to whom correspondence should be addressed.
Crops 2026, 6(4), 65; https://doi.org/10.3390/crops6040065
Submission received: 13 April 2026 / Revised: 3 June 2026 / Accepted: 26 June 2026 / Published: 3 July 2026
(This article belongs to the Topic Applications of Biotechnology in Food and Agriculture)

Abstract

The rapid pace of urbanization, coupled with the variability in climatic conditions, has led to a marked increase in global food demand. Simultaneously, this phenomenon has resulted in a decline in the overall quality of food, highlighting the need to improve existing agricultural production systems. In this context, zeolite has emerged as a promising soil amendment for optimizing its physical properties and crop yields. However, there is limited information on its effects during tomato cultivation, particularly for the Saladette variety (Solanum lycopersicum L.) in Hidalgo, Mexico. This includes the use of this zeolite variety, the evaluation of its antioxidant properties, and its antioxidant activity at different applied concentrations. This study evaluated the effect of different concentrations of zeolite applied to the soil on tomato growth and fruit quality. After crop establishment, the treatments were monitored monthly. The results showed that the application of zeolite significantly improved crop yield, with Treatment 3 (5 kg zeolite plant−1) showing the best performance without affecting the physical characteristics of the fruit. The tomatoes maintained adequate commercial standards, with weights ranging from 104 a 169 g, sizes from 5.16 to 6.20 cm, and firmness values between 1.19 and 2.27 N; therefore, this treatment was selected for the determination of the antioxidant activity on the fruits. Furthermore, an increase in antioxidant capacity was observed, reaching 5.50 µmol TE/100 g of dry sample in the DPPH antioxidant capacity test. This demonstrates that zeolite application positively influences the quality and antioxidant capacity of tomatoes. This suggests that zeolite could be used in various crops, potentially improving the quality of the final product and offering health benefits to consumers thanks to the antioxidant compounds generated during harvest. However, further studies are needed to determine the optimal application rates and the long-term effects on soil health and crop productivity.

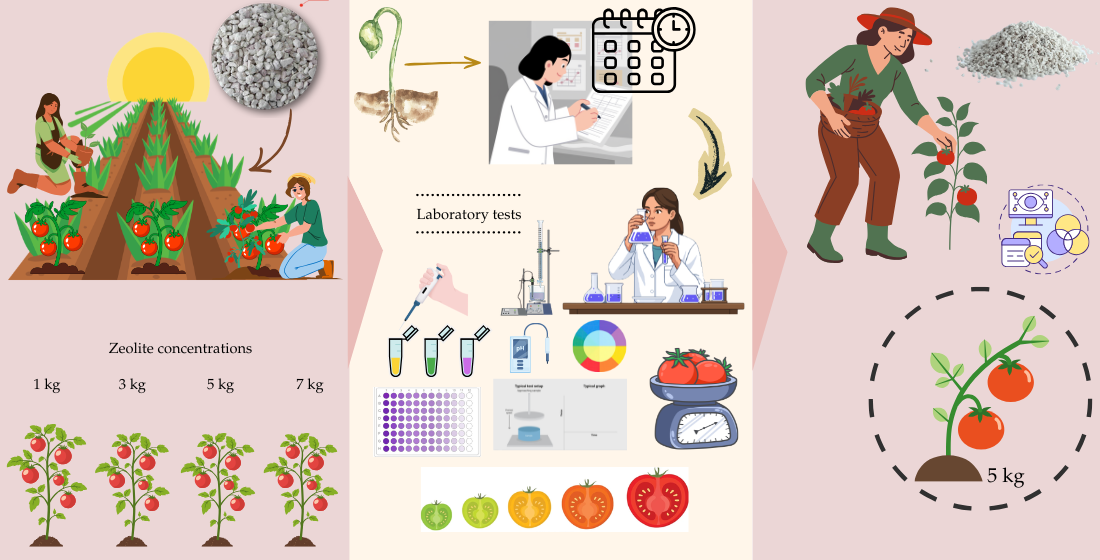
Graphical Abstract

1. Introduction

The tomato belongs to the Solanaceae family and has come to be considered one of the most consumed vegetables, with a global annual production that exceeded 180 million tons in 2021 [1,2]. Worldwide, Mexico ranks tenth, contributing 1.63% of world production with its total annual production, and 62% is Saladette-type tomato varieties [3,4]. The growth period of the tomato fruit is six to eight weeks after flowering [5]. Two important periods during the year are considered for the harvest of this fruit, the first, which runs from February to April, belonging to the cycle, and the second, where production is highest, from October to November [3]. The composition can vary based on the crop, agricultural technique, handling, and storage conditions [6]. It is low in calories, with most of its weight being water and the remainder corresponding to compounds such as total sugars and organic acids and to a lesser extent fiber, protein, and lipids [7]. Likewise, tomato fruits are characterized by a high content of bioactive compounds, such as lycopene, ascorbic acid, and phenolic compounds [8,9,10] Between 90 and 95% of the antioxidant content in ripe tomatoes are carotenes [11]. The content of these compounds is influenced by seasonal changes, cultivation location, crop type, light, fertilization, and abiotic and biotic factors [12]. Furthermore, the addition of minerals has been a good option for improving the physical environment of the soil, improving its nutrition and, consequently, agricultural production. The concentration of minerals depends on the region due to variations in soil, climate, and irrigation system; however, certain quantities are required to produce 1 ton of tomato [13]. The minerals present in the soil are of great importance due to the functions they perform, which is why one of the most commonly used substrates is zeolites, considered natural substrates and classified by the International Agency for Research on Cancer (IARC) as non-toxic and due to the classification of the Food and Drug Administration (FDA) as safe for human consumption [14]. In addition, various studies show that their use has benefits on crop growth and yield [15,16]. An example of this phenomenon is clinoptilolite zeolite, which exhibits a distinctive reaction with aqueous ammonium due to its considerable anionic charge in its internal and external structure. This reaction contributes to its functionality as a slow-release nitrogen fertilizer [17]. Furthermore, its excellent water retention capacity increases the amount of water available to plants [18]. On the other hand, there is a scarcity of research reports on antioxidant counts in crops treated with zeolite; in fact, studies in this area tend to combine zeolite with another mineral or compound [19]. The objective of this study was to evaluate the changes in the characteristics and antioxidant activity of Saladette-type tomatoes grown in zeolite-treated soil.

2. Materials and Methods

The present study constitutes an experimental, descriptive, and quantitative investigation into the physicochemical characteristics of tomatoes cultivated with varying zeolite treatments in the soil, in addition to the antioxidant activity of compounds derived from tomato fruit. The zeolitic material used in this study, locally known as “Bothá”, was provided by the Autonomous University of the State of Hidalgo. This material originates from the Nanhú region of the Sierra Gorda, Hidalgo, Mexico. Its chemical composition, trace element content, and main physicochemical properties are presented in Table 1, Table 2 and Table 3. The material was composed mainly of clinoptilolite (>50%), with quartz and sanidine (10–20%) and muscovite (1–10%) as accessory mineral phases.
The zeolite used was dominated by clinoptilolite (>50%). Accessory phases included quartz and sanidine (10–20%) and muscovite (1–10%).
The plant material consisted of commercial grafted Saladette-type tomato seedlings of the Paypay variety (Solanum lycopersicum L.), obtained from a greenhouse supplier in Irapuato, Guanajuato, Mexico. Each seedling consisted of a rootstock from a different tomato variety and a scion corresponding to the Paypay variety. The plants were supplied as double-stem grafted seedlings and were cultivated in a private greenhouse located in Mineral del Chico, Hidalgo, Mexico (20.2150° N, 98.7310° W). A total of 210 plants were transplanted and arranged in three rows. The first row contained 74 plants and served as the control group. The second row was subdivided into two sections, each containing 37 plants, corresponding to treatments T1 and T2. The third row was also subdivided into two sections of 37 plants each, corresponding to treatments T3 and T4. Soil preparation was carried out in February before crop establishment. For each plant, the soil from the planting site was removed, homogenized with the corresponding zeolite dose, and returned to the same planting site. The treatments were established as follows: control, 0 kg zeolite plant−1; T1, 1 kg zeolite plant−1; T2, 3 kg zeolite plant−1; T3, 5 kg zeolite plant−1; and T4, 7 kg zeolite plant−1. Considering an approximate planting density of 17,000 plants ha−1, these application rates corresponded to 0, 17, 51, 85, and 119 t ha−1, respectively.

2.1. Tomato Sample

The tomato was harvested at the commercially ripe stage monthly, with 1 kg of fruit being obtained from each treatment. The designated control period commenced in June and concluded in November 2019. Yield determinations, physical properties (weight, size, firmness, and color), physicochemical analyses (pH, titratable acidity, and soluble solids), and antioxidant capacity evaluations were conducted in the laboratories of the Instituto de Ciencias Básicas e Ingenierías (ICBI) and the Instituto de Ciencias de la Salud (ICSa) of the Universidad Autónoma del Estado de Hidalgo. All determinations were performed using fresh fruits stored at room temperature (25 °C), except for antioxidant capacity evaluations, which were carried out on lyophilized samples.

2.2. Physical Properties

The physicochemical properties were evaluated, including parameters such as pH, titratable acidity, and total soluble solids. The antioxidant capacity of the samples was assessed using three different assays: ABTS, DPPH, and FRAP.
Yield was obtained from the first harvest by weighing the total fruit collected from each treatment in each row. It was determined at 10-day intervals, beginning with the initial harvest during the production months. To determine the weight, 1 kg of fresh fruit from each treatment and the control was used, using an analytical balance (Ohaus, Explore Pro WEP64C, Parsippany, NJ, USA).
The equatorial diameter was measured according to the Official Mexican Standard NMX FF 009 [20] using a Garant vernier caliper (Hoffmann Group, Munich, Germany). The reading was obtained directly on the vernier scale and specified according to the minimum and maximum diameters expressed in mm (Table 4).
Firmness was determined on three sides of each of the three control treatment fruits along the equatorial diameter using a texturometer (TA.XTPlus Type 2, 2012, Stable Micro Systems Ltd., Godalming, UK), based on the maximum force required. An 8 mm puncture tip was used to achieve penetration to a depth of 6 mm, expressed in Newtons (N). The maximum values were recorded, corresponding to the force needed to break the skin [21].
The colorimetric evaluation was performed by selecting three whole tomatoes from the control sample and from each treatment. The analysis was carried out using colorimetry equipment (Minolta CM-80 and SM-508D, Minolta Co., Ltd., Osaka, Japan). The instrument was calibrated according to the manufacturer’s instructions, and color values were expressed using the CIE L*a*b* scale. Colorimetric values were calculated using the following equations:
h ° a b =   arctan   ( b a )
C = ( a 2 + b 2 )
E = ( Δ L ) 2 + ( Δ a ) 2 + ( Δ b ) 2  
where
  • L* = Color brightness (L* = 0 indicates black (no brightness) and L* = 100 indicates white (maximum brightness));
  • a* = Red/green coordinates (+a indicates red and −a indicates green);
  • b* = Yellow/blue coordinates (+b indicates yellow and −b indicates blue).

2.2.1. Ph

The pH determination was carried out in accordance with the Mexican Official Standard NMX-F-317-S-1978 [22], using a digital potentiometer (HANNA, PH 210, Hanna Instruments, Timișoara, Romania) that had been previously calibrated with pH buffer solutions of 4, 7, and 10. The sample was then homogenized in a blender (NutriBullet, 600 W, NutriBullet, LLC, Los Angeles, CA, USA). A sample of 100 g (three tomatoes from each treatment and control) was placed in a beaker, and 20 mL of water was added. The temperature of the solution was then adjusted to 20 ± 0.5 °C, after which the solution was stirred on a grill and a reading was taken.

2.2.2. Titratable Acidity

Titratable acidity analysis was performed according to the Official Methods of Analysis (AOAC) [23] by titrating the sample with 0.1 N NaOH (sodium hydroxide) solution. Ten grams of previously homogenized tomato, 50 mm of distilled water, and a magnetic stirrer were placed in an Erlenmeyer flask. The contents were stirred on a rack for one minute. A filtrate was made and from this, and a 20 mL aliquot and 4 drops of phenolphthalein indicator were placed in a beaker. The filtrate was then titrated with 0.1 N NaOH solution, and the percentage of titratable acidity was calculated using equation 1. The mm of NaOH used were expressed as a percentage of citric acid.
A = ( 0.006404 × V ) G × 100
where
  • A: Acidity in % of citric acid;
  • V: Volume of 0.1 N NaOH;
  • G: Sample quantity in g.

2.2.3. Total Soluble Solids

The measurement was carried out according to the AOAC method [23]. A refractometer was used in this study. A quantity of the previously homogenized tomato was placed in a blender (NutriBullet, 600 W, Los Angeles, CA, USA) and deposited in the refractometer (Trading Co., Brix, ATC-F-G, Shenzhen, China) and the resulting reading was recorded. The results were expressed as °Brix.

2.2.4. Maturity Index

This parameter was determined by considering the relationship between soluble solids and titratable acidity (Equation (5)) [24]. The maturity index is calculated using the following formula:
M I =   T S S T A  
where
  • MI = Maturity index;
  • TSS = Total soluble solids;
  • TA = Titratable acidity.

2.3. Phenolic Compounds and Antioxidant Capacity

2.3.1. Extraction

The antioxidant compounds were extracted according to the method described by Saura-Calixto et al. [25]. A total of 250 mg of the lyophilized sample (LABCONCO, FreeZone, Kansas City, MO, USA) was weighed. A 10-milliliter volume of a methanol/water mixture (with a volumetric ratio of 50:50) was added to the container and stirred at 300 revolutions per minute (rpm) for 30 min (LSI-3016A, LabTech, Seoul, Republic of Korea). The samples were then centrifuged (V6500, Hamilton Bell Vanguardia, Montvale, NJ USA) for 20 min at 3400 rpm. Ten mm of acetone/water (70:30 v/v) were then added to the precipitate, and the procedure was repeated. The obtained supernatants were then poured into a 25 mL volumetric flask containing a mixture of methanol/water and acetone/water in a volume ratio of 50:50.

2.3.2. Total Phenolic Content

The methodology established by Stintzing et al. [26] was used to determine the CFTs. Folin–Ciocalteu reagent was used by applying 1 mL Folin solution up to the 10 mL mark with deionized water, a sodium carbonate solution (7.5 g in 100 mL of deionized water) and a gallic acid solution (15 mg in 500 mL of deionized water). A standard curve was made for the gallic acid concentration, which ranged from 0 to 300 mg per liter (gallic acid/deionized water). The concentration was determined by spectrophotometry (Power Ware XS UV-Biotek, Software Gen5 v. 2.09, Winooski, VT, USA) and the absorbance was measured at 765 nm using a deionized water blank after standing for 30 min at room temperature. The results were expressed as mg of gallic acid equivalents per 100 g dry basis (mg EAG/100 g dm).

2.3.3. Antioxidant Capacity by ABTS, DPPH and FRAP

The determination of ABTS (2,2-azino-bis(3-ethylbenzothiazolinone)-6-sulfonic acid) was conducted in accordance with the protocol established by Kuskoski et al. [27]. A solution of 7 mM ABTS was prepared (76.8 mg in 20 mL of distilled water). Subsequently, 2.45 mM potassium persulfate (6.6 mg in 10 mL of distilled water) was added, and the mixture was left to stand for 16 h in the dark. A dilution was prepared in distilled water until an absorption of 0.7 ± 0.1 was obtained at 754 nm. Subsequently, a standard curve was generated, encompassing concentrations ranging from 0 to 50 μmol/L of ascorbic acid solution (3 mg in 10 mL of distilled water). Spectrophotometric readings were obtained at a wavelength of 754 nm, employing a distilled water blank as a reference standard. A volume of 20 μL of the sample and 980 μL of ABTS were obtained, allowed to stand for 7 min, and the readings were taken at 754 nm. The results were expressed as mg of ascorbic acid per 100 g on a dry basis (mg EAA/100 g DM).
The antioxidant capacity of DPPH (2,2-diphenyl-1-pyrrolidone) was determined using the methodology described by Morales and Jimenes-Pérez [28]. The solution, containing 7.4 mg of DPPH, was prepared by diluting it in 100 mm of ethanol. This solution was used to construct a standard curve with Trolox (3.75 mg in 50 mm of ethanol) at concentrations of 0, 50, 100, 200, and 300 micromoles of Trolox equivalent per liter. In this experiment, 100 microliters of sample and 500 microliters of DPPH solution were added to the test tube. The contents of the tube were allowed to stand for 60 min. After this time, the contents of the tube were measured at a wavelength of 520 nm. The antioxidant activity was expressed in micromoles of Trolox equivalent per 100 g of dry basis (μmol TE/100 g dm). Finally, the FRAP (ferric reducing antioxidant power) methodology was performed as described by Pérez-Jiménez et al. [29]. The FRAP reagent was prepared at a 10:1:1 concentration with 100 mL of buffer solution (0.3 M at pH 3.6), 10 mL of TPTZ (2,4,6-tri(2-pyridyl)-s-triaza) (10 mM in hydrochloric acid) and 10 mL of FeCl3 (20 mM in water). A ferrous sulfate standard curve was prepared with the following Fe(II) concentrations: the Fe(II) concentrations in the solution ranged from 0 to 50 mmol per liter (μM). The sample was prepared by adding 30 μL of sample, 90 μL of distilled water and 900 μL of FRAP, homogenizing the mixture and letting it stand in a water bath at 37 °C for 10 min. After this interval, the degree of absorption was determined at a wavelength of 593 nm. The results were expressed in micromoles of iron (II) per 100 g db (μmol Fe(II)/100 g of dry basis). The change in absorbance in each determination was measured with a microplate reader (Power Wave XS UV-Biotek, Software Gen5 v. 2.09, Winooski, VT, USA).

2.4. Statistical Analysis

A one-way analysis of variance (ANOVA) was employed to ascertain the discrepancy in responses exhibited among the four zeolite treatments and across the months of production for each treatment. This analysis was complemented by the Duncan test, which boasts a reliability level of 95% (p < 0.05). To facilitate a more nuanced comparison of the antioxidant determinations, the T-student test was utilized, employing the statistical software SPSS version 19 (SPSS Inc., Chicago, IL, USA).

3. Results

3.1. Yield

Tomato production initially reached approximately 83 and 117 kg fruit plant−1. Treatment 3 (5 kg zeolite plant−1) resulted in a higher cumulative fruit yield between June to November when compared to the control (1676.42 kg fruit plant−1 and 1416.48 kg fruitplant−1, respectively) (Figure 1).

3.2. Weight and Size

The results showed that fruit weight ranged from 148 to 169 g across treatments, with no statistically significant differences (Table 5), indicating a limited effect of zeolite on this attribute.

3.3. Firmness

The firmness results showed values ranging from 1.19 to 1.45 N in the evaluated tomatoes (Table 6), with no statistically significant differences between treatments, except for Treatment 2 in October. In general, firmness showed minimal variation throughout the evaluation period, indicating relative stability of this attribute.

3.4. Color

The luminosity (L*) range obtained was between 30 and 48, with no observed differences between the samples and the control (Table 7). The a* and b* coordinates exhibited values ranging from 24 to 34 and from 24 to 37, respectively, falling in the red-yellow quadrant of the CIELab scale. In October, all zeolite treatments exhibited greater variability with respect to the control, while for the b* coordinate, Treatment 3 presented higher values in October and November. The results obtained for Hue ranged from 40 to 53. However, it was observed that all treatments exhibited an increase in value in November. The chroma parameter demonstrated a range of values between 32 and 48 saturations, indicating variations in October, as it was elevated in comparison to the control.

3.5. Physicochemical Characteristics of the Fruit

The results of pH, titratable acidity, and total soluble solids (TSS) are presented in Table 8. In the present study, pH values ranged from 3.68 to 4.54.

3.6. Maturity Index

The maturity index was evaluated by the ratio of TSS to titratable acidity, yielding values ranging from 8.93 to 42.06 (Table 9). However, higher values, between 35 and 42, were reported in the months of August and September, indicating good quality.

3.7. Total Phenolic Compounds and Antioxidant Capacity

Total phenolic compounds and antioxidant capacity (ABTS, DPPH and FRAP) were determined exclusively in Treatment 3 and the control, since this treatment produced the greatest amount of fruit over the months.
The total phenolic compound content of the control tomato samples exhibited values of 2.77 and 3.62 mg EAG/100 g dw (Table 10). For ABTS, the values were between 0.15 and 0.48 mg EAA/100 g dw for the control treatment. On the other hand, the zeolite (T3) treatment (0.01 mg EAA/100 g) obtained lower values. In contrast, Treatment 3 showed a significant increase in DPPH antioxidant capacity, reaching 5.50 µmol TE/100 g dm, particularly in November, with a recorded value of 10.84 µmol TE/100 g dm. Finally, the antioxidant activity of FRAP in this study was 0.09 µmol Fe(II)/100 g dm in the control, while that obtained in the zeolite treatment was lower.

4. Discussion

Based on the yield results, the increase in tomato production observed with zeolite application is likely associated with improvements in soil nutrient dynamics and water-holding capacity. The high cation exchange capacity of zeolites enables the adsorption and gradual release of essential nutrients such as ammonium, potassium, calcium and magnesium, thereby reducing nutrient leaching losses and improving synchrony between nutrient availability and plant demand [30,31,32]. From a physical perspective this controlled nutrient release may enhance root uptake efficiency and sustain photosynthetic activity through the crop cycle, which would explain the higher cumulative yields observed in the amended treatments [32].
However, it is important to note that yield responses to zeolite are not always consistent across studies, as they are strongly influenced by soil texture, irrigation regime, and climatic conditions. For instance, Kromann and Cuasapaz [33] reported yield increases in potato under zeolite amendment and attributed these to improved soil moisture conservation and nutrient retention. While these findings support the general role of zeolite as a soil conditioner, differences in crop type and environmental conditions limit direct comparability. Crops with different phenological sensitivity to water and nutrient stress may respond differently, suggesting that zeolite effects are highly context dependent rather than universally transferable.
Despite the positive response in total yield, a progressive decline in tomato production was observed across all treatments over time. This pattern suggests that environmental constraints had a stronger influence on crop performance than the soil amendment itself. Although plant acclimation mechanisms may contribute to physiological adjustment under changing conditions [34], the uniform decline across treatments indicates that external climatic variability was the dominant factor controlling productivity. In this context, temperature emerges as a critical limiting factor, as tomato fruit set and assimilate partitioning are highly sensitive to deviations from the optimal range (22–26 °C). The recorded environmental temperatures in Mineral del Chico (9–21 °C in August, decreasing to 4–12 °C later) fall well below this optimum [35,36], likely resulting in reduced pollen viability, impaired fertilization, and limited carbohydrate translocation. These physiological constraints are well documented in tomatoes under cold stress and can override positive soil amendments [36].
The temporary yield peak observed in August, particularly in Treatment 3, further supports the hypothesis that environmental conditions modulated the response to zeolite. Rather than being solely treatment driven, yield dynamics appear to reflect a strong interaction between soil amendment and seasonal climate variability. This interaction is often overlooked in controlled studies but is critical for interpreting field or semi-controlled greenhouse experiments [37,38,39].
Importantly, the increase in total yield was not accompanied by significant changes in fruit size or weight, suggesting that zeolite primarily influenced fruit number rather than individual fruit development. Postharvest weight loss observed across treatments (up to 21%) is consistent with expected physiological processes such as transpiration and respiration, rather than treatment effects. Similarly, the stability of equatorial diameter indicates that structural fruit development was not significantly altered by soil amendment. Although these results are consistent with some reports in the literature, they differ from studies where improvements in fruit quality parameters were observed under optimized nutrient conditions, suggesting that environmental constraints in the present study may have limited the expression of quality related traits [39,40].
From a quality perspective, firmness remained within an acceptable commercial range but close to the owner threshold reports in the literature. The lack of treatment differences suggests that firmness was primarily determined by postharvest handling, maturity stage, and environmental growing conditions rather than soil amendment effects [40]. This aligns with previous findings indicating that mechanical and physiological postharvest processes often dominate over preharvest nutritional effects in determining firmness variability [41,42].
Changes in color during ripening are consistent with the accumulation of carotenoids such as lycopene and β-carotene, which are regulated by both genetic and environmental factors [43,44]. However, the absence of strong treatment effects suggests that zeolite did not significantly alter pigment biosynthesis pathways under the conditions tested.
Similarly, pH, titratable acidity and soluble solids (TSS) remained within ranges reported for tomato under comparable conditions, although TSS values were lower than those reported in more favorable production systems. The decline in TSS over time deviates from the typical ripening-associated increase observed in tomato fruit, suggesting that environmental stress (particularly low temperature and reduced photosynthetic efficiency) may have disrupted normal carbohydrate accumulation and translocation processes. This interpretation is consistent with studies showing that carbon metabolism in tomatoes is highly sensitive to temperature and light limitations [45,46].
Regarding antioxidant capacity, the results were comparable to some reports but lower than those obtained under organic fertilization systems or in other productive regions [47,48,49,50,51]. These discrepancies highlight the strong influence of environmental conditions, genotype, and cultivation system on secondary metabolite accumulation [52,53]. Light intensity and temperature are key drivers of antioxidant biosynthesis while the ripening stage determines peak accumulation, typically at intermediate maturity stages before full ripeness [52,54,55,56,57,58]. Therefore, the relatively low antioxidant values observed may reflect suboptimal environmental conditions during fruit development rather than the absence of a fertilization effect [59].
Finally, differences among antioxidant assays (DPPH,FRAP) should be interpreted cautiously as they measure different chemical mechanisms. DPPH is more sensitive to lipophilic compounds such as carotenoids, while FRAP reflects overall reducing power, including hydrophilic antioxidants. Consequently, variations between studies may reflect methodological differences as well as true biological variations [60,61,62].

5. Conclusions

The application of the Bothá zeolitic material influenced tomato yield under the greenhouse conditions evaluated in this study. Among the tested treatments, T3 (5 kg zeolite plant−1) showed the highest cumulative yield during the harvest period from June to November. However, this increase in yield was not accompanied by consistent improvements in individual fruit weight, equatorial diameter, or firmness, which generally remained within commercial ranges and showed limited differences among treatments. Fruit color parameters indicated that the tomatoes remained within the red-yellow region of the CIELab scale, consistent with commercially ripe fruit. The maturity index varied throughout the harvest period as a function of total soluble solids and titratable acidity, reflecting the combined influence of treatment, harvest month, and environmental conditions. Regarding bioactive compounds and antioxidant response, total phenolic content in T3 was comparable to or slightly higher than the control in some months. However, antioxidant capacity showed an assay-dependent response. DPPH values increased in T3, particularly toward the end of the harvest period, whereas ABTS and FRAP did not show the same pattern and were generally lower than the control. Therefore, the results do not support a generalized improvement in antioxidant capacity, but rather suggest that zeolite application may influence specific antioxidant mechanisms under the evaluated conditions.
Overall, the Bothá zeolitic material showed potential as a soil amendment for improving tomato yield without negatively affecting the main physical and physicochemical fruit quality parameters. Nevertheless, the results should be interpreted within the specific conditions of this study, including the Paypay grafted double-stem tomato system, the local zeolitic material, the greenhouse management practices, and the seasonal environmental variability observed during the production period. Further studies are required to validate these findings under different cultivars, planting densities, zeolite application rates, and environmental conditions, as well as to assess long-term effects on soil properties and crop productivity.

Author Contributions

Conceptualization, J.L.R.-T., N.d.S.C.-C., E.A.-G., E.A.C.-U. and E.R.-M.; Methodology, J.L.R.-T., E.A.C.-U. and E.R.-M.; Software, J.L.R.-T., E.A.C.-U. and E.R.-M.; Validación, L.D.-O., N.d.S.C.-C., E.A.-G., E.A.C.-U. and E.R.-M.; Formal analysis, J.L.R.-T., N.d.S.C.-C., E.A.-G., E.A.C.-U. and E.R.-M.; Investigation, J.L.R.-T., E.A.C.-U. and E.R.-M.; Resources, N.d.S.C.-C., E.A.C.-U. and E.R.-M.; Writing—original draft, J.L.R.-T., E.R.-M. and E.A.C.-U.; Writing—review & editing, J.L.R.-T., E.R.-M. and E.A.C.-U.; Visualization, J.L.R.-T., L.D.-O., E.A.C.-U. and E.R.-M.; Supervision, L.D.-O., N.d.S.C.-C., E.A.-G., E.A.C.-U. and E.R.-M. All authors have read and agreed to the published version of the manuscript.

Funding

This study was conducted with the support of the resources and facilities provided by the Universidad Autónoma del Estado de Hidalgo. Publication costs were funded through the Institutional Program PAO (Programa Anual Operativo-Fortalecimiento de capacidad académica PAO-2016–1019). The authors also gratefully acknowledge Eng. Gamaliel Ortega Meza for providing the space for the development of the study greenhouse La Presa, located in Mineral del Chico, Hidalgo, Mexico. They also gratefully acknowledge his support in covering the costs associated with the establishment and management of the tomato crop, as well as for providing the tomato fruits used in this research.

Data Availability Statement

The raw data supporting the conclusions of this article will be made available by the authors on request.

Conflicts of Interest

The authors declare no conflicts of interest.

References

  1. Rezk, A.; Abhary, M.; Akhkha, A. Tomato (Solanum lycopersicum L.) breeding strategies for biotic and abiotic stresses. In Advances in Plant Breeding Strategies: Vegetable Crops; Springer Int. Publ: Berlin/Heidelberg, Germany, 2021; pp. 363–405. [Google Scholar] [CrossRef]
  2. Eslami, E.; Carpentieri, S.; Pataro, G.; Ferrari, G. A comprehensive overview of tomato processing by-product valorization by conventional methods versus emerging technologies. Foods 2022, 12, 166. [Google Scholar] [CrossRef] [PubMed]
  3. Fideicomisos Instituidos en Relación con la Agricultura (FIRA). Panorama Agroalimentario: Tomate Rojo 2019; Dirección de Investigación y Evaluación Económica y Sectorial: Ciudad de México, México, 2019. Available online: https://sursureste.org.mx/wp-content/uploads/2022/11/Panorama-Agroalimentario-Tomate-rojo-2019.pdf (accessed on 30 May 2026).
  4. Castañeda-Villa, A.M.; Lobato-Ortiz, R.; García-Zavala, J.J.; Calderón-Zavala, G.; Hernández-Bautista, A.; López-Hernández, A. Identification of outstanding Saladette tomato lines with a widened genetic base. Agrociencia 2023, 57, 1183–1203. [Google Scholar] [CrossRef]
  5. Amuji, C.F.; Beaumont, L.J.; Rodríguez, M.E. Simulating the impact of projected West African heatwaves and water stress on the physiology and yield of three tomato varieties. Adv. Hortic. Sci. 2020, 34, 147–156. [Google Scholar] [CrossRef]
  6. Pinela, J.; Montoya, C.; Carvalho, A.M.; Martins, V.; Rocha, F.; Barata, A.M.; Ferreira, I.C.F.R. Phenolic composition and antioxidant properties of ex-situ conserved tomato (Solanum lycopersicum L.) germplasm. Food Res. Int. 2019, 125, 108545. [Google Scholar] [CrossRef] [PubMed]
  7. García-Alonso, F.J.; García-Valverde, V.; Navarro-González, I.; Martín-Pozuelo, G.; González-Barrio, R.; Periago, M.J. Tomato. In Nutritional Composition and Antioxidant Properties of Fruits and Vegetables; Academic Press: Cambridge, MA, USA, 2020; pp. 255–271. [Google Scholar] [CrossRef]
  8. Coyago-Cruz, E.; Corell, M.; Moriana, A.; Mapelli-Brahm, P.; Hernanz, D.; Stinco, C.M.; Beltrán-Sinchiguano, E.; Meléndez-Martínez, A.J. Study of commercial quality parameters, sugars, phenolics, carotenoids and plastids in different tomato varieties. Food Chem. 2019, 277, 480–489. [Google Scholar] [CrossRef] [PubMed]
  9. Gutiérrez, T.J.; Santiago, S.Y.O.; Hernández, F.A.D.; Pinedo, E.J.M.; López, B.G.; López, P.C.U. Influencia de los métodos de cocción sobre la actividad antioxidante y compuestos bioactivos de tomate (Solanum lycopersicum L.). Nova sci. 2019, 11, 53–68. [Google Scholar] [CrossRef]
  10. Raza, B.; Hameed, A.; Saleem, M.Y. Fruit nutritional composition, antioxidant and biochemical profiling of diverse tomato (Solanum lycopersicum L.) genetic resource. Front. Plant Sci. 2022, 13, 1035163. [Google Scholar] [CrossRef] [PubMed]
  11. Çolak, N.G.; Eken, N.T.; Ülger, M.; Frary, A.; Doğanlar, S. Mapping of quantitative trait loci for antioxidant molecules in tomato fruit: Carotenoids, vitamins C and E, glutathione and phenolic acids. Plant Sci. 2020, 292, 110393. [Google Scholar] [CrossRef] [PubMed]
  12. Zhan, X.; Zhu, Y. Abiotic Stress and Mechanisms of Stress Tolerance in Vegetable Crops. In Growth Regulation and Quality Improvement of Vegetable Crops: Physiological and Molecular Features; Springer Nature: Singapore, 2025; pp. 183–224. [Google Scholar] [CrossRef]
  13. Food and Agriculture Organization of the United Nations (FAO). El Cultivo Protegido en Clima Mediterráneo. In Estudios FAO Producción y Protección Vegetal 90; FAO: Roma, Italia, 2002. [Google Scholar]
  14. Eroglu, N.; Emekci, M.; Athanassiou, C.G. Applications of natural zeolites on agriculture and food production. J. Sci. Food Agric. 2017, 97, 3487–3499. [Google Scholar] [CrossRef] [PubMed]
  15. Días, N.M.; Núñez, M.S. La zeolita como alternativa para la sostenibilidad de la producción platanera. Avances 2017, 19, 84–91. [Google Scholar]
  16. Gholamhoseini, M.; Habibzadeh, F.; Ataei, R.; Hemmati, P.; Ebrahimian, E. Zeolite and hydrogel improve yield of greenhouse cucumber in soil-less medium under water limitation. Rhizosphere 2018, 6, 7–10. [Google Scholar] [CrossRef]
  17. de la Nuez Pantoja, E.Y.; Iznaga, I.R.; Fuentes, G.R.; Petranovskii, V.; García, A.M.; Gámez, J.J.C.; García, O.C. Natural Clinoptilolite Materials Enriched in Nitrogen and Phosphorous for Agricultural Purposes: A Comprehensive Study on Their Development. J. Inorg. Organomet. Polym. Mater. 2024, 34, 2522–2542. [Google Scholar] [CrossRef]
  18. Mohammad, Z.H.; Ahmad, F.; Ibrahim, S.A.; Zaidi, S. Application of nanotechnology in different aspects of the food industry. Discov. Food 2022, 2, 12. [Google Scholar] [CrossRef]
  19. Mahmoud, A.W.M.; Rashad, H.M.; Esmail, S.E.A.; Alsamadany, H.; Abdeldaym, E.A. Application of Silicon, Zinc, and Zeolite Nanoparticles—A Tool to Enhance Drought Stress Tolerance in Coriander Plants for Better Growth Performance and Productivity. Plants 2023, 12, 2838. [Google Scholar] [CrossRef] [PubMed]
  20. NMX-FF-009-1982; Productos Alimenticios no Industrializados Para Uso Humano—Fruta Fresca—Determinación del Tamaño con Base al Diámetro Ecuatorial. Diario Oficial de la Federación: Ciudad de México, México, 1982.
  21. Esquivel Reyes, N.V. Análisis de Textura en Frutas. Master’s Thesis, Universidad Nacional de Trujillo, Trujillo, Perú, 2017. [Google Scholar]
  22. NMX-F-317-S-1978; Determinación de pH en Alimentos. Dirección General de Normas (DGN): Ciudad de México, México, 1978.
  23. Association of Official Analytical Chemists. Official Methods of Analysis, 12th ed.; AOAC: Washington, DC, USA, 1975. [Google Scholar]
  24. Torres, R.; Montes, E.J.; Pérez, O.A.; Andrade, R.D. Relación del color y del estado de madurez con las propiedades fisicoquímicas de frutas tropicales. Inf. Tecnol. 2013, 24, 51–56. [Google Scholar] [CrossRef]
  25. Saura-Calixto, F.; Serrano, J.; Goñi, I. Intake and bioaccessibility of total polyphenols in a whole diet. Food Chem. 2007, 101, 492–501. [Google Scholar] [CrossRef]
  26. Stintzing, F.; Herbach, K.; Mobhammer, M.R.; Carle, R.; Yi, W.; Sellappa, S.; Akoh, C.C.; Brunch, R.; Felker, P. Color, betalains pattern and antioxidant properties of cactus pear (Opuntia ssp.) clones. J. Agric. Food Chem. 2005, 53, 442–451. [Google Scholar] [PubMed]
  27. Kuskoski, E.M.; Asuero, A.G.; Troncoso, A.M.; Mancini-Filho, J.; Fett, R. Aplicación de diversos métodos químicos para determinar actividad antioxidante en pulpa de frutos. Food Sci. Technol. 2005, 25, 726–732. [Google Scholar] [CrossRef]
  28. Morales, F.J.; Jiménez-Pérez, S. Free radical scavenging capacity of Maillard reaction products as related to colour and fluorescence. Food Chem. 2001, 72, 119–125. [Google Scholar] [CrossRef]
  29. Pérez-Jiménez, J.; Arranz, S.; Tabernero, M.; Díaz-Rubio, M.E.; Serrano, J.; Goñi, I.; Saura-Calixto, F. Updated methodology to determine antioxidant capacity in plant foods, oils and beverages: Extraction, measurement and expression of results. Food Res. Int. 2008, 41, 274–285. [Google Scholar] [CrossRef]
  30. Bouwman, A.F.; Beusen, A.H.W.; Lassaletta, L.; Van Apeldoorn, D.F.; Van Grinsven, H.J.M.; Zhang, J. Lessons from temporal and spatial patterns in global use of N and P fertilizer on cropland. Sci. Rep. 2017, 7, 40366. [Google Scholar] [CrossRef] [PubMed]
  31. Noulas, C.; Torabian, S.; Qin, R. Crop nutrient requirements and advanced fertilizer management strategies. Agronomy 2023, 13, 2017. [Google Scholar] [CrossRef]
  32. Mondal, M.; Biswas, B.; Garai, S.; Sarkar, S.; Banerjee, H.; Brahmachari, K.; Kumar, P.; Maitra, S.; Skalicky, M.; Ondrisik, P.; et al. Zeolites enhance soil health, crop productivity and environmental safety. Agronomy 2021, 11, 448. [Google Scholar] [CrossRef]
  33. Kromann, P.; Cuasapaz, P. Libro de memorias. In Proceedings of the VII Congreso Ecuatoriano de la Papa: Adaptación al Cambio Climático, Tulcán, Ecuador, 29–30 June 2017. [Google Scholar]
  34. Cacoango Pilco, M.A. Estudio de la Adaptación y Rendimiento de 10 Variedades de Tomate Riñón (Solanum lycopersicum L.) bajo Invernadero, Cantón Riobamba, Provincia de Chimborazo. Bachelor’s Thesis, Escuela Superior Politécnica de Chimborazo, Riobamba, Ecuador, 2018. [Google Scholar]
  35. Biondi, F.; Balducci, F.; Capocasa, F.; Visciglio, M.; Mei, E.; Vagnoni, M.; Mezzetti, B.; Mazzoni, L. Environmental Conditions and Agronomical Factors Influencing the Levels of Phytochemicals in Brassica Vegetables Responsible for Nutritional and Sensorial Properties. Appl. Sci. 2021, 11, 1927. [Google Scholar] [CrossRef]
  36. Mariani, L.; Cola, G.; Bulgari, R.; Ferrante, A.; Martinetti, L. Space and time variability of heating requirements for greenhouse tomato production in the Euro-Mediterranean area. Sci. Total Environ. 2016, 562, 834–844. [Google Scholar] [CrossRef] [PubMed]
  37. NMX-FF-031-1997-SCFI; Productos Alimenticios no Industrializados Para Consumo Humano—Hortalizas Frescas—Tomate (Lycopersicum esculentum Mill.)—Especificaciones. Diario Oficial de la Federación: Ciudad de México, México, 1998.
  38. Salas-Pérez, L.; González, F.J.A.; García, C.M.; Sifuentes-Ibarra, E.; Parra-Terrazas, S.; Preciado-Rangel, P. Calidad biofísica y nutracéutica de frutos de tomate producido con sustratos orgánicos. Nova Sci. 2016, 8, 310–325. [Google Scholar] [CrossRef]
  39. Li, X.; Huang, H.; Zhang, L.; Zaho, L. Effect of postharvest storage temperature and duration on tomato fruit quality. Foods 2025, 14, 1002. [Google Scholar] [CrossRef] [PubMed]
  40. Al-Dairi, M.; Pathare, P.B.; Al-Yahyai, R. Effect of postharvest transport and storage on color and fitness quality of tomato. Horticulturae 2021, 7, 163. [Google Scholar]
  41. Martínez-González, M.E.; Balois-Morales, R.; Alia-Tejacal, I.; Cortes-Cruz, M.A.; Palomino-Hermosillo, Y.A.; López-Gúzman, G.G. Poscosecha de frutos: Maduración y cambios bioquímicos. Rev. Mex. De Cienc. Agrícolas 2017, 8, 4075–4087. [Google Scholar] [CrossRef]
  42. Kurina, A.B.; Solovieva, A.E.; Khrapalova, I.A.; Artemyeva, A.M. Biochemical composition of tomato fruits of various colors. Vavilov J. Genet. Breed. 2021, 25, 514. [Google Scholar] [CrossRef] [PubMed]
  43. Hu, J.; Wang, J.; Muhammad, T.; Yang, T.; Li, N.; Yang, H.; Wang, B. Integrative analysis of metabolome and transcriptome of carotenoid biosynthesis reveals the mechanism of fruit color change in tomato (Solanum lycopersicum L.). Int. J. Mol. Sci. 2024, 25, 6493. [Google Scholar] [CrossRef] [PubMed]
  44. Pandurangaiah, S.; Sadashiva, A.T.; Shivashankar, K.S.; Sudhakarao, D.V.; Ravishankar, K.V. Carotenoid content in cherry tomatoes correlated to the color space values L*, a*, b*: A non-destructive method of estimation. J. Hortic. Sci. 2020, 15, 27–34. [Google Scholar] [CrossRef]
  45. Redding, M.; Bolten, S.; Gu, G.; Luo, Y.; Micallef, S.A.; Millner, P.; Nou, X. Growth and inactivation of Listeria monocytogenes in sterile extracts of fruits and vegetables: Impact of the intrinsic factors pH, sugar and organic acid content. Int. J. Food Microbiol. 2023, 386, 110043. [Google Scholar] [CrossRef] [PubMed]
  46. Wang, H.; Yu, H.; Chai, L.; Lu, T.; Li, Y.; Jiang, W.; Li, Q. Exogenous sucrose confers low light tolerance in tomato plants by increasing carbon partitioning from stems to leaves. J. Agric. Food Chem. 2023, 71, 20625–20642. [Google Scholar] [CrossRef] [PubMed]
  47. Mohammed, A.U.; Soresa, D.N.; Fufa, T.W. Tailoring Tomato (Solanum lycopersicum L.) Traits to Microclimates: A Multilocation Evaluation of Yield and Quality Responses in Western Ethiopia. Scientifica 2025, 2025, 6345142. [Google Scholar] [CrossRef] [PubMed]
  48. Rousseau, S.; Kyomugasho, C.; Celus, M.; Hendrickx, M.E.; Grauwet, T. Barriers impairing mineral bioaccessibility and bioavailability in plant-based foods and the perspectives for food processing. Crit. Rev. Food Sci. Nutr. 2020, 60, 826–843. [Google Scholar] [CrossRef] [PubMed]
  49. Monge, P.J.E.; Loría, C.M. Producción de tomate (Solanum lycopersicum) en invernadero: Comparación agronómica entre tipos de tomate. Posgrado Y Soc. Rev. Cient. Sist. Estud. Posgrado 2019, 17, 1–20. [Google Scholar] [CrossRef]
  50. Saeed, A.; Kauser, S.; Hussain, A.; Nadeem, A.A. Comparative variability of nutrients, minerals, phenolics and anthocyanins with antioxidant potentials during fruit development stages in five Mulberry (Morus) cultivars. J. Berry Res. 2023, 13, 355–377. [Google Scholar] [CrossRef]
  51. Cano-Hernández, R.; Martínez-Damián, M.T.; Moreno-Pérez, E.D.C.; Sánchez-del Castillo, F.; Cruz-Álvarez, O.; Rodríguez-Roque, M.J. Efecto de biorreguladores del crecimiento sobre indicadores de calidad fisicoquímica en frutos de tomate cultivados en invernadero. Inf. Técnica Económica Agrar. 2018, 115, 120–133. [Google Scholar] [CrossRef]
  52. Batista-Silva, W.; Nascimento, V.L.; Medeiros, D.B.; Nunes-Nesi, A.; Ribeiro, D.M.; Zsögön, A.; Araújo, W.L. Modifications in Organic Acid Profiles During Fruit Development and Ripening: Correlation or Causation? Front. Plant Sci. 2018, 9, 1689. [Google Scholar] [CrossRef] [PubMed]
  53. Luo, A.; Zhou, C.; Chen, J. The associated carbon conversion rate and source–sink enzyme activity in tomato fruit subjected to water stress and potassium application. Front. Plant Sci. 2021, 12, 681145. [Google Scholar] [CrossRef] [PubMed]
  54. Rivera, C.J.C. Parámetros Fisicoquímicos Para la Obtención de Modelos de Predicción en la Calidad Poscosecha del Tomate (Solanum lycopersicum). Master’s Thesis, Universidad Autónoma de Nuevo León, Monterrey, México, 2011. [Google Scholar]
  55. Dobrin, A.; Nedelus, A.; Bujor, O.; Mot, A.; Zugravu, M.; Badulescu, L. Nutritional quality parameters of the fresh red tomato varieties cultivated in organic system. Sci. Pap. Ser. B Hortic. 2019, 63, 439–443. [Google Scholar]
  56. Shuai, H.; Chen, T.; Wlk, T.; Rozhon, W.; Lange, M.J.P.; Sieberer, T.; Lange, T.; Poppenberger, B. SlCESTA is a brassinosteroid-regulated bHLH transcription factor of tomato that promotes chilling tolerance and fruit growth when over-expressed. Front. Plant Sci. 2022, 13, 930805. [Google Scholar] [CrossRef] [PubMed]
  57. Wang, F.; Zhang, X.P.; Yang, Q.Z.; Zhao, Q.F. Exogenous melatonin delays postharvest fruit senescence and maintains the quality of sweet cherries. Food Chem. 2019, 301, 125311. [Google Scholar] [CrossRef] [PubMed]
  58. Consejo Nacional de Ciencia y Tecnología; Santiago, F.J. Secado de Jugo de Jitomate Por Aspersión con Coadyuvantes y Antioxidantes Naturales para Mejorar la Retención de Compuestos Bioactivos; Repositorio Nacional CONACYT: Ciudad de México, México, 2018.
  59. Riahi, A.; Hdider, C. Bioactive compounds and antioxidant activity of organically grown tomato (Solanum lycopersicum L.) cultivars as affected by fertilization. Sci. Hortic. 2013, 151, 90–96. [Google Scholar] [CrossRef]
  60. Tariq, A.; Zeng, F.; Graciano, C.; Ullah, A.; Sadia, S.; Ahmed, Z.; Murtaza, G.; Ismoilov, K.; Zhang, Z. Regulation of Metabolites by Nutrients in Plants. In Plant Ionomics; Singh, V.P., Siddiqui, M.H., Eds.; John Wiley & Sons: Hoboken, NJ, USA, 2023. [Google Scholar] [CrossRef]
  61. Munteanu, I.G.; Apetrei, C. Analytical methods used in determining antioxidant activity: A review. Int. J. Mol. Sci. 2021, 22, 3380. [Google Scholar] [CrossRef] [PubMed]
  62. Bakhshizadeh, M.; Moghaddam, T.N.; Tavassoli, M.; Mousavi Khaneghah, A.; Ansarifar, E. Characterization, Extraction, and Encapsulation Technologies of Lycopene and Applications in Functional Food Products: An Updated Review. Food Bioprocess Technol. 2025, 18, 3059–3099. [Google Scholar] [CrossRef]
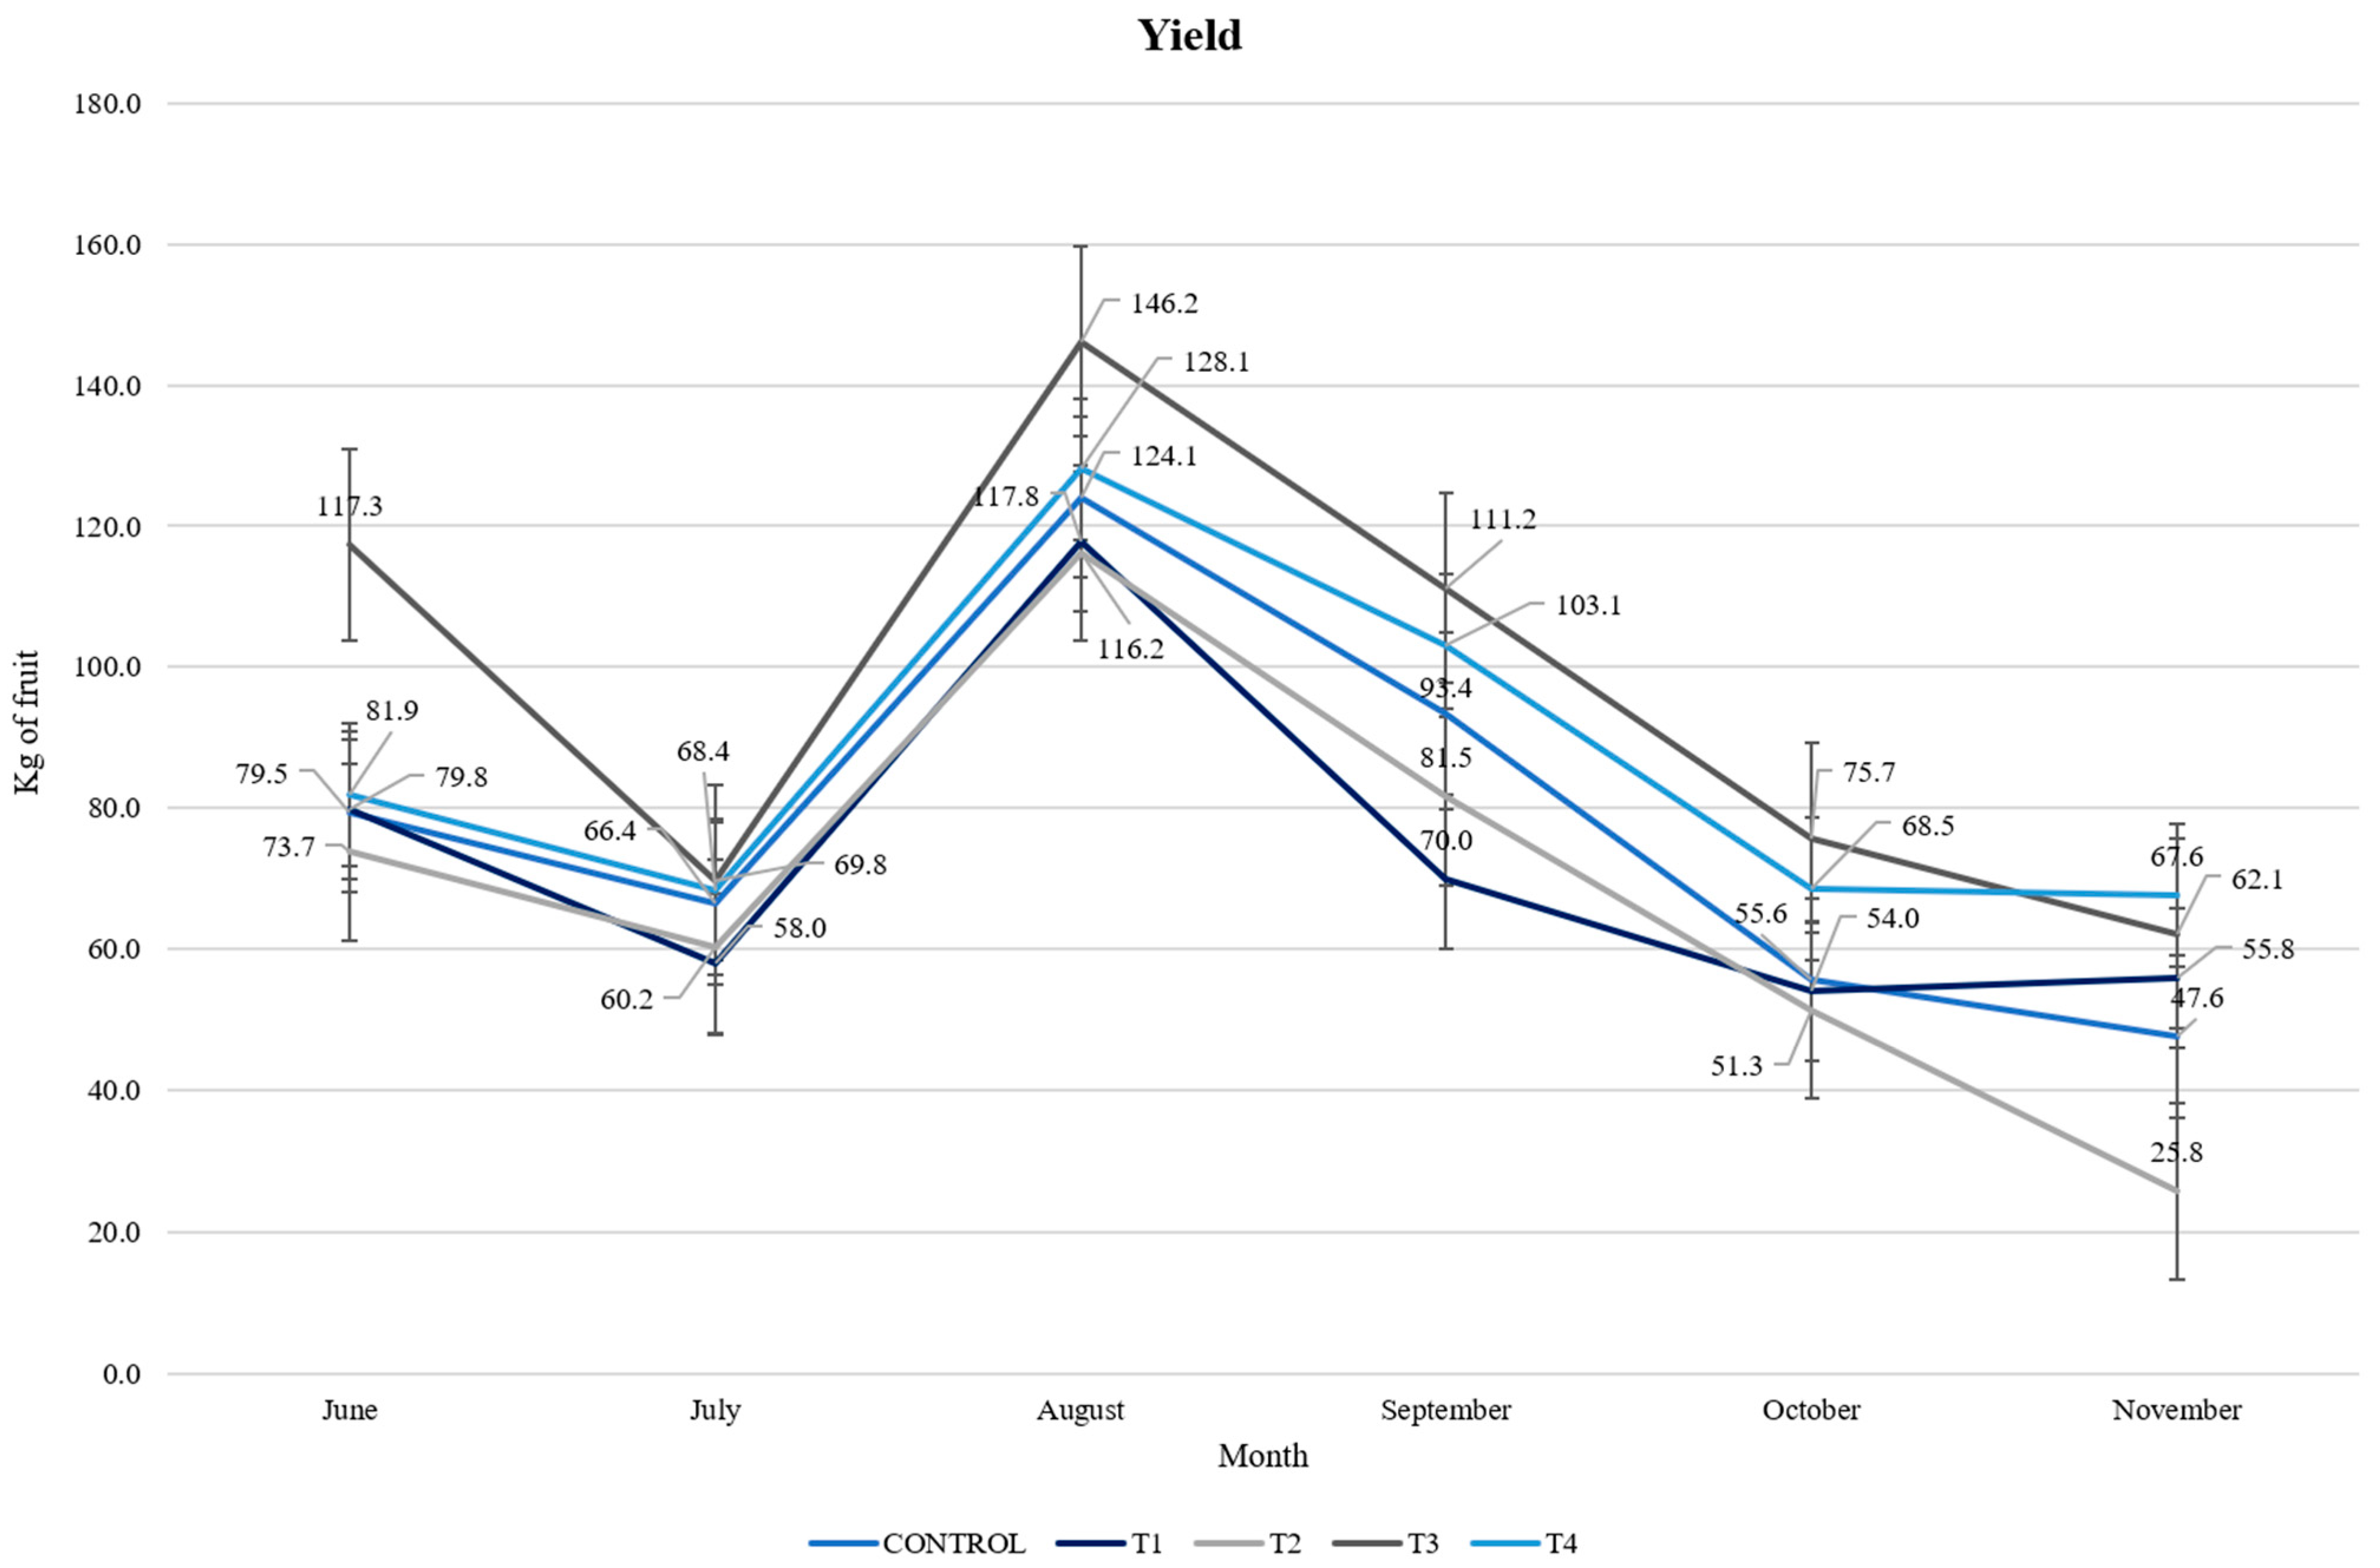
Figure 1. Yield results for tomato production.
Crops 06 00065 g001
Table 1. Major element concentration.
CompoundContent (%)
SiO265.75
Al2O311.88
CaO4.85
K2O3.99
Fe2O32.04
MgO1.26
Na2O1.13
MnO0.04
P2O50.04
LOI (Loss on ignition)8.83
Total99.99
Table 2. Trace element concentration.
CompoundContent (µg g−1)
Ba836
Sr165
Rb137
Zr132
Zn62
V51
Y38
Cr31
Pb19
Nb18
Th16
Ni10
Cu7
Co6
Table 3. Physicochemical properties.
PropertyValue
Cation Exchange Capacity [saturated with Na+ and subsequently with NH4+]0.78 meq g−1
Density
Pycnometer method
1.10 g cm−3
Specific Surface area
(BET method)
26.8 m2 g−1
Thermal Stability (°C)350 °C
Table 4. Classification by size according to equatorial diameter.
SizeMinimumMaximum
Diameter in mm
Small3852
Medium5160
Big5971
Extra large70>71
Norma Oficial Mexicana NMX FF 009 [20].
Table 5. Weight and size of tomato with different zeolite treatments and their monthly monitoring.
Weight
ControlT1T2T3T4
June148.04 ± 13.82 aV139.86 ± 7.99 bcV151.94 ± 7.99 bV151.05 ± 10.19 bcV169.39 ± 16.24 bV
July142.82 ± 25.16 aV144.77 ± 32.31 bcV136.68 ± 32.31 bV131.01 ± 18.32 abcV157.29 ± 23.99 bV
August147.37 ± 18.52 aV160.34 ± 19.98 cV149.58 ± 19.08 abV156.55 ± 26.53 bcV150.28 ± 38.57 bV
September145.83 ± 35.14 aV104.74 ± 25.52 aV139.98 ± 19.08 abV158.55 ± 21.12 cV137.66 ± 19.86 abV
October130.83 ± 15.26 aV120.54 ± 10.84 abV119.65 ± 25.52 abV119.30 ± 29.69 abV108.88 ± 11.08 aV
November118.80 ± 3.28 aV107.41 ± 14.21 aV119.51 ± 14.21 aV113.02 ± 30.29 aV122.65 ± 12.55 abV
Size
June5.82 ± 0.30 aV5.91 ± 0.40 abV5.85 ± 0.40 aV5.75 ± 0.34 abcV5.90 ± 0.50 aV
July5.90 ± 0.23 aV5.61 ± 0.34 abV5.68 ± 0.34 aV5.70 ± 0.22 abcV5.93 ± 0.46 aV
August6.11 ± 0.30 aV6.11 ± 0.15 bV5.92 ± 0.16 aV5.93 ± 0.23 bcV5.87 ± 0.40 aV
September5.64 ± 0.42 aV5.63 ± 0.38 abV5.73 ± 0.38 aV6.20 ± 0.15 cV5.83 ± 0.39 aV
October5.58 ± 0.32 aV5.35 ± 0.23 aV5.25 ± 0.23 aV5.24 ± 0.30 aV5.16 ± 0.34 aV
November5.44 ± 0.14 aV5.36 ± 0.31 aV5.62 ± 0.31 aV5.33 ± 0.43 abV5.33 ± 0.31 aV
The values are the average ± SD (n = 9). a–c Different letters in the same column indicate significant differences between months of the same treatment. V Different letters on the same line indicate significant differences between samples in the same month. Treatment 1 (T1) (1 kg zeolite plant−1), Treatment 2 (T2) (3 kg zeolite plant−1), Treatment 3 (T3) (5 kg zeolite plant−1), Treatment 4 (T4) (7 kg zeolite plant−1).
Table 6. Firmness results in tomatoes with different zeolite treatments per month.
ControlT1T2T3T4
June1.45 ± 0.11 abV1.43 ± 0.14 abV1.36 ± 0.26 abV1.19 ± 0.26 aV1.30 ± 0.24 aV
July1.67 ± 0.39 abV2.12 ± 0.59 bV1.70 ± 0.15 abV2.27 ± 0.89 bV1.82 ± 0.51 aV
August1.56 ± 0.21 abV1.95 ± 0.31 abV1.65 ± 0.14 abV1.70 ± 0.08 abV1.72 ± 0.18 aV
September1.44 ± 0.17 aV1.34 ± 0.25 aV1.33 ± 0.15 aV1.47 ± 0.15 abV1.72 ± 0.30 aV
October1.95 ± 0.34 abV2.08 ± 0.37 abV1.82 ± 0.33 bW2.14 ± 0.33 abV1.73 ± 0.37 aV
November2.07 ± 0.29 bV1.94 ± 0.85 abVW1.77 ± 0.05 abVW1.66 ± 0.14 abV1.85 ± 0.04 aVW
The values are the average ± SD (n = 9). a,b Different letters in the same column indicate significant differences between months of the same treatment. V,W Different letters on the same line indicate significant differences between samples in the same month. Treatment 1 (T1) (1 kg zeolite plant−1), Treatment 2 (T2) (3 kg zeolite plant−1), Treatment 3 (T3) (5 kg zeolite plant−1), Treatment 4 (T4) (7 kg zeolite plant−1).
Table 7. Color in tomato with different zeolite treatments and its monitoring by month.
L*
ControlT1T2T3T4
June35.52 ± 3.32 aV39.80 ± 2.85 bcV39.39 ± 1.85 bV39.85 ± 1.53 bV39.66 ± 1.13 bV
July34.96 ± 1.49 aV33.98 ± 1.77 abV33.35 ± 0.83 aV32.03 ± 3.58 aV31.09 ± 3.61 aV
August33.84 ± 4.99 aV30.84 ± 5.00 aV33.61 ± 3.97 aV39.90 ± 3.68 bV37.83 ± 3.69 bV
September43.95 ± 2.26 bV44.26 ± 2.29 cdV42.88 ± 2.54 bcV41.99 ± 3.15 bcV42.26 ± 1.11 bcV
October46.89 ± 0.89 bV46.70 ± 0.36 dV45.77 ± 2.31 cV48.24 ± 2.15 cV45.40 ± 1.99 cV
November47.14 ± 2.66 bV46.98 ± 0.76 dV46.81 ± 1.42 cV46.84 ± 2.77 cV47.06 ± 1.16 cV
a*
June29.63 ± 0.26 abV29.89 ± 0.81 bcV31.46 ± 1.82 abV29.96 ± 1.01 abV30.53 ± 0.91 abcV
July26.24 ± 2.15 aV26.37 ± 2.22 abV27.65 ± 1.85 abV26.70 ± 2.63 aV24.77 ± 2.23 aV
August25.19 ± 1.37 aV23.24 ± 1.41 aV26.06 ± 0.82 aV26.61 ± 1.76 aV26.18 ± 2.09 abV
September33.13 ± 3.27 bV33.77 ± 1.40 cV32.90 ± 3.28 bV34.10 ± 0.57 bV34.65 ± 2.15 cV
October24.08 ± 3.55 aV30.45 ± 4.01 bcW29.85 ± 1.79 abVW26.40 ± 1.80 aVW29.90 ± 2.35 abcVW
November29.63 ± 4.04 abV29.46 ± 0.61 bcV28.46 ± 4.35 abV28.54 ± 4.62 aV31.71 ± 5.11 bcV
b*
June25.64 ± 1.00 aV26.31 ± 0.81 aV26.52 ± 1.75 aV27.07 ± 0.97 abV26.61 ± 0.29 aV
July25.98 ± 2.56 aV25.07 ± 2.49 aV25.95 ± 3.06 aV25.99 ± 3.49 aV28.25 ± 1.45 aV
August24.64 ± 2.04 aV25.52 ± 1.29 aV26.59 ± 1.22 aV26.89 ± 1.11 abV28.08 ± 2.42 aV
September33.49 ± 1.80 bV33.90 ± 1.49 bV34.36 ± 2.50 bV32.19 ± 0.82 bcV32.78 ± 0.92 abV
October32.74 ± 1.43 bV35.26 ± 2.12 bV35.61 ± 1.83 bV33.54 ± 2.73 cdV32.38 ± 1.52 abV
November34.30 ± 2.04 bV37.06 ± 1.25 bV36.89 ± 1.17 bV33.54 ± 3.34 dV36.04 ± 6.18 bV
HUE
June40.87 ± 1.09 aV41.35 ± 1.62 aV40.10 ± 0.52 aV42.04 ± 1.58 aV41.08 ± 0.73 aV
July44.66 ± 2.89 abVW43.52 ± 1.60 abV43.05 ± 1.90 abV44.13 ± 1.28 aV48.65 ± 1.60 cW
August44.31 ± 1.12 abV47.68 ± 1.61 bcdV45.55 ± 0.55 bcV45.32 ± 2.00 abV46.99 ± 2.41 bcV
September45.38 ± 2.63 abV45.10 ± 2.20 abcV46.29 ± 2.49 bcV43.34 ± 0.57 aV43.43 ± 2.02 abV
October53.77 ± 5.05 cV48.68 ± 3.74 cdV50.01 ± 3.08 cdV51.75 ± 2.25 bcV47.30 ± 3.05 bcV
November49.81 ± 3.25 bcV51.50 ± 1.08 dV52.52 ± 3.88 dV53.61 ± 6.71 cV48.62 ± 2.23 cV
CHROMA
June39.20 ± 0.74 aV39.83 ± 0.20 aV41.15 ± 2.50 abV40.39 ± 0.90 abV40.50 ± 0.81 abV
July35.96 ± 2.77 aV36.40 ± 3.18 abV37.94 ± 3.35 aV37.27 ± 4.30 aV37.58 ± 2.44 aV
August32.25 ± 2.36 aV34.53 ± 1.65 aV37.23 ± 1.42 aV37.85 ± 1.60 abV38.42 ± 2.74 aV
September47.14 ± 3.11 cV47.88 ± 0.90 cV47.61 ± 3.55 cV46.89 ± 0.88 cdV47.72 ± 1.61 bV
October40.76 ± 1.27 abV46.63 ± 3.92 cW46.52 ± 0.51 bcW42.71 ± 2.82 bcVW44.12 ± 1.51 abVW
November45.04 ± 3.74 bcV47.35 ± 1.07 cV46.67 ± 3.21 bcV48.34 ± 0.75 dV48.03 ± 7.81 bV
Values are mean ± SD (n = 9). a–d Different letters in the same column indicate significant differences between months of the same treatment. V,W Different letters on the same line indicate significant differences between samples in the same month. Treatment 1 (T1) (1 kg zeolite plant−1), Treatment 2 (T2) (3 kg zeolite plant−1), Treatment 3 (T3) (5 kg zeolite plant−1), Treatment 4 (T4) (7 kg zeolite plant−1).
Table 8. Physicochemical characteristics of tomato with different zeolite treatment and its monitoring by month.
pH
ControlT1T2T3T4
June4.38 ± 0.01 cW4.31 ± 0.00 bv4.32 ± 0.00 cV4.32 ± 0.01 bV4.33 ± 0.00 bV
July4.08 ± 0.02 bW4.04 ± 0.02 aVW4.04 ± 0.02 bVW4.03 ± 0.01 aV4.03 ± 0.00 aVW
August3.99 ± 0.01 bV3.98 ± 0.00 aV4.03 ± 0.01 bW4.03 ± 0.01 aW4.03 ± 0.00 aW
September4.41 ± 0.04 cV4.49 ± 0.01 cW4.47 ± 0.03 dVW4.54 ± 0.02 dW4.53 ± 0.00 cW
October4.36 ± 0.01 cV4.40 ± 0.02 bcVW4.43 ± 0.00 dW4.42 ± 0.00 cW4.38 ± 0.01 bV
November3.68 ± 0.11 aV3.98 ± 0.08 aW3.83 ± 0.05 aVW4.02 ± 0.00 aW4.01 ± 0.07 aW
Titratable Acidity
June0.24 ± 0.04 cdW0.23 ± 0.04 bcVW0.24 ± 0.04 cW0.18 ± 0.02 bcVW0.15 ± 0.00 bv
July0.26 ± 0.00 dV0.25 ± 0.00 cV0.25 ± 0.00 cV0.25 ± 0.00 cV0.25 ± 0.00 cV
August0.12 ± 0.01 aV0.12 ± 0.00 aV0.11 ± 0.00 aV0.10 ± 0.01 aV0.11 ± 0.01 aV
September0.16 ± 0.01 abV0.18 ± 0.01 bV0.18 ± 0.01 bV0.14 ± 0.01 abV0.17 ± 0.01 bV
October0.18 ± 0.01 bcVW0.22 ± 0.03 bcW0.12 ± 0.01 aV0.19 ± 0.04 bcVW0.15 ± 0.00 bVW
November0.31 ± 0.00 dX0.25 ± 0.00 cVW0.24 ± 0.00 cV0.25 ± 0.00 cW0.25 ± 0.00 cW
Total soluble solids
June3.63 ± 0.63 abV3.86 ± 0.15 bV4.33 ± 0.15 cdV3.80 ± 0.26 bV3.76 ± 0.11 bcV
July3.83 ± 0.15 abVWX4.13 ± 0.05 bcX3.73 ± 0.20 bVW4.06 ± 0.05 bWX3.66 ± 0.15 bV
August4.13 ± 0.05 bcVW4.56 ± 0.32 cdW4.20 ± 0.10 bcVW4.16 ± 0.15 bVW3.90 ± 0.10 bcV
September4.86 ± 0.05 cX5.00 ± 0.00 dY5.00 ± 0.00 eY3.93 ± 0.05 bV4.23 ± 0.05 dw
October3.56 ± 0.28 abV4.76 ± 0.15 dW4.80 ± 0.17 deW4.00 ± 0.10 bV4.03 ± 0.15 cdV
November3.00 ± 0.40 aW2.50 ± 0.00 dVW2.50 ± 0.26 aVW2.46 ± 0.15 aVW2.30 ± 0.00 aV
Values are mean ± SD (n = 9). a–e Different letters in the same column indicate significant differences between months of the same treatment. V–Y Different letters on the same line indicate significant differences between samples in the same month. Treatment 1 (T1) (1 kg zeolite plant−1), Treatment 2 (T2) (3 kg zeolite plant−1), Treatment 3 (T3) (5 kg zeolite plant−1), Treatment 4 (T4) (7 kg zeolite plant−1).
Table 9. Maturity index in tomatoes with different zeolite treatments and its monitoring by month.
ControlT1T2T3T4
June15.11 ± 2.67 abV16.82 ± 2.25 bcV17.49 ± 3.54 aV20.49 ± 1.71 bcVW24.56 ± 0.16 cW
July14.06 ± 0.65 abV26.53 ± 0.23 bW14.55 ± 1.07 aVW16.09 ± 0.26 abVW14.52 ± 0.85 bVW
August32.63 ± 2.92 cV26.41 ± 1.56 eV35.37 ± 3.54 aV39.16 ± 5.04 cbV35.14 ± 3.68 dV
September19.58 ± 2.91 bV27.58 ± 1.62 dV42.06 ± 3.21 bW26.54 ± 3.27 cV24.45 ± 1.93 cV
October19.58 ± 2.91 bV21.22 ± 2.25 cV34.11 ± 7.41 bW22.26 ± 3.93 bcV25.95 ± 1.09 cVW
November9.58 ± 1.27 aV9.83 ± 0.22 aV10.21 ± 1.18 V8.93 ± 0.68 aV8.95 ± 0.18 aV
Values are mean ± SD (n = 9). a–e Different letters in the same column indicate significant differences between months of the same treatment. V,W Different letters on the same line indicate significant differences between samples in the same month. Treatment 1 (T1) (1 kg zeolite plant−1), Treatment 2 (T2) (3 kg zeolite plant−1), Treatment 3 (T3) (5 kg zeolite plant−1), Treatment 4 (T4) (7 kg zeolite plant−1).
Table 10. Phenolic compound content and antioxidant activity of tomato grown with and without zeolite (100 g dm).
TPC
(mg GAE)
ABTS
(mg AAE)
DPPH
(µmol TE)
FRAP
(µmol Fe(II))
ControlT3ControlT3ControlT3ControlT3
June3.29 ± 0.06 bc3.30 ± 0.07 a0.90 ± 0.29 c0.01 ± 0.01 a*7.39 ± 1.43 a5.50 ± 1.01 ab*0.09 ± 0.02 a0.03 ± 0.00 a*
July2.77 ± 0.07 a3.54 ± 0.09 ab*0.15 ± 0.07 a0.02 ± 0.01 a*5.79 ± 2.15 a6.55 ± 1.09 bc0.10 ± 0.14 a0.07 ± 0.03 c
August3.62 ± 0.42 c3.40 ± 0.10 ab0.47 ± 0.06 b0.03 ± 0.01 a*7.77 ± 1.36 a3.77 ± 0.98 a*0.14 ± 0.00 a0.05 ± 0.01 abc*
September3.30 ± 0.25 bc3.59 ± 0.16 ab*0.31 ± 0.04 ab0.07 ± 0.02 b*6.53 ± 3.28 a8.68 ± 1.03 cd0.07 ± 0.00 a0.04 ± 0.00 ab*
October3.08 ± 0.32 ab3.77 ± 0.46 bc*0.35 ± 0.06 ab0.10 ± 0.01 c*5.70 ± 3.57 a9.61 ± 2.24 d0.04 ± 0.00 a0.05 ± 0.00 abc
November3.23 ± 0.12 bc4.11 ± 0.10 c*0.48 ± 0.04 b0.07 ± 0.01 bc*8.80 ± 0.80 a10.84 ± 0.83 d*0.04 ± 0.00 a0.04 ± 0.00 bc*
Values are mean ± SD (n = 9). a–d Different letters in the same column indicate significant differences between months of the same treatment. * Indicates significant differences between treatments in the same month for each assessment performed. * TPC: Total phenolic compounds. Treatment 3 (T3).
Disclaimer/Publisher’s Note: The statements, opinions and data contained in all publications are solely those of the individual author(s) and contributor(s) and not of MDPI and/or the editor(s). MDPI and/or the editor(s) disclaim responsibility for any injury to people or property resulting from any ideas, methods, instructions or products referred to in the content.