1. Introduction
Road safety has been a major concern for road users, road designers, traffic operators, and transport planners. This issue is particularly evident on rural roads, where heavy traffic and increased freight transport are noticeable [
1]. In parallel, speed management has been identified as an important contributing factor to road safety [
2,
3]. Determining an appropriate speed limit is often based on the geometric characteristics and functional classification of roads; limited consideration is given to the structural condition of pavements, despite the clear effects of pavement distress and deformation on vehicle operating conditions [
4]. However, pavement distress and deformation affect road safety as they directly affect vehicle stability, braking performance, and the risk of hydroplaning. These factors have been identified as among the most contributing factors in road risk assessment and analysis studies [
5]. Recent research confirmed that high run-off and head-on crash risks are linked to road condition and skid resistance; as such, improvements to road condition can upgrade the level of safety [
6,
7]. For example, roughness causes sudden vertical accelerations that negatively affect vehicle stability, especially heavy vehicles [
8]. Skid resistance and water accumulation are reduced by surface polishing and rutting, leading to increased hydroplaning and longer stopping distances under wet conditions [
9]. When speed limits are not adjusted for these conditions, drivers may operate at the posted speed limit but not at a safe speed. Chen et al. (2017) [
10] presented crash frequency models for three levels of crash severity and five levels of road surface condition, using a multivariate random-parameters negative binomial model. They found that, for pavements in poor condition, the surface condition variable was a significant random parameter in a normally distributed crash model; higher roughness increases the expected crash frequency.
Alhasan et al. (2018) [
11] investigated the effect of traffic volume, posted speed limits, skid numbers, ride quality (IRI), and rut depths (RDs) on crash frequency for one mile of a roadway in Iowa using negative binomial regression models. The findings showed a significant impact of pavement skid resistance on crash frequency and severity, especially at higher speeds. Integrating safety management into the pavement management system can optimize the performance of the highway network.
Tahir et al. (2022) [
12] examined safety performance following changes in pavement performance indicators, including the international roughness index (IRI), rutting, and cracking, on selected roads in Bahawalpur, Punjab, Pakistan. They suggested setting boundaries of performance indicators, which can be used to evaluate the need for rehabilitation; these values are IRI = 1.75–2 m/Km; rutting = 9–10 mm; and Pavement Condition Rating (PCR) = 75–80.
Mkwata and Chong (2022) [
13] provided an overview of the relationship between safety performance measures and pavement surface conditions, including roughness, rutting, and skid resistance. The findings showed that pavement surface conditions have a significant impact on road safety. The direct effect of pavement distress on ride comfort and the indirect effect on driver distraction can lead to a loss of vehicle control, consequently, increased road risk. This effect is more pronounced during rainy weather and at night. When the rut depth exceeds 23.5 mm and the IRI exceeds 3.2 m/km, the probability of crashes increases. However, the skid resistance threshold value was inconclusive due to the absence of a uniform global methodology. These results may be valuable for engineers during pavement design, maintenance, and safety improvement.
Zhang et al. (2022) [
14] proposed a methodology to simulate and assess the impact of unbalanced water-filled rutting on driving stability, with particular focus given to the vehicle’s lateral dynamic stability. The results showed that the unbalanced water depths in the left- and right-hand ruts led to different friction levels and uncontrolled driving along the roadway. This is most likely to cause fatal crashes when the vehicle speed exceeds 80 km/h and the rut width exceeds 0.7 m. When a vehicle’s lateral offset exceeds 1.025 mm, vehicles may run into the adjacent lane and cause conflicts. The risk of a lane change is more severe when the vehicle’s lateral acceleration exceeds 0.4 and when rutting width and length increase.
Shyaa and Abd Rahma (2022) [
15] showed that an invisible rut can catch the driver unaware, leading to loss of control. The maximum risk of a crash was found to occur at 3 mm rut depth on dry road surfaces and at 6 mm rut depth on wet road surfaces. Also, the risk of a rut-related crash was found to increase by 20% to 30% on wet road surfaces in comparison to dry surfaces.
Wang et al. (2024) [
16] developed safety performance function (SPF) models to relate the international roughness index (IRI), which is a measure of pavement roughness, to observed crash frequencies for two-lane rural roadways in Pennsylvania. They found that the IRI has a different impact on total crash frequency compared to crash frequency with fatalities and injuries and rear-end crashes. This is likely due to the way roughness can affect travel speeds. This suggests that pavement management decisions should consider safety benefits.
Cai et al. (2024) [
17] introduced a novel method for braking performance assessment based on water-depth estimation using LiDAR-measured pavement geometry and vehicle–pavement simulation. The tire–pavement friction was analyzed, and the dynamic braking performance was studied using the 85th percentile stopping distance as an indicator. The results demonstrated that rainfall intensity and vehicle velocity significantly affect braking risk. Additionally, pavement rutting accumulates greater water depth, thereby elevating braking safety risks.
Abubakar, M.H. (2024) [
5] evaluated key parameters influencing traffic safety, specifically pavement conditions and weather elements, through a review of related published articles. They highlighted the critical role of pavement friction and roughness in accidents, with rutting during rain and night having a pronounced impact. They also found that driving at higher speeds on these pavement conditions leads to a higher rate of single-vehicle crashes, while lower speeds may cause multiple-vehicle crashes.
Huynh et al. (2025) [
18] estimated a macro-level random-parameter negative binomial regression model using data on traffic crashes, census, traffic volume, and pavement condition for arterials and freeways in Victoria, Australia. They found that road segments with very poor rutting or roughness generally tend to have more traffic-related crashes, especially those with fatal outcomes.
Lebaku et al. (2025) [
19] examined the relationship between pavement performance and crash frequency and severity using data from the Iowa Department of Transportation (DOT). Machine learning models were used along with negative binomial and ordered probit regression models. The study’s key findings reveal that higher speed limits, well-maintained roads, and higher friction scores correlate with lower crash rates. In contrast, rougher roads and adverse weather conditions are associated with higher crash severity.
Recent advances in mechanistic–empirical pavement design, particularly the MEPDG and Pavement ME framework, have enabled improved prediction of fatigue cracking and rutting under site-specific traffic and climatic conditions. These models incorporate layered elastic response, material characterization, and environmental calibration to forecast long-term pavement performance. Recent studies have applied Pavement ME to evaluate innovative materials demonstrating enhanced resistance to rutting and improved structural durability under repeated heavy loading. Such research highlights the capability of mechanistic–empirical approaches to predict structural distress with greater realism compared to purely empirical design methods [
20,
21,
22].
However, limited research has explicitly linked mechanistic distress indicators to operational traffic control measures such as speed limit selection. The present study extends the mechanistic framework beyond distress prediction by integrating structural reliability with hydroplaning, braking performance, and dynamic stability constraints to establish a condition-based speed management approach.
The mechanistic pavement analysis approach based on KENPAVE is used to evaluate actual traffic loading data, critical strain responses, fatigue life, and rutting life. Safety-related indicators are then derived to quantify the impact of pavement distress on vehicle stability and braking performance; these indicators are subsequently used to establish rational speed limit constraints that reflect both structural and operational safety considerations.
The main contributions of this research are threefold. First, it provides a quantitative linkage between pavement distress parameters and key road safety risk factors. Second, it introduces a pavement-based speed limit selection module that integrates hydroplaning, braking, and stability criteria. Third, it demonstrates the practical applicability of the proposed framework through a real highway case study subjected to conditions of heavy traffic loads. The proposed methodology supports a more adaptive, safety-oriented approach to speed management, where pavement condition is essential to traffic control and road safety management strategies.
2. Method of the Research
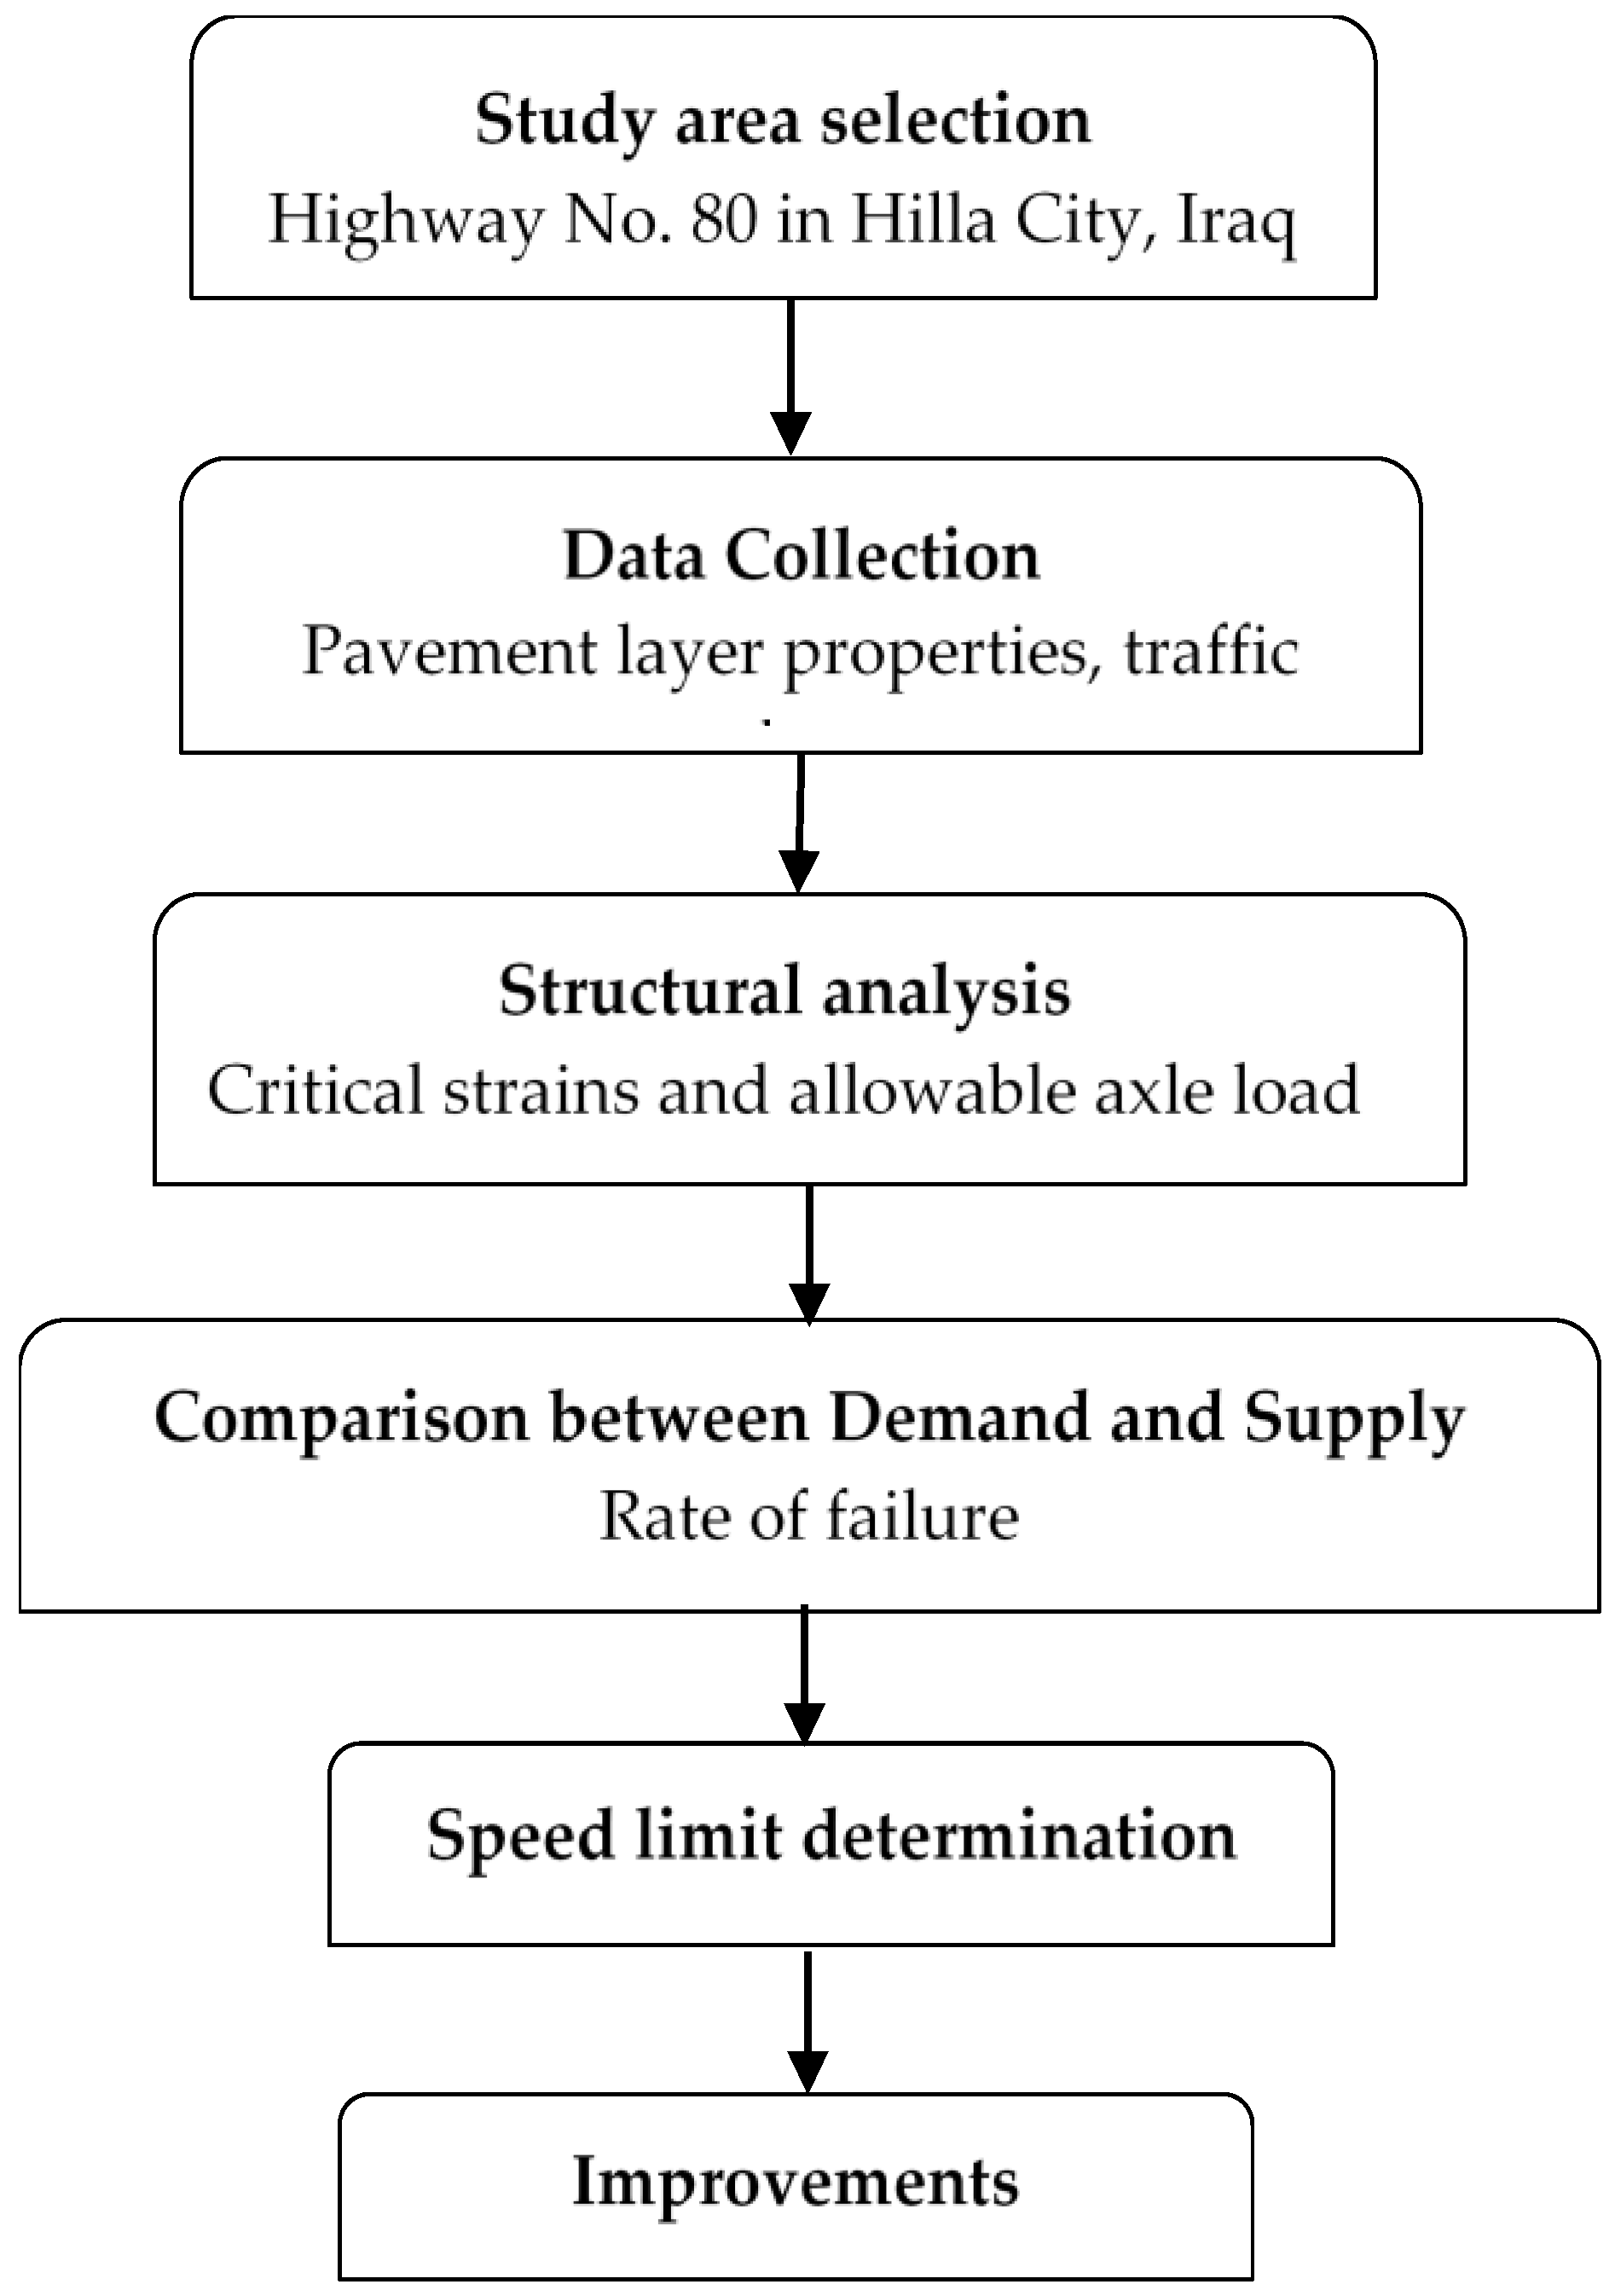
The steps shown in
Figure 1 were followed to achieve the research aim. The first step is selecting a case study where failures have been observed. The necessary data are then identified and collected. After that, the KENPAVE software ver. 1.0 is used to analyze the data and determine the critical strains and allowable repetitions of the applied axle load to avoid damage. Following this, safety-related calculations are conducted to identify the margins of the set speed limit that should be considered to avoid crashes and conflicts under damaged and wet conditions. The findings are based on the last step of the proposal process. The details of the following steps are explained in the following subsections.
2.1. The Study Area
The selected road for this study is Street 80, located in Hill City, Iraq. This roadway serves as a vital urban connector and is designed with a flexible pavement structure. The analyzed section spans approximately 4.4 km and serves as a regional arterial connector between major highways: the Hilla–Karbala Highway and the Hillah–Al-Najaf Highway. Given its strategic importance for regional traffic flow and heavy vehicular usage, this section was selected for detailed deformation and damage analysis. The pavement structure (thin asphalt surface over stabilized base and granular subbase with low-CBR subgrade) is typical of many flexible pavements constructed in central Iraq during the same development period. Regarding climatic conditions, the study area lies within a semiarid region characterized by high summer temperatures and limited rainfall, which are representative of much of central and southern Iraq.
The roadway comprises three lanes in each direction, each measuring 3.65 m in width. The road features a shoulder width of 2.0 m on both sides. This case study provides significant insights into the structural assessment and improvement of pavement performance on this roadway.
2.2. Data Collection
Two types of data were collected in this study: layer properties and vehicle classification.
2.2.1. Layer Properties
To identify the material properties used to construct pavement layers, official document data were collected from sources provided by the General Authority of Roads and Bridges, as detailed in
Table 1. These properties are constant along the roadway section.
The resilient modulus of the subgrade (
Mr) was estimated using a CBR-based empirical correlation commonly adopted in AASHTO mechanistic–empirical design procedures [
23,
24]:
where
CBR is expressed as a percentage. Given the measured subgrade CBR of 4.5%, the estimated resilient modulus was calculated accordingly. The related charts developed by AASHTO [
22,
23] were used to estimate the modulus of elasticity of the granular subbase layer E3, substituting
CBR with 38%, and the modulus of elasticity for asphalt layers (
E1,
E2) by substituting Marshal Stability with 9 KN and 7 KN, respectively.
These calculated modulus values were then used as input parameters in the KENPAVE layered elastic analysis to compute critical tensile and compressive strains at governing depths. Compared to direct resilient modulus testing or Falling Weight Deflectometer (FWD) backcalculation, this approach introduces epistemic uncertainty into the strain predictions and subsequent reliability calculations. This limitation is acknowledged in the interpretation of the results.
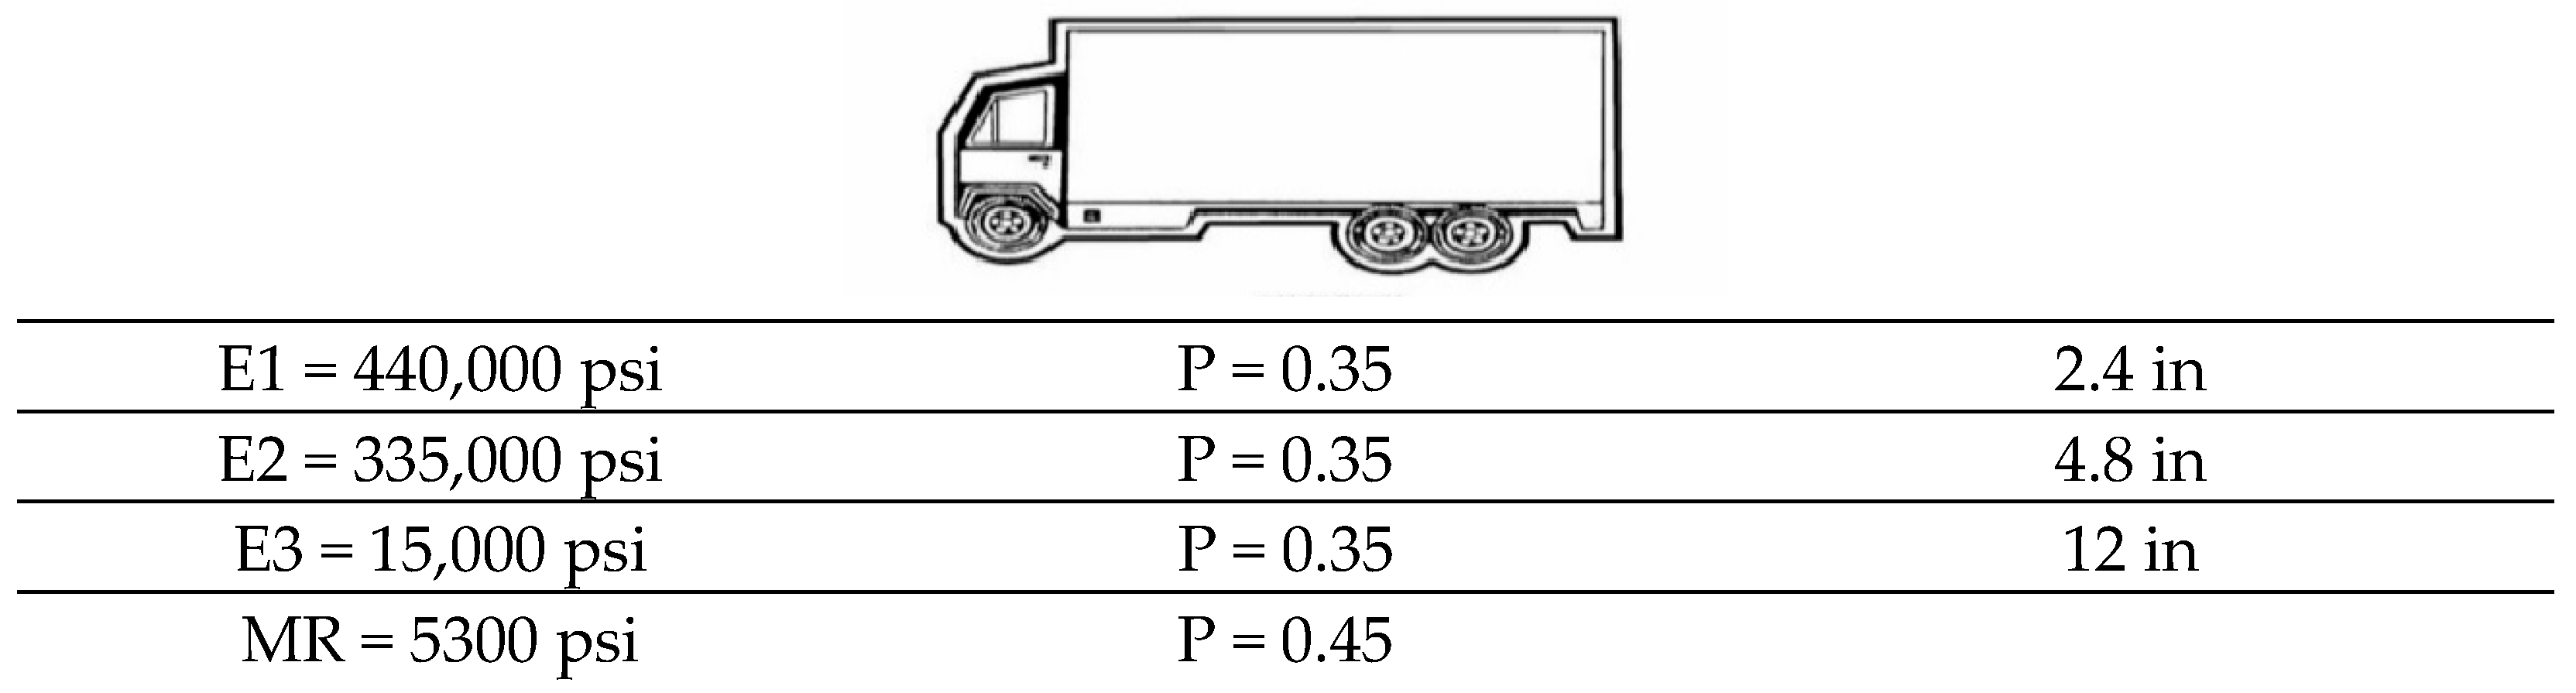
Figure 2 shows the pavement structure layers, along with the values obtained for
E and
a.
The pavement structure consists of a relatively thin asphalt surface layer (2.4 in) over a stabilized bituminous base (4.8 in), a granular subbase (12 in), and a low-strength subgrade. The thin surface layer may lead to high tensile strains at its bottom, increasing the likelihood of fatigue cracking under repeated traffic. However, the thicker base layer with a high elastic modulus can accommodate stress distribution across pavement layers, reducing service deflection. The properties of the subbase layer with a thickness of 12 are sufficient to provide load spreading; however, lower stiffness promotes the concentration of vertical compressive strains at the top of the subgrade. The subgrade also exhibits a low resilient modulus, indicating a relatively weak foundation, high vertical compressive strain at the top of the subgrade, and a high probability of rutting.
2.2.2. Vehicle Classification
The trucks were counted at the site according to axle classification. The roadway section was divided into 22 spatial segments to capture potential variability in traffic composition and loading conditions along the corridor. Due to the absence of permanent Weigh-In-Motion (WIM) monitoring stations along the study corridor, axle classification and vehicle weight estimation were conducted using manual traffic counts and standard axle-load assumptions based on Iraqi specifications. Photos were taken of the trucks to identify their types according to the Iraqi Specification and estimate their weight. Manual counts were conducted during representative peak freight operating periods to capture heavy vehicle composition and axle configurations. Vehicle types were classified according to Iraqi specifications, and axle loads were estimated based on standard allowable load assumptions.
Because continuous 24 h traffic monitoring was not available, the observed hourly traffic volumes were converted to estimated daily traffic using standard hourly-to-daily expansion factors provided by the local road authority. The resulting daily traffic was then used to compute the Average Daily Traffic (ADT) for each vehicle category.
The number of trucks by type recorded for segment 1 is shown in
Table 2. The weight of vehicles was calculated according to the Iraqi specification. For example, the weight of vehicle type 2–S3 was calculated as follows:
The weight of in-front-single axle = 7 tons;
The weight of a rear single axle = 13 tons;
The weight of tandem axles = 20;
The total weight of vehicle type 2–S2 = 7 + 13 + 20 = 40 tons.
Table 2.
The types and weights of trucks in the study area (segment 1).
Table 2.
The types and weights of trucks in the study area (segment 1).
| Number | Weight | Type |
|---|
| 17 | 40 ton | Type 2–S2 |
| 43 | 20 ton | Type 2 |
| 11 | 27 ton | Type 3 |
| 3 | 47 ton | Type 2–3 |
The most common category of truck operating in the study area is Type 2–2S. Heavy multi-axle vehicles, including Type 3 (27 tons) and Type 2–3 (47 tons), are also present, indicating a substantial proportion of overloaded or near-capacity trucks in the traffic stream at peak hour. These cause damage to the pavement. Heavy vehicles are significantly affected by surface damage, especially when it leads to water accumulation. They experience larger dynamic wheel loads, higher vertical accelerations over local settlement, and longer braking distances. Therefore, there is a significant concern of speed-related hazards, particularly under wet pavement conditions.
2.3. Estimating Equivalent Single-Axle Load ESAL
The truck factor (TF) for each axle was estimated according to the Iraqi Specifications, and the TF for each vehicle was then calculated, with the results shown in
Table 3 (for segment 1).
The Growth Factor is calculated based on service life using Equation (2), as shown below.
where
r = 6%,
n = 30 years, and
Gm = 66.44.
The adopted annual growth rate of 6% reflects regional freight traffic trends and transportation authority projections for arterial corridors in the study region. However, long-term traffic growth is inherently uncertain and may vary due to economic development, land-use changes, and policy adjustments. A constant growth assumption over the entire design period represents an engineering approximation. To evaluate the influence of growth uncertainty on structural reliability, a sensitivity analysis was conducted by varying cumulative ESAL demand within ±15% and ±25% of the baseline estimate (
Section 3.4). This approach allows assessment of the robustness of the proposed framework under plausible demand variations.
Initial daily traffic is split evenly across all traffic lanes. However, directional and lane distribution factors should be considered to identify initial traffic on the design lane. Any lane of a two-lane highway can be considered the design lane, whereas on multilane highways, the outside lane is the design lane. Identifying the design lane is important because, in some cases, more trucks travel in one direction than the other, or they may travel with heavy loads in one direction and empty loads in the other. Thus, it is necessary to determine the relevant proportion of trucks on the design lane. LDF is assumed to be 80% [
23,
24].
The initial daily traffic is in two directions. Direction distribution (DD) is usually based on the assumption that 50% of the traffic travels in each direction, unless special conditions differ between them. The directional/lane distribution factor will then be the multiplication of LDF by the DD, resulting in 40%.
The ESAL is estimated according to the service life [
23,
24].
The results are shown in
Table 4.
Table 5 presents the results of all segments, including their means and standard errors.
2.4. Pavement Structural Analysis
KENPAVE Software ver. 1.0 was used to estimate stress, strain, and displacement at four points. The load magnitude per axle was assumed to be 4500 lb (for dual tires). This is estimated by dividing the load per axle for the standard axle load (W 18) by 2. For dual tires, axle load = 9000/2 = 4500 lbs per tire. The contact pressure is assumed to be 95 psi, per Iraqi tire pressure specifications. Contact radius is estimated using Equation (4):
The result is 3.9 in; tire spacing (center-to-center) is assumed to be ≈13.5 in.
Regarding the number of points (Np), the critical points for stress, strain, and deflection calculation were considered as follows:
The first stress point at the surface of the asphalt layer, with a depth of 0 in, is used to consider surface deflection and potential rutting initiation.
The second stress point, at the bottom of the asphalt layer and 2.4 in from the surface, is used to estimate the critical tensile strain, which is responsible for predicting fatigue cracking.
The third stress point, at the midpoint of the base course and at a depth of 4.8 in from the surface, is used to identify stress distribution and potential shear damage in the base.
The fourth stress point, at the top of subgrade soil and a depth of 19.2 in from the surface, is used to estimate critical vertical compressive strain, which is responsible for rutting prediction.
2.5. Damage Analysis
In this step, the fatigue life (Nf) and rutting life (Nr) are estimated for each segment using the critical horizontal tensile strain at the bottom of the asphalt layer and the vertical compressive strain at the top of the subgrade, respectively. The results are compared with the estimated ESAL.
2.5.1. Fatigue Damage
Fatigue life was estimated using the strain-based bottom-up fatigue cracking model presented in the Asphalt Institute MS-1 manual (1982 edition) [
24], which relates allowable load repetitions to the horizontal tensile strain at the bottom of the asphalt layer. Equation (5) can be used to estimate the maximum allowable axle-load frequency to avoid fatigue cracking (
Nf) [
24].
The typical constants for flexible pavements (Asphalt Institute) are as follows:
K1 = 0.0796,
K2 = 3.291, and
K3 = 0.854 [
24].
2.5.2. Rutting Damage
According to Shell and the Asphalt Institute [
24], Equation (6) can be used to estimate the maximum allowable axle load that pavement with specific characteristics can support before rutting occurs (
Nr):
where
k = 1.365 ×10
−9 and
n = 4.477.
2.6. Speed Limit
To explore the link between pavement distress and speed management, a speed limit decision module was incorporated. In doing so, the speed limit is reset to account for the probability of pavement damage. From this, the recommended speed limit is set to the minimum speed that satisfies the hydroplaning, braking, stability constraints, and structural reliability.
2.6.1. Hydroplaning Speed
Hydroplaning speed is the maximum safe speed at which a tire can be controlled during sliding on a wet pavement surface [
25,
26,
27].
According to Iraq specifications, tire pressure was assumed to be 95 psi; therefore
= 9.75 psi. Previous studies have shown that hydroplaning is initiated at approximately 70–90% of the predicted threshold speed, depending on water depth and surface condition [
25,
26,
27]. Accordingly, the wet speed limit was conservatively selected as 70% of the hydroplaning speed, 70 km/h.
2.6.2. The Stopping Sight Distance (SSD)
The SSD is the distance deemed safe to prevent braking and sliding risks at candidate speeds on wet or damaged pavement surfaces; a low SSD may lead to rear-end crashes. Equation (8) [
28] was used as follows:
The SSD is given in meters, where V is the speed of the vehicle in m/sec,
g = 9.81 m/s
2, and
f = friction factor. The friction factors = 0.4–0.5 for dry conditions and 0.2–0.3 for wet conditions [
28]. The target SSD is selected based on the current speed limit under dry conditions. For example, the current speed limit in the study area is 100 k/m, and the corresponding SSD under dry conditions is 87.4 m (assuming
f = 0.45). Under damaged and wet conditions, the 87.4 m corresponds to 67 km/h.
2.6.3. Vertical-Shock Speed
To account for the effects of local settlements and rut edges, the critical vertical acceleration is incorporated into the framework to identify a safe speed limit. Vertical acceleration affects ride comfort, tire–pavement contact, steering instability, and loss of control. These factors can lead to rollover crashes on damaged and wet pavement surfaces. The general equation used to determine the vertical acceleration (
a) is as follows:
To identify a safe speed limit, the target “
a” should be determined. High acceleration may lead to partial or complete loss of tire control and a decrease in lateral friction, both of which are dangerous on a wet surface. Therefore, maximum vertical acceleration (
amax) should be specified. This is determined by substituting Equation (10) into the calculation:
According to previous studies [
29,
30,
31], safe
amax should be less than 0.3 g. According to Hal et al. [
27], although a maximum of 0.2 to 0.3 g is considered safe for dry conditions, this may cause sudden steering over-reaction, hydroplaning at the rut edge, and loss of control braking. Therefore, in this research, the safe
amax was determined to be 0.2 g. Accordingly, a safer speed for vertical shock consideration can be estimated from Equation (11).
2.7. System-Level Reliability–Safety Coupling
To establish a system-level interaction between structural capacity and speed selection, the framework is formulated as a constrained decision problem in which operating speed must satisfy both structural reliability and safety performance criteria. Structural reliability is evaluated as
where
μNf and
μNr are the mean allowable load repetitions for fatigue and rutting, respectively, and
μESAL is the cumulative traffic demand.
σNf,
σNr, and
σESAL are the corresponding standard deviations.
Zf and
Zr are the
Z values corresponding to the structural reliability indices for fatigue (
Rf) and rutting (
Rr), respectively.
The recommended speed limit is set to the minimum speed that satisfies the hydroplaning, braking, stability constraints, and structural reliability:
RT is the target structural reliability representing an acceptable probability of failure. In this study, RT is presented as a user-defined agency threshold, and future work will calibrate it based on local policy and risk tolerance. In this formulation, pavement structural reliability constrains the feasible operating domain, while hydroplaning, braking, and dynamic stability criteria define speed-dependent safety limits. The final operating speed corresponds to the intersection of these structural and operational constraints.
3. Results and Discussion
3.1. Horizontal and Vertical Strains
Table 6 shows the results of ESAL estimation.
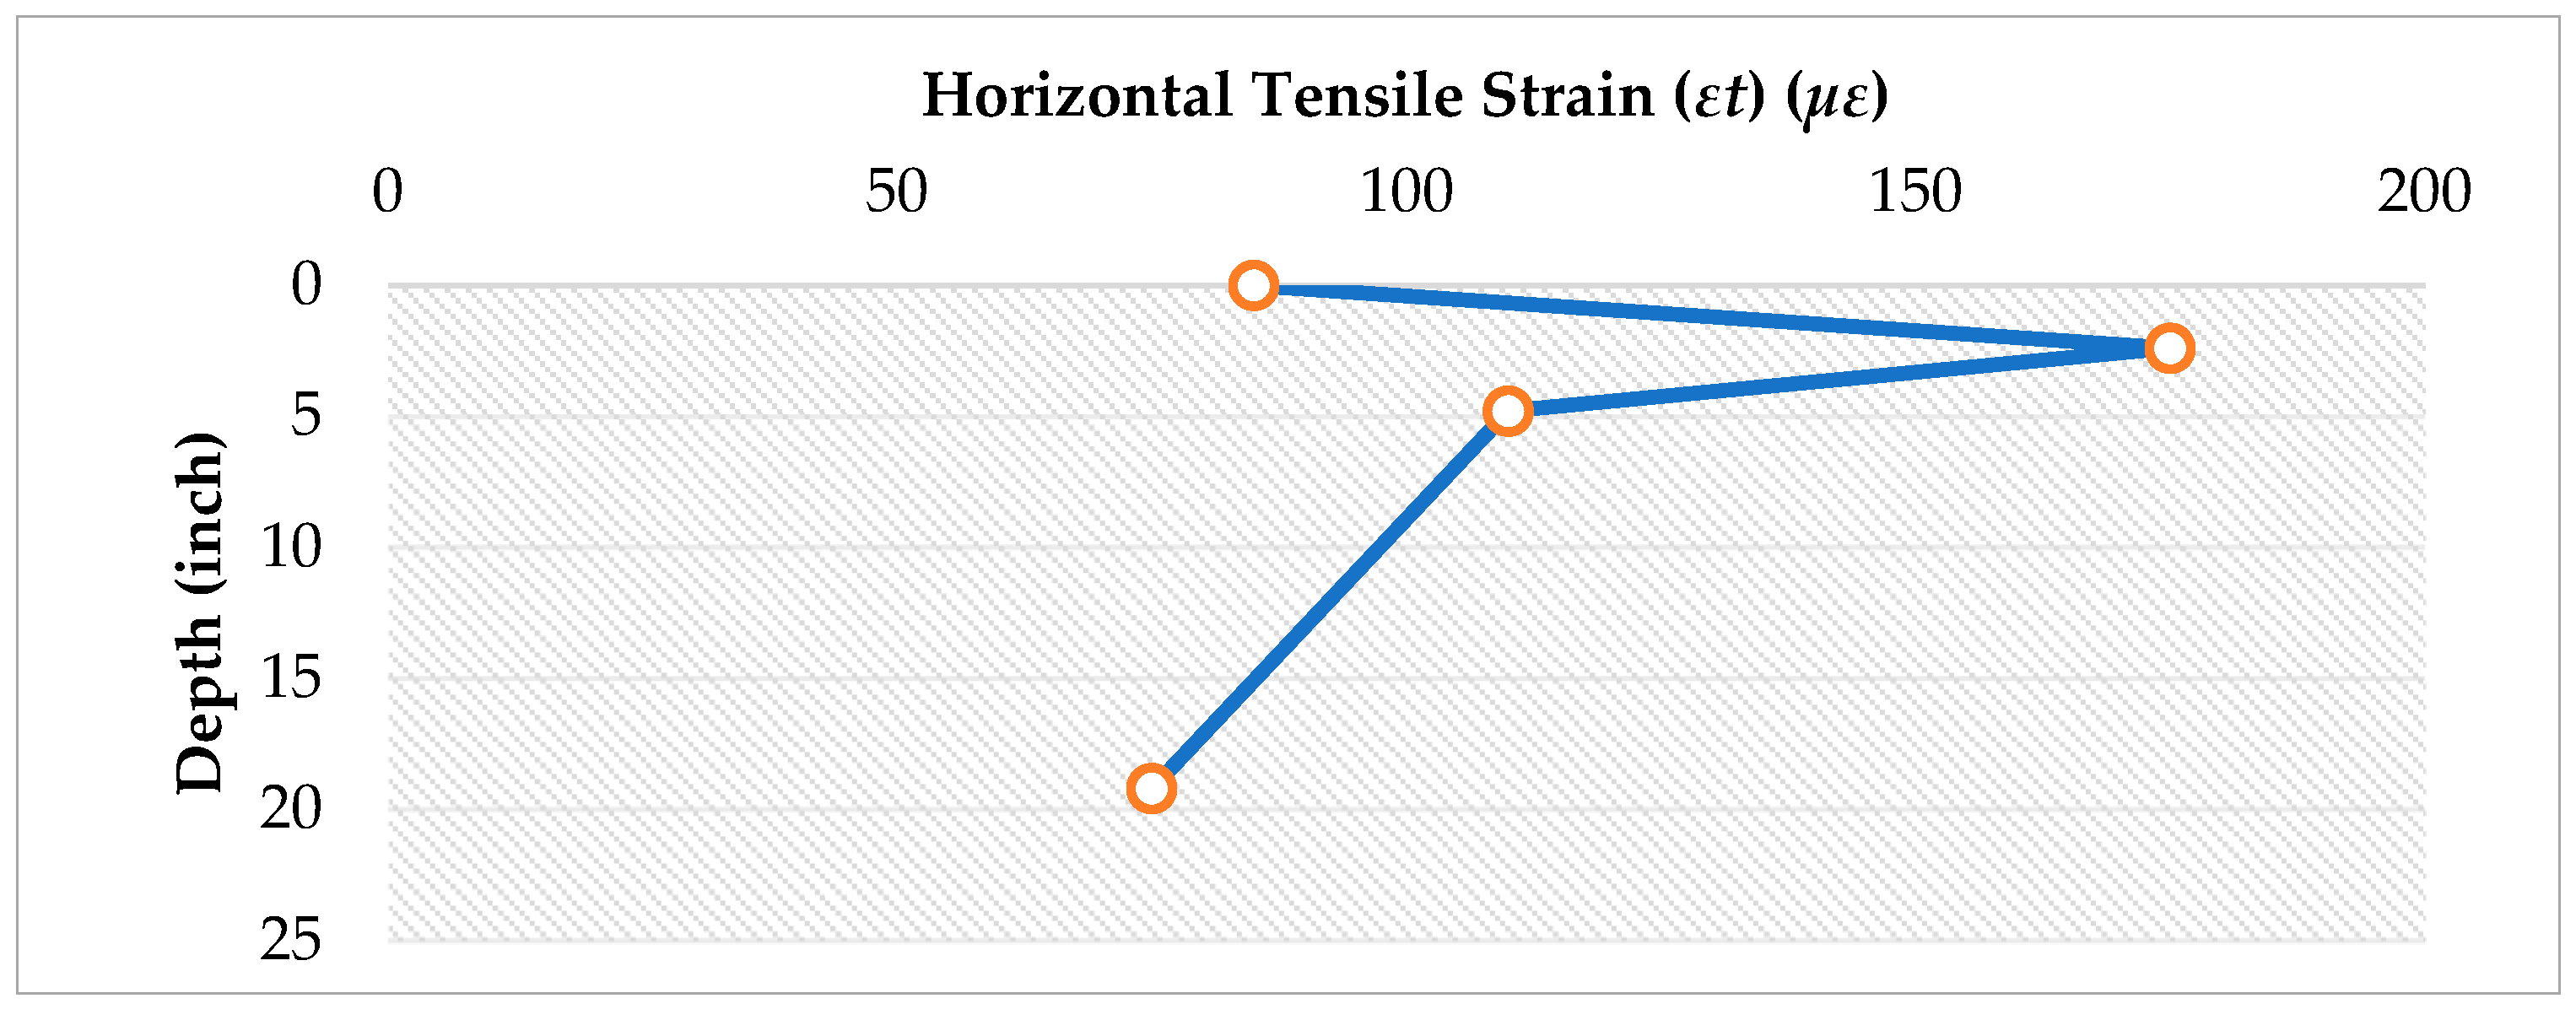
Figure 3 demonstrates the level of variance that occurs in the horizontal tensile strain according to the depth of the point from the pavement surface.
In the figure, it can be seen that the horizontal tensile strain is lowest at the top of the subgrade layer and highest at the bottom of the asphalt layer, indicating a critical strain point. This location is well known as the governing point for initiation of fatigue cracking in flexible pavements. The concentration of tensile strain at this interface reflects the combined effect of the relatively thin asphalt surface layer and the contrast in stiffness between the asphalt and the underlying stabilized base layer. The magnitude of the tensile strain suggests that fatigue damage is likely to accumulate rapidly under repeated traffic loading. Such strain levels are typically associated with the early development of bottom-up fatigue cracking, which propagates toward the surface and leads to surface block cracking and formation of potholes. From a safety perspective, these cracking patterns degrade surface texture, reduce skid resistance, and increase braking distance, particularly on wet surfaces.
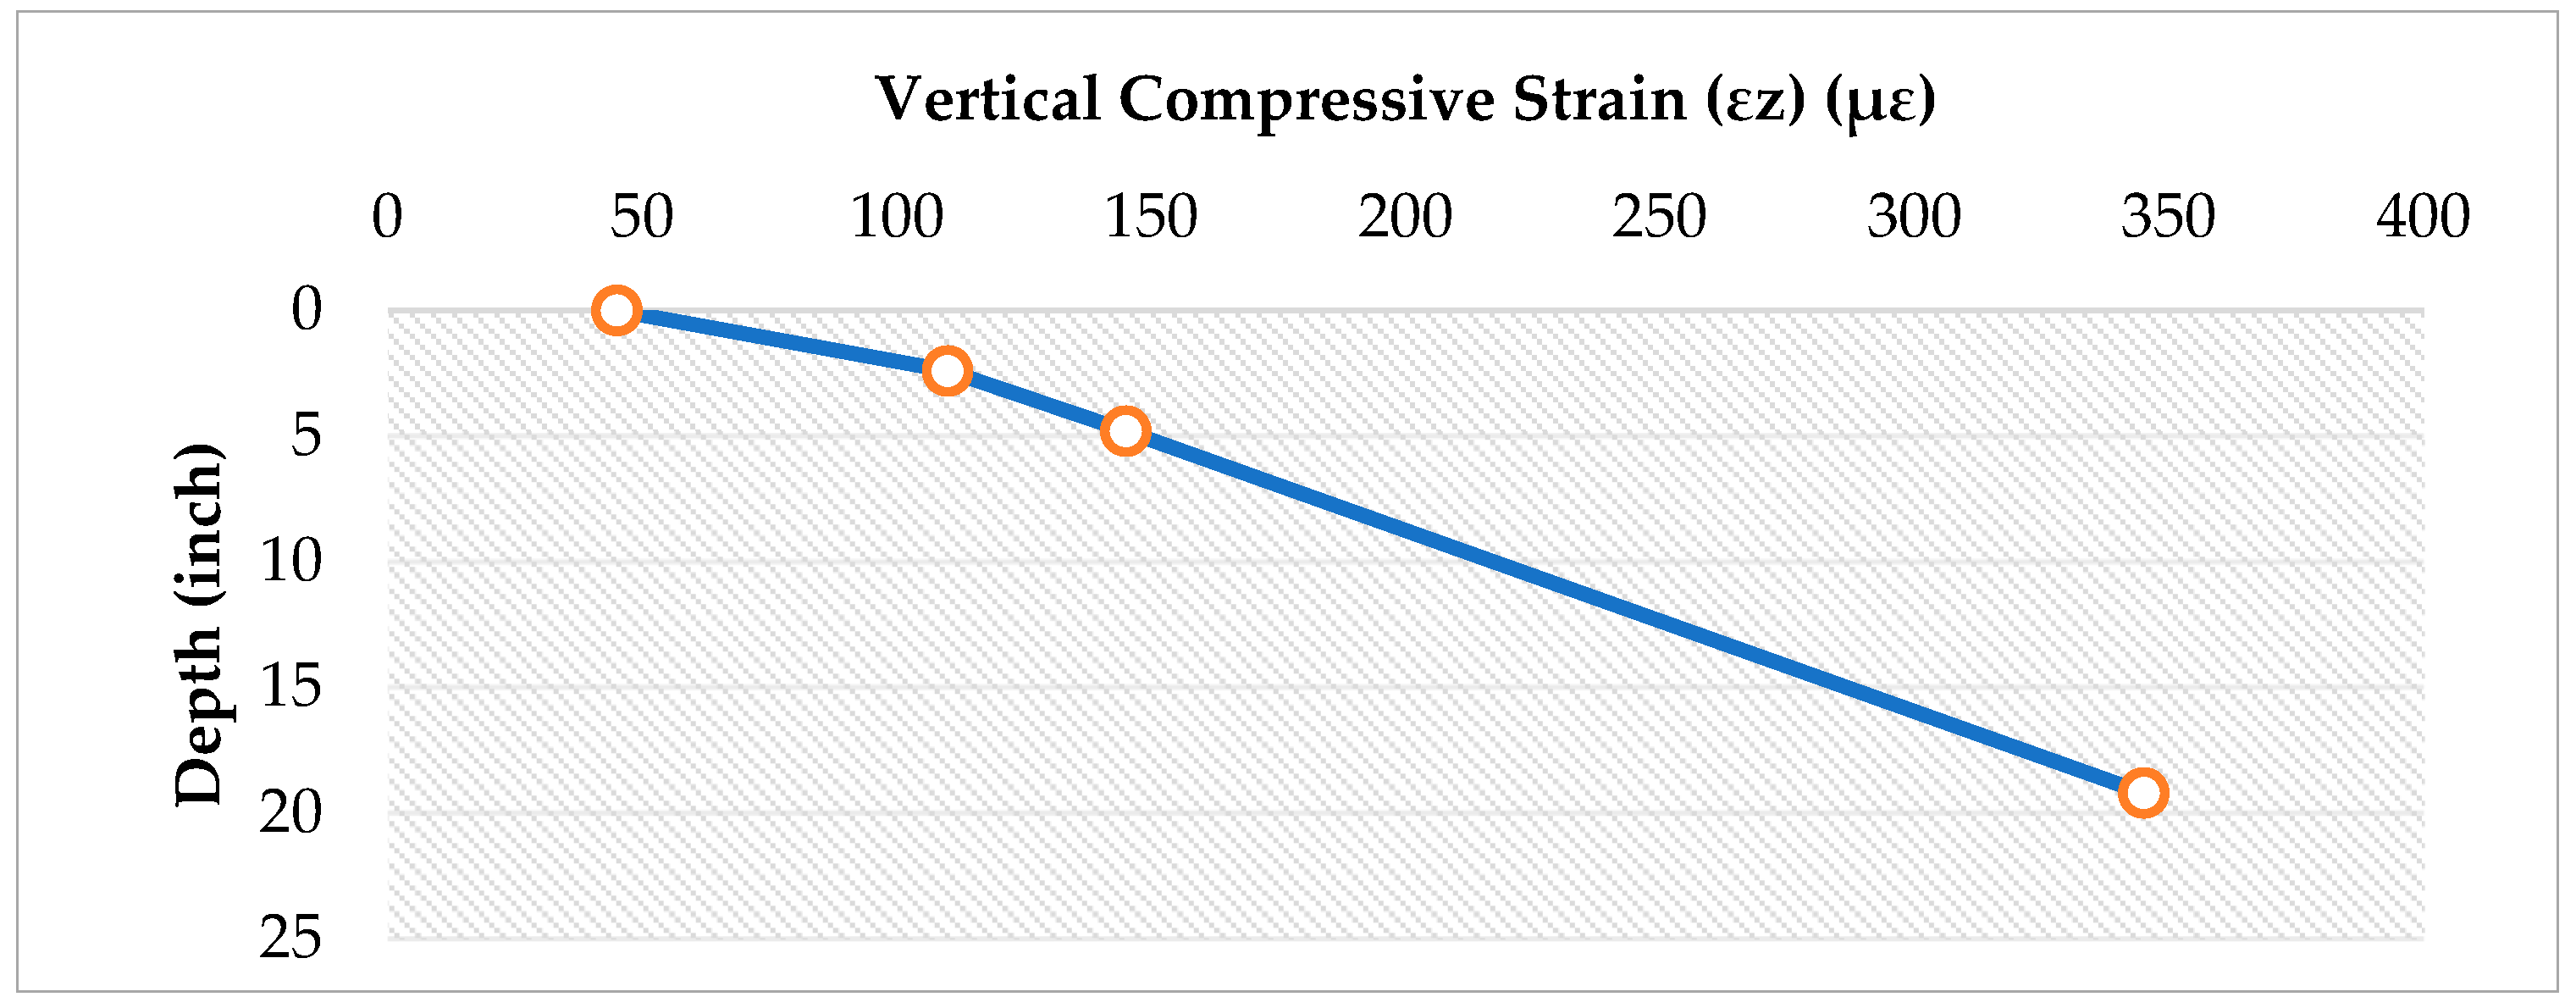
Figure 4 shows the variance in the vertical compressive strain with the depth of the strain point from the pavement surface.
The vertical tensile strain is lowest at the surface and highest at the top of the subgrade layer, indicating a critical strain point. This location serves as the primary control point for rutting development, as permanent subgrade deformation results in the accumulation of ruts in flexible pavement systems. The high compressive strain value reflects the combined influence of heavy axle loads and the relatively low subgrade resilient modulus (5300 psi), indicating the limited load-bearing capacity of the foundation soil.
3.2. Allowable Axle-Load Frequency to Avoid Fatigue Cracking
By applying Equation (5), the maximum allowable load frequency to avoid fatigue cracking can be determined. This is performed by substituting the results of the critical horizontal tensile strain, εt. The results for Nf are 2.79 × 10⁶ receptions. This value is considered the maximum load repetition capacity that should not be exceeded if fatigue cracking is to be avoided. However, the Nf is less than the mean ESAL (4,090,832), which represents the demand for load use of Highway No. 80. Therefore, fatigue cracking is expected, and the pavement design fails to carry the demand of a 4,090,832 load without damage.
The probability of failure (
Pf), i.e., the likelihood that the system demand exceeds its capacity, is estimated by calculating the structural reliability index (
R) using the standard capacity–demand reliability formulation shown in
Section 2.7. The coefficient of variation (COV) for fatigue capacity was assumed to be 15%, reflecting uncertainty in strain-based transfer functions and material variability. The COV for traffic demand was assumed to be 10%, reflecting uncertainty in traffic growth estimation and lane distribution [
32,
33].
The Z value is −4.9, a negative reliability index indicates that the mean demand exceeds the mean capacity. The corresponding probability of failure approaches unity, indicating a highly unfavorable reliability. Because the mean demand is far to the right of the mean supply, almost the entire demand distribution lies beyond the supply distribution. This also indicates a very high probability of failure. The facility is operating in a structurally unsafe and unreliable condition.
3.3. Allowable Axle-Load Frequency to Avoid Rutting
By applying Equation (6), the maximum allowable load frequency to avoid rutting can be determined by substituting the results of the critical vertical compressive strain, εz. The results indicate that Nr is 4.14 × 10⁶ receptions. This value is the maximum load-repetition capacity that should not be exceeded to avoid rutting. However, the Nr for segment 1 is slightly higher than ESAL (4,090,832). Therefore, rutting is expected if the ESAL increases by a slight percentage. The results indicate that the rutting capacity slightly exceeds the mean traffic demand, yielding a positive reliability index and a relatively low probability of failure (22.1%). This suggests that the pavement design is a marginal structural condition; however, improvements should be suggested to prevent the expected pavement damage.
3.4. Sensitivity Analysis of ESAL on Pavement Reliability
To evaluate the robustness of the proposed mechanistic–quantitative framework, a sensitivity analysis was conducted to examine the influence of traffic loading variability on pavement structural reliability. The cumulative Equivalent Single-Axle Load (ESAL) was systematically varied by ±15% and ±25% relative to the estimated mean value. These variations reflect realistic uncertainties associated with traffic growth, axle-load variability, and potential overloading, particularly in the absence of site-specific Weigh-In-Motion (WIM) data.
The results, shown in
Table 7, indicate that fatigue failure remains dominant across all loading scenarios, confirming the governing role of tensile strain at the bottom of the asphalt layer. Even a 15% reduction in ESAL does not eliminate fatigue vulnerability, although reliability improves relative to the baseline.
Rutting performance shows moderate sensitivity. Under reduced traffic (−25%), rutting reliability improves significantly (Pf < 5%). However, a +15% increase in ESALs shifts rutting from marginally safe to failure-prone behavior (Pf ≈ 90.2%), demonstrating how traffic growth can rapidly destabilize structural adequacy. This quantitative sensitivity confirms that ESAL variability is a critical driver of structural reliability and justifies the need for WIM-based traffic characterization.
3.5. Sensitivity Analysis of Resilient Modulus on Pavement Reliability
The sensitivity of strain response to layer stiffness was further examined to assess the influence of modulus variability on structural performance.
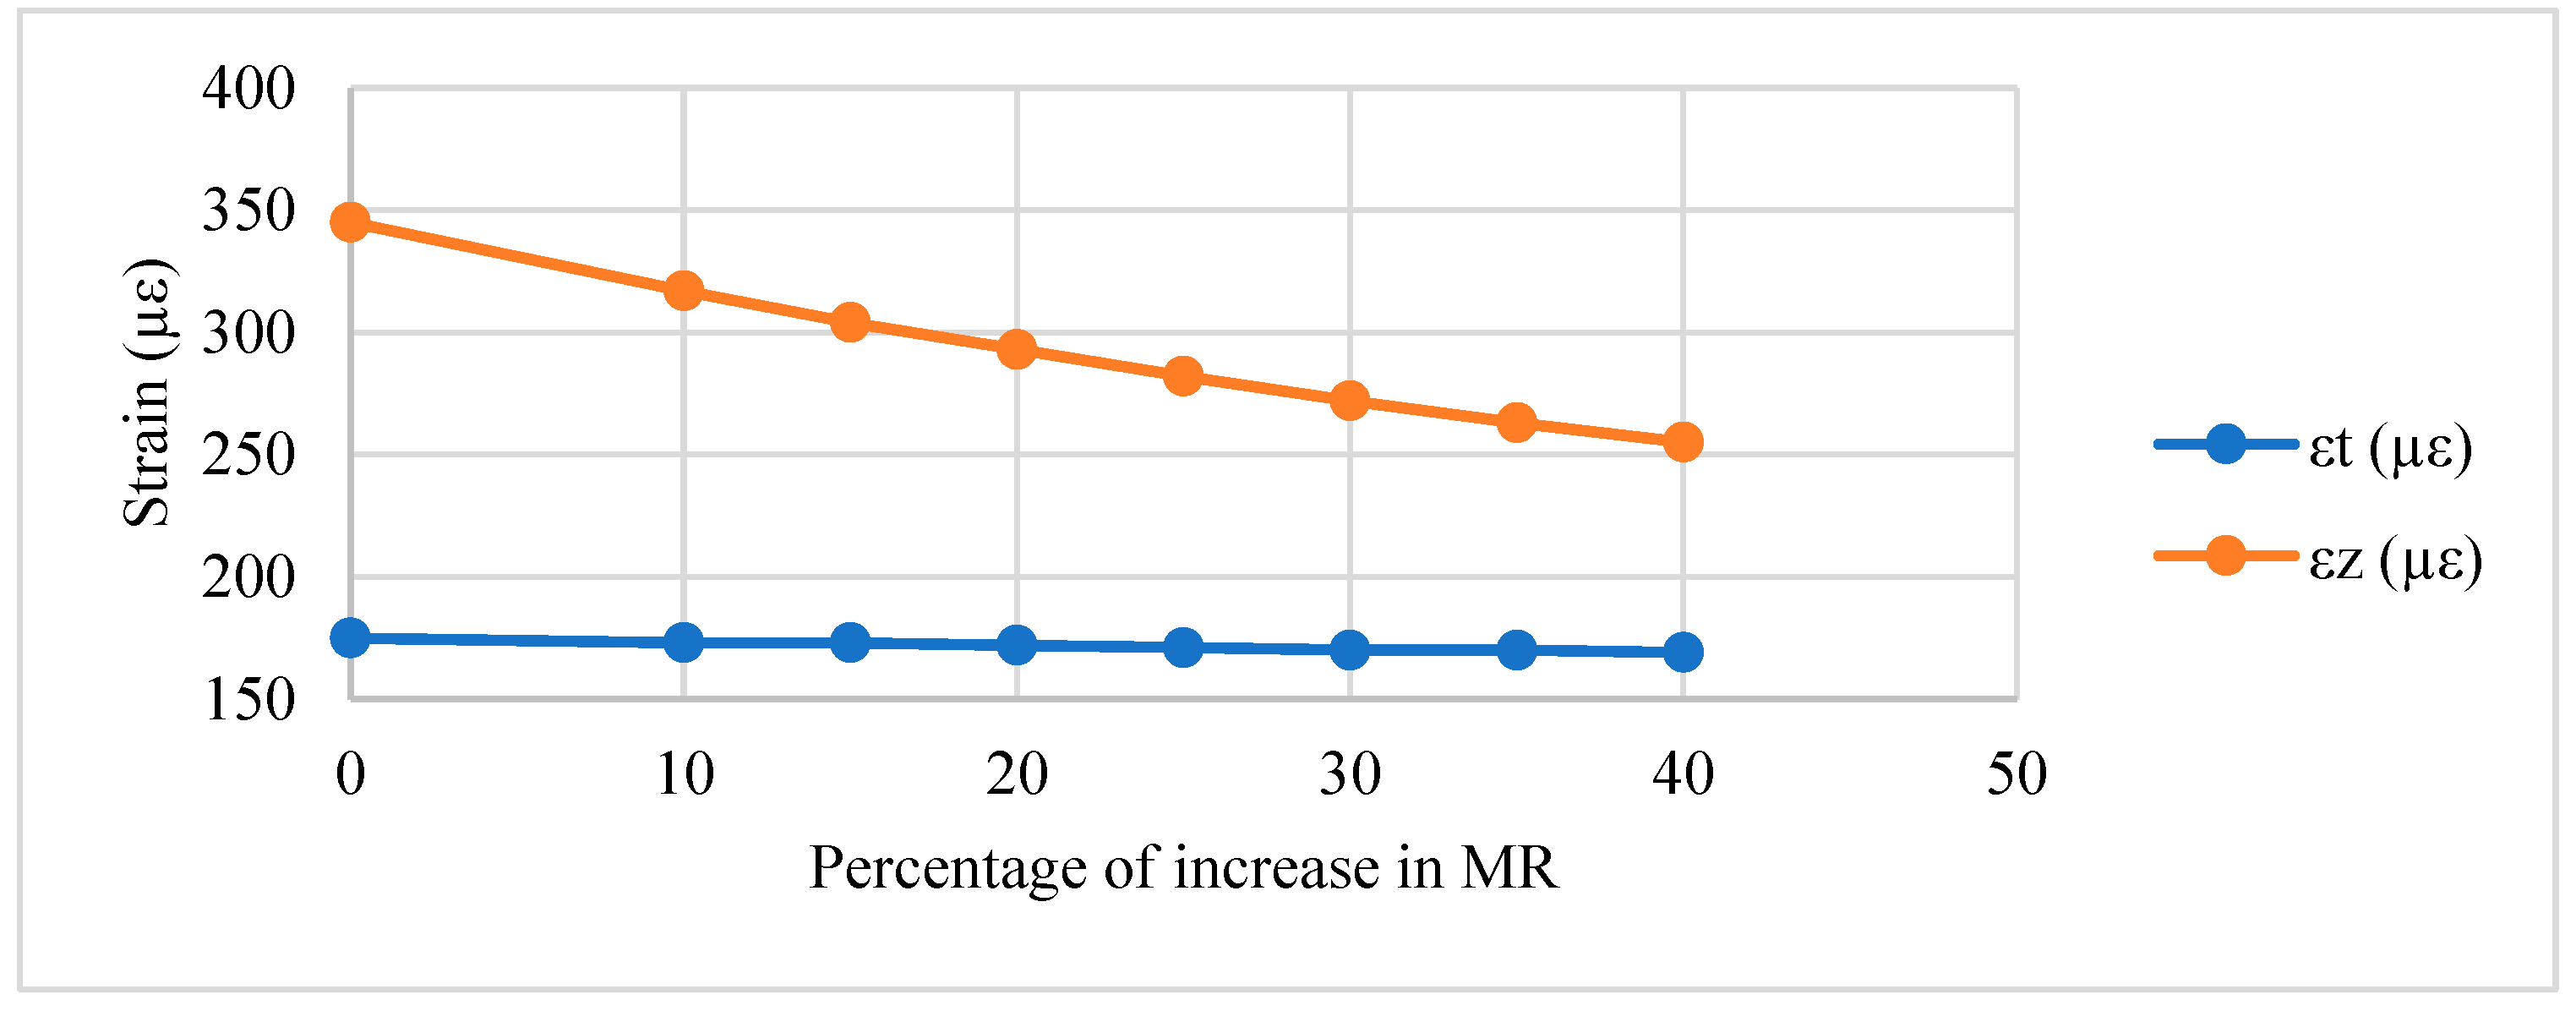
Figure 5 shows the effect of increasing subgrade resilient modulus (
MR) on critical tensile strain (
εt) at the bottom of the asphalt layer and compressive strain (
εz) at the top of the subgrade, and
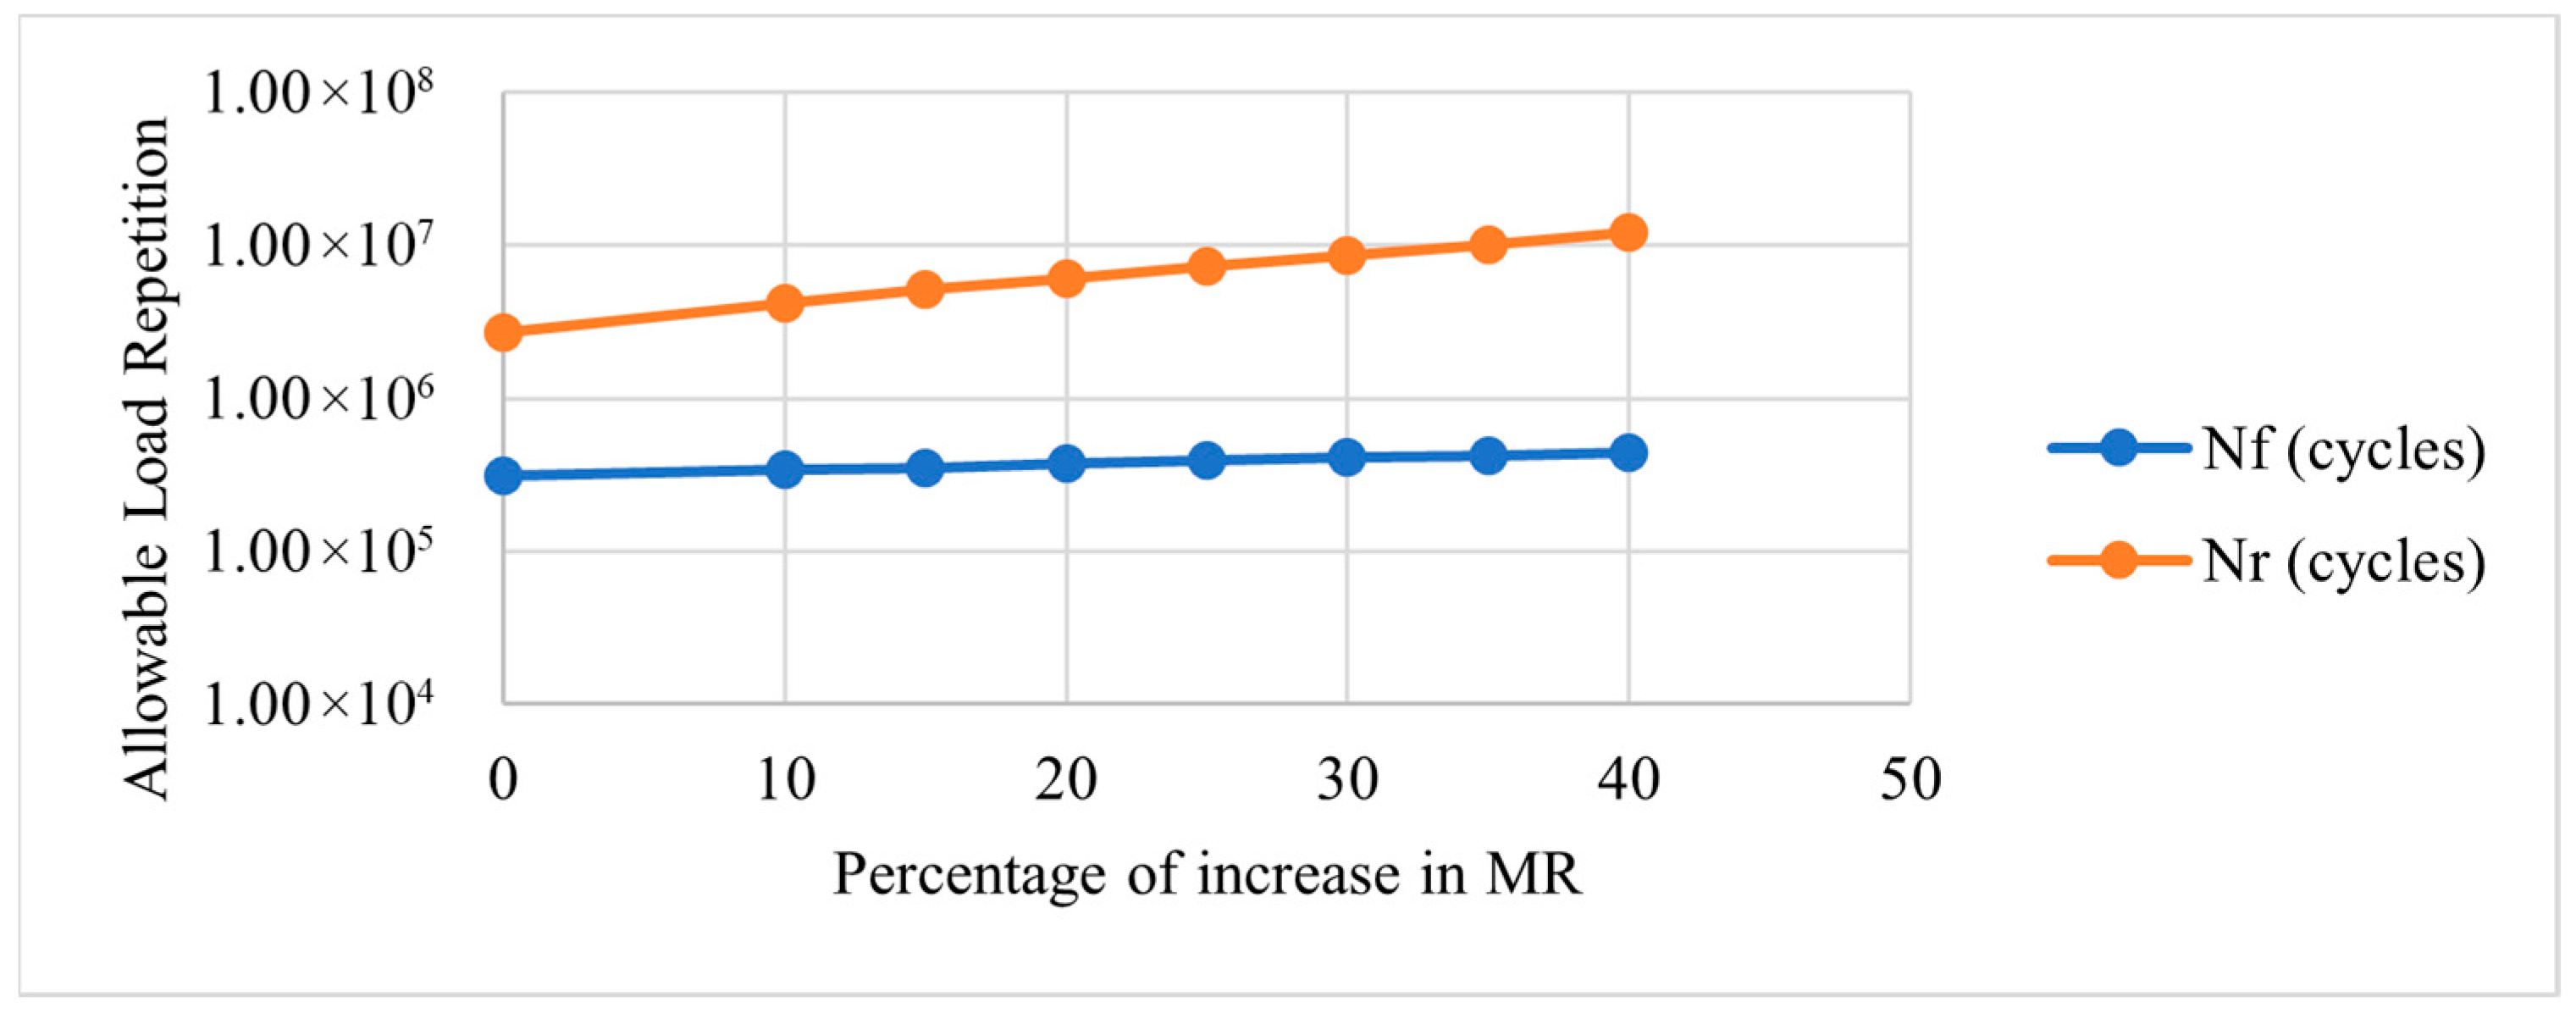
Figure 6 shows the effect of increasing subgrade resilient modulus (MR) on the
Nf and Nr. Increasing the subgrade resilient modulus (
MR) leads to a noticeable reduction in vertical compressive strain (
εz) at the top of the subgrade, resulting in a substantial increase in predicted rutting life (
Nr). This behavior reflects the improved load-distribution capacity of a stiffer foundation layer. While the tensile strain (
εt) at the bottom of the asphalt layer remains nearly unaffected because rutting life follows a power relationship with
εz, even moderate strain reductions are amplified into substantial increases in allowable load repetitions. In contrast, fatigue life is governed primarily by asphalt modulus (
E1), as
εt is controlled by the stiffness of the asphalt layer rather than the subgrade. These results logically connect modulus variability to strain response and structural life prediction.
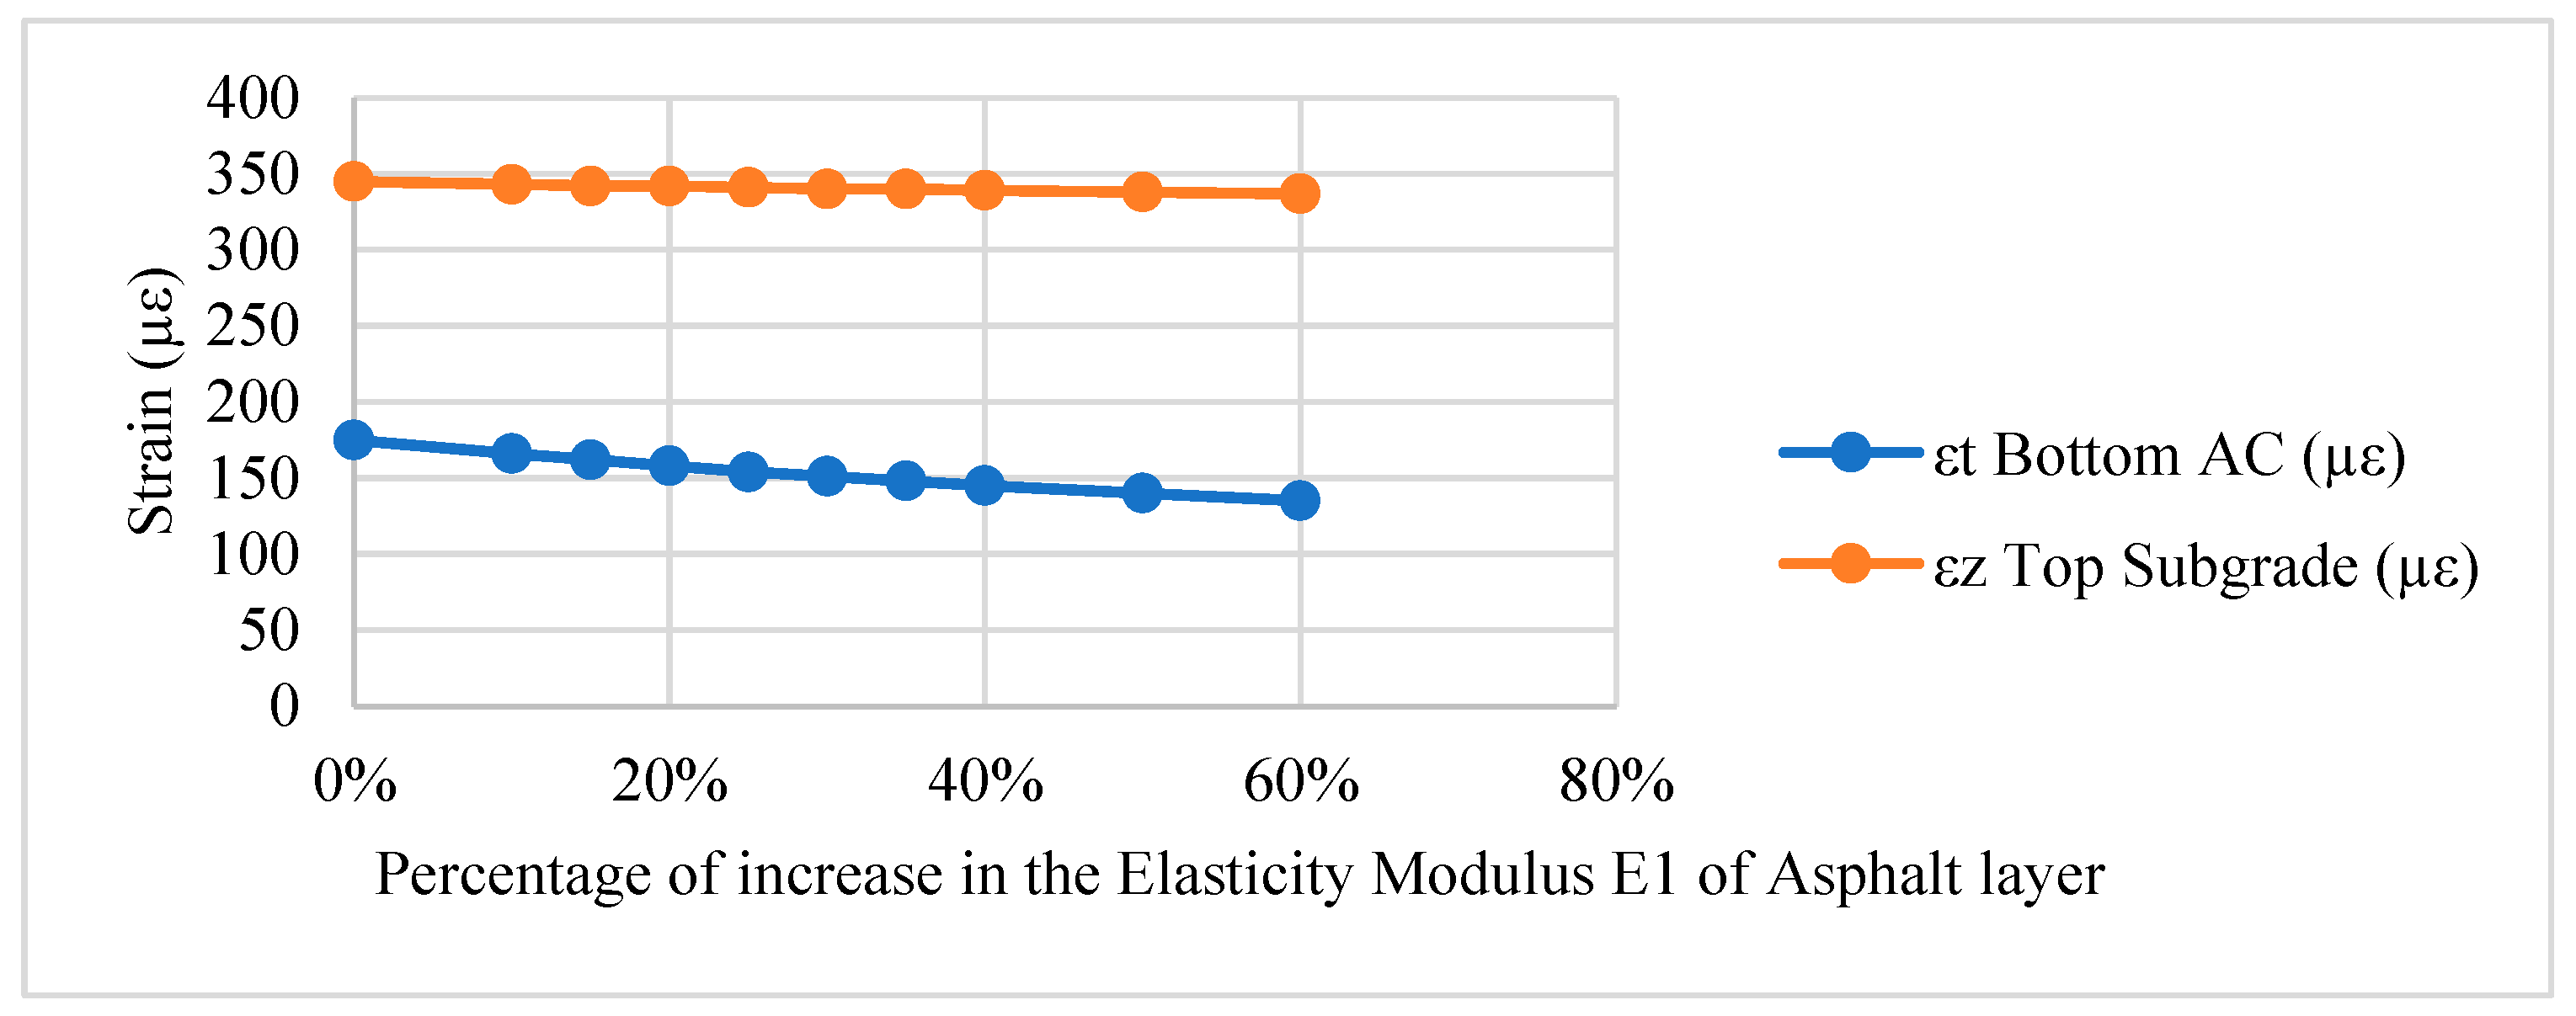
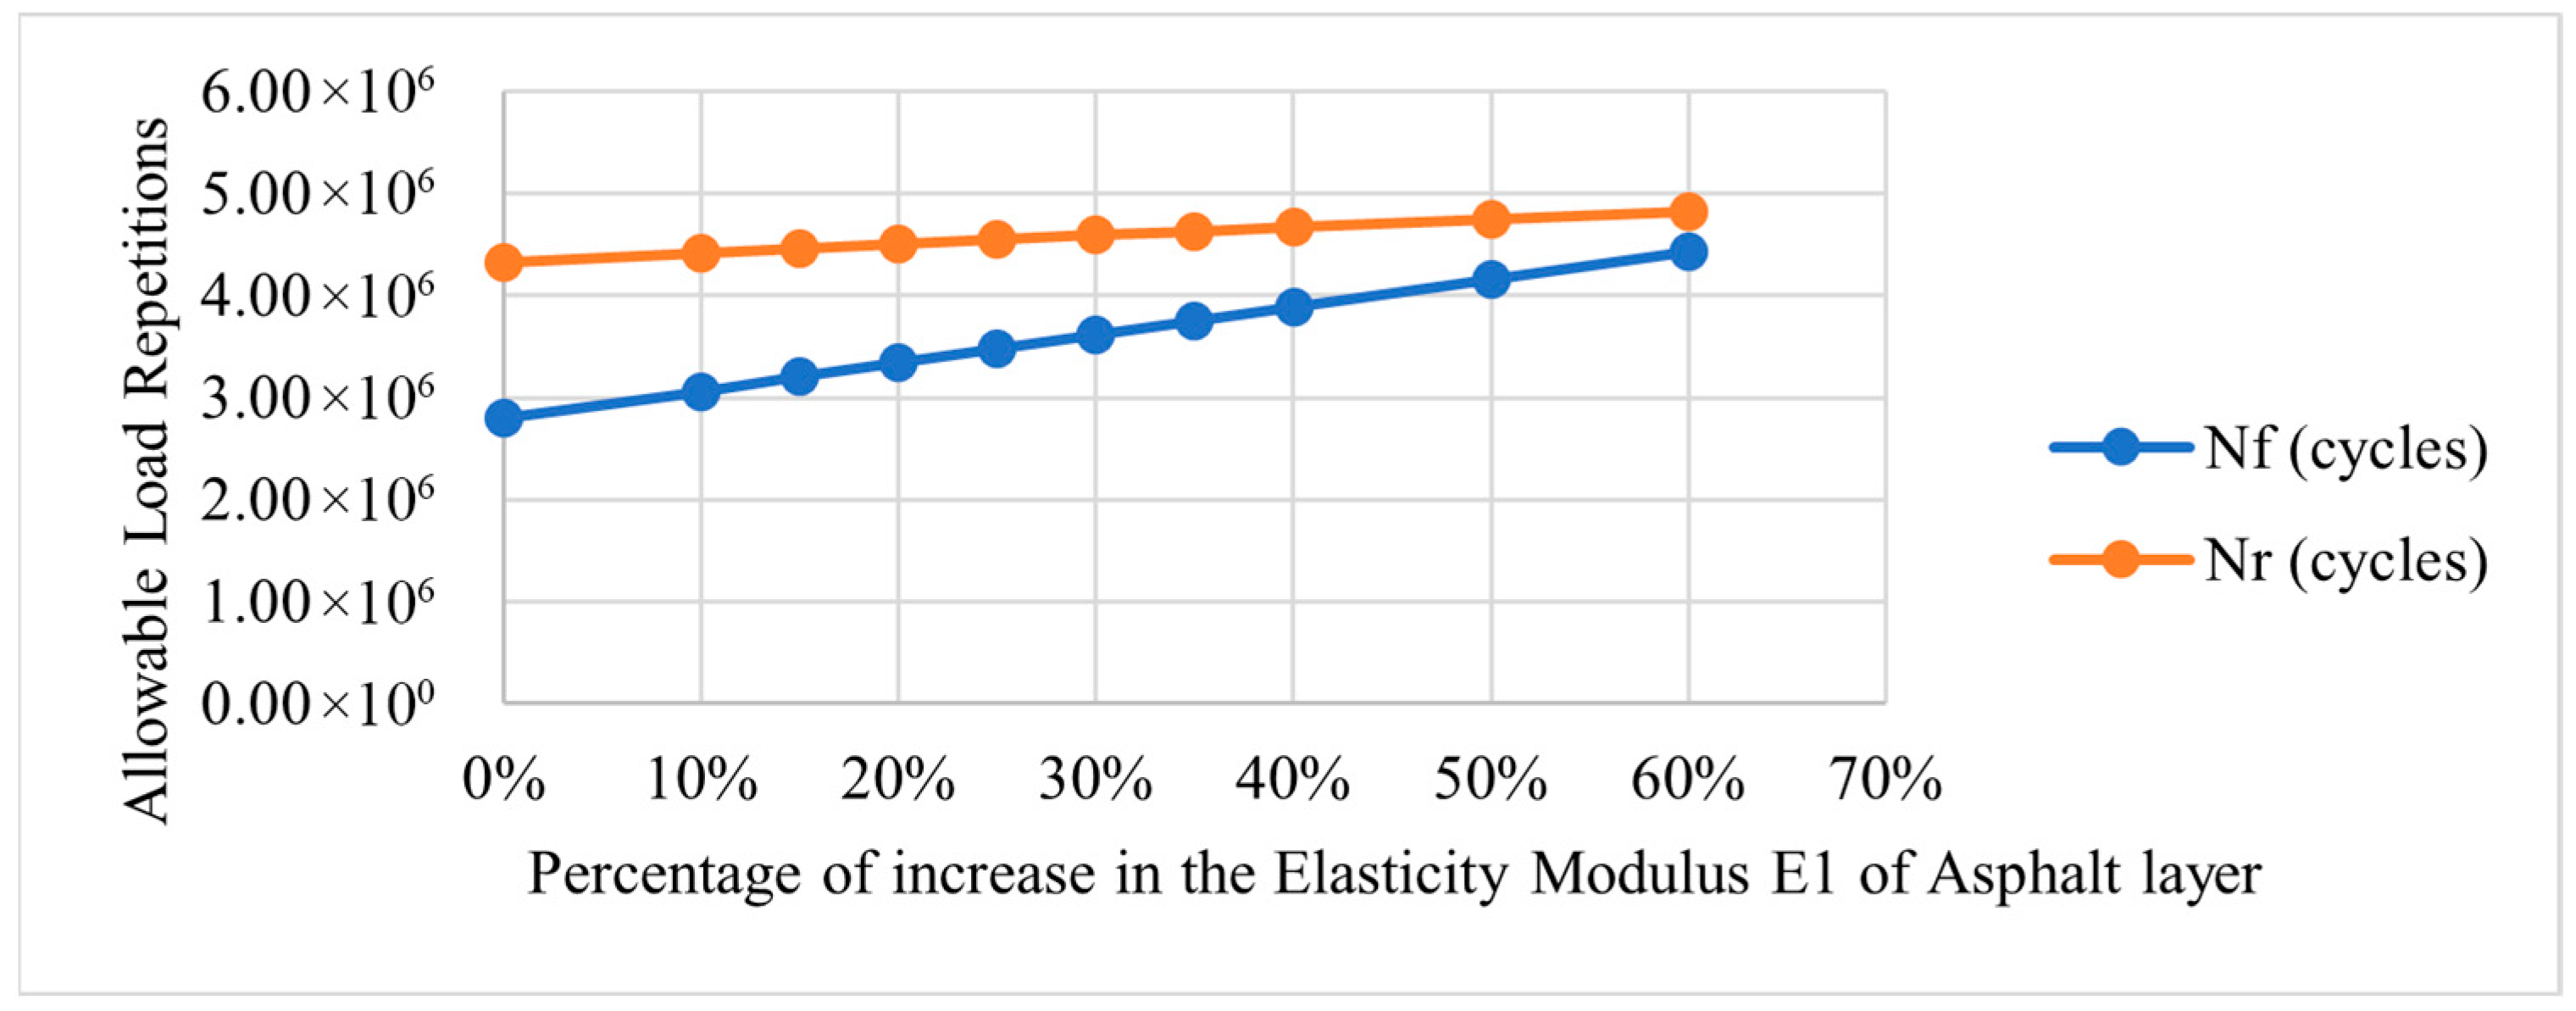
Figure 7 and
Figure 8 demonstrate that increasing asphalt layer modulus (
E1) significantly reduces
εt, leading to marked improvement in fatigue life (
Nf). In contrast,
εz and rutting life (
Nr) show limited sensitivity to asphalt stiffness variation. These results confirm that fatigue cracking is governed primarily by asphalt-layer stiffness.
3.6. Sensitivity Analysis of Thickness on Pavement Reliability
Figure 9 and
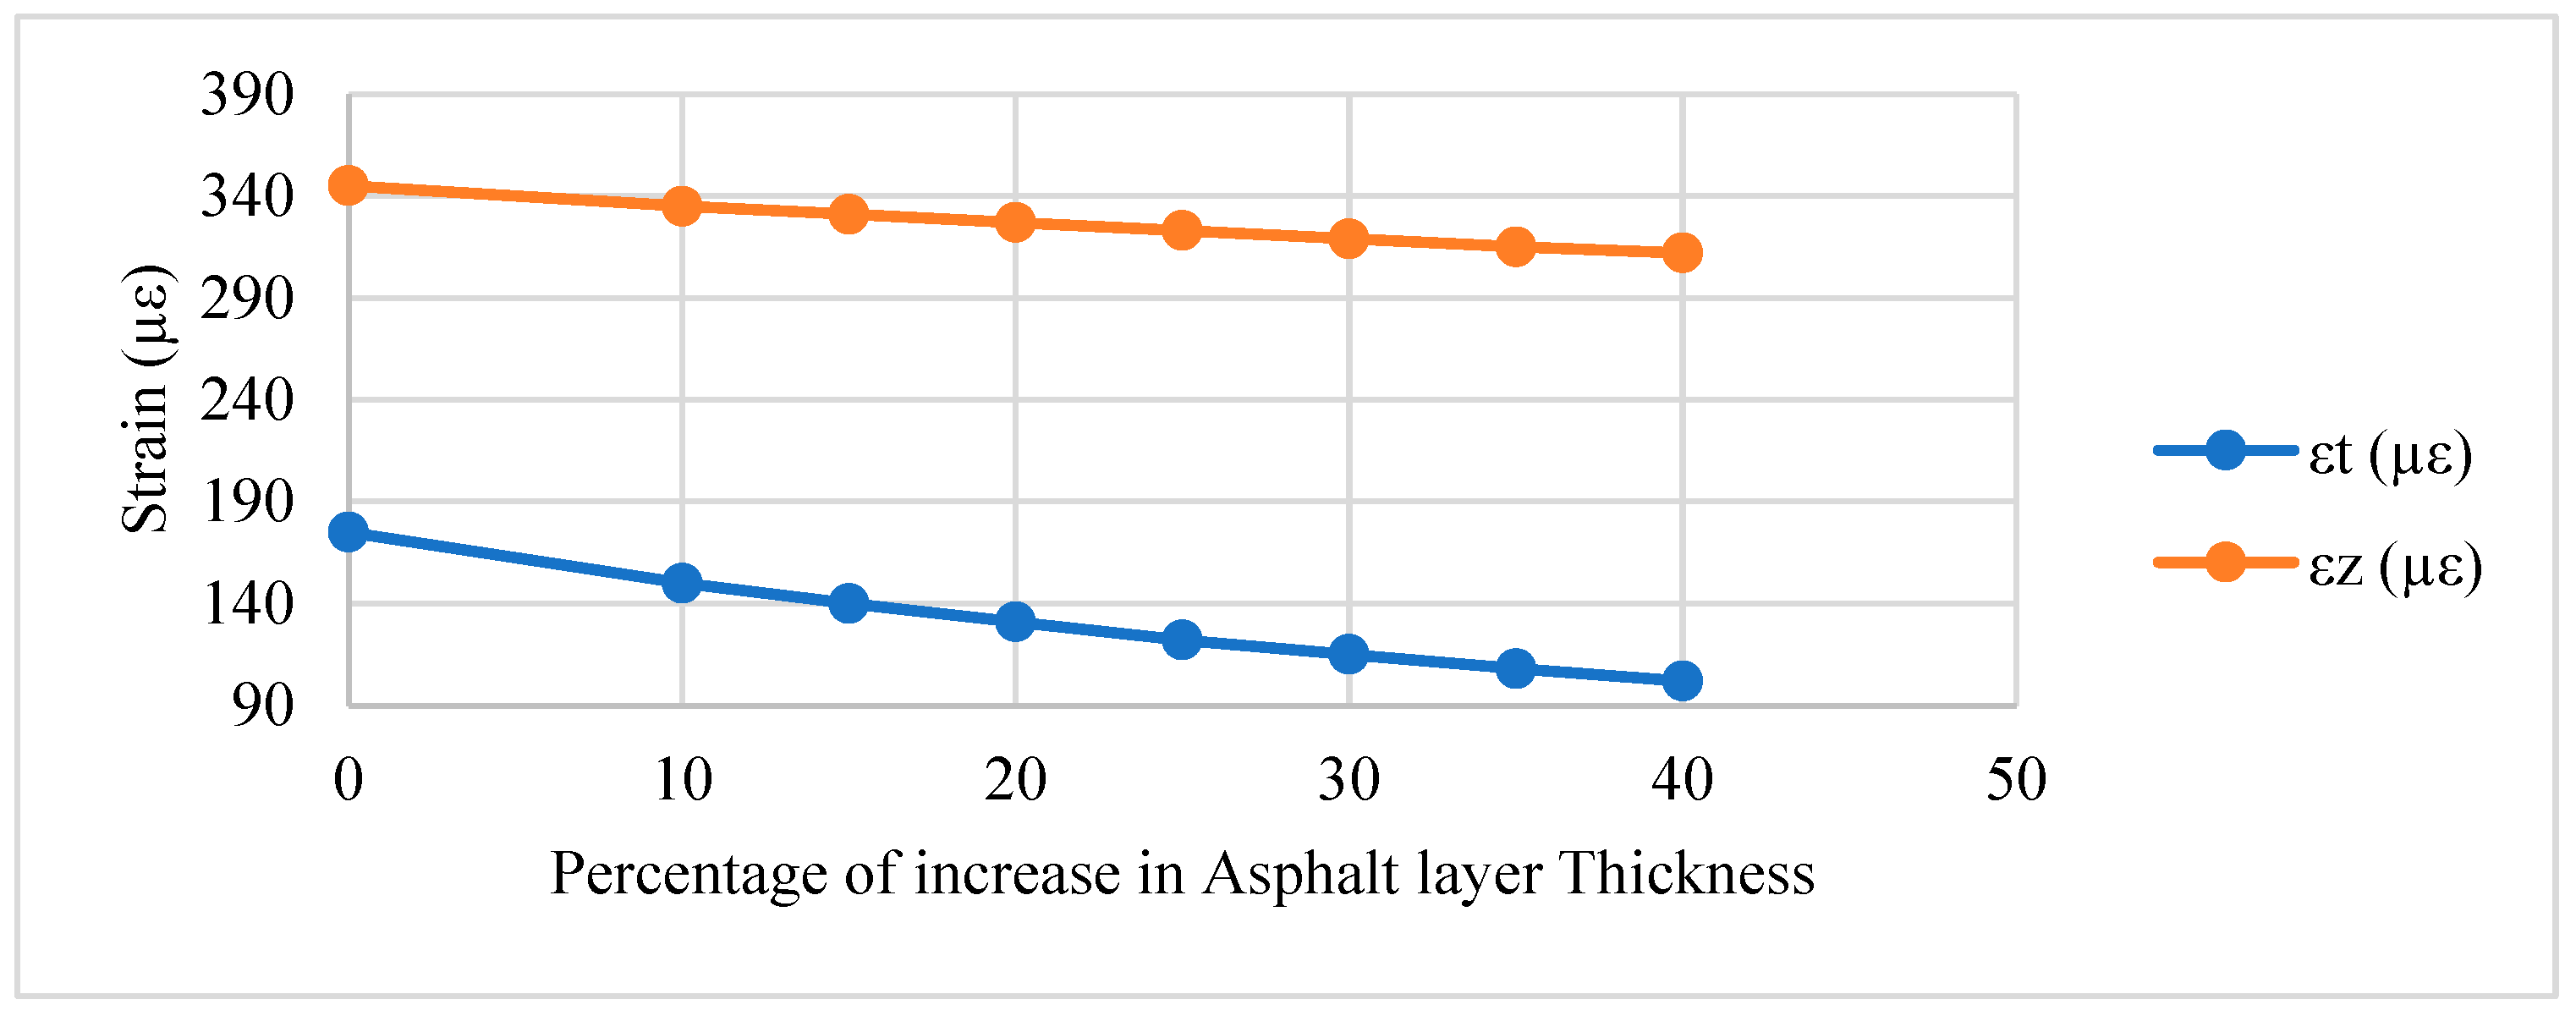
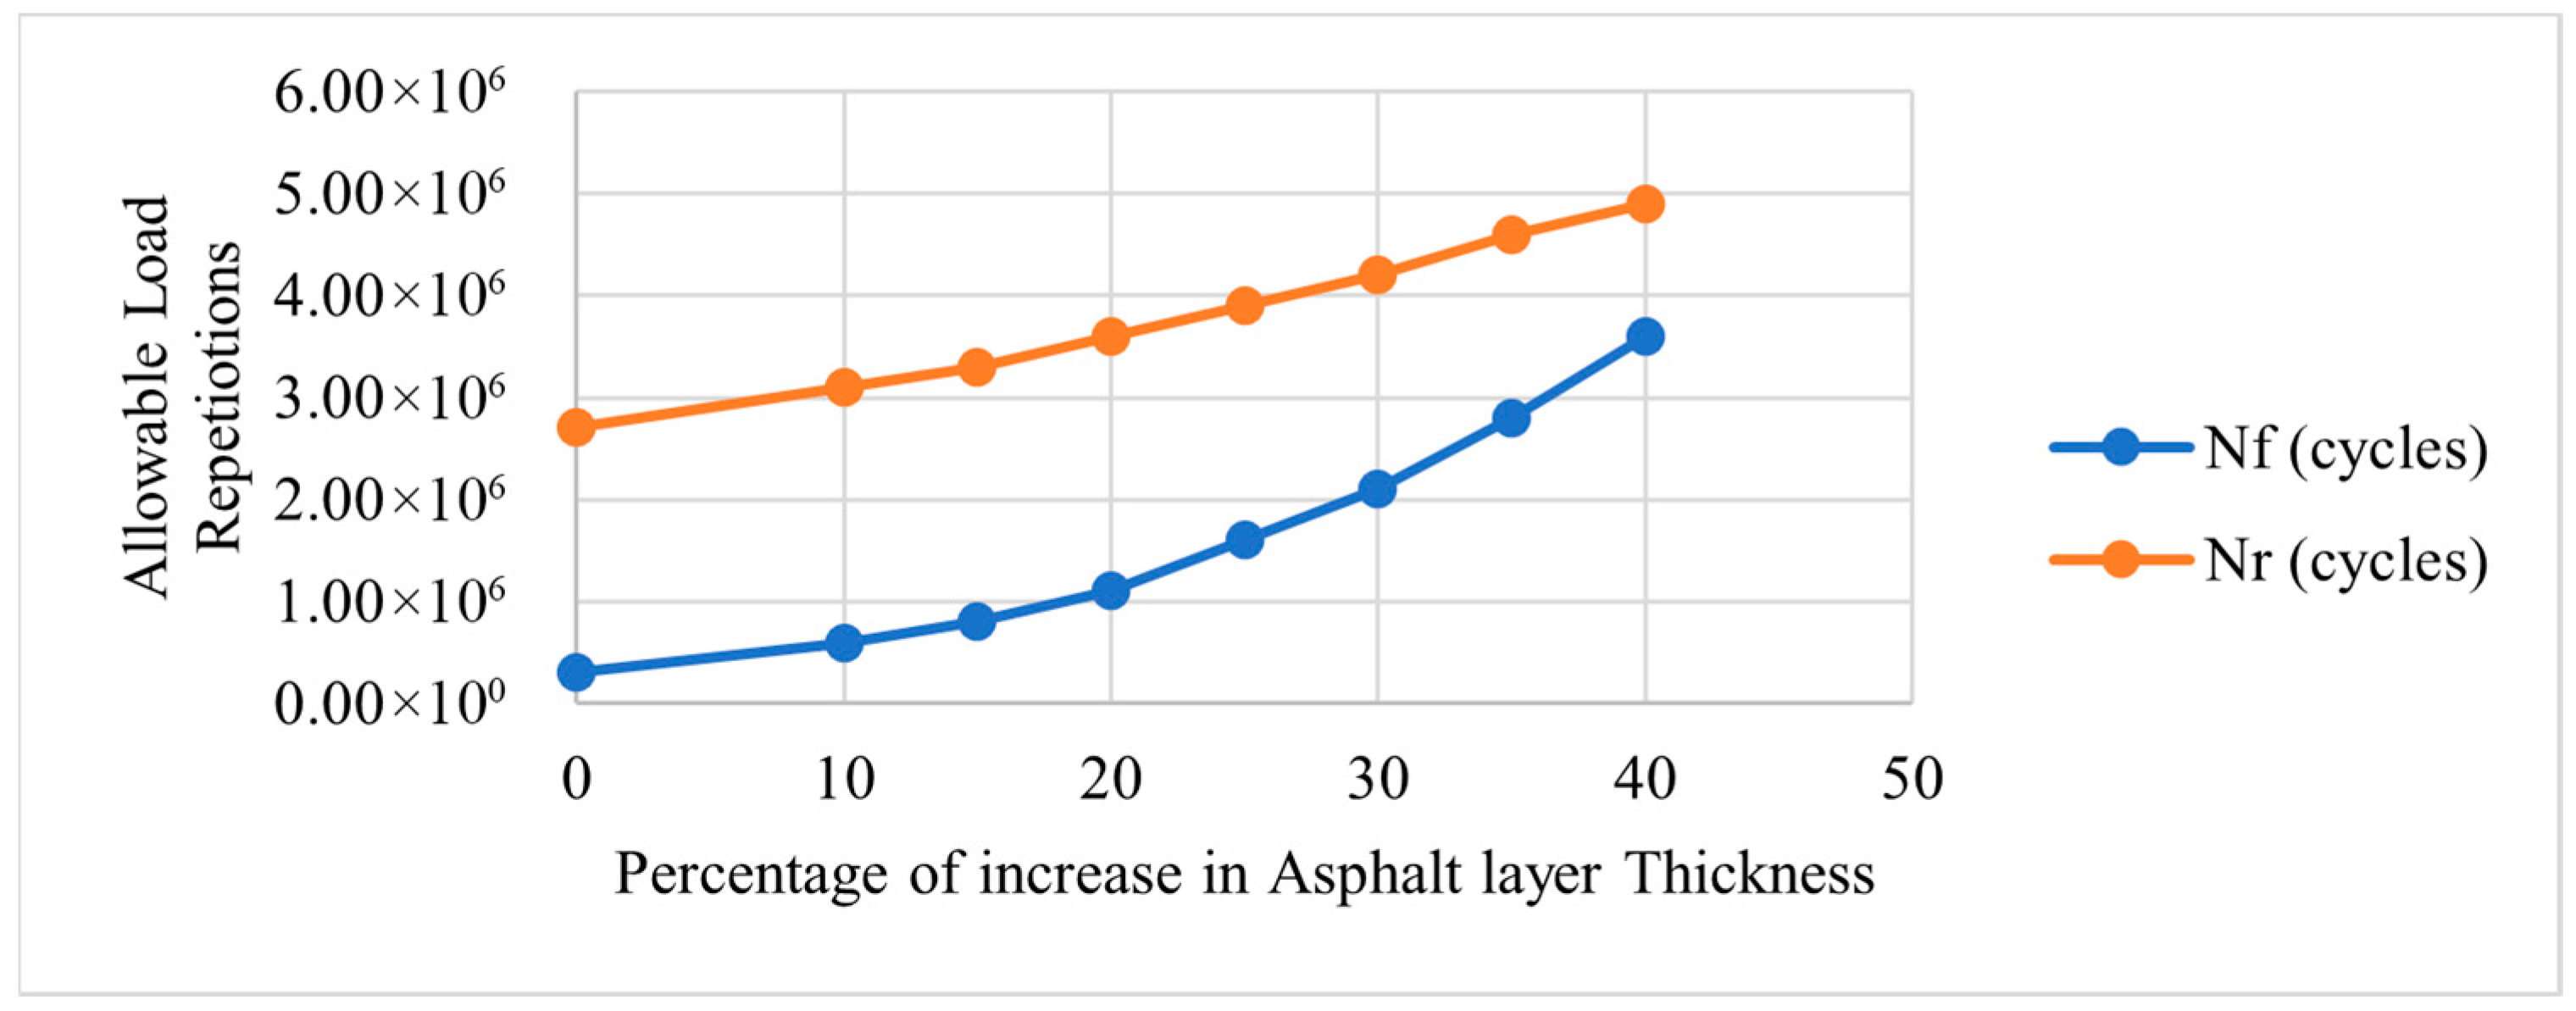
Figure 10 indicate that increasing asphalt layer thickness reduces both εt and εz, resulting in simultaneous improvement in fatigue and rutting performance. Compared to modulus modification alone, thickness enhancement provides a more balanced structural benefit by improving both distress modes.
Overall, the sensitivity analysis confirms the mechanistic relationships embedded in the layered elastic model: subgrade stiffness governs rutting response, asphalt stiffness governs fatigue response, and asphalt thickness improves overall structural capacity. These findings support the reliability-based interpretation of pavement performance under varying structural parameters.
3.7. Safety Constraints
The results for hydroplaning speed, SSD, and vertical shock speed obtained using the method described in
Section 2.6 indicate that the hydroplaning speed is approximately 70 km/h. In comparison, the stopping sight distance (SSD) constraint yields a slightly lower critical speed of 67 km/h. These two values are consistent and indicate that, under wet pavement conditions and reduced friction levels caused by rutting and surface polishing, vehicle operation at speeds above approximately 70 km/h may result in a significant increase in the probability of hydroplaning and braking instability. The SSD-based speed is slightly more conservative than the hydroplaning-based speed, reflecting the strong influence of reduced friction on braking performance. This finding confirms that braking safety is the governing constraint under degraded wet-surface conditions, supporting the adoption of a speed limit below the original operating speed to ensure sufficient stopping capability.
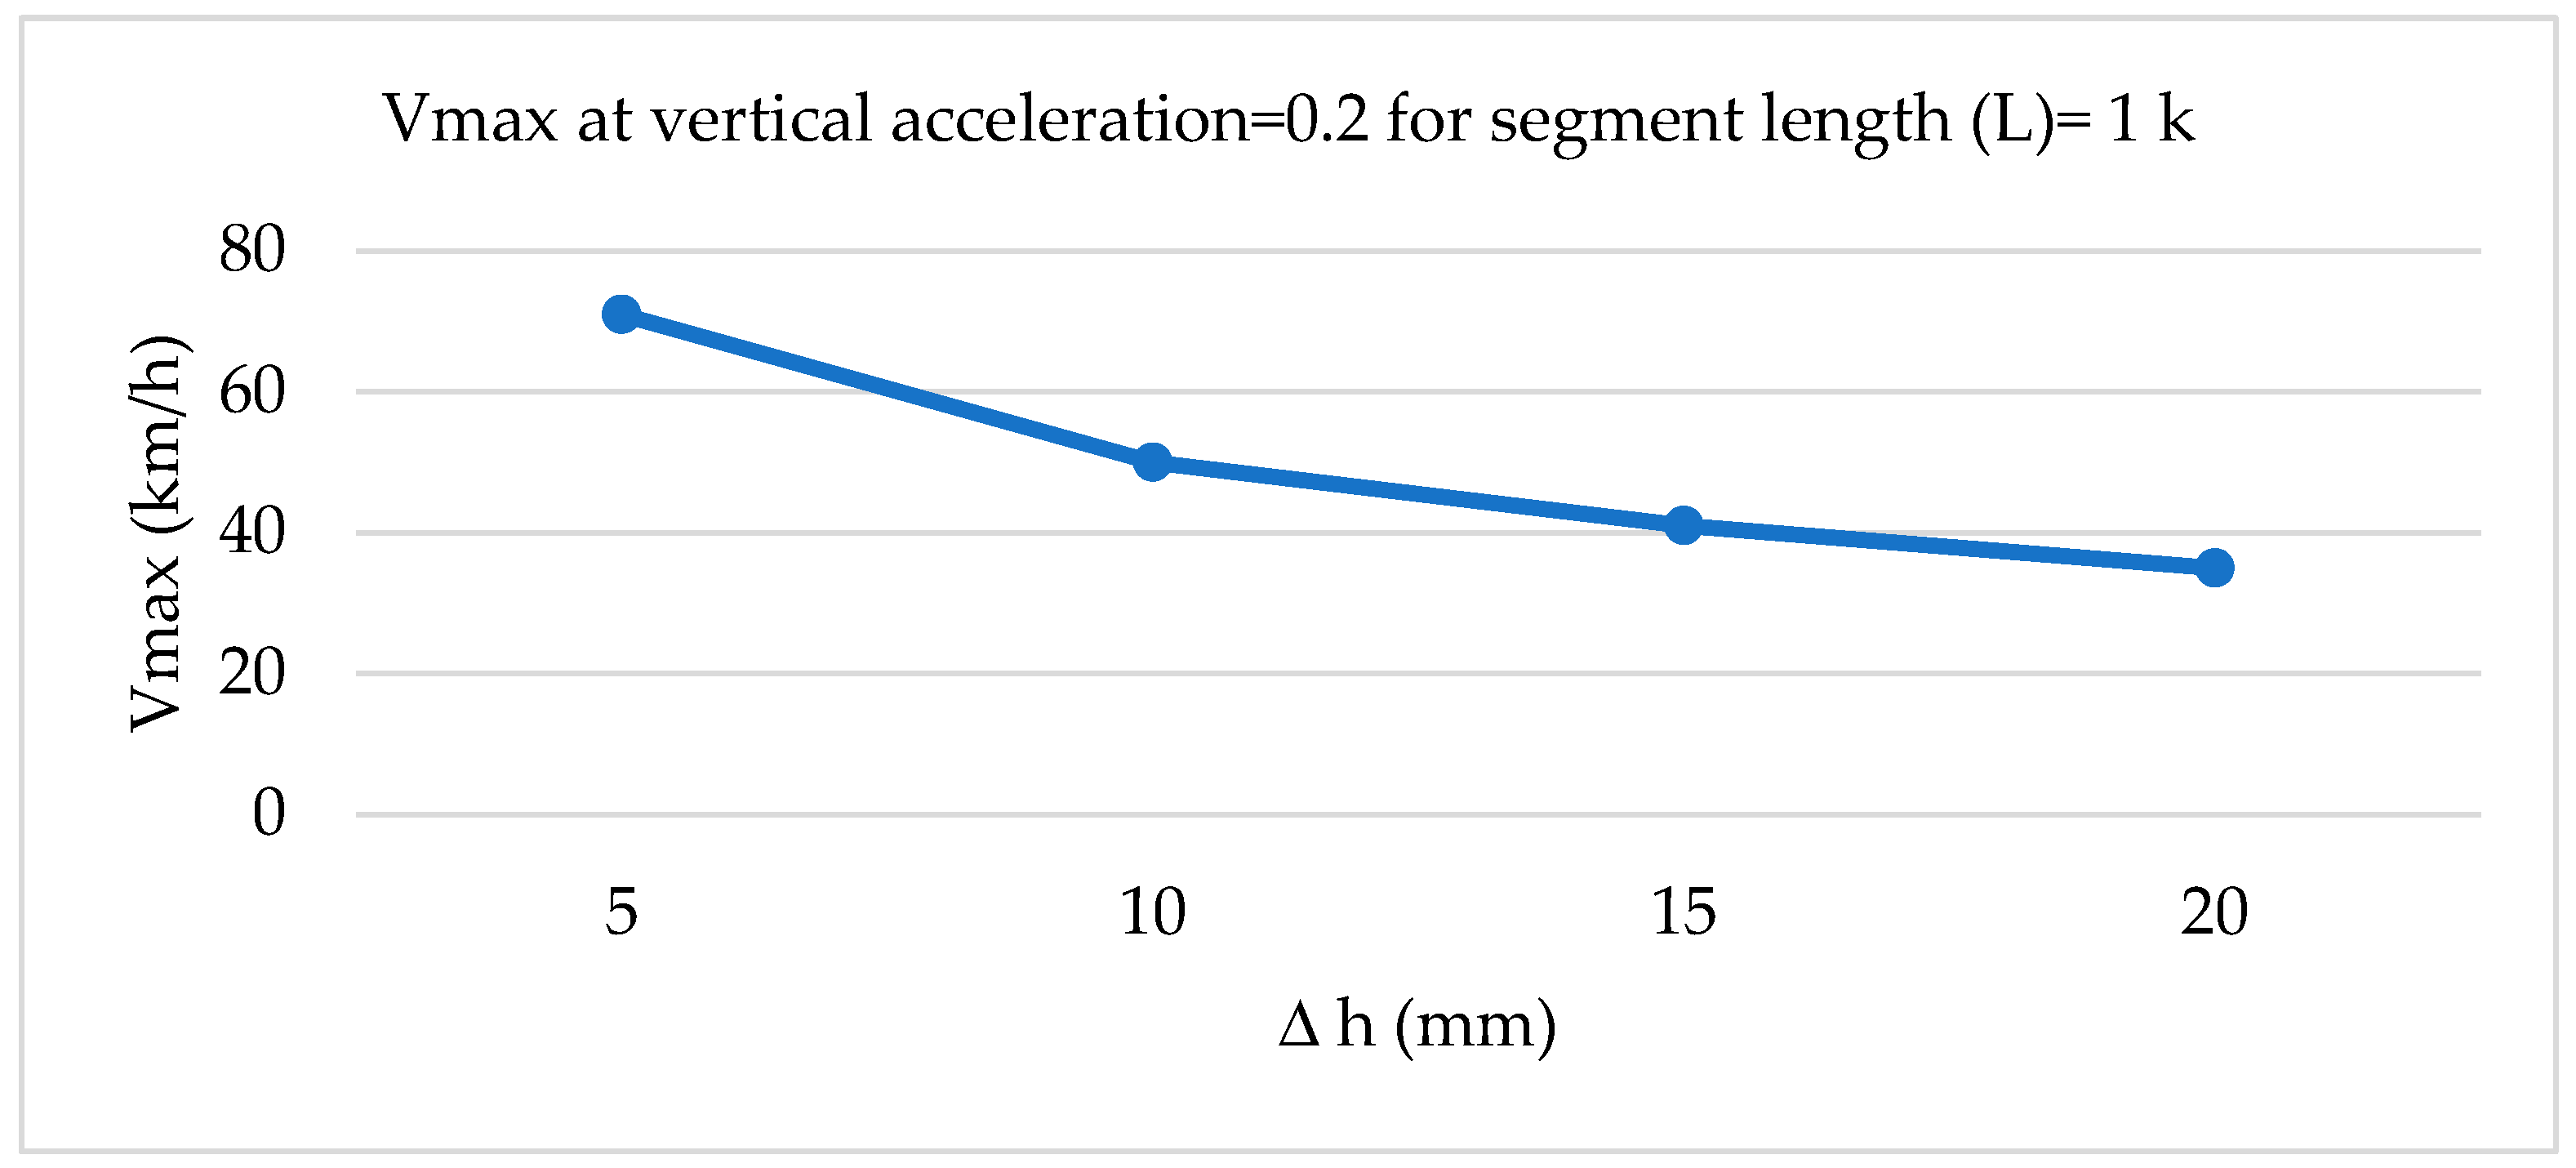
Figure 11 shows the variation in the maximum speed as a function of localized settlement depth (Δ
h) based on the vertical shock criterion (
a ≤ 0.20 g). The results clearly demonstrate a strong inverse relationship between surface depression depth and safe operating speed. For minor surface irregularities (Δ
h = 5 mm), the maximum allowable speed remains relatively high (approximately 87 km/h), indicating negligible stability risk. However, as settlement depth increases, the allowable speed decreases rapidly to 62 km/h at Δ
h = 10 mm, 50 km/h at Δ
h = 15 mm, and 44 km/h at Δ
h = 20 mm. These results highlight the high sensitivity of vehicle stability to localized pavement deformation. At settlement depths exceeding 10 mm, vertical wheel accelerations exceed the accepted stability threshold (0.20
g), increasing the likelihood of wheel unloading, steering instability, and loss of control, particularly for heavy vehicles and under wet pavement conditions where friction margins are already reduced. The adopted vertical acceleration threshold of
a ≤ 0.2
g is intentionally conservative to ensure vehicle stability under wet and distressed pavement conditions. The combined evaluation of hydroplaning risk, braking performance, and vertical shock constraints provides a consistent and physically based framework for selecting a safer operating speed. The hydroplaning and SSD analyses indicate a critical wet-weather speed of approximately 67–70 km/h for general operation, while the vertical shock analysis identifies the need for significantly lower speeds for safety in the presence of localized pavement distress.
Based on these combined constraints, a recommended wet-condition speed limit of 70 km/h is proposed for the general pavement section, ensuring adequate protection against both hydroplaning and excessive braking distances. In addition, for distressed segments with localized settlements exceeding 10 mm, temporary speed reductions of 50–60 km/h are required to maintain vertical accelerations below the critical stability threshold and prevent loss of vehicle control.
The results demonstrate that the structural condition of pavements has a direct and quantifiable influence on safe operating speed. While conventional speed limits are typically based on geometric design and traffic characteristics, the present analysis shows that rutting, friction loss, and surface deformation impose more restrictive safety constraints under deteriorated and wet pavement conditions. Integrating indicators of pavement condition into speed management strategies, therefore, provides a rational and proactive approach to reducing crash risk and injury severity.
3.8. Structural Reliability Condition
The fatigue reliability analysis showed that the current structural condition is marginal under the estimated traffic demand, with a negative reliability index for fatigue. This indicates that cumulative ESAL demand exceeds the allowable fatigue capacity of the existing pavement structure. Rutting reliability, although slightly higher, remains sensitive to traffic growth and variability.
Therefore, from a structural standpoint, the pavement does not provide a sufficient reliability margin to sustain higher operating speeds over the long term without accelerated deterioration. While speed does not directly alter cumulative ESAL in the present deterministic formulation, maintaining lower operating speeds contributes to reducing braking instability, dynamic disturbance, and surface distress propagation, which supports preservation of structural integrity.
3.9. Proposal for Improvement
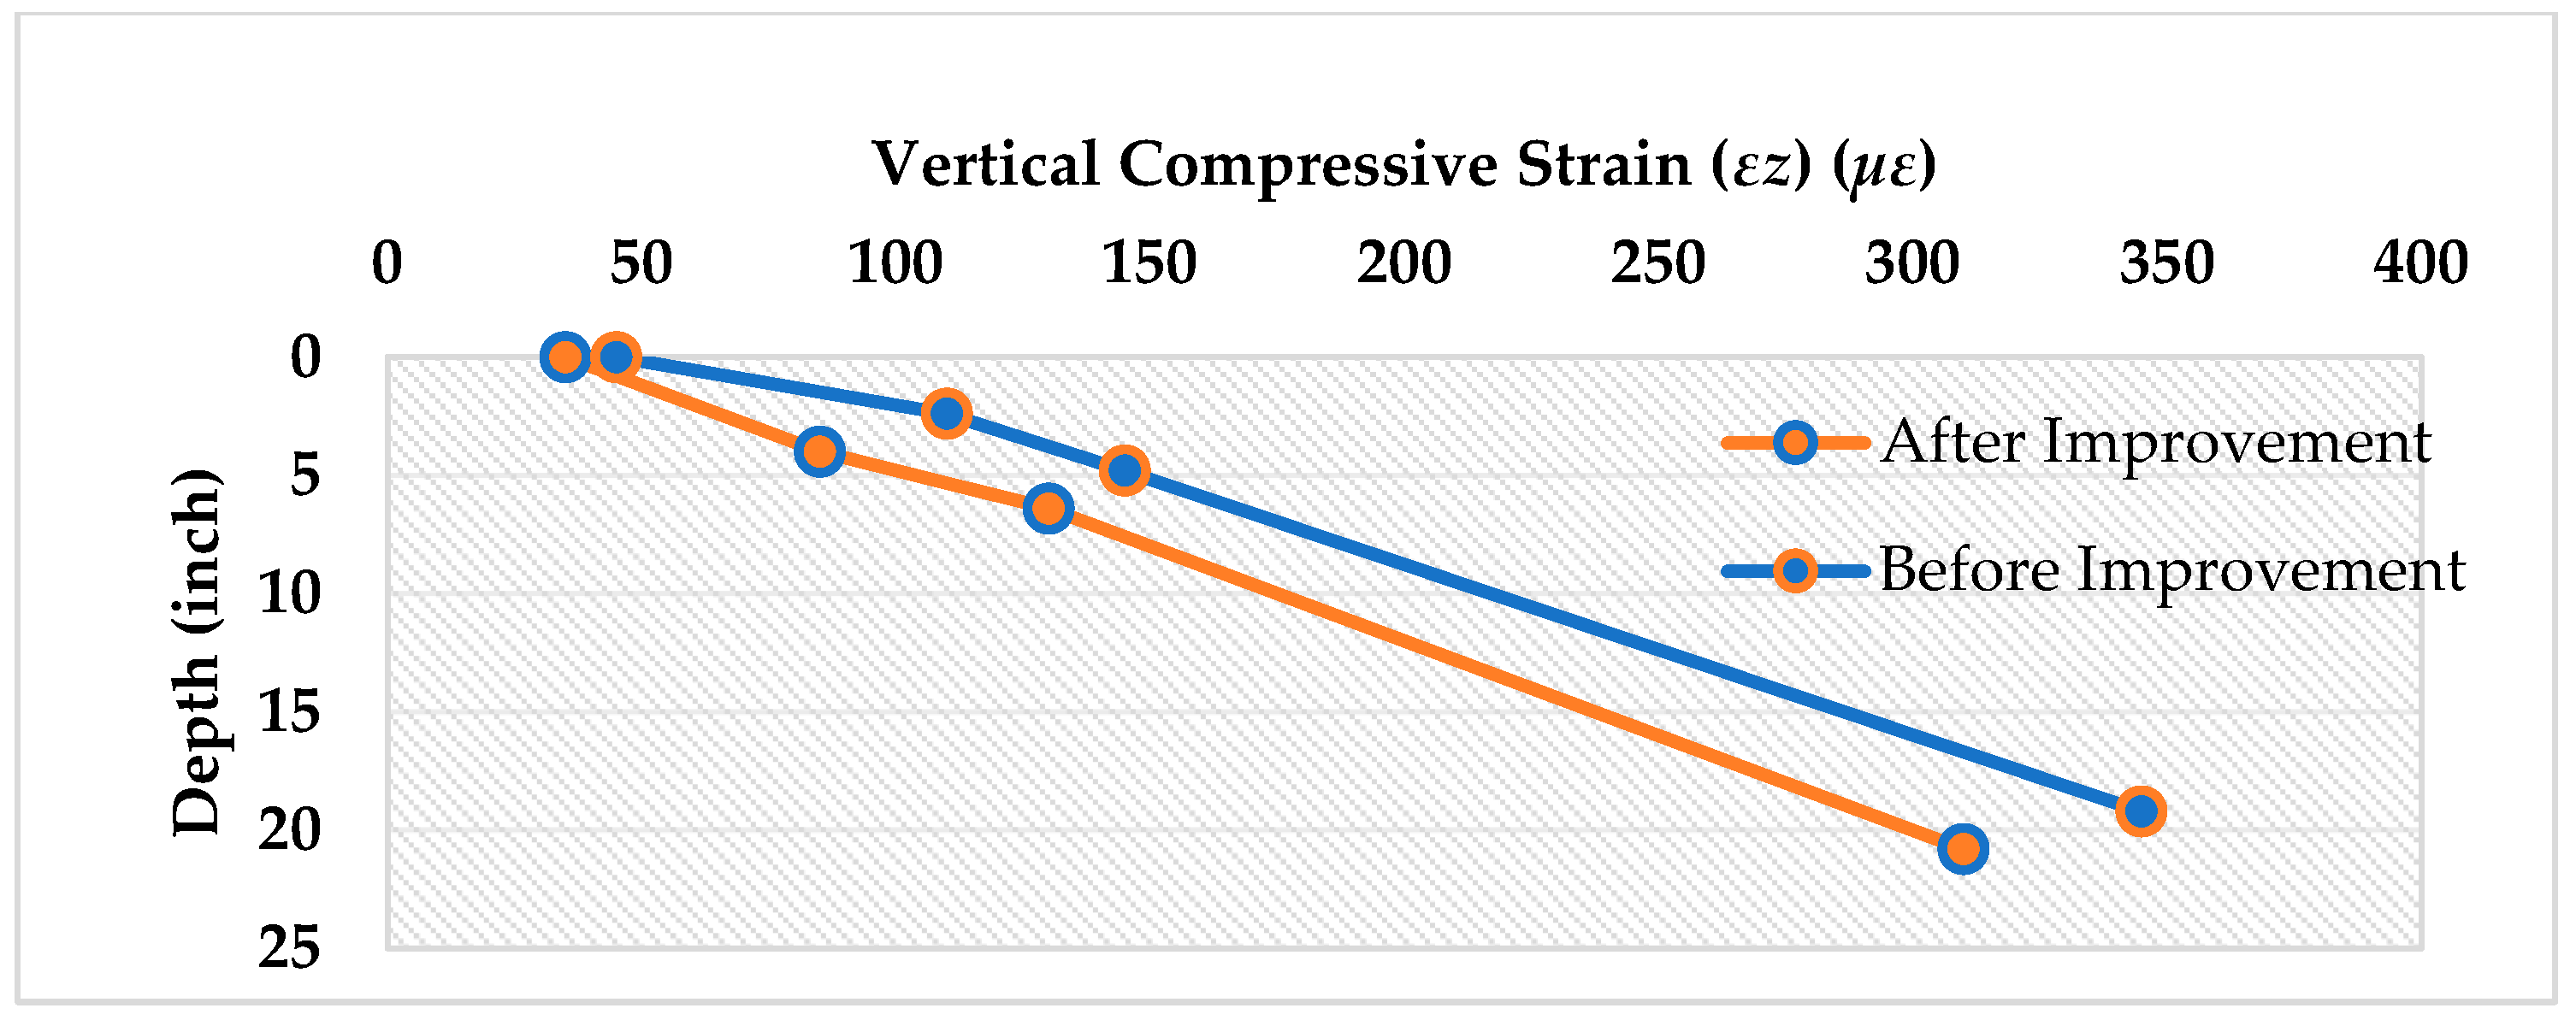
It is suggested that increasing the asphalt thickness or using a stiffer AC mix by 4 inches can reduce tensile strain. KENPAVE software was run after changing the thickness of the surface asphalt layer and keeping all other variables the same as before the improvement. The results are shown in
Table 8.
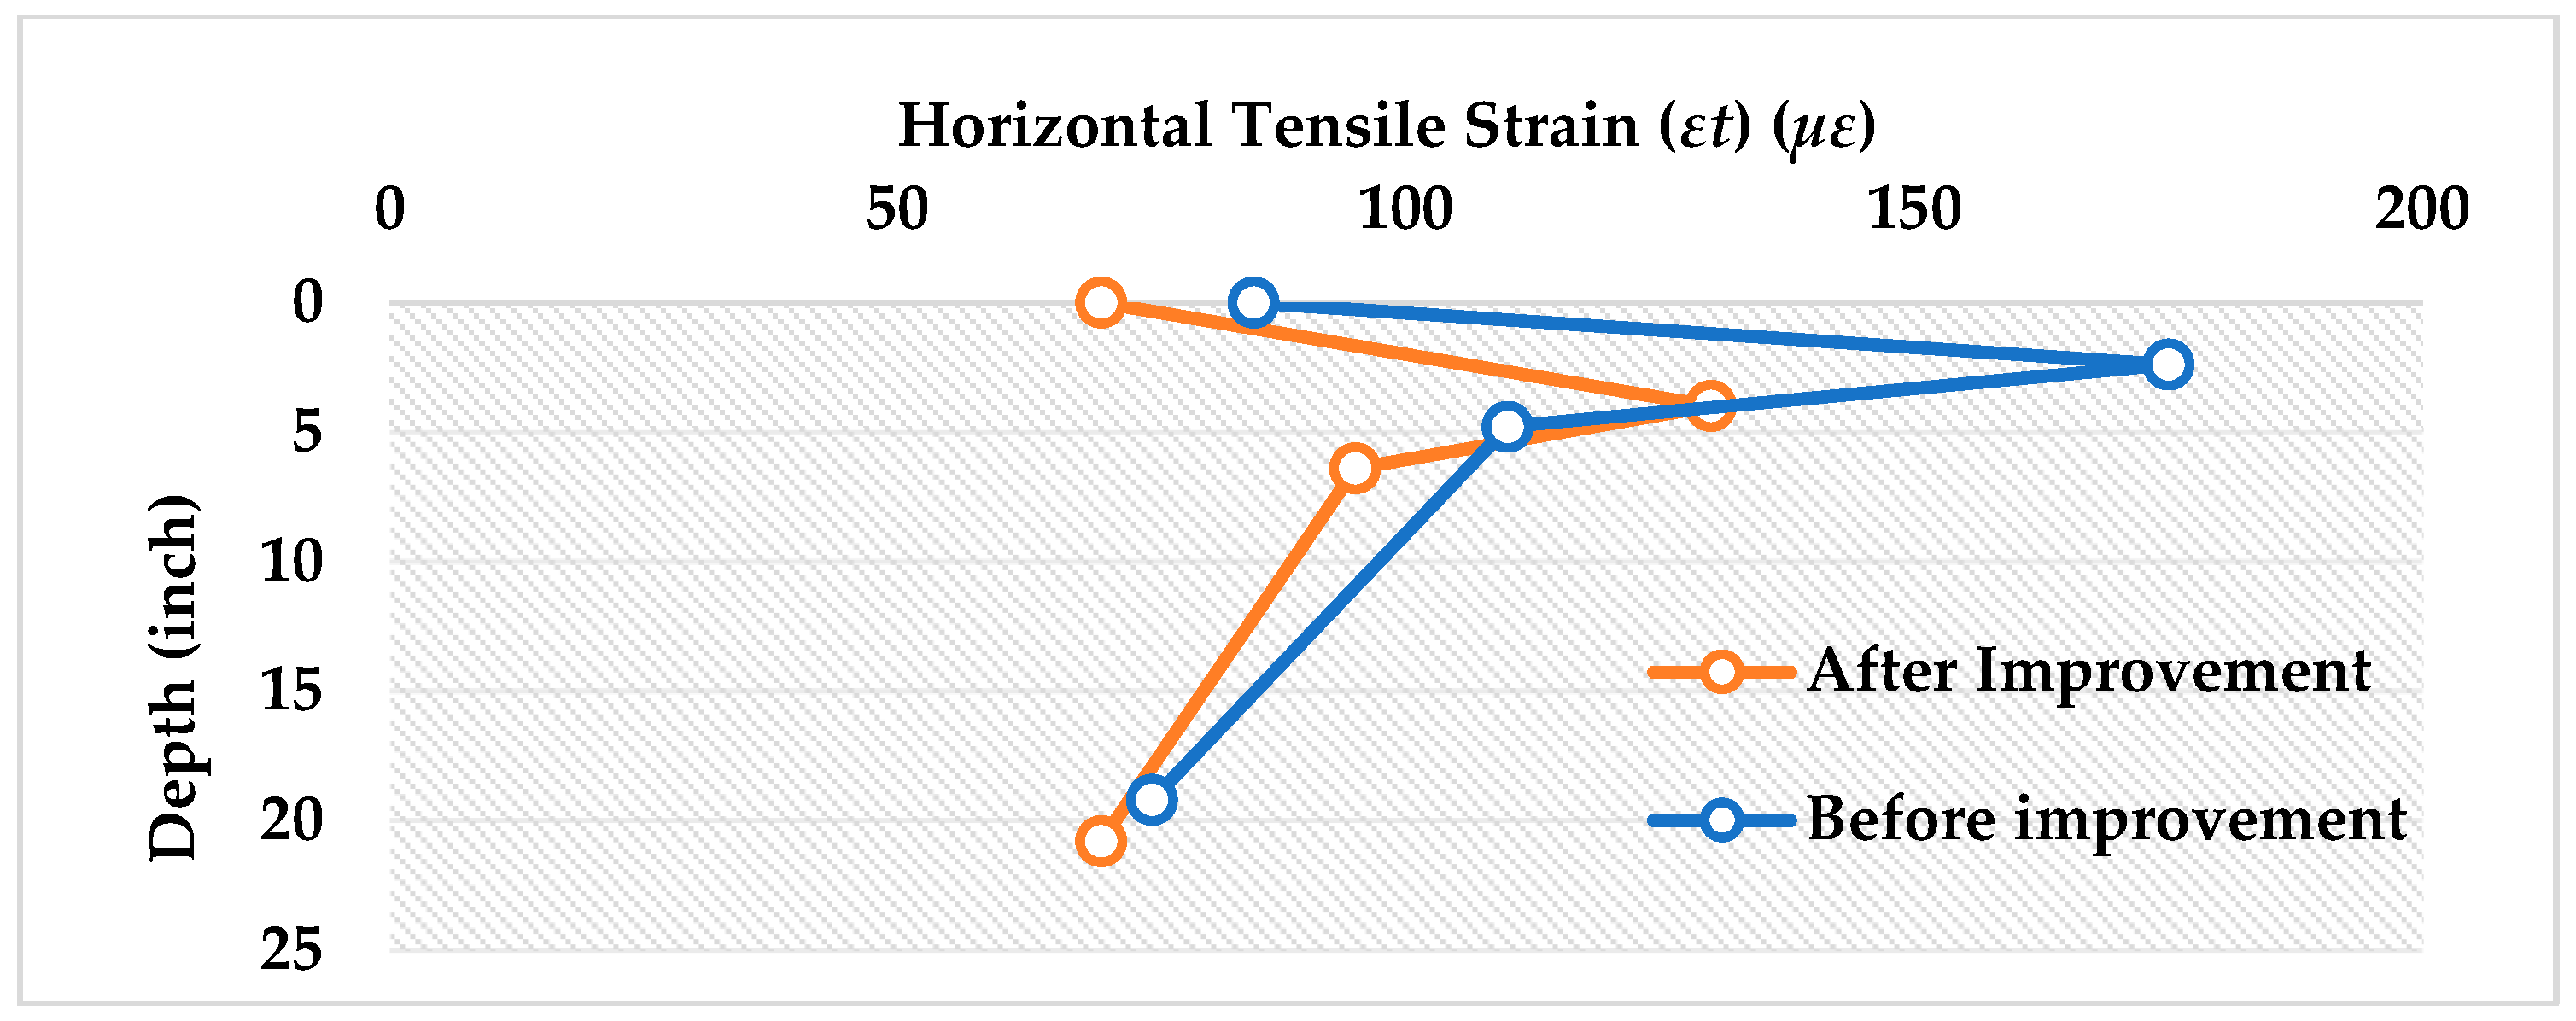
It is noted that the tensile strain at the bottom of the asphalt layer decreased from 175
µε to 130
µε, which is critical for improving fatigue life. The compressive strain at the subgrade also decreased slightly, improving rutting resistance.
Figure 12 and
Figure 13 show the reduction in strain after the asphalt thickness was improved.
The predicted load repetitions after improvement are estimated at Nf = 7.42 × 10⁶ and Nr = 6.97 × 10⁶; both exceed the current ESAL, with a rate of failure of 13%, indicating that the pavement structure is acceptable when the surface layer is increased to 4 inches. This comparison demonstrates that the overlay not only enhances structural life but also transitions the pavement from an unreliable to a reliable performance state within the proposed mechanistic–probabilistic framework.
From a safety perspective, structural improvement has important operational implications. A reduction in fatigue-cracking potential delays surface cracking and raveling, preserving surface texture and skid resistance over a longer service life. Simultaneously, the reduction in rutting rate limits water accumulation in wheel paths and decreases the likelihood of hydroplaning under wet conditions.
Moreover, lower compressive strain and reduced permanent deformation reduce the likelihood of localized settlement and surface irregularities generating excessive vertical wheel accelerations. Consequently, the improved pavement section is expected to provide more stable vehicle–pavement interactions and allow safer operation at the recommended speed limit with higher reliability.
The comparison between the original and improved sections demonstrates that relatively modest structural modifications can produce substantial benefits in both pavement performance and road safety. By reducing the governing tensile and compressive strains, the improvement not only extends structural service life but also relaxes the safety constraints associated with braking instability, hydroplaning risk, and vertical shock.
These findings support the concept of integrated pavement–safety management adopted in this study, in which rehabilitation strategies are evaluated based not only on structural performance criteria but also on their ability to sustain safer operating speeds over time. The results highlight the importance of incorporating safety-oriented performance indicators into pavement design and rehabilitation decision-making processes.
3.10. Generalization and Practical Implementation of the Framework
The proposed mechanistic–reliability–safety framework is adaptable to other pavement systems, not only to flexible pavement. Hydroplaning and braking constraints are applicable across pavement types, as they depend primarily on surface condition and friction rather than structural configuration. However, it should be focused on the governing parameters for every pavement type. For example, for rigid pavements, the tensile stress at the slab bottom is the governing parameter rather than the asphalt tensile strain, and fatigue assessment can be conducted using stress-based transfer models. For composite pavements, reflective cracking and interface shear stresses govern structural performance.
The current analysis presents deterministic safe speed limits based on structural and safety constraints. However, uncertainty in traffic growth rate, material moduli, and axle-load spectra can be incorporated using probabilistic simulation. By sampling demand and capacity distributions, reliability-based speed bands can be generated instead of a single deterministic value. This enables agencies to select speed limits corresponding to target probability-of-failure thresholds, enhancing transparency and risk-informed decision-making.
For practical implementation, the framework can be embedded within a simplified decision-support tool. Required inputs include cumulative ESAL demand, critical strain values (εt and εz), rut depth or localized settlement depth (Δh), and surface friction coefficient. The tool would generate reliability index (R), probability of failure (Pf), recommended wet-condition speed, and distressed-segment speed adjustments. By integrating mechanistic modeling, probabilistic evaluation, and safety criteria, the proposed approach supports rational and data-driven pavement management strategies.
4. Conclusions
This study developed an integrated reliability–safety framework linking mechanistic pavement distress indicators to operational speed limits. The major findings are summarized as follows:
Fatigue performance governs structural reliability for the studied corridor, with demand significantly exceeding fatigue capacity under current traffic assumptions (Z < 0), indicating a highly unfavorable structural condition.
Rutting reliability is marginal (Pf ≈ 22%), suggesting moderate vulnerability to traffic growth and material variability rather than full structural adequacy.
Sensitivity analysis confirms that subgrade modulus primarily influences rutting resistance, asphalt modulus primarily controls fatigue life, and increasing asphalt thickness provides the most balanced improvement in structural performance.
Safety constraints from hydroplaning and SSD govern the recommended operating speed under general wet conditions (~70 km/h), while localized settlement-induced vertical acceleration requires further reductions (50–60 km/h).
The proposed system-level formulation ensures that speed recommendations are derived from the intersection of structural reliability acceptability and operational safety limits, rather than from sequential or isolated evaluation.
Although the analysis relies on estimated traffic loading and empirical modulus correlations, uncertainty was explicitly addressed through reliability modeling and sensitivity analysis. Future work should incorporate WIM-based axle-load spectra, site-specific resilient modulus measurements, and vehicle–road dynamic modeling to refine calibration and extend applicability to rigid and composite pavements.
The framework provides a structured basis for integrating pavement structural condition with traffic control strategies, supporting condition-based speed management within pavement asset management systems.