Article

Reliability, Resilience, and Alerts: Preferences for Autonomous Vehicles in the United States

Department of Systems Engineering, Colorado State University, Fort Collins, CO 80523, USA
*
Author to whom correspondence should be addressed.
Future Transp. 2025, 5(4), 164; https://doi.org/10.3390/futuretransp5040164
Submission received: 24 September 2025 / Revised: 24 October 2025 / Accepted: 28 October 2025 / Published: 4 November 2025

Abstract

Self-driving vehicle (SDV) safety and reliability are becoming critical design parameters as SDVs increase their market share. This paper examines public preferences for key SDV safety features (system reliability, sensor resilience, failure behavior, and driver alert methods) using a choice-based conjoint survey of 403 U.S. respondents. A novel integration of conjoint analysis with Least Absolute Shrinkage and Selection Operator (LASSO) regression and generalized linear mixed-effects models (GLMMs) was applied to identify the most influential features and their demographic or behavioral predictors. Results show that multimodal driver alerts (i.e., audio + visual) were the most influential factor, accounting for nearly two-thirds of decision weight. System reliability (i.e., low human intervention rates) and sensor resilience (i.e., low tolerance for failures) were secondary, while failure behavior had minimal influence. Subgroup analyses revealed modest variations by willingness to pay for SDVs, income, race/ethnicity, marital status, education, driving frequency, and risk propensity, though the importance of alerts and reliability remained consistent across groups. This combined conjoint-LASSO-GLMM framework enhances the precision of preference estimation and offers actionable guidance for SDV manufacturers seeking to align safety feature design with consumer expectations.

1. Introduction

As self-driving vehicles (SDVs) become increasingly common on roadways and more available to consumers, concerns about safety for both passengers and other road users have emerged as key barriers to SDV adoption [1,2]. Incidents involving SDVs in traffic collisions, particularly with associated injuries and fatalities, have also limited growth in consumer demand [1]. These trends highlight the need for SDV designs that enhance public perception of system safety and reliability to support continued market growth. However, achieving this design objective is complicated by the non-uniform perception of SDV safety among the general population. Research shows that individuals identifying as female, non-White, or older express greater concerns regarding personal safety with SDVs than other gender, age, and ethnic groups [3]. Similarly, drivers in rural and urban areas report higher safety concerns than those living in suburban areas [3]. Perceived safety benefits have been shown to significantly influence trust in SDVs [4]. Yet, other research suggests that trust alone does not predict people’s willingness to actually ride in one [5]. Comfort with using SDVs for passenger transport, where passengers cannot intervene, is also heterogenous. One study found that younger respondents, males, and urban residents were more willing than other groups to allow their children to be transported in SDVs [6].
Several design elements influence perceptions of SDV reliability and safety. One key measure of reliability is disengagement rate, which represents the number of times a human must intervene when the SDV encounters errors or engages in potentially dangerous driving behavior [2,7]. Current SDV technology exhibits a wide range of disengagement rates, with one study reporting values ranging from 0.0002 to 3.0 disengagements per mile, depending on the vehicle manufacturer [2]. Analysis of data from the California DMV (the only regulatory agency currently mandating collection and publication of disengagement data) from 2019 to 2022 found an average of 0.0028 disengagements per mile, or 1 disengagement per 359 miles traveled [7]. Of the more than 39,000 disengagements documented in the California DMV data, only 0.22% resulted in a collision [7]. While this data provides valuable insight into current SDV reliability, it reflects conditions specific to California’s testing environment and reporting requirements. Differences in road infrastructure, climate, traffic density, and regulatory oversight across regions may limit the generalizability of these findings to broader U.S. or international contexts. Nevertheless, these values illustrate the variability in current SDV reliability performance and underscore the importance of understanding what disengagement rates potential consumers would find acceptable. Despite the low number of collisions associated with SDV disengagements, manufacturers must ensure that disengagement rates are equal to or less than the frequency that would be tolerated by potential consumers. Accordingly, one of the objectives of this paper is to evaluate acceptance of proposed disengagement rates.
Another factor associated with perceived safety of SDVs is the method of notifying the driver of a takeover request (TOR), which alerts the driver to intervene in response to failures or challenges within the self-driving system. Potential modes for TOR alerts include heads-up displays (HUDs) on the windshield, strip lighting on the perimeter of the windshield, console displays, audio alerts, and haptic signals to the driver [8]. The previous literature has identified a need for multimodal TOR design, along with a tailored approach for modal selection and modal combinations based on the scenario being encountered [9]. This suggests that SDVs will need multimodal TOR alert capabilities, such as visual and audio alert mechanisms, to ensure safe operation of the self-driving system. To explore user preferences, this paper includes a conjoint analysis evaluating TOR methods, specifically comparing audio only, visual only, and combined audio and visual alerts.
Failure response behavior is another critical factor influencing perceptions of SDV safety. Current safety architectures for SDVs typically assume the presence of a driver with the capability to take control of the vehicle when there is a self-driving system failure [10]. Concurrently, research is underway to improve SDV failure mode and danger mitigation behavior, such as enabling SDVs with position receiver failures to identify safe routes to roadway shoulders versus merely slowing to a stop within their current lane [10]. Other enhancements include the development of decision-making algorithms that allow self-driving systems to identify safe responses to road conditions that include lane changes and slower speeds [11]. In response, part of the conjoint analysis performed in this paper evaluates several failure response behaviors in the event that the self-driving system encounters a scenario it cannot navigate.
The final aspect of SDV safety examined in this paper is system resilience, defined as the number of critical sensors within the self-driving system that would be tolerated to fail before the self-driving system was not able to operate safely. The assumption is that a system with a redundant sensor architecture, which allows some sensors to fail before safety is compromised, would be perceived as having greater safety than a system with no such sensor redundancy. As such, part of the conjoint analysis performed in this paper includes evaluation of several sensor system resilience levels.
A review of the literature identified several survey studies that utilized conjoint analysis experiments to evaluate elements associated with SDV safety and reliability. However, most prior work examined these attributes in qualitative or indirect terms, such as perceived safety, willingness to pay for safety features, or preferences for interface design. For instance, Kang et al. [12] explored driver display communication modes, while Nikkar and Lee [13] assessed willingness to pay for safety functions such as emergency stop and exit assistance. Other studies, including Pronay et al. [14], incorporated general safety features without quantifying specific performance levels. A common limitation across these studies is that they did not evaluate quantitative performance attributes or system behavior metrics that more directly capture the operational safety characteristics of SDVs.
While traditional conjoint- and discrete-choice approaches have been used to model consumer preferences for vehicle technologies, these methods typically estimate feature utilities independently and do not incorporate systematic variable selection or hierarchical modeling of demographic effects. As a result, they may obscure the relative influence of correlated predictors or understate cross-group variability. Hierarchical Bayesian extensions have been proposed to address these issues by modeling individual-level heterogeneity, but these approaches require informative priors and are computationally intensive for larger datasets. In contrast, integrating conjoint analysis with modern regularization and mixed-effects techniques, such as LASSO regression and generalized linear mixed models, provides a more transparent, data-driven means of identifying dominant features and subgroup effects. This combined framework enhances both precision and interpretability while maintaining computational efficiency for large-scale datasets.
Taken together, these gaps reveal a need for a quantitative, scalable framework that links measurable SDV safety features with underlying demographic and behavioral indicators of preference. Building on these prior efforts, this paper seeks to advance the understanding of how consumers evaluate measurable, system-level safety features in self-driving vehicles. Specifically, this paper addresses three key research questions:
  • Which SDV safety features most strongly influence consumer preference?
  • How do these preferences vary across demographic and behavioral subgroups?
  • How can an integrated conjoint–LASSO–GLMM framework improve the interpretability and robustness of feature level preference estimation compared to traditional methods?
By addressing these questions, the paper provides a quantitative foundation for aligning SDV design priorities with user expectations regarding safety and reliability.

2. Materials and Methods

An online anonymous survey was developed using the Qualtrics survey software (version August 2025) and distributed via the Prolific platform to US-based respondents, targeting a sample that was demographically similar to the population of the United States. The survey was approved by the Colorado State University Institutional Review Board (IRB) under protocol #5825. There were 403 participants that fully completed the survey.

2.1. Demographics and Self-Reported Attributes

The survey captured several self-reported demographics and other attributes about the survey respondents to determine if any of these attributes were significant predictors of perceived SDV feature importance. These factors are described in this section.

2.1.1. Demographics

Attributes related to demographics included gender, race/ethnicity, marital status, education level, and annual household income. Responses were captured using single selection factor attributes for each demographic category.

2.1.2. Willingness to Pay (WTP) for SDVs

Willingness to pay (WTP) for SDVs was measured in US dollars (USD) for two different levels of automation: full self-driving, corresponding to SAE Level 5 automation, and driver assist, aligned with SAE Level 3 automation. WTP data was collected using an open-text field that allowed respondents to enter any numeric or text response. Post-survey data clean-up included updating values such as “none” and “not one cent” into number values of USD 0.

2.1.3. Driving Frequency

Survey respondents were asked to identify how often they drove in a typical week using a single-choice question with five levels: never, once a week, 2–3 times a week, 4–6 times a week, and daily.

2.1.4. Advertising Impact on SDV Manufacturer Blame Assignment

Stewart and Gallegos [15] introduced the concept of the “impact of advertising” as a predictor of acceptance of various aspects of SDVs. This measure evaluates how a respondent’s attribution of blame to an SDV manufacturer for collisions or moving violations changes in response to the manufacturer’s advertising content.
In this survey, respondents were presented with two scenarios involving an SDV collision caused by a traffic sign recognition (TSR) failure and two scenarios in which an SDV committed a moving violation due to incorrect TSR interpretations. Each scenario included both an image and a text description, which are detailed further in Stewart and Gallegos [15].
After assigning initial blame for each scenario, respondents were presented with the following prompt:
If the vehicle manufacturer for the vehicle in this event had shown commercials that the self-drive feature allows the driver to multi-task and not focus on road conditions or on how the self-driving car was driving, how would this information change your opinion on how much the vehicle manufacturer was to blame for this [event]?
Respondents could respond with one of three options:
  • Vehicle manufacturer would be more to blame for the accident [scored as +1];
  • Vehicle manufacturer would have the same level of blame for the accident [scored as 0];
  • Vehicle manufacturer would be less to blame for the accident [scored as −1].
The impact of advertising score was then computed as the sum of their responses across the four scenarios, resulting in a possible range of −4 (manufacturer not responsible) to 4 (manufacturer fully responsible).

2.1.5. Risk Profile

Risk profile was evaluated using the General Risk Propensity Scale (GRiPS) [16]. Each of the eight GRiPS questions was represented as a 5-point Likert scale from strongly agree [scored as 5] to strongly disagree [scored as 1], resulting in a potential range of risk profile scores from 8 (low risk propensity) to 40 (high risk propensity).

2.2. Choice-Based Conjoint Analysis

Conjoint analysis is a market research technique used to identify consumer preferences and the product trade-offs they are willing to make. In this approach, respondents evaluate packages composed of different feature values and indicate which package they prefer [17]. The resulting data can be used to predict the optimal product or service configuration based on the perceived importance of each feature within the package. Conjoint analysis has been applied in previous research examining preferred features in vehicles, including hybrid electric vehicles (HEVs) [18], hydrogen fuel cell vehicles [19], and autonomous vehicles [12].
In this paper, the conjoint analysis assessment was developed and administered using the Qualtrics survey platform’s conjoint analysis tool, which also calculated relative utility values for each feature. Details of the survey instrument and example choice sets are provided in Appendix A.

2.2.1. Conjoint Analysis Features and Feature Levels

There were four features relating to SDV safety evaluated within the conjoint analysis. Participants were provided with a detailed description of each feature upon beginning the conjoint analysis section of the survey. Each feature was defined as follows, and the levels of each feature are provided in Table 1:
  • Human Interventions (4 options)—Total number of times within a five-year period that a driver must take over the self-driving functionality, representing reliability.
  • Failure Allowance (4 options)—Portion of sensors, as a percentage of the total sensors needed for the self-driving system, that are allowed to fail before the system is no longer capable of self-driving, representing resilience.
  • Failure Behavior (3 options)—Action the vehicle takes when the self-driving system has encountered an error that requires a transfer of control from the self-driving system back to the human driver.
  • Alert Method (4 options)—Method in which the vehicle alerts the driver to alerts or warnings from the self-driving system, including visual and/or audio warnings.
Table 1. Features and levels for conjoint analysis.
Feature NameFeature Levels
Human Interventions1× per 5 years
100× per 5 years
500× per 5 years
1000× per 5 years
Failure Allowance5%
10%
15%
20%
Failure BehaviorVehicle Stops Safely
Vibration Alert & TOR
Visual Alert & TOR
Alert MethodNo Alert
Visual
Audio
Audio & Visual
For “Human Interventions”, respondents were presented with the feature “How Often Driver Must Take Over”, with choice options as shown in Table 1. This construct parallels the term “disengagement event” commonly used in the autonomous vehicle reliability literature [20,21,22]. The purpose of this feature was to assess respondents’ preferences regarding system reliability.
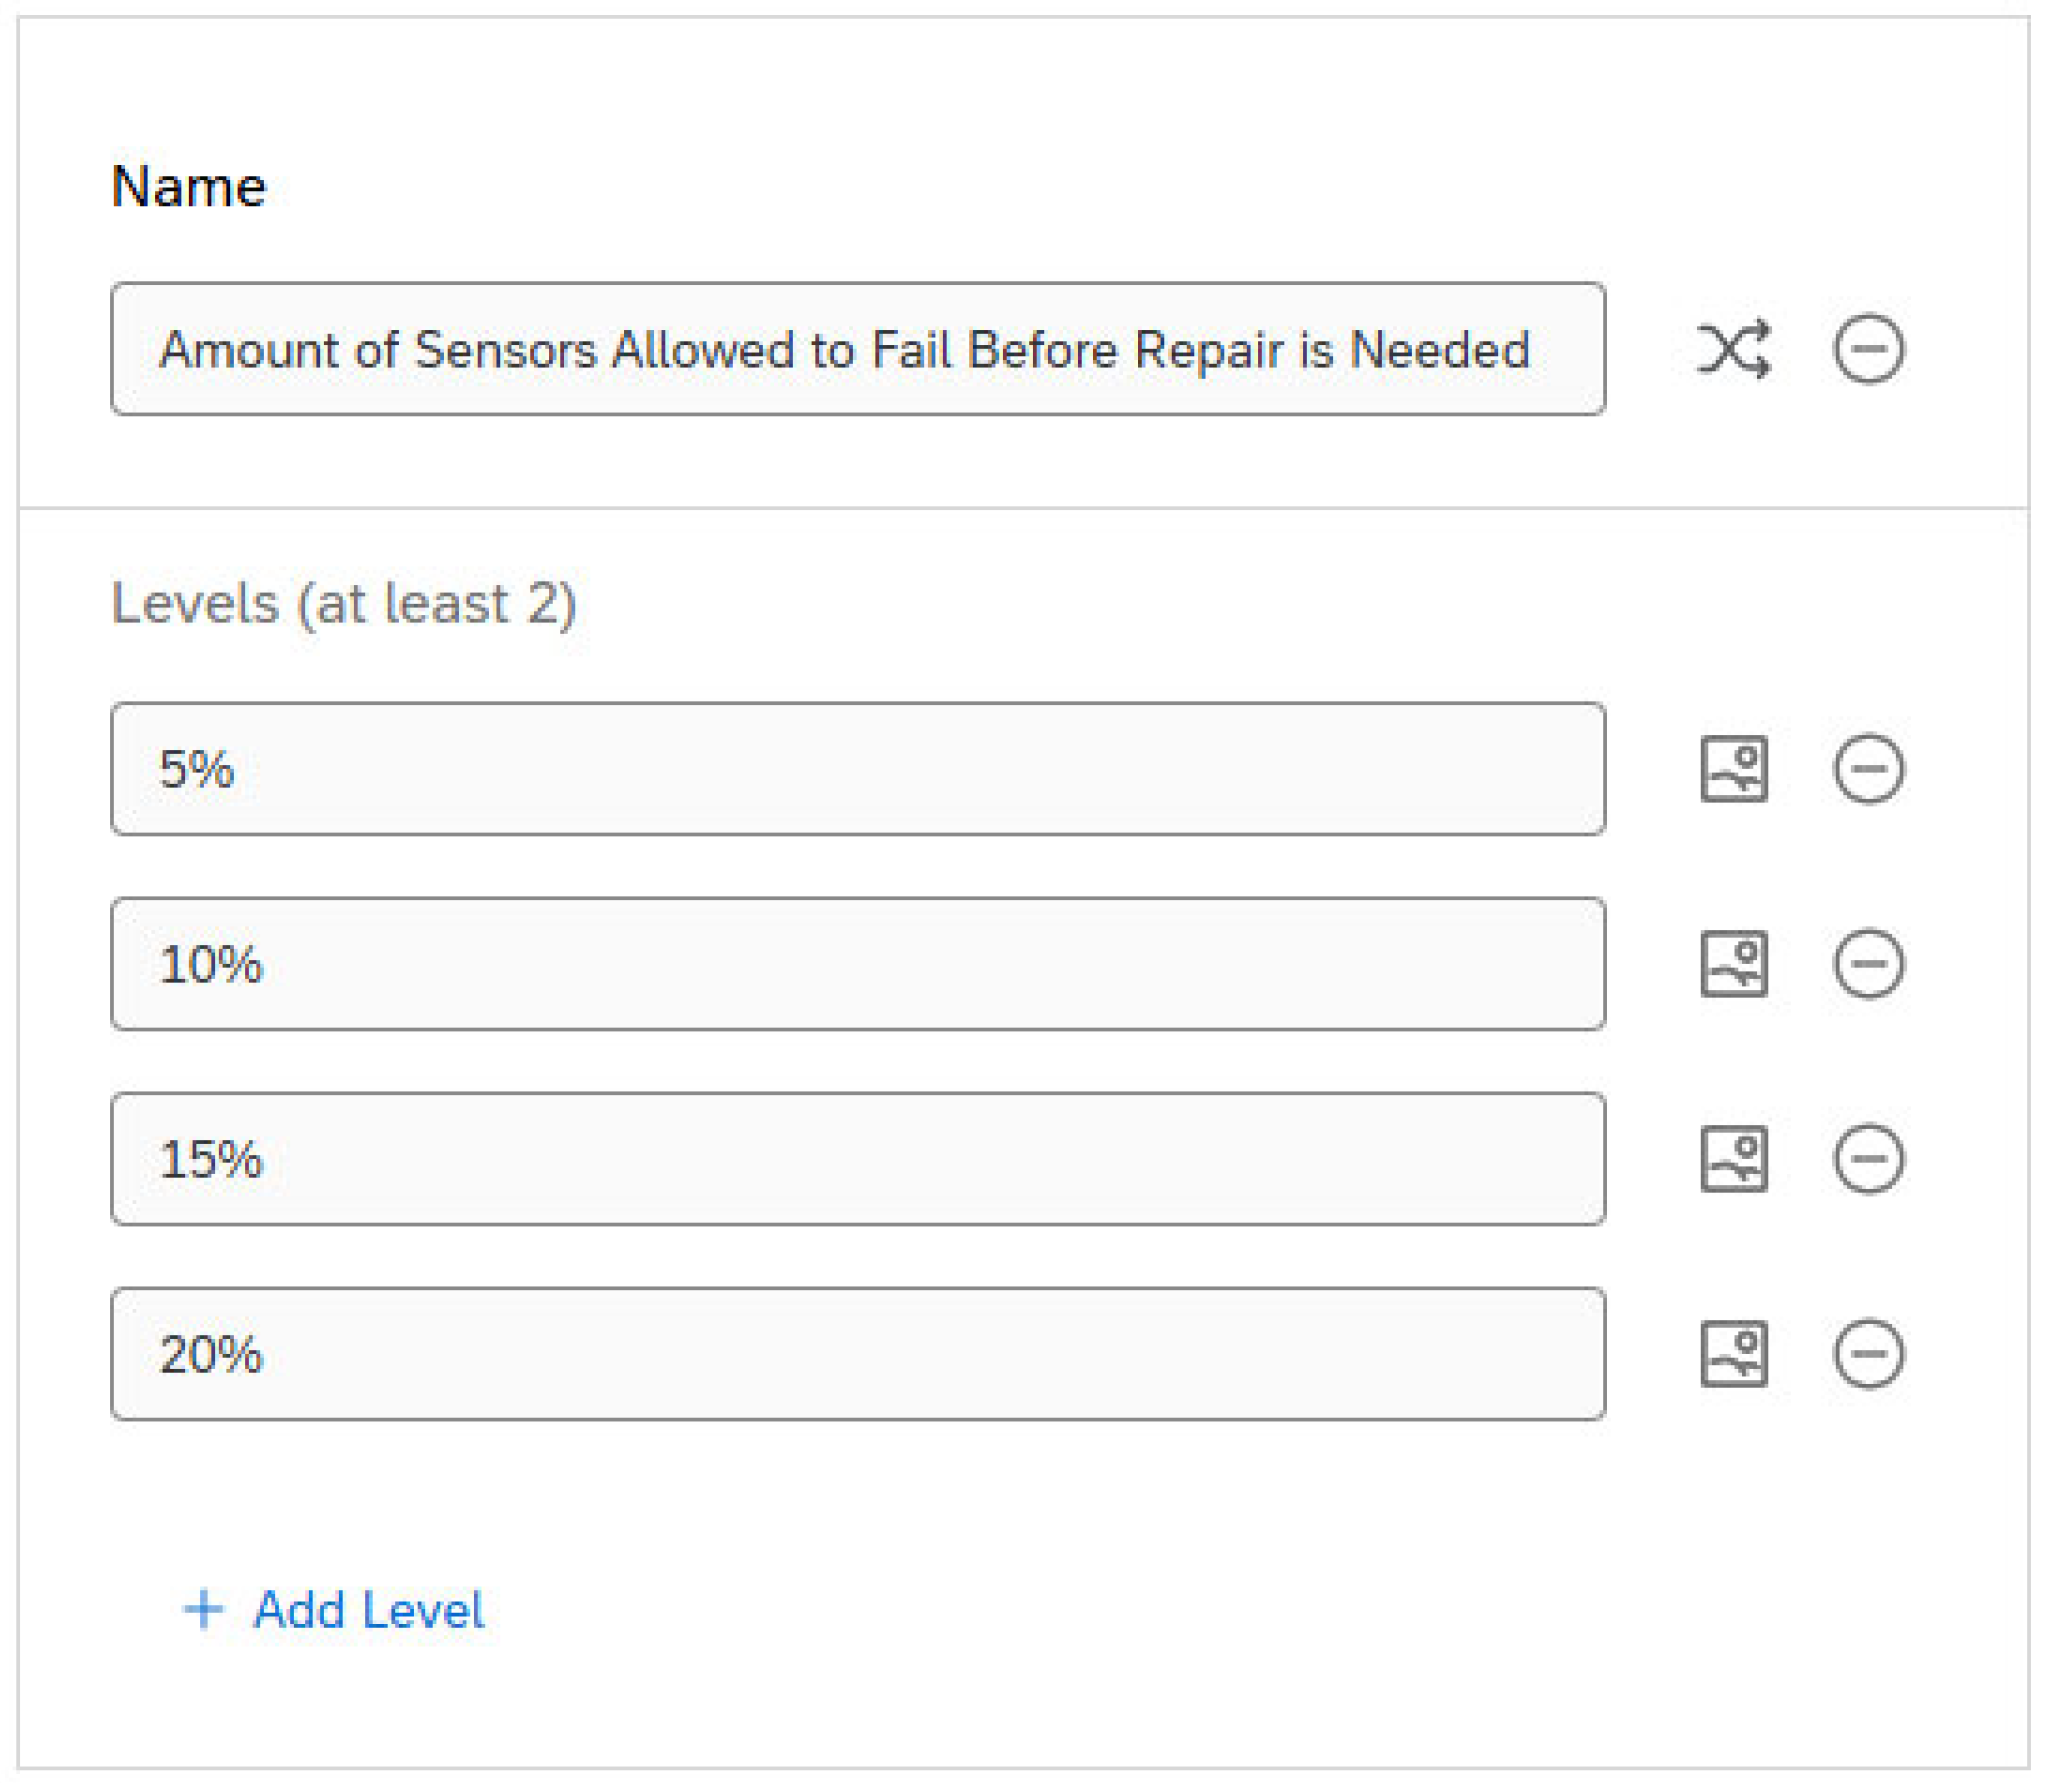
For “Failure Allowance”, respondents viewed the feature “Amount of Sensors Allowed to Fail Before Repair is Needed”, with each choice set including one of the failure allowance levels shown in Table 1. This feature was designed to evaluate preferences related to sensor resilience.
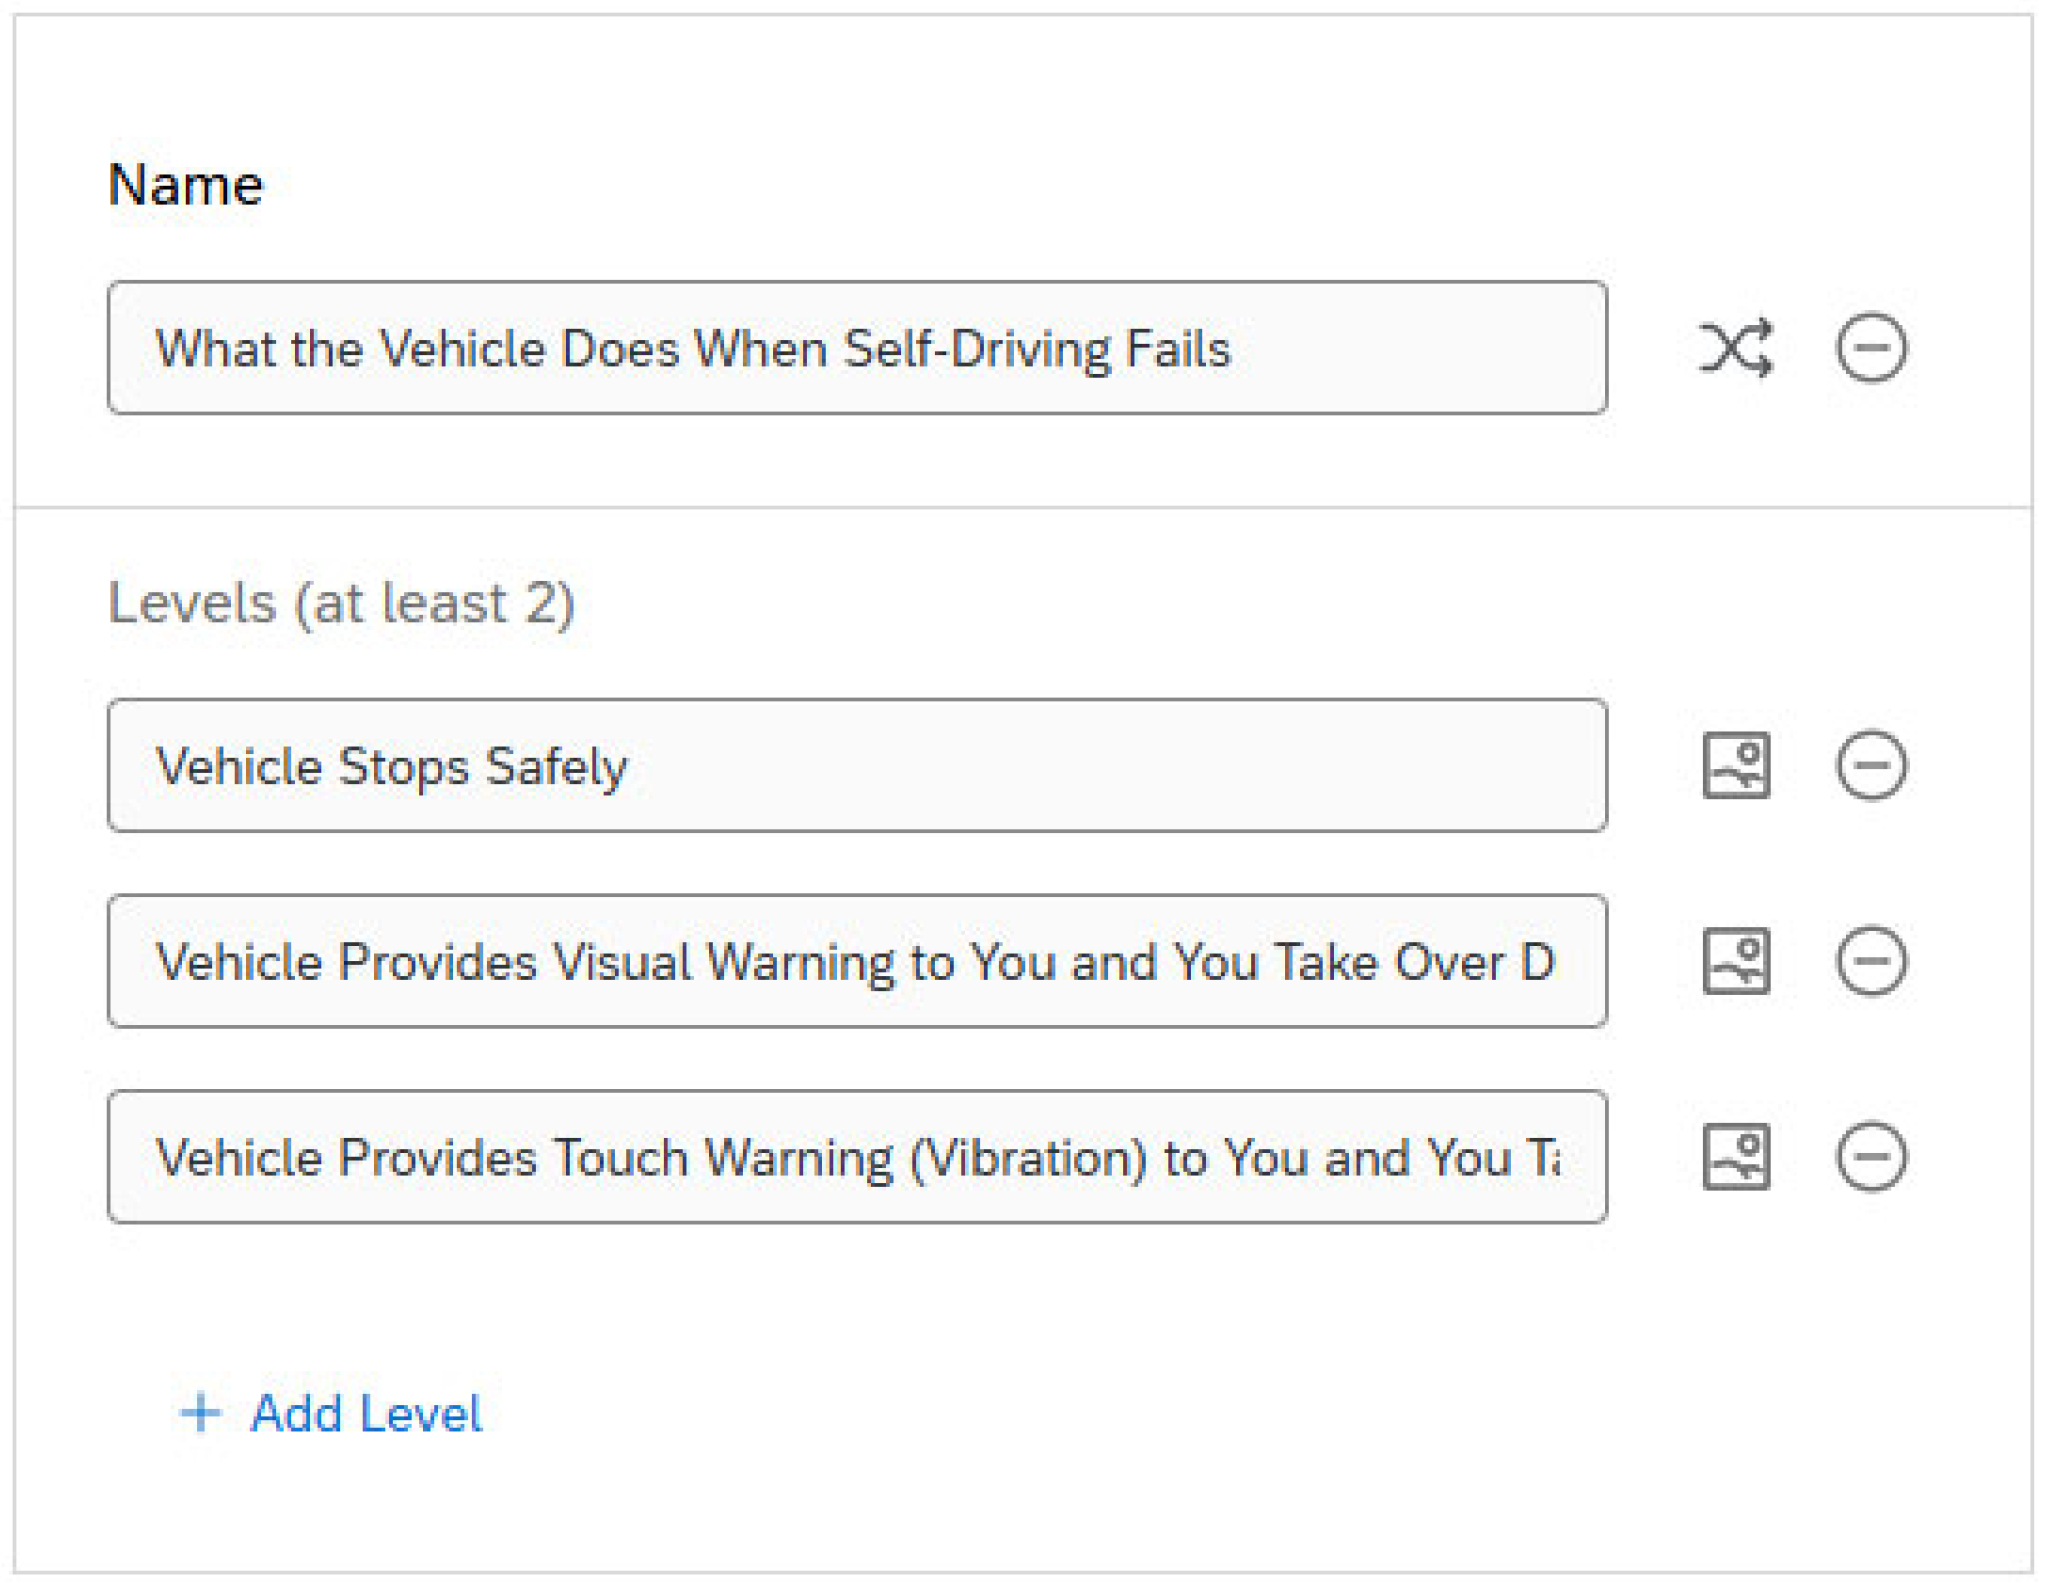
For “Failure Behavior”, respondents were shown the feature “What the Vehicle Does When Self-Driving Fails”, with each choice set displaying a level from Table 1. This feature was designed to capture respondents’ preferences regarding SDV failure behavior.
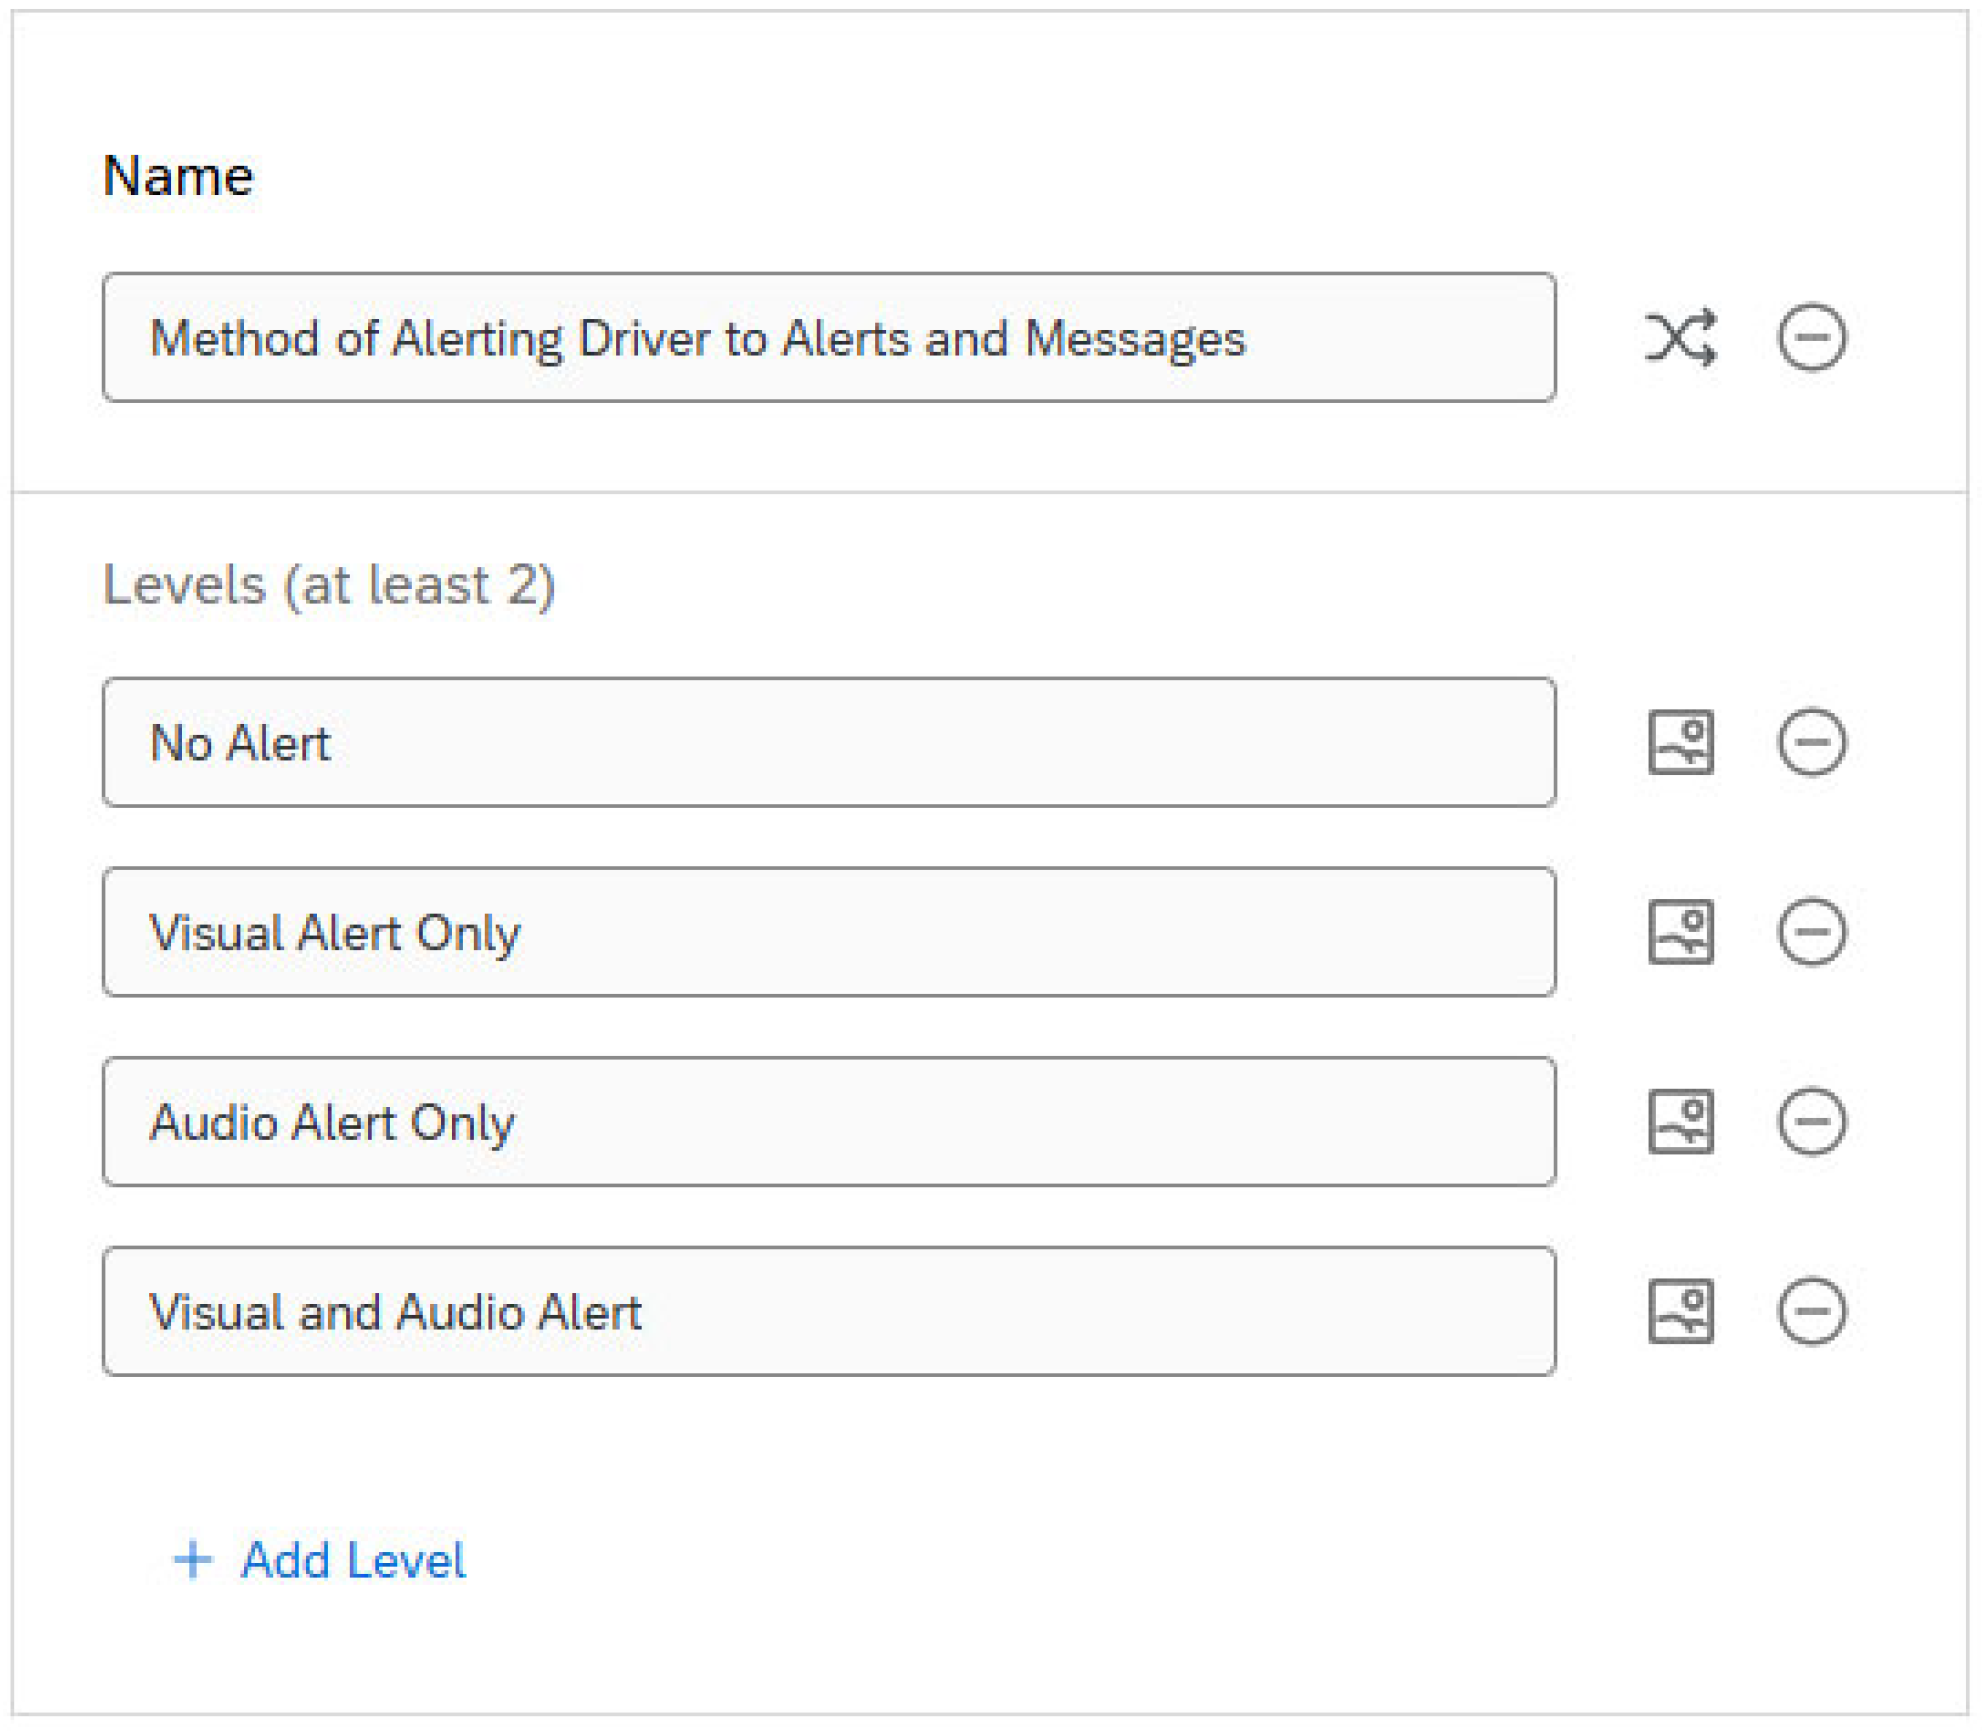
Finally, for “Alert Method”, respondents were presented with the feature “Method of Alerting Driver to Alerts and Messages”, with options corresponding to the levels provided in Table 1. This feature was designed to assess respondents’ preferences for how the self-driving system communicates alerts during a failure event.
These four safety-related features (i.e., reliability, resilience, failure behavior, and alert method) were intentionally selected to focus on technical system attributes that directly influence the operational safety and user trust of SDVs. The prior literature has consistently identified these dimensions as central to public perceptions of SDV safety and reliability [1,2,3,6,7,8,9,10,11]. In contrast, attributes such as cost, convenience, or aesthetic design were excluded to minimize potential confounding effects between safety perceptions and market-oriented trade-offs. Including economic or convenience factors would have likely shifted respondent attention away from the core research objective of identifying how measurable system-level safety features influence consumer preferences.

2.2.2. Conjoint Analysis Feature Sets

The conjoint analysis contained feature sets (or packages) comprising one option from each feature. Participants completed a series of choice tasks in which two packages were presented side-by-side, and they indicated their preferred option for an SDV.
The combination of features and levels yielded 192 possible unique feature sets. Each participant completed six choice tasks, each involving a pairwise comparison of two feature sets. A priori sample size calculations indicated that a minimum of 340 respondents was required; the final dataset included 403 valid responses, exceeding this threshold. To further validate the required sample size, we followed the approach outlined by de Bekker-Grob et al. [23] for binary discrete-choice experiments. The sample size N was then estimated using Equation (1).
N = z α + z β 2 × σ 2 δ 2
where z α = 1.96 for a two-tailed significance level of 0.05, z β = 0.84 for 80% statistical power, and σ 2 = 1.0 is the standard multinomial logit utility variance in DCEs. The term δ represents the desired effect size, and N is the required sample size.
Statistical power was then computed as:
P o w e r = 1 Φ 1.96 × 1 N δ
where Φ is the cumulative distribution function of the standard normal distribution. Effect sizes ( δ ) between 0.2 and 0.5 were evaluated, incorporating a 0.7 adjustment factor (i.e., N = 282) to account for unobserved heterogeneity [23]. The resulting sensitivity analysis is summarized in Table 2.
These results confirm that our sample size of N = 403 provides approximately 97–99% power at α = 0.05 to detect an effect size of δ   = 0.2 (odds ratio = 1.22), exceeding the 80% minimum requirement [23]. After adjusting for unobserved heterogeneity (effective N = 282, 95% power), the power remained above 95%, indicating that the sample size was sufficient to detect meaningful differences in feature preferences.

2.2.3. Feature Level Utility Values

Qualtrics uses a multinomial logit model to estimate the individual utilities of choice attribute levels using the choice variable (i.e., which package of options was chosen) as the dependent variable. Using a Bayes hierarchical variation for the logit model, Qualtrics analyzes the survey response data to calculate a part-worth utility value for each feature level [24]. These utility values are standardized, such that the mean value between all feature levels is centered at 0, allowing for relative evaluation of feature levels against one another. For the utility values, the higher the score, the more weight it carries in the decision-making process.

2.3. Generalized Linear Mixed-Effects Models (GLMMs)

Binary logistic mixed-effects models (a type of generalized linear mixed model, GLMM) were used to evaluate the effects of demographic and self-reported attribute data on SDV safety feature preference. This method was selected over hierarchical Bayesian alternatives due to the absence of informative prior distributions, which are typically required to take full advantage of Bayesian estimation. In the absence of such priors, Bayesian methods tend to yield results nearly identical to frequentist models in both magnitude and interpretation [25]. Prior studies have shown that for large datasets (N = 672–1250), frequentist and Bayesian mixed-effects approaches produce comparable outcomes when data completeness is high [26,27,28]. Given that our conjoint analysis had more than 2400 observations with no missing data, the GLMM framework provided an equally robust yet more computationally efficient means of modeling individual-level heterogeneity.
In these models, the dependent variable was whether the choice package, which consisted of the human intervention value, failure allowance value, failure behavior, and alert method, was selected (yes/no) in each choice task. Fixed effects included measured impact of advertising, WTP, self-reported drive frequency, and demographics. Random intercepts for participant ID and survey block ID were included to account for within-participant variation and potential dependencies created by grouping survey questions. This analysis was conducted using RStudio (R version 4.5.1) with the lme4 package.
This statistical technique has been utilized in previous studies to address unobserved heterogeneity across individual respondents while also accounting for repeated choice observations within the respondent pool [29]. A review of the previous literature also found that GLMMs are acceptable for low-complexity models [30] and for models where normality can be assumed for random effects [31].

2.4. Least Absolute Shrinkage and Selection Operator (LASSO)

The Least Absolute Shrinkage and Selection Operator (LASSO) is a statistical method originally developed as an alternative to subset selection and ridge analysis and used for shrinkage and selection in regression problems [32]. LASSO has become a popular statistical technique for simultaneous estimation and variable selection [33], though it may suffer from inconsistency under some conditions due to the LASSO regularization parameter not being optimally chosen [34]. For scenarios where a small number of large effects are present in the data, or a small to moderate number of medium-sized effects exist, LASSO has been shown to be superior to ridge regression and subset selection techniques [32].
Previous studies have used LASSO methods and LASSO-type coefficient penalties in conjoint analysis to identify choice features that have the most significant impact on package selection. For example, LASSO has been used to identify important factors for electric vehicle adoption in the United States [35] and in the United Kingdom [36].
In this paper, LASSO regression analysis was performed on the survey data to determine the relative importance of each SDV safety feature examined in this study. This analysis was conducted using RStudio (R version 4.5.1)

3. Results

Following cleaning of the survey response data, a total of 403 responses were included in the final analysis.

3.1. Description of Respondent Pool

The Prolific platform provided a respondent pool intended to be demographically similar to the general population of the United States. The resulting survey respondent pool demographics, along with a comparison to U.S. Census data [37,38,39,40,41,42], is shown in Table 3. The literature suggests that category levels need at least 30 respondents to provide sufficient statistical power to predict part-wise utilities in conjoint analyses [43]. Hence, any demographic factor with less than 7.4% (i.e., 30/403) was not considered as a possible predictor in the regression analyses on feature selection.

3.2. Utility Values for Entire Sample

First, perceived importance of each feature and levels within each feature were compared across the entire sample. Standardized utility values represent how strongly each feature level influenced respondents’ choices, adjusted to a common scale so that differences in preference can be compared directly across features. Analyses within and between feature levels were standardized so that results could be compared consistently, for example, from alert method levels to failure allowance levels, ensuring all values were expressed on the same baseline and scale of variability.

3.2.1. Comparison of Features

Figure 1 presents the utility values with 95% confidence intervals of the four features based on responses from the full survey sample. Across the respondents, method of alerting drivers to alerts and warnings and human intervention frequency (i.e., reliability) were the most influential features in choice set selection. In contrast, sensor failure allowance (i.e., resilience) and failure behavior were comparatively less important.

3.2.2. Comparison of Levels Within Features

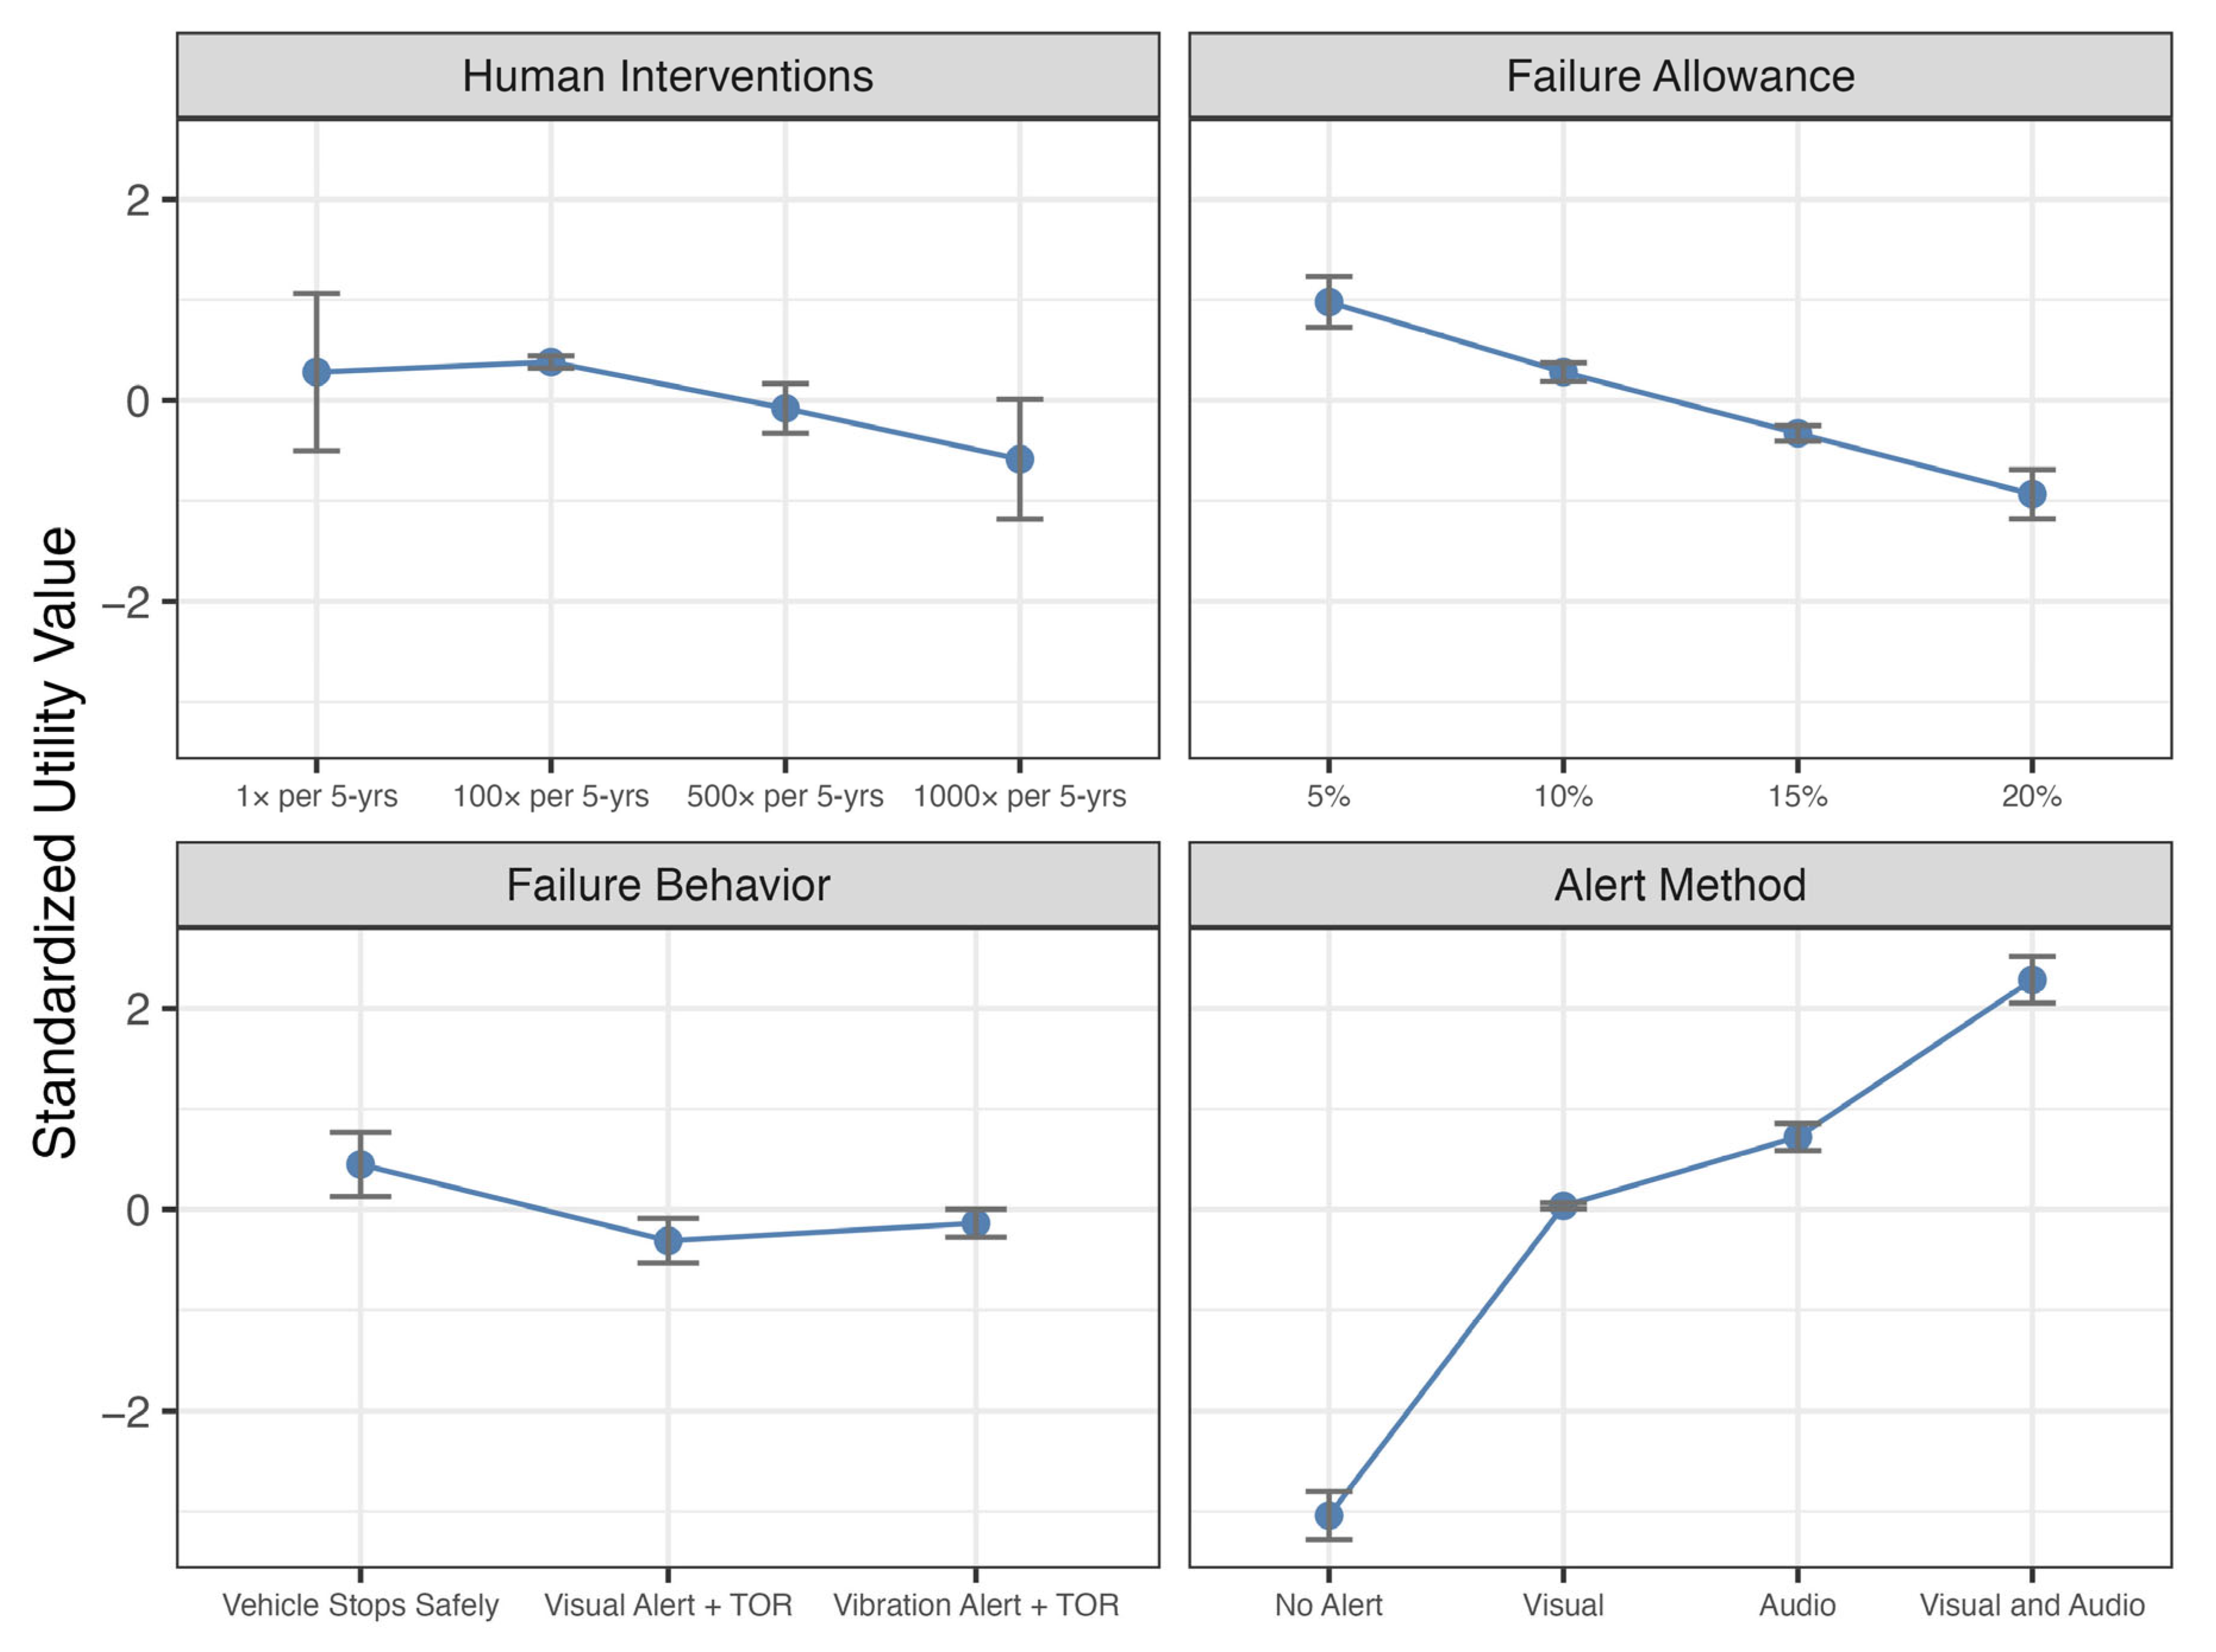
The standardized utility values for each level, with 95% confidence intervals, are provided in Figure 2, enabling both within- and between-feature comparisons. Positive utility values indicate a preference for the feature level, while negative utility values reflect lower perceived importance. Key observations include a strong preference for human intervention frequencies between 1 and 100 times over a five-year period, as well as a preference for the SDV to stop safely in the event of a system failure. Respondents also expressed clear disapproval of having no alert system for notifications of an SDV system alert, favoring instead a combined audio and visual alert. Finally, the data suggests a willingness to accept relatively low system resiliency, with preference for requiring sensor repairs when as few as 5% of the sensors have failed.

3.2.3. Optimal Feature Levels

Table 4 captures the optimal feature package observed across the total respondent population. This was determined by selecting the level within each feature with the highest utility value.

3.3. Utility Values by Sample Subsets

Several binary logistic mixed-effects models were used to identify significant predictors of feature level preferences. To simplify the tables, only the significant predictors were retained, while the insignificant predictors from the model were removed from each table. These predictors were then used to compare utility values across the feature levels within each significant factor.

3.3.1. Feature Level Utility by WTP

Before conducting the utility analysis based on WTP, survey responses were screened for outliers in both the self-driving and driver-assist WTP data. Because responses were collected through open-text fields, some participants entered extremely high or nonnumeric values. To identify and exclude these outliers, the interquartile range (IQR) method was applied separately to each dataset. Observations falling 1.5 × IQR below the first quartile or 1.5 × IQR above the third quartile were classified as outliers and removed from subsequent analyses.
For self-driving WTP, 32 outliers were identified, ranging from USD 50,000 to USD 400,000. For driver-assisted WTP, 45 outliers were identified, ranging from USD 25,000 to USD 300,000. These extreme or implausible values were excluded to prevent distortion of model estimates.
After cleaning, WTP remained a significant predictor of feature level selection for human intervention frequency and system resilience, as shown in Table 5. Since WTP was expressed in continuous dollar amounts, the resulting coefficients were small in magnitude, reflecting incremental changes in preference with each dollar increase. Respondents with a higher WTP for full self-driving functionality were less likely to prefer higher intervention frequencies (100–1000 interventions per five years). Conversely, those with a higher WTP for driver-assist automation were more likely to tolerate higher intervention frequencies and preferred greater system resilience (15% failure allowance).

3.3.2. Feature Level Utility by Impact of Advertising

Impact of advertising was found to significantly predict feature level selection for human intervention frequency, as shown in Table 6. Specifically, respondents with higher impact of advertising scores had a lower preference for a system reliability level of 1000 interventions per 5-year period than those with lower impact of advertising scores.

3.3.3. Feature Level Utility by Risk Score

Risk score also showed to be a significant predictor of feature level selection for alert method, as shown in Table 7. Specifically, respondents with higher risk propensity preferred visual and audio alert systems versus respondents with lower risk propensity scores.

3.3.4. Feature Level Utility by Drive Frequency

Drive frequency emerged as a significant predictor of feature level selection for alert method and system resilience, as shown in Table 8. For this model, a daily drive frequency was the reference level. Respondents who reported driving 2–3 times per week had a lower preference for no alert compared to those who drove daily. Respondents who reported never driving had a lower preference for a 5% system resilience level versus daily drivers. However, those who drove 4–6 times per week showed a higher preference for a 5% system resilience rate when compared to daily drivers.

3.3.5. Feature Level Utility by Household Income

Household income level was a significant predictor of feature level selection for both human intervention frequency and alert method, as shown in Table 9. The baseline for this model was respondents with a household income between USD 40,000 and USD 59,999, meaning that each comparison was relative to the USD 40 k–USD 60 k level. In all cases, coefficients were positive for significant variables, suggesting that each group was more likely to prefer the respective feature compared to the reference income group. Specifically, the alert option of no alert was more preferred by those with household earnings between USD 60,000 and USD 79,999 or USD 100,000 and USD 149,999 than the baseline group. Moreover, those with a household income of USD 100,000 to USD 149,999 reported a higher preference for a visual alert system compared to the baseline group.
A point of interest from the income analysis was that the optimized feature list for those reporting a household income of USD 100,000–USD 149,999 varied slightly from the total sample’s optimized feature list. As shown in Table 10, the preferred failure behavior for respondents reporting a USD 100,000–USD 149,999 income range was to have a vibration warning followed by a TOR versus the vehicle bringing itself to a safe stop. All utility values [standardized] for this income group are shown in Figure 3, where the largest utility value within each feature yields the optimal feature list for the group.

3.3.6. Feature Level Utility by Race/Ethnicity

Race/ethnicity also emerged as a significant predictor of feature level selection for human intervention frequency and alert method, as shown in Table 11. The baseline for this model was respondents identifying as White/Non-Latino. Respondents identifying as Hispanic or African American showed a greater preference for a system reliability level of 1000 human interventions per 5-year period versus the baseline group. For the feature of alert method, respondents identifying as Hispanic had a lower preference for no alert compared to the reference group.
Those identifying as Hispanic also had an optimal feature package list that varied slightly from the total sample’s optimized feature list. As shown in Table 12, the preferred system reliability for Hispanic respondents was 100 human interventions per 5-year period versus 1 human intervention per 5-year period for the total sample. Figure 4 illustrates the standardized utilities across each feature for this group.

3.3.7. Feature Level Utility by Marital Status

Marital status was also a significant predictor of feature level selection for human intervention frequency and SDV failure behavior, as shown in Table 13. The baseline for this model was respondents identifying as married. Respondents identifying as single showed greater preference for human intervention frequency levels of 100× and 500× per 5 years compared to married individuals.

3.3.8. Feature Level Utility by Education Level

Education level also significantly predicted feature level selection for human intervention frequency and alert method, as shown in Table 14. The baseline for this model was respondents whose highest completed education level was high school diploma. Respondents with an associate’s degree had a greater preference for a visual warning alert system versus those with a high school diploma. Those with some college completed also showed a higher preference for a system reliability level of 100 times per 5-year period versus the baseline group.

3.3.9. Synthesis of All Predictors

Figure 5 provides an integrated summary of the subgroup analyses, illustrating how demographic and behavioral predictors relate to feature level preferences and highlighting consistent patterns across groups. Independent variable predictors are shown in purple text, and the dependent feature levels are shown in black text. A blue arrow with a positive polarity indicates that the independent variable is a positive predictor, increasing the likelihood of selecting that feature level. Conversely, a red arrow with a negative polarity indicates a negative predictor, decreasing the likelihood of selection.
Feature levels without any significant predictors were excluded from the diagram. These included the following: human interventions (1x in 5 years), failure allowance (10%; 15%), failure behavior (vibration alert + TOR), and alert method (visual alert; audio alert).

3.4. LASSO Analysis

The analysis in the previous section quantified the relative utility of each feature level, allowing comparisons among levels within the same feature. However, that approach was limited in that it did not permit direct comparison of the relative importance of entire features against one another when respondents selected among feature packages. For example, it could not determine whether system reliability mattered more than the method of alerting the driver about a self-driving system failure. To address this limitation, a LASSO analysis was conducted on the conjoint response data. Unlike the utility analysis, LASSO identifies which features and levels meaningfully influenced respondents’ choices and which variables were not retained as significant predictors.
In the analysis, the reference levels of each feature were as follows:
  • Human Interventions: 1× per 5 years;
  • Failure Allowance: 10%;
  • Failure Behavior: vibration alert + TOR;
  • Alert Method: audio alert.
The results of the LASSO analysis are presented in Table 15. Predictors that were shrunk to zero by LASSO are omitted from the table for clarity. The analysis shows that the feature levels with the greatest influence on package selection were human intervention frequency (1000× per 5 years, compared to 1× per 5 years), failure allowances (20% and 5%, compared to 10%), and alert method (no alert, visual alert, and visual + audio alert, compared to audio alert). Negative coefficients indicate that the inclusion of a feature level decreased the likelihood of a package being selected, while positive coefficients indicate that inclusion increased the likelihood of selection. Feature levels not appearing in the table were effectively irrelevant to respondents’ decisions. Notably, all SDV failure behavior levels had coefficients of zero, suggesting they were not important factors in the decision-making process.
The results of the relative feature importance analysis are summarized in Table 16. Among the four attributes, alert type was the most influential factor of choice, accounting for 64.7% of the decision process. This attribute also exhibited the widest coefficient range (1.29), indicating that the difference between the least preferred level (no alert) and the most preferred level (visual + audio) had the greatest effect on respondents’ selections. Failure allowance was the second most important driver, explaining 20.3% of choice decisions, with a more modest range of 0.405 across coefficient levels. Human interventions contributed to 15.0% of the decision process, with a coefficient range of 0.300. Finally, failure behavior was not retained in the LASSO analysis (range = 0, 0% importance), suggesting that respondents were either not influenced by the failure behavior in their choice selections, or were inconsistent in their choices based on failure behavior.
One common concern about LASSO analysis, especially when one strongly dominates, as seen here with the alert method variable, is the potential for coefficient instability due to correlations among predictors. In such cases, LASSO may arbitrarily select among correlated variables or produce unstable coefficient estimates [32,44]. To assess this risk, polychoric correlations among the four predictors were calculated. Pairwise correlations were very low (|r| < 0.02), with the highest correlation observed between human interventions and failure allowance (r = −0.019). These results indicate minimal multicollinearity and thus, low risk of instability in the LASSO coefficient estimates.

4. Discussion

This paper aimed to evaluate which safety features of SDVs most strongly influence consumer preferences and to evaluate how these preferences vary across demographic and behavioral subgroups. Using a combination of conjoint utility analysis, LASSO regression, and generalized linear mixed models, this paper compared the relative importance of system reliability, resilience, failure behavior, and driver alert methods in shaping choice decisions.
When examining subgroup results collectively, several consistent patterns emerged across demographic and behavioral groups. Although some differences were observed, such as higher-income respondents showing greater acceptance of vibration-based alerts, Hispanic respondents preferring moderate intervention frequencies, and single respondents favoring higher intervention rates, the overall hierarchy of feature importance remained stable. Across all subgroups, multimodal alert methods (audio + visual) and high system reliability consistently dominated choice preferences. This consistency suggests that, while demographic and experiential factors influence sensitivity to specific feature levels, perceptions of SDV safety are broadly shaped by a shared emphasis on clear alerts and predictable, reliable system performance.
The observed preference among higher-income respondents for “no alert” options may indicate greater familiarity or comfort with automation technologies. Individuals in this group may be more likely to have experience with advanced driver-assistance systems and thus perceive alerts as redundant or disruptive to the driving experience. Alternatively, this finding could reflect higher trust in system reliability or differing expectations for seamless user interfaces. Future research should explore whether these preferences stem from increased technological exposure, risk perception, or differing attitudes toward driver intervention.
The observed utility values for several feature levels suggest that current SDV technology may fall short of respondents’ expectations. For example, the strong preference for extremely low intervention rates (one intervention per 5-year timeframe) highlights a critical gap between consumer expectations and current SDV performance, as demonstrated by the disengagement rates reported by the California DMV [7]. This finding indicates that additional investments in self-driving system reliability are essential to support continued SDV market pentation.
The most consistent and prominent finding was the dominant influence of driver alert methods. Both the utility estimates and the LASSO regression identified multimodal alerts (visual + audio) as the primary factor driving package selection, accounting for nearly two-thirds of the total decision weight. In contrast, the absence of alerts was strongly disfavored. These results align with the prior literature emphasizing the importance of multimodal takeover request systems [8,9] and suggest that alert design is a higher consumer priority than more complex failure behaviors.
Interestingly, respondents expressed a stated preference for relatively low levels of resilience, with preferences clustering around requiring repairs after as few as 5% of sensor failures. This finding suggests that consumers may prioritize perceived reliability and system transparency over redundancy or fault tolerance. However, these results reflect stated preferences based on hypothetical scenarios rather than observed behavior. Future research incorporating revealed or behavioral data could help determine whether participants would, in practice, tolerate similarly low resilience levels. For manufacturers, this may indicate that investment in redundant hardware provides limited perceptual benefit compared to improving the clarity and responsiveness of alert systems.
One of the most striking findings was that failure behavior was not retained in the LASSO analysis, indicating minimal influence on overall feature set selection. Since this result was unexpected, we reviewed how this feature was presented to respondents. The failure behavior feature prompted participants with “What the vehicle does when self-driving fails,” with three levels: (1) vehicle stops safely, (2) vehicle provides a visual warning to you and you take over driving, and (3) vehicle provides a touch warning (vibration) to you and you take over driving. In the LASSO model, the baseline was set to vibration alert + TOR, against which the other two levels were compared. Given the distinct behavioral differences between a system-commanded stop and a driver takeover, this outcome likely reflects respondents’ prioritization of alert and reliability features over specific failure responses, rather than an effect of question framing or level simplicity.
These findings call into question the potential return on investment for current research focused on more dynamic system failure responses beyond executing a safe stop [10,11]. From the consumer perspective, a simple and predicable safe stop response may be sufficient. Instead, factors such as driver alert methods (accounting for 64.7% of package selections in the experiment), sensor failure allowance (20.3%), and system reliability (15%) had a greater impact on consumer preferences. These results provide insight into what features should receive the most investment and attention from current and future SDV manufacturers. Looking ahead, however, advances in artificial intelligence (AI) and machine learning (ML) are likely to reshape how reliability and resilience are achieved in SDV design, potentially altering both technical priorities and consumer expectations.
For example, recent AI and ML innovations enable predictive maintenance, real-time anomaly detection, and adaptive fault-tolerance architectures that allow vehicles to reconfigure control pathways or sensor inputs when faults occur. Such advances could result in self-healing or self-calibrating systems that maintain safe operation under degraded conditions. As these technologies mature, consumer preferences may shift away from static measures of reliability (e.g., low disengagement rates) toward dynamic capabilities such as predictive diagnostics and autonomous fault management. Future research should therefore examine how awareness of AI-driven reliability and resilience improvements may influence stated and observed preferences for SDV safety features.
In parallel with these technological developments, advances in reliability and resilience modeling are also reshaping how such capabilities are conceptualized and evaluated. Recent work by Pan et al. [45] highlights the growing importance of reliability and resilience modeling frameworks for autonomous vehicle systems, emphasizing hybrid approaches that integrate probabilistic failure modeling with adaptive control strategies to improve system robustness. These modeling insights complement the findings of this study by underscoring the need for consumer-focused reliability metrics to align with technically grounded reliability and resilience architectures.
While this paper has provided several insights into feature preferences for SDVs, there are limitations with the data collection method that should be noted. First, data for this study was collected via an online survey, and this method has several inherent limitations. Specifically, not all members of the population were reachable via online surveys, and there were members of the population who were unwilling to respond to online surveys. Additionally, only registered Prolific survey takers were given the opportunity to respond to the survey, further limiting the potential respondent pool. Future work could benefit from using additional methods to obtain survey responses, including phone surveys using both mobile and landline numbers or in-person survey data collection. Additionally, future research could also benefit from comparing the stated preferences captured in this survey with observed preferences. Observed preferences could be measured using driving simulators in which various error rates, methods of alert, and failure behaviors are simulated. Then, respondents could be asked to rank the simulated capabilities according to their preferences or be evaluated objectively through driving performance measures such as takeover time.

5. Conclusions

Overall, this study demonstrates that consumer preferences for self-driving vehicle safety features are driven primarily by driver alert methods and system reliability, with resilience and failure behavior playing comparatively minor roles. Across the sample, multimodal alerts (audio + visual) emerged as the dominant factor, followed by a strong preference for extremely low rates of required human intervention. In contrast, complex failure behaviors had little influence on choice decisions, suggesting that predictable safe-stop responses are sufficient from a consumer perspective.
Although demographic and behavioral factors shaped some subgroup preferences, the predominance of alerts and reliability remained consistent across groups. For SDV manufacturers, these findings highlight the importance of prioritizing intuitive, multimodal driver alert systems and dramatic improvements in reliability, while recognizing that investments in redundant sensor systems or sophisticated fallback behaviors may yield limited returns in terms of consumer acceptance. For policymakers and regulators, these results provide insight into the alert methods, system reliability, and system resilience feature levels that the consumers are most likely to support as regulatory standards for future SDV designs.

Author Contributions

Conceptualization, E.S. and E.E.G.; methodology, E.S. and E.E.G.; software, E.S.; validation, E.S. and E.E.G.; formal analysis, E.S.; investigation, E.S.; resources, E.E.G.; data curation, E.S. and E.E.G.; writing—original draft preparation, E.S.; writing—review and editing, E.E.G.; visualization, E.S. and E.E.G.; supervision, E.E.G.; project administration, E.S. and E.E.G. All authors have read and agreed to the published version of the manuscript.

Funding

This research received no external funding.

Institutional Review Board Statement

The study was conducted in accordance with the Declaration of Helsinki and approved by the Institutional Review Board of Colorado State University (protocol code 5825, approved 21 May 2024).

Informed Consent Statement

Informed consent was obtained from all subjects involved in this survey study.

Data Availability Statement

The data presented in this study are available on request from the corresponding author due to privacy restrictions.

Conflicts of Interest

The authors declare no conflicts of interest.

Abbreviations

The following abbreviations are used in this manuscript:
GRiPSGeneral Risk Propensity Scale
GLMMGeneralized Linear Mixed Model
HEVHybrid Electric Vehicle
IRBInstitutional Review Board
LASSOLeast Absolute Shrinkage and Selection Operator
SDVSelf-Driving Vehicle
TORTakeover Request
TSRTraffic Sign Recognition
WTPWillingness to Pay

Appendix A

This appendix describes the construction of the conjoint experiment using the Qualtrics conjoint analysis tool and the instructions provided to survey respondents. Figure A1, Figure A2, Figure A3 and Figure A4 display the feature names and levels used in the experiment. Figure A5 shows the instructions and detailed descriptions of each feature provided to the respondents. Figure A6 shows an example of the conjoint feature sets presented during the survey.
Figure A1. Feature name and levels presented to respondents for “Human Interventions”.
Futuretransp 05 00164 g0a1
Figure A2. Feature name and levels presented to respondents for “Sensor Resilience”.
Futuretransp 05 00164 g0a2
Figure A3. Feature name and levels presented to respondents for “Failure Behavior”.
Futuretransp 05 00164 g0a3
Figure A4. Feature name and levels presented to respondents for “Alert Method”.
Futuretransp 05 00164 g0a4
Figure A5. Screen capture of initial instruction statement for Conjoint experiment.
Futuretransp 05 00164 g0a5
Figure A6. Screen capture of example Conjoint experiment choice set.
Futuretransp 05 00164 g0a6

References

  1. Kim, J.H.; Lee, G.; Lee, J.; Yuen, K.F.; Kim, J. Determinants of personal concern about autonomous vehicles. Cities 2022, 120, 103462. [Google Scholar] [CrossRef]
  2. Wang, J.; Zhang, L.; Huang, Y.; Zhao, J. Safety of autonomous vehicles. J. Adv. Transp. 2020, 2020, 8867757. [Google Scholar] [CrossRef]
  3. Lee, D.; Hess, D.J. Public concerns and connected and automated vehicles: Safety, privacy, and data security. Soc. Sci. Commun. 2022, 9, 90. [Google Scholar] [CrossRef]
  4. Li, J.; Liu, J.; Wang, X.; Liu, L. Investigating the factors influencing user trust and driving performance in level 3 automated driving from the perspective of perceived benefits. Transp. Res. Part F Traffic Psychol. Behav. 2024, 105, 58–72. [Google Scholar] [CrossRef]
  5. Fink, P.D.S.; Brown, J.R.; Kutzer, K.M.; Giudice, N.A. Does trust even matter? Behavioral evidence for the disconnect between people’s subjective trust and decisions to use autonomous vehicles. Transp. Res. Part F Traffic Psychol. Behav. 2025, 114, 99–117. [Google Scholar] [CrossRef]
  6. Lee, Y.C.; Hand, S.H.; Lilly, H. Are parents ready to use autonomous vehicles to transport children? Concerns and safety features. J. Saf. Res. 2020, 72, 287–297. [Google Scholar] [CrossRef]
  7. Kohanpour, E.; Davoodi, S.R.; Shaaban, K. Trends in autonomous vehicle performance: A comprehensive study of disengagements and mileage. Future Transp. 2025, 5, 38. [Google Scholar] [CrossRef]
  8. Tan, X.; Zhang, Y. Driver Situation Awareness for Regaining Control from Conditionally Automated Vehicles: A Systemic Review of Empirical Studies. Hum. Factors 2025, 67, 367–403. [Google Scholar] [CrossRef]
  9. Deng, H.; Xiang, G.; Pan, J.; Wu, X.; Fan, C.; Wang, K.; Peng, Y. How to design driver takeover request in real-world scenarios: A systematic review. Transp. Res. Part F Traffic Psychol. Behav. 2024, 104, 411–432. [Google Scholar] [CrossRef]
  10. Mature-Peaspan, J.A.; Perez, J.; Zubizarreta, A. A Fail-Operational Control Architecture Approach and dead-reckoning strategy in case of positioning failures. Sensors 2020, 20, 442. [Google Scholar] [CrossRef]
  11. Lee, C.; An, D. Decision-making in fallback scenarios for autonomous vehicles: Deep reinforcement learning approach. Appl. Sci. 2023, 13, 12258. [Google Scholar] [CrossRef]
  12. Kang, C.; Lee, C.; Zhao, X.; Daeho Lee, D.; Shin, J.; Lee, J. Safety still matters: Unveiling the value propositions of augmented reality head-up displays in autonomous vehicles through conjoint analysis. Travel Behav. Soc. 2025, 39, 100915. [Google Scholar] [CrossRef]
  13. Nickkar, A.; Lee, Y.-J. Willingness to pay for advanced safety features in vehicles: An adaptive choice-based conjoint analysis approach. Transp. Res. Rec. J. Transp. Res. Board 2022, 2676, 173–185. [Google Scholar] [CrossRef]
  14. Pronay, S.; Lukovics, M.; Ujhazi, T. Teenage dreams of self-driving cars: Findings of a UTAUT-based conjoint analysis among the 14–19 age group. Transp. Res. Interdiscip. Perspect. 2025, 29, 101304. [Google Scholar] [CrossRef]
  15. Stewart, E.; Gallegos, E. What would I see in court? A survey analysis of who Americans would blame for self-driving vehicle crashes and traffic violations. Int. Counc. Syst. Eng. Int. Symp. 2025, 35, 736–759. [Google Scholar] [CrossRef]
  16. Xhang, D.; Highhouse, S.; Nye, C.D. Development and validation of the General Risk Propensity Scale (GRiPS). J. Behav. Decis. Mak. 2019, 32, 152–167. [Google Scholar] [CrossRef]
  17. Getting Started with Conjoint Projects. Available online: https://www.qualtrics.com/support/conjoint-project/getting-started-conjoints/getting-started-choice-based/getting-started-with-conjoint-projects/ (accessed on 21 August 2025).
  18. Silaen, R.V.; Windasari, N.A. Customer preference analysis on attributes of hybrid electric vehicle: A choice-based conjoint approach. Int. J. Curr. Sci. Res. Rev. 2022, 5, 4704–4713. [Google Scholar] [CrossRef]
  19. Li, W.; Yamamoto, T.; Guan, H.; Han, Y. Assessing consumer preferences for hydrogen fuel cell vehicles: A conjoint analysis approach across multiple cities in China. Int. J. Hydrogen Energy 2024, 80, 1210–1222. [Google Scholar] [CrossRef]
  20. Min, J.; Hong, Y.; King, C.B.; Meeker, W.Q. Reliability analysis of artificial intelligence systems using recurrent events data from autonomous vehicles. J. R. Stat. Soc. Ser. C Appl. Stat. 2022, 71, 987–1013. [Google Scholar] [CrossRef]
  21. Bas Kaman, F.; Olmus, H. Statistical approaches used in studies evaluating the reliability of autonomous vehicles based on disengagements and reaction times. Int. J. Automot. Sci. Technol. 2024, 8, 279–287. [Google Scholar] [CrossRef]
  22. Khattak, Z.H.; Fontaine, M.D.; Smith, B.L. Exploratory investigation of disengagements and crashes in autonomous vehicles under mixed traffic: An endogenous switching regime framework. IEEE Trans. Intell. Transp. Syst. 2021, 22, 7485–7495. [Google Scholar] [CrossRef]
  23. de Bekker-Grob, E.W.; Donkers, B.; Jonker, M.F.; Vleggeert-Paulus, M.A. Sample size requirements for discrete-choice experiments in Healthcare: A practical guide. Pract. Appl. 2015, 8, 373–384. [Google Scholar] [CrossRef]
  24. Conjoint Analysis Technical Overview. Available online: https://www.qualtrics.com/support/conjoint-project/getting-started-conjoints/getting-started-choice-based/conjoint-analysis-white-paper/ (accessed on 14 September 2025).
  25. Lesaffre, E.; Lawson, A.B. Bayesian Biostatistics; John Wiley & Sons: Hoboken, NJ, USA, 2012; pp. 46–81. [Google Scholar]
  26. Pérez-Millan, A.; Contador, J.; Tudela, R.; Ninerola-Baizan, A.; Setoain, X.; Llado, A.; Sanchez-Valle, R.; Sala-Llonch, R. Evaluating the performance of Bayesian and frequentist approaches for longitudinal modeling: Application to Alzheimer’s disease. Sci. Rep. 2022, 12, 14448. [Google Scholar] [CrossRef]
  27. Le, B.V.Q.; Nguyen, A.; Richter, O.; Nguyen, T.T. Comparison of frequentist and Bayesian generalized linear models for analyzing the effects of fungicide treatments on the growth and mortality of piper nigrum. Agronomy 2021, 11, 2524. [Google Scholar] [CrossRef]
  28. Flores, R.D.; Sanders, C.A.; Duran, S.X.; Bishop-Chrzanowski, B.M.; Oyler, D.L.; Shim, H.; Clocksin, H.E.; Miller, A.P.; Merkle, E.C. Before/after Bayes: A comparison of frequentist and Bayesian mixed-effects models in applied psychological research. Br. J. Psychol. 2022, 113, 1164–1194. [Google Scholar] [CrossRef]
  29. Bhat, C.R.; Castelar, S. A unified mixed logit framework for modeling revealed and stated preferences: Formulation and application to congestion pricing analysis in the San Francisco Bay area. Transp. Res. Part B Methodol. 2002, 36, 593–616. [Google Scholar] [CrossRef]
  30. Matuschek, H.; Kliegl, R.; Vasishth, S.; Baayen, H.; Bates, D. Balancing type I error and power in linear mixed models. J. Mem. Lang. 2017, 94, 305–315. [Google Scholar] [CrossRef]
  31. McCulloch, C.E.; Neuhaus, J.M. Misspecifying the shape of a random effects distribution: Why getting it wrong may not matter. Stat. Sci. 2011, 26, 388–402. [Google Scholar] [CrossRef]
  32. Tibshirani, R. Regression Shrinkage and Selection Via the Lasso. J. R. Stat. Soc. Ser. B (Methodol.) 1996, 58, 267–288. [Google Scholar] [CrossRef]
  33. Zou, H. The adaptive Lasso and its oracle properties. J. Am. Stat. Assoc. 2006, 101, 1418–1429. [Google Scholar] [CrossRef]
  34. Desboulets, L.D.D. A review of variable selection in regression analysis. Econometrics 2018, 4, 45. [Google Scholar] [CrossRef]
  35. Archsmith, J.; Muehlegger, E.; Rapson, D.S. Future paths of electric vehicle adoption in the United States: Predictable determinants, obstacles, and opportunities. Environ. Energy Policy Econ. 2022, 3, 71–110. [Google Scholar] [CrossRef]
  36. Filip, M. Electric vehicles and consumer choices. Renew. Sustain. Energy Rev. 2021, 142, 110874. [Google Scholar] [CrossRef]
  37. American Community Survey: S0101 Age and Gender. Available online: https://data.census.gov/table/ACSST1Y2022.S0101?q=Gender%20identity (accessed on 10 November 2024).
  38. American Community Survey: S1201 Marital Status. Available online: https://data.census.gov/table?q=Marital%20Status (accessed on 10 November 2024).
  39. American Community Survey: S1501 Educational Attainment. Available online: https://data.census.gov/table/ACSST1Y2022.S1501?q=Educational%20Attainment (accessed on 10 November 2024).
  40. American Community Survey: S1901 Income in the Past 12 Months (in 2022 Inflation-Adjusted Dollars). Available online: https://data.census.gov/table/ACSST1Y2022.S1901?q=Household%20income (accessed on 10 November 2024).
  41. Decennial Census: DP1 Profile of General Population and Housing Characteristics. Available online: https://data.census.gov/table?g=010XX00US&d=DEC+Demographic+Profile (accessed on 10 November 2024).
  42. National Population by Characteristics: 2020–2024. Available online: https://www.census.gov/data/tables/time-series/demo/popest/2020s-national-detail.html (accessed on 19 October 2025).
  43. Green, P.E.; Srinivasan, V. Conjoint analysis in marketing: New developments with implications for research and practice. J. Mark. 1990, 54, 3–19. [Google Scholar] [PubMed]
  44. Hebiri, M.; Lederer, J. How correlations influence Lasso prediction. IEEE Trans. Inf. Theory 2013, 59, 1846–1854. [Google Scholar]
  45. Pan, F.; Zhang, Y.; Liu, J.; Head, L.; Elli, M.; Alvarez, I. Reliability modeling for perception systems in autonomous vehicles: A recursive event-triggering point process approach. Transp. Res. Part C Emerg. Technol. 2024, 169, 104868. [Google Scholar] [CrossRef]
Figure 1. Feature importance with 95% CIs for the four features across total respondent population.
Futuretransp 05 00164 g001
Figure 2. Standardized utility values with 95% CIs for SDV features across sample population.
Futuretransp 05 00164 g002
Figure 3. Standardized utility values with 95% CIs for SDV features for USD 100 k–USD 149,999 income.
Futuretransp 05 00164 g003
Figure 4. Standardized utility values with 95% CIs for SDV features for Hispanic respondents.
Futuretransp 05 00164 g004
Figure 5. Visualization of significant predictors of feature preference across all subgroups.
Futuretransp 05 00164 g005
Table 2. Sensitivity analysis results determining sample size.
Effect Size
δ
Odds
Ratio
Required N
(80% Power)
Power for
N = 403
Power at Effective
N = 282
0.21.2219697%95%
0.31.358799+%99+%
0.51.653199+%99+%
Table 3. Respondent pool demographics compared to US Census data.
Demographic FactorSurvey SampleU.S. Census (%)
GenderMale (48.88%)49.58
Female (49.13%)50.42
Non-Binary/Other (1.74%)N/A
Prefer Not to Answer (0.25%)N/A
Race/EthnicityHispanic/Latino (13.65%)18.7
African American (13.9%)12.4
White/Non-Latino (60.55%)61.6
Asian (5.96%)6.0
Pacific Islander (0.25%)0.20
Native American/Alaskan Native (0.99%)1.10
Other (3.97%)8.4
Prefer Not to Answer (0.74%)N/A
Marital StatusSingle (41.69%)36.0
Married (44.42%)48.0
Divorced (9.93%)10.5
Widow/Widower (2.98%)5.5
Prefer Not to Answer (0.99%)N/A
EducationLess Than High School (0%)10.4
High School Diploma (14.14%)26.1
Some College (22.58%)19.1
Associate’s Degree (12.90%)8.8
Bachelor’s Degree (39.49%)21.6
Graduate Degree (15.85%)14.0
Household IncomeLess Than USD 10,000 (9.93%)5.5
USD 10,000–USD 49,999 (31.76%)28.5
USD 50,000–USD 99,999 (35.23%)29.0
USD 100,000–USD 149,999 (14.14%)16.9
More than USD 150,000 (12.90%)20.20
Age15 to 19 Years (1.97%)6.56
20 to 24 Years (10.10%)6.48
25 to 29 Years (9.85%)6.75
30 to 34 Years (7.64%)6.94
35 to 39 Years (9.11%)6.69
40 to 44 Years (7.39%)6.39
45 to 49 Years (8.87%)6.03
50 to 54 Years (7.14%)6.26
55 to 59 Years (16.50%)6.41
60 to 64 Years (10.84%)6.42
65 to 69 Years (4.43%)5.52
70 to 74 Years (4.93%)4.50
75 to 79 Years (1.23%)3
Table 4. Optimal feature package values for total respondent population.
FeatureOptimal Package Value
Human Interventions1× per 5-years
Failure Allowance5%
Failure BehaviorVehicle Stops Safely
Alert MethodAudio & Visual Alert
Table 5. Feature level preference by willingness to pay amount for SDV functionality.
WTP by
Automation Level
FeatureLevelCoeffp-Value
Full Self-DriveHuman Interventions100× per 5 years−7.29 × 10⁻⁵<0.001
Full Self-DriveHuman Interventions1000× per 5 years−1.51 × 10⁻⁴<0.001
Full Self-DriveHuman Interventions500× per 5 years−8.81 × 10⁻⁵<0.001
Driver AssistHuman Interventions100× per 5 years1.13 × 10−40.041
Driver AssistHuman Interventions1000× per 5 years2.53 × 10−4<0.001
Driver AssistHuman Interventions500× per 5 years1.68 × 10−40.002
Driver AssistFailure Allowance15%1.87 × 10⁻⁴<0.001
Table 6. Feature level preference by impact of advertising.
VariableFeatureLevelCoeff.p-Value
Impact of
Advertising Score
Human
Interventions
1000× per 5 years−0.080.040
Table 7. Feature level preference by risk score.
VariableFeatureLevelCoeff.p-Value
Risk ScoreAlert MethodAudio & Visual0.0270.013
Table 8. Feature level preference by drive frequency.
Drive FrequencyFeatureLevelCoeff.p-Value
2–3× per weekAlert MethodNo Alert−0.500.048
NeverFailure Allowance5%−0.770.012
4–6× per weekFailure Allowance5%0.460.043
Table 9. Feature level preference by income group.
Income LevelFeatureLevelCoeff.p-Value
$60 k–$79,999Alert MethodNo Alert0.790.007
$100 k–$149,999Alert MethodNo Alert0.740.014
$100 k–$149,999Alert MethodVisual Alert0.710.014
Table 10. Optimal feature package values for income group USD 100,000–USD 149,999.
FeatureIncome $100,000–144,999Entire Sample
Human Interventions1× per 5 years1× per 5 years
Failure Allowance5%5%
Failure BehaviorVibration Alert + TORVehicle Stops Safely
Alert MethodAudio & Visual AlertAudio & Visual Alert
Table 11. Feature level preference by race/ethnicity.
Race/EthnicityFeatureLevelCoeff.p-Value
African AmericanHuman Interventions1000× per 5 years0.560.028
HispanicHuman Interventions1000× per 5 years0.720.015
HispanicAlert MethodNo Alert−1.000.002
Table 12. Optimal feature package values for Hispanic respondents.
FeatureHispanic RespondentsEntire Sample
Human Interventions100× per 5 years1× per 5 years
Failure Allowance5%5%
Failure BehaviorVehicle Stops SafelyVehicle Stops Safely
Alert MethodAudio & Visual AlertAudio & Visual Alert
Table 13. Feature level preference by marital status.
Marital StatusFeatureLevelCoeff.p-Value
SingleHuman Interventions100× per 5 years0.650.033
SingleHuman Interventions500× per 5 years0.830.006
Table 14. Feature level preference by education level.
Education LevelFeatureLevelCoeff.p-Value
Associate’s DegreeAlert MethodVisual Warning0.580.043
Some CollegeHuman Interventions100× per 5 years0.800.006
Table 15. LASSO coefficients and odds ratios for non-zero feature levels.
FeatureLevelCoeff.Odds Ratio
Human Interventions1000× per 5 years−0.300.74
Failure Allowance20%−0.190.83
Failure Allowance5%0.221.24
Alert MethodNo Alert−0.880.41
Alert MethodVisual & Audio0.411.50
Alert MethodVisual−0.050.95
Table 16. Relative feature importance values from LASSO.
FeatureCoefficient RangeRelative Importance (%)
Human Interventions0.30015.0
Failure Allowance0.40520.3
Failure Behavior00
Alert Type1.2964.7
Disclaimer/Publisher’s Note: The statements, opinions and data contained in all publications are solely those of the individual author(s) and contributor(s) and not of MDPI and/or the editor(s). MDPI and/or the editor(s) disclaim responsibility for any injury to people or property resulting from any ideas, methods, instructions or products referred to in the content.