Reliability, Resilience, and Alerts: Preferences for Autonomous Vehicles in the United States
Abstract
1. Introduction
- Which SDV safety features most strongly influence consumer preference?
- How do these preferences vary across demographic and behavioral subgroups?
- How can an integrated conjoint–LASSO–GLMM framework improve the interpretability and robustness of feature level preference estimation compared to traditional methods?
2. Materials and Methods
2.1. Demographics and Self-Reported Attributes
2.1.1. Demographics
2.1.2. Willingness to Pay (WTP) for SDVs
2.1.3. Driving Frequency
2.1.4. Advertising Impact on SDV Manufacturer Blame Assignment
- Vehicle manufacturer would be more to blame for the accident [scored as +1];
- Vehicle manufacturer would have the same level of blame for the accident [scored as 0];
- Vehicle manufacturer would be less to blame for the accident [scored as −1].
2.1.5. Risk Profile
2.2. Choice-Based Conjoint Analysis
2.2.1. Conjoint Analysis Features and Feature Levels
- Human Interventions (4 options)—Total number of times within a five-year period that a driver must take over the self-driving functionality, representing reliability.
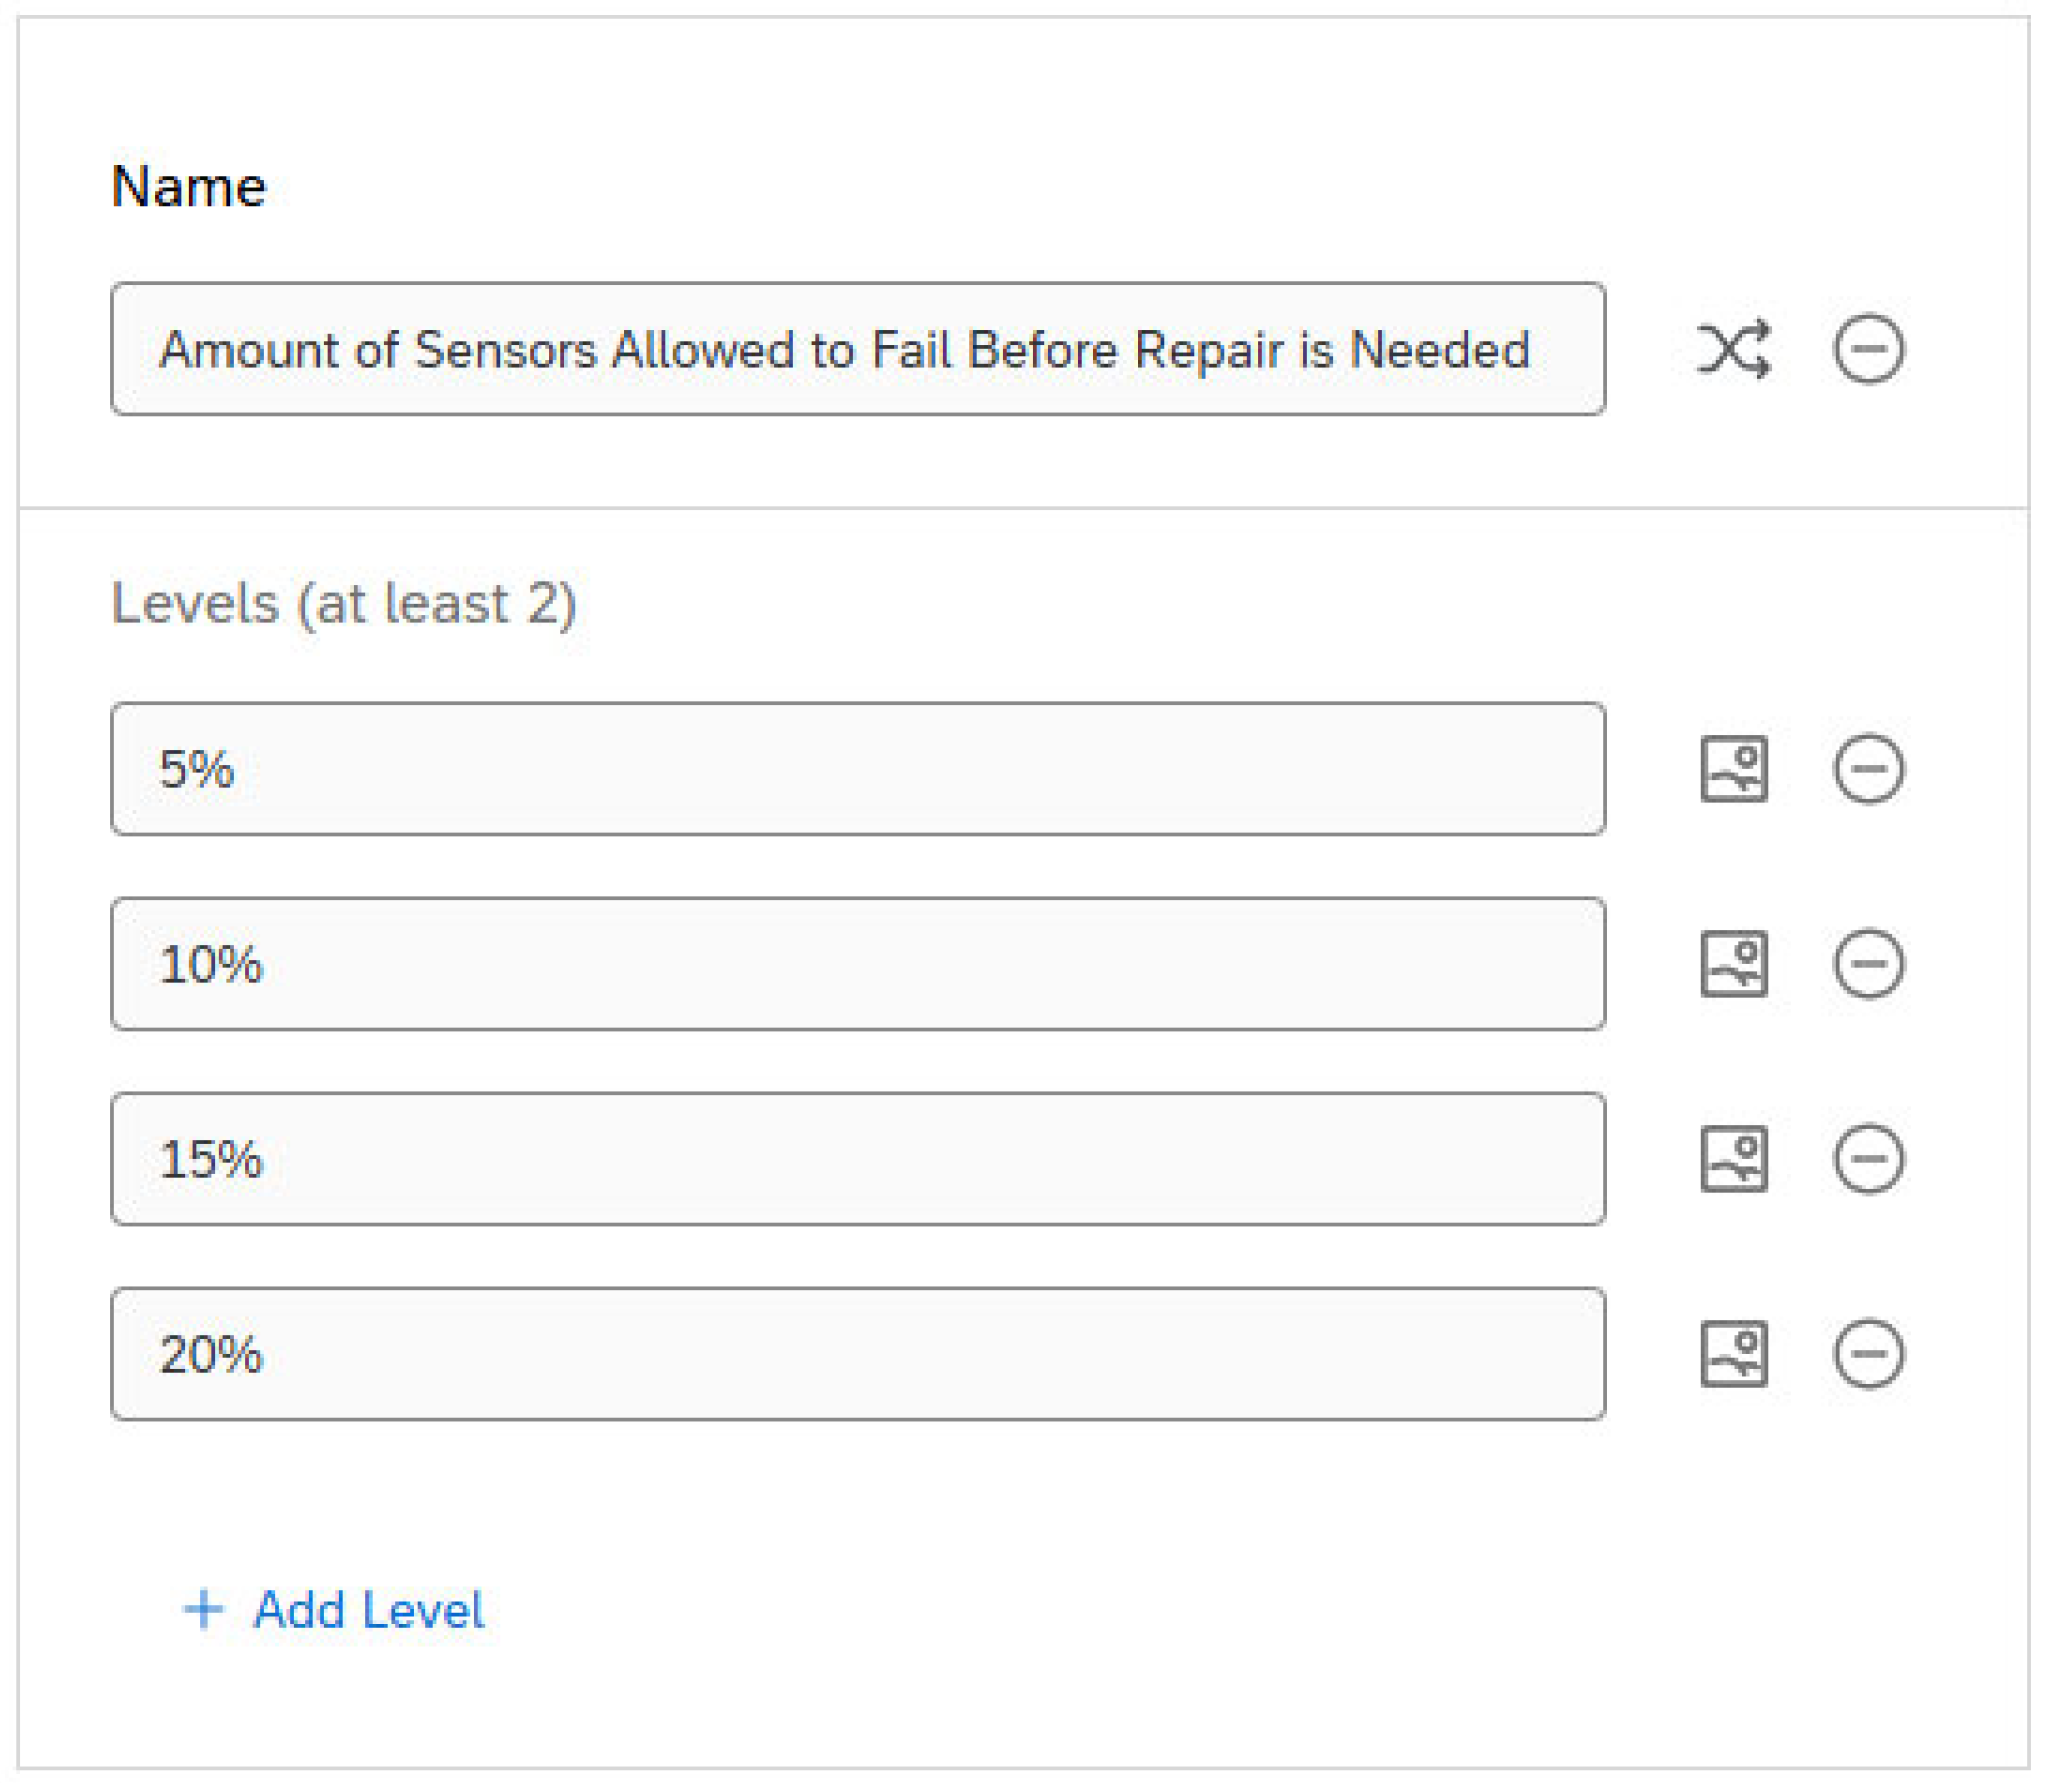
- Failure Allowance (4 options)—Portion of sensors, as a percentage of the total sensors needed for the self-driving system, that are allowed to fail before the system is no longer capable of self-driving, representing resilience.
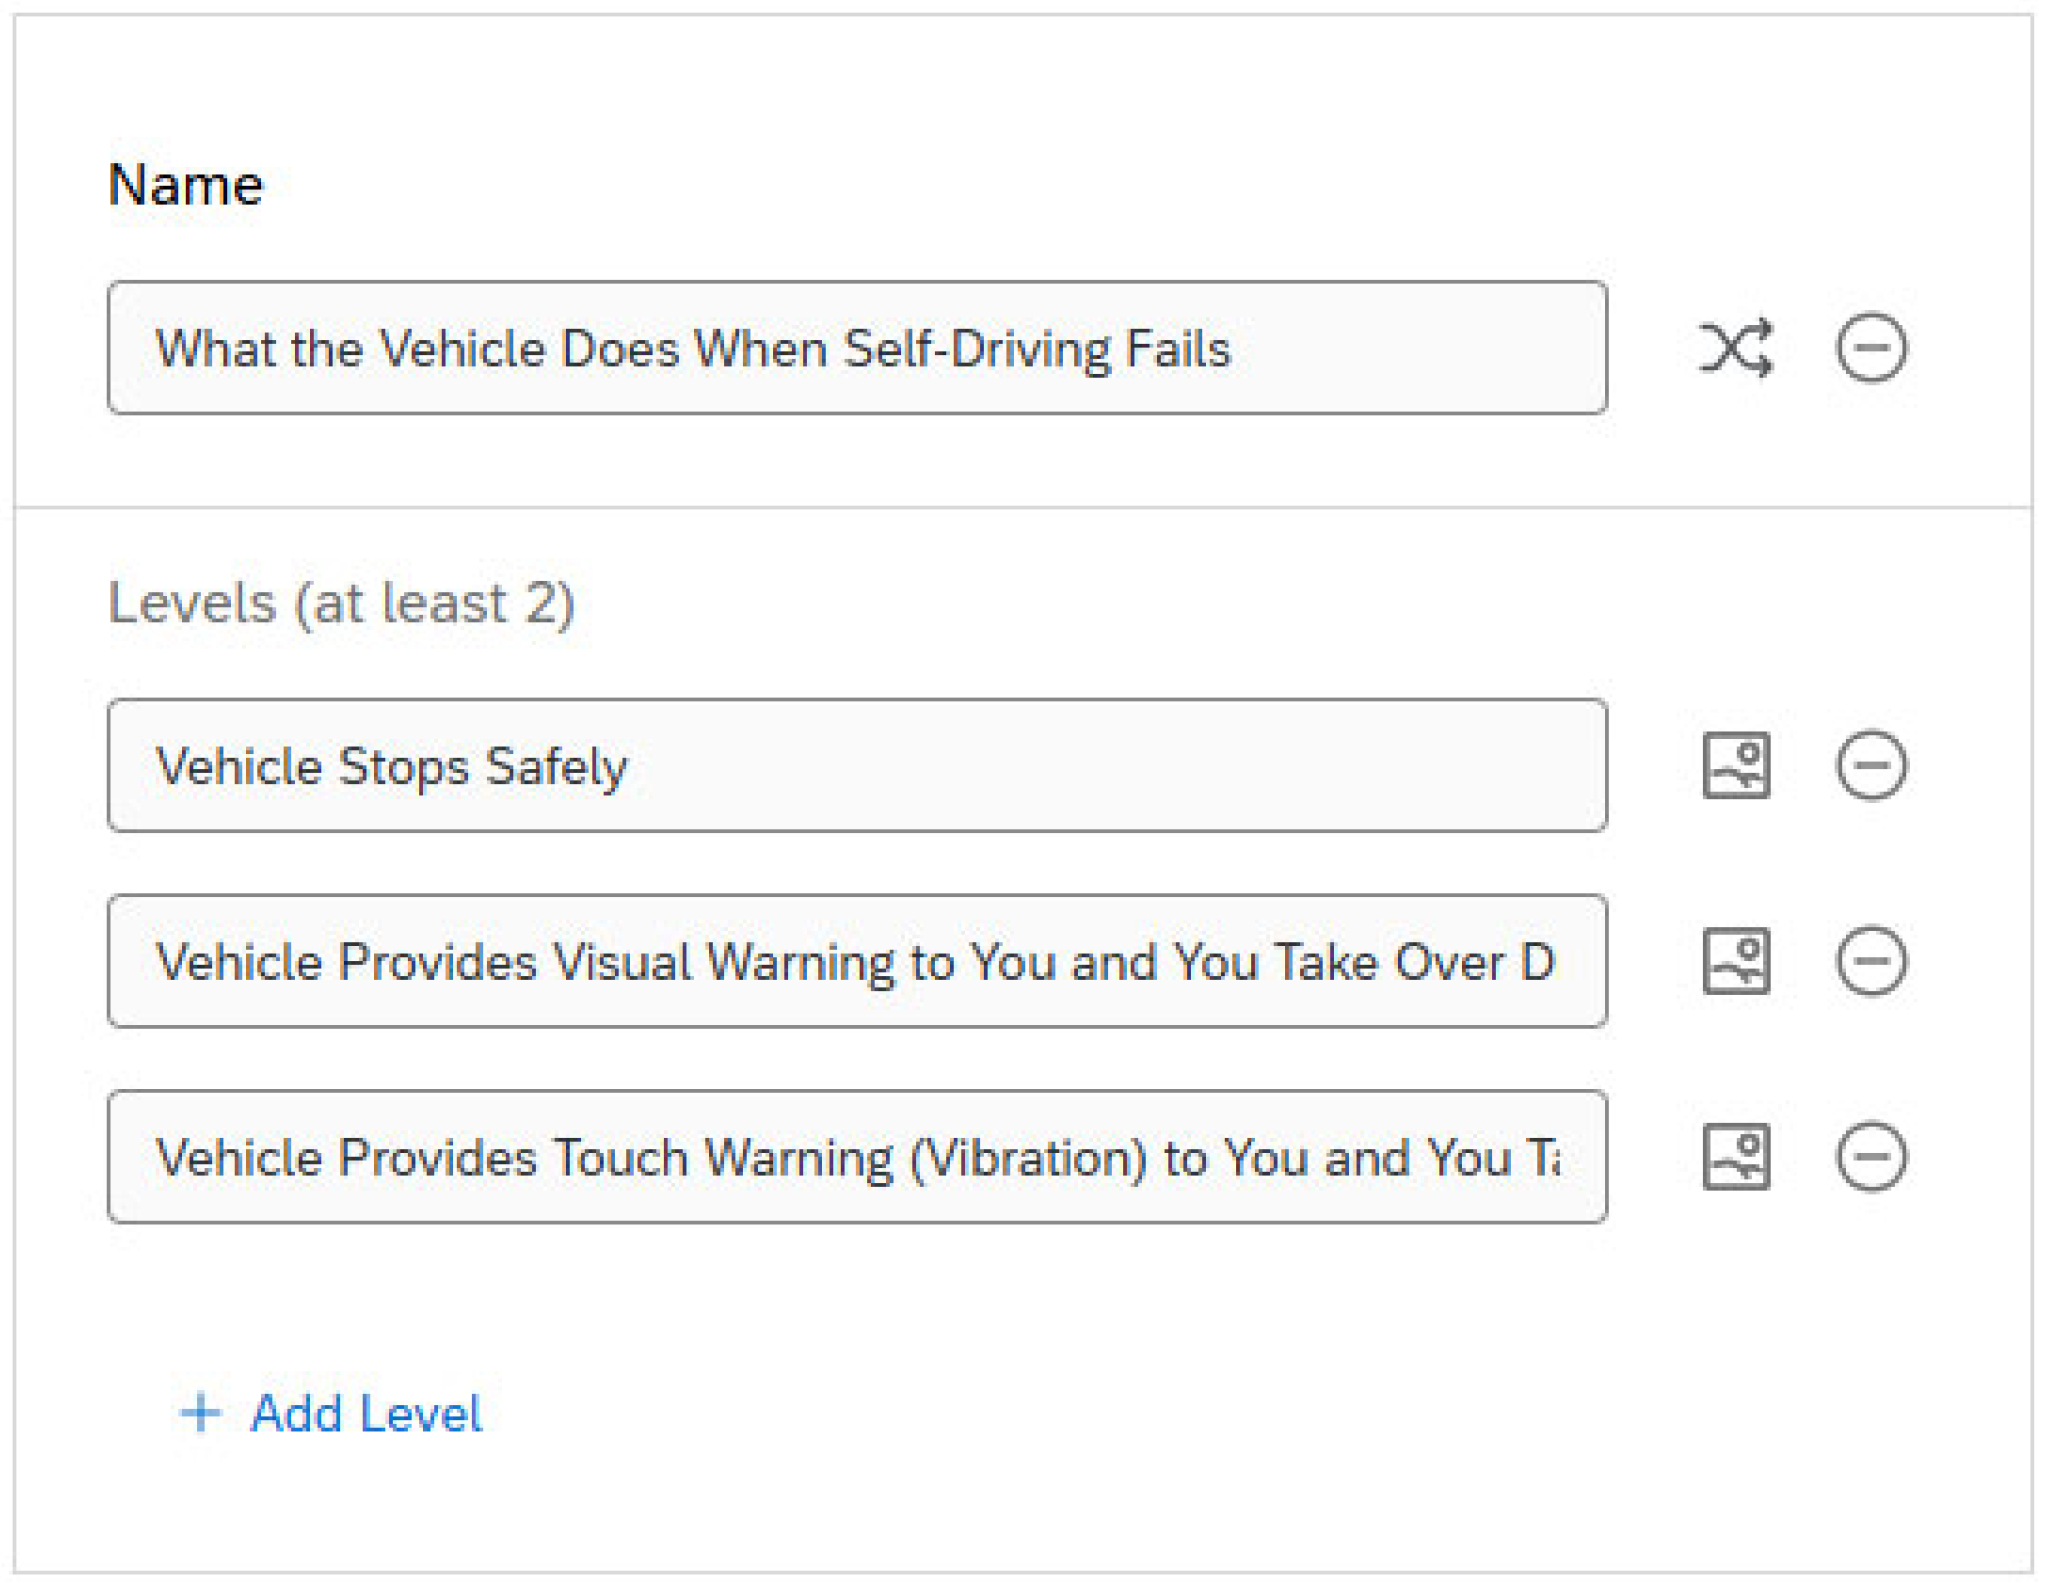
- Failure Behavior (3 options)—Action the vehicle takes when the self-driving system has encountered an error that requires a transfer of control from the self-driving system back to the human driver.
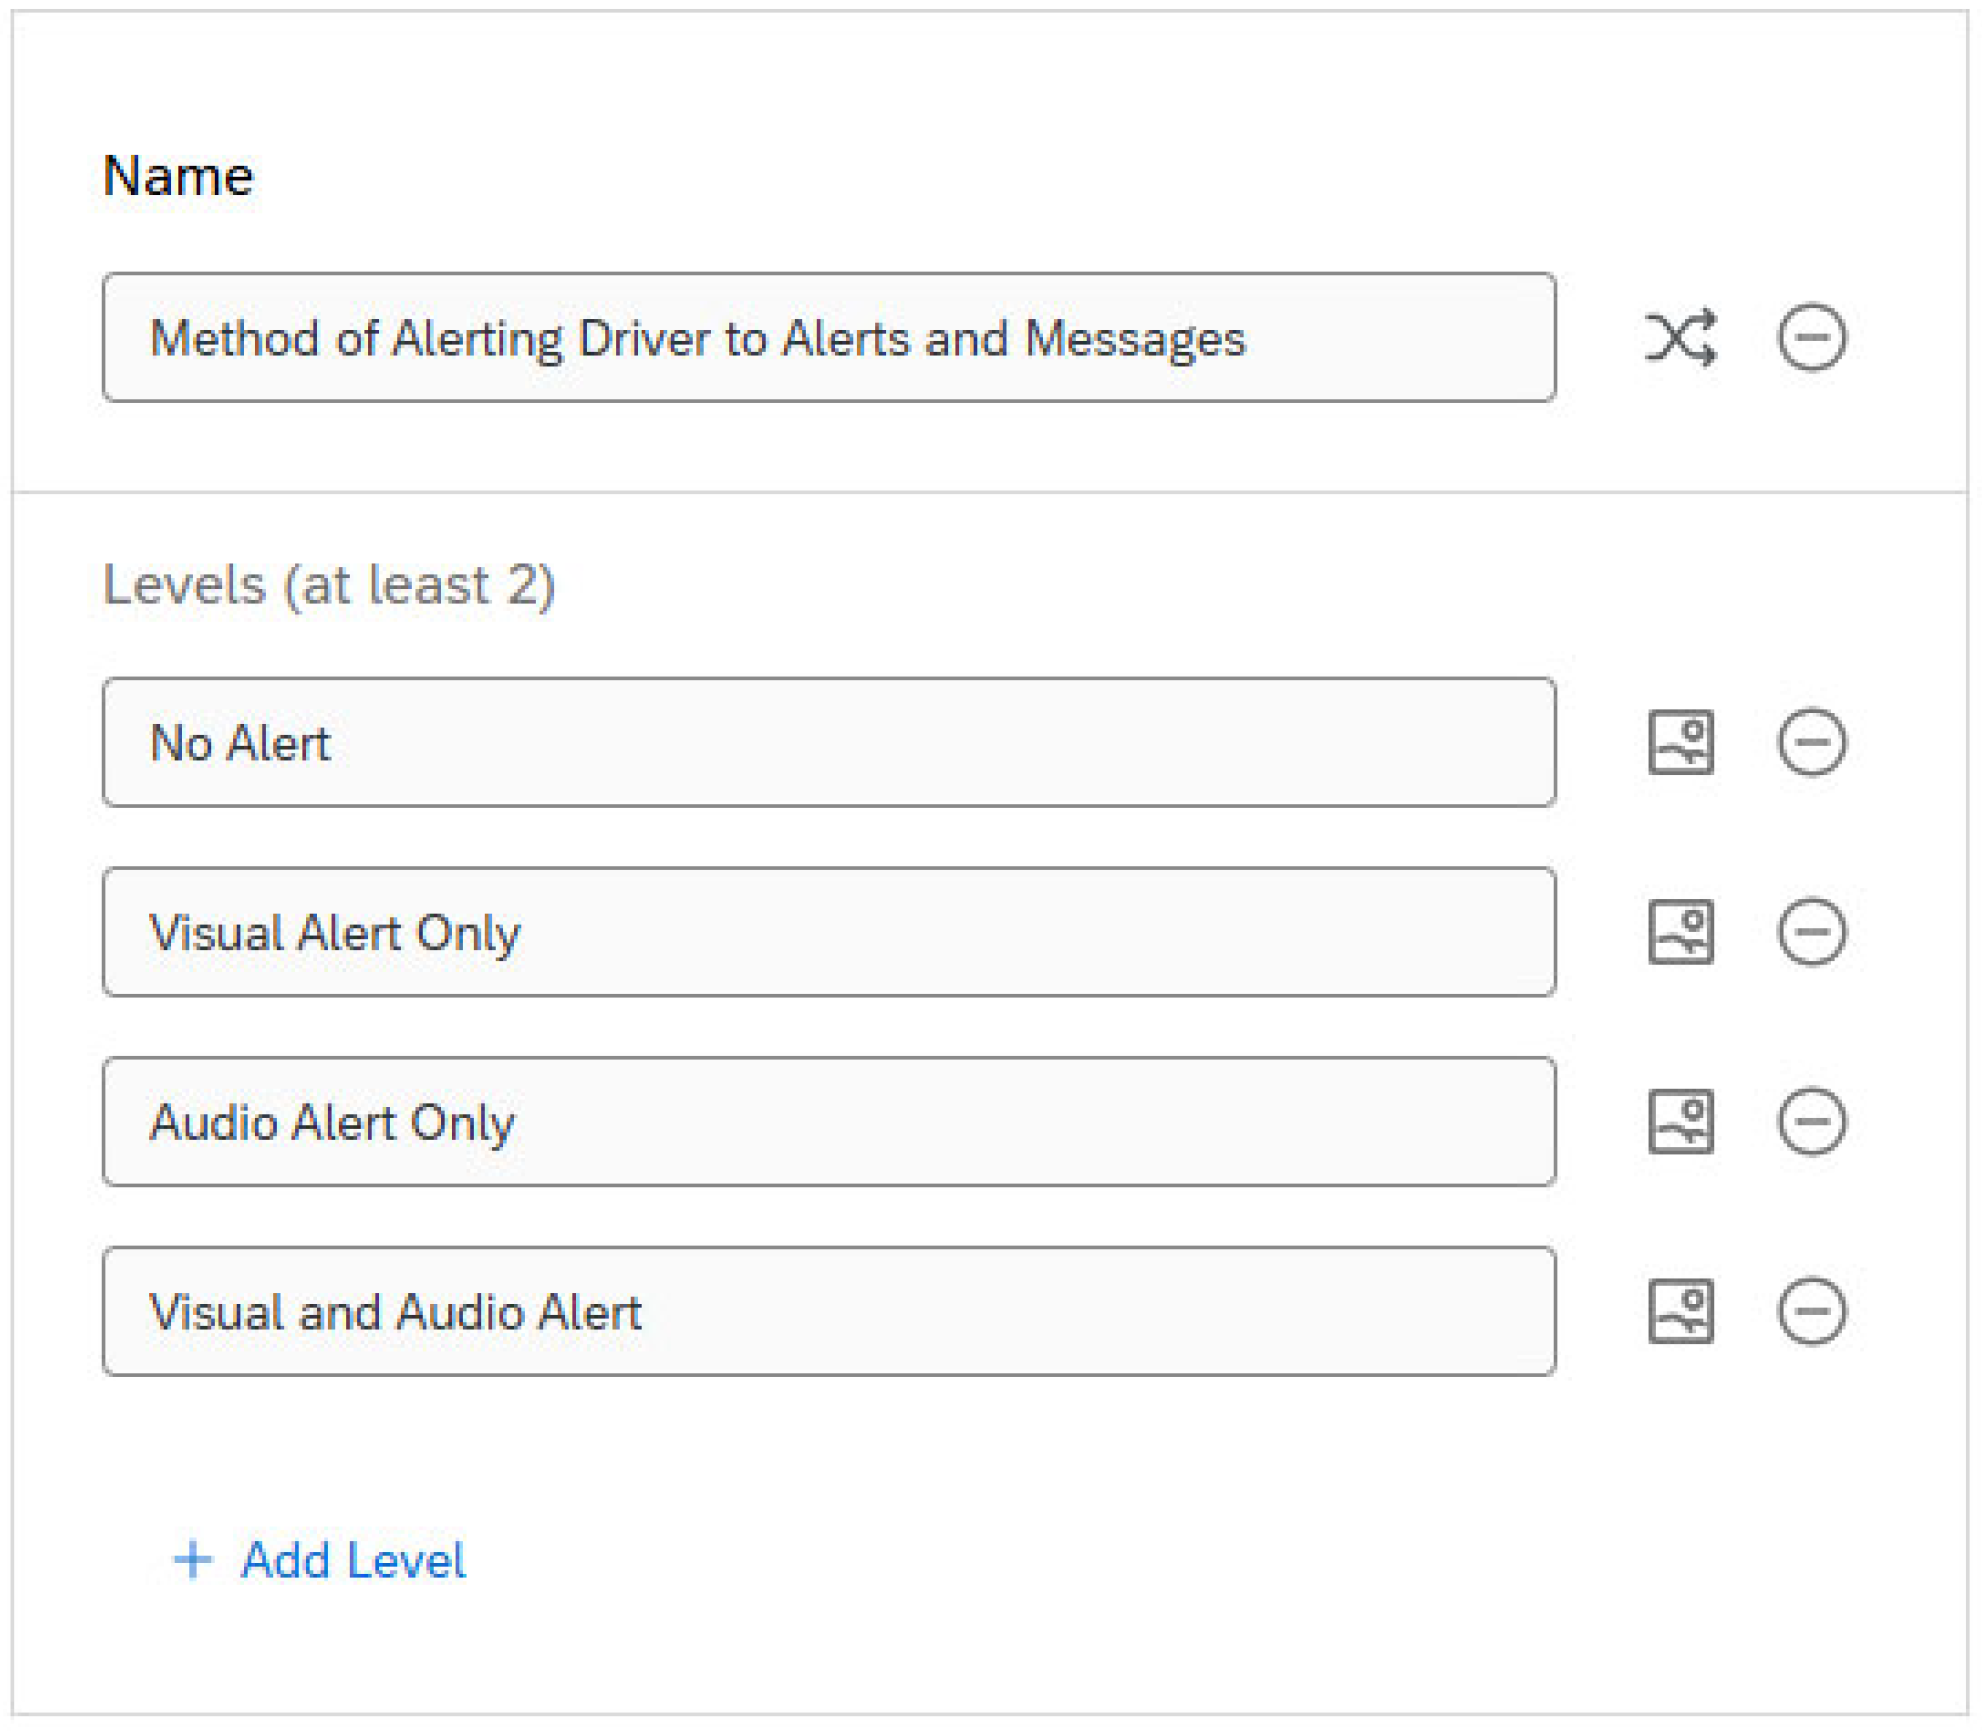
- Alert Method (4 options)—Method in which the vehicle alerts the driver to alerts or warnings from the self-driving system, including visual and/or audio warnings.
| Feature Name | Feature Levels |
|---|---|
| Human Interventions | 1× per 5 years 100× per 5 years 500× per 5 years 1000× per 5 years |
| Failure Allowance | 5% 10% 15% 20% |
| Failure Behavior | Vehicle Stops Safely Vibration Alert & TOR Visual Alert & TOR |
| Alert Method | No Alert Visual Audio Audio & Visual |
2.2.2. Conjoint Analysis Feature Sets
2.2.3. Feature Level Utility Values
2.3. Generalized Linear Mixed-Effects Models (GLMMs)
2.4. Least Absolute Shrinkage and Selection Operator (LASSO)
3. Results
3.1. Description of Respondent Pool
3.2. Utility Values for Entire Sample
3.2.1. Comparison of Features
3.2.2. Comparison of Levels Within Features
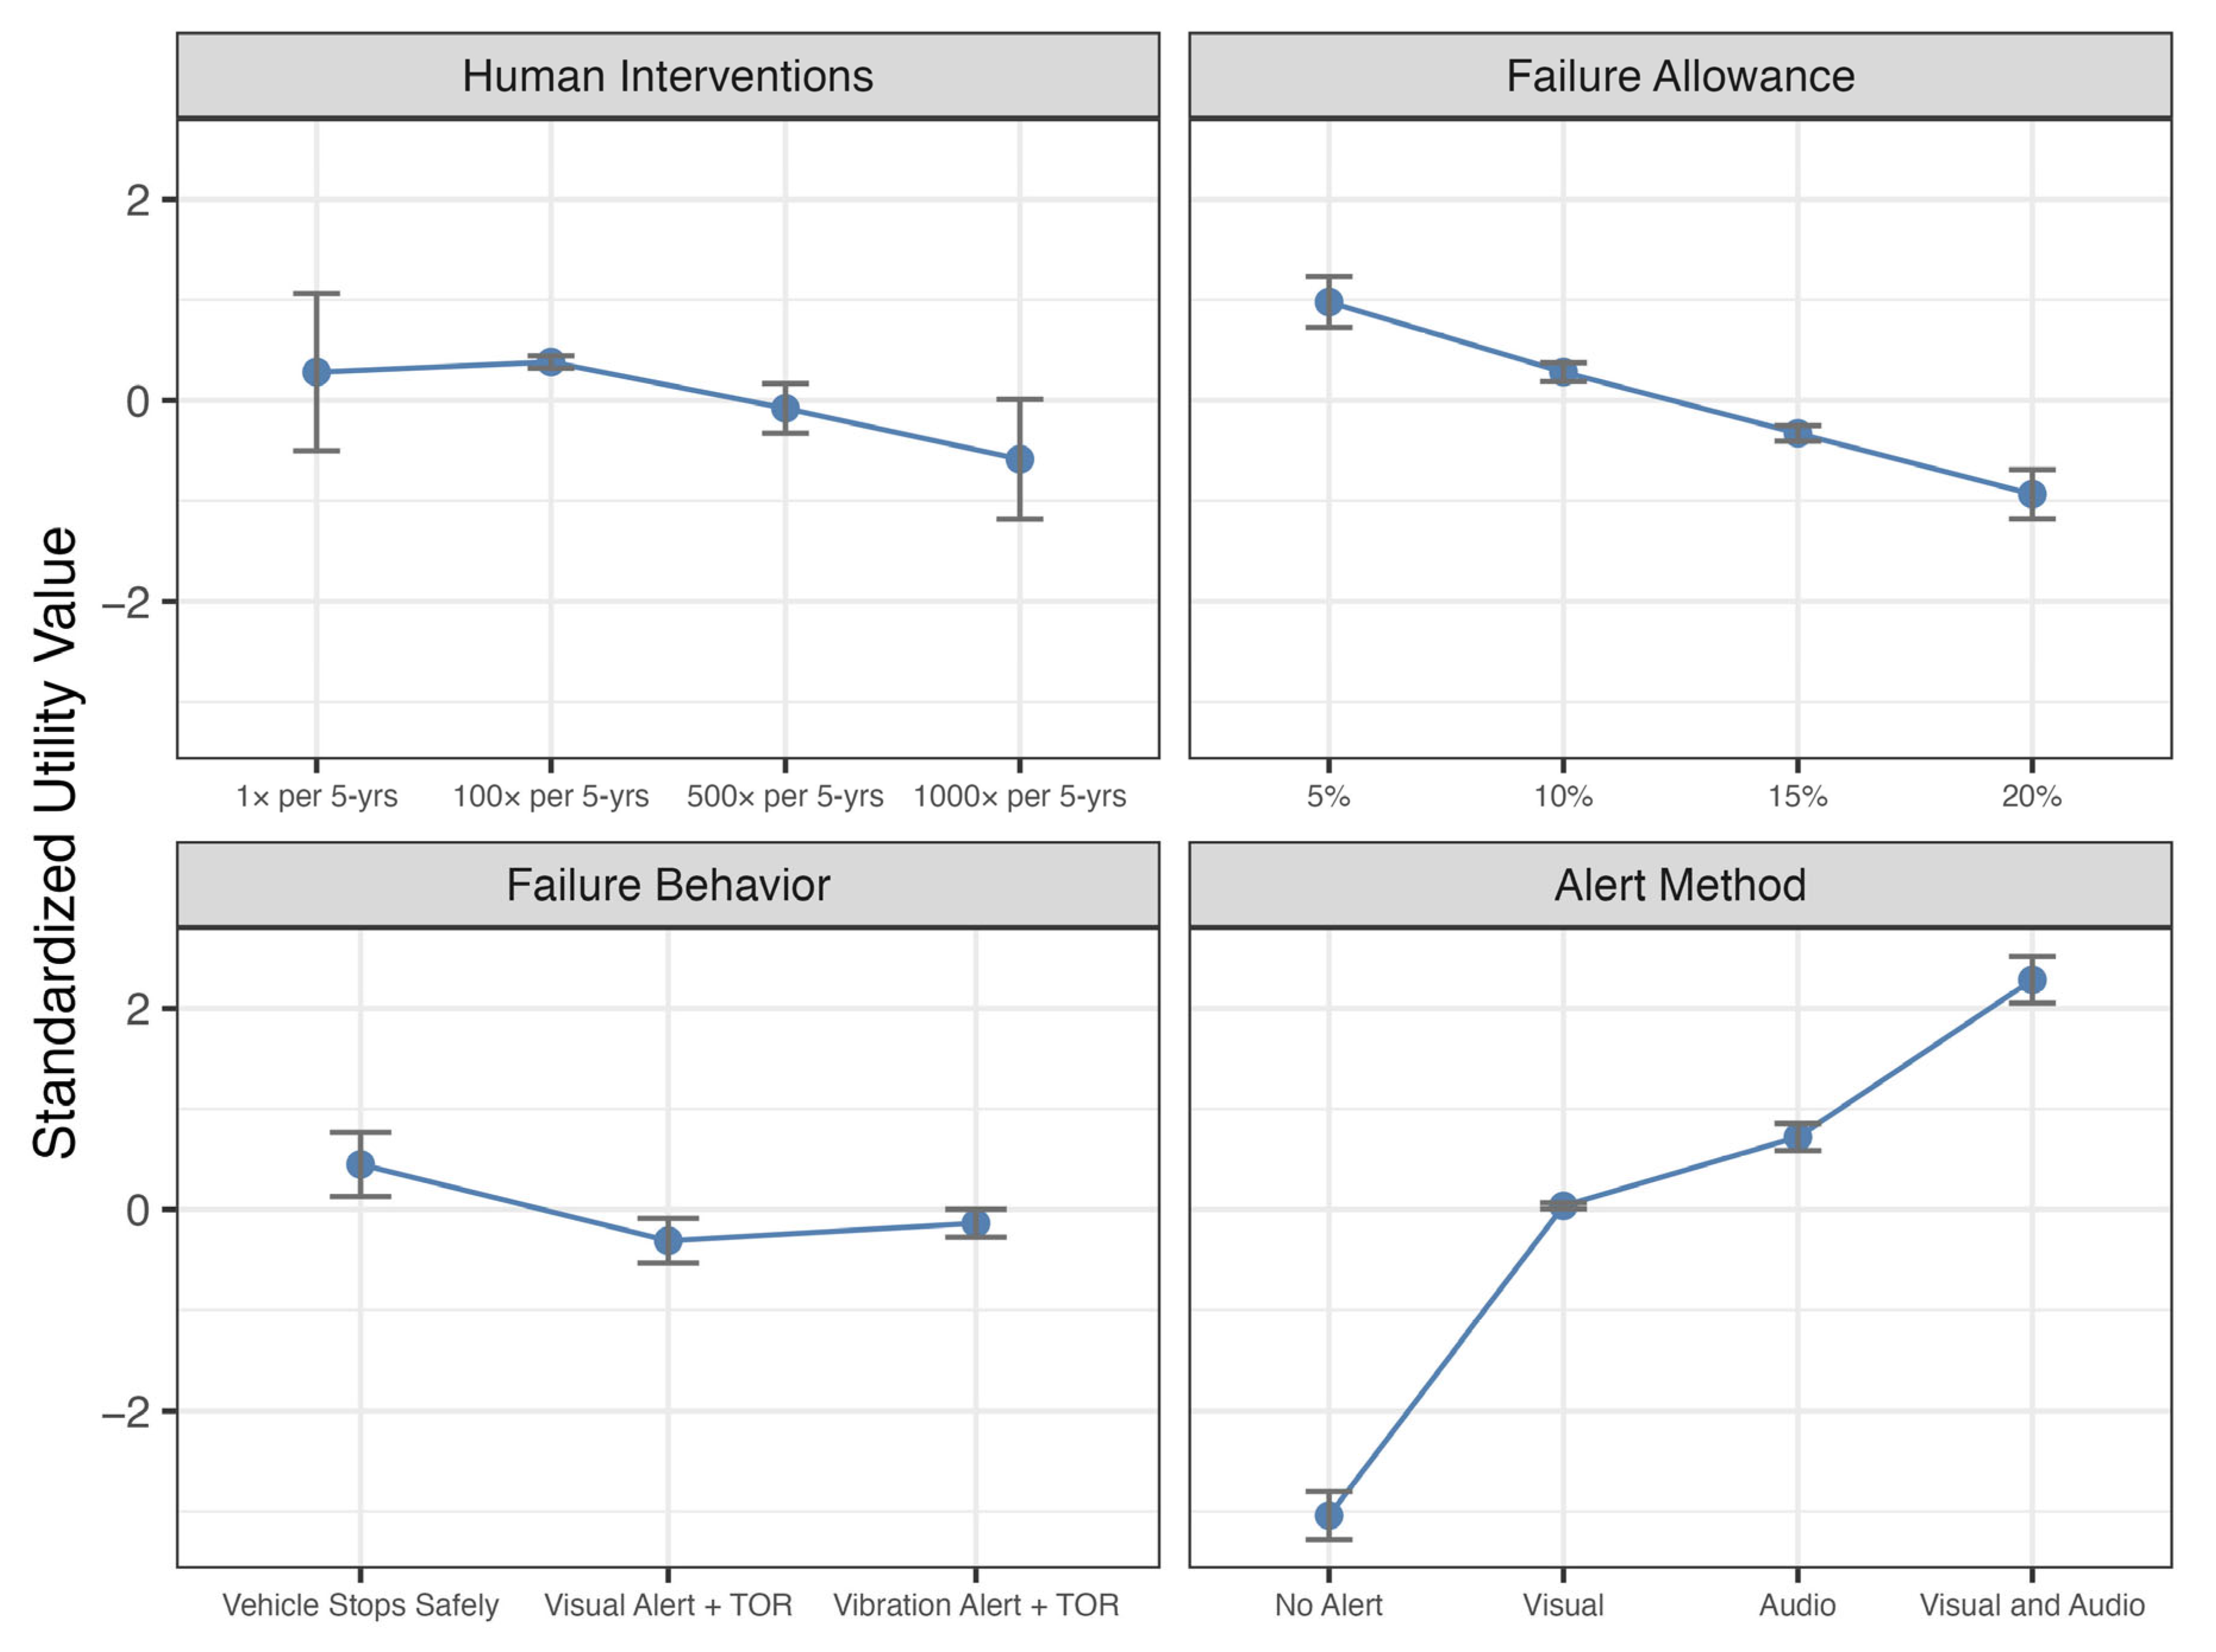
3.2.3. Optimal Feature Levels
3.3. Utility Values by Sample Subsets
3.3.1. Feature Level Utility by WTP
3.3.2. Feature Level Utility by Impact of Advertising
3.3.3. Feature Level Utility by Risk Score
3.3.4. Feature Level Utility by Drive Frequency
3.3.5. Feature Level Utility by Household Income
3.3.6. Feature Level Utility by Race/Ethnicity
3.3.7. Feature Level Utility by Marital Status
3.3.8. Feature Level Utility by Education Level
3.3.9. Synthesis of All Predictors
3.4. LASSO Analysis
- Human Interventions: 1× per 5 years;
- Failure Allowance: 10%;
- Failure Behavior: vibration alert + TOR;
- Alert Method: audio alert.
4. Discussion
5. Conclusions
Author Contributions
Funding
Institutional Review Board Statement
Informed Consent Statement
Data Availability Statement
Conflicts of Interest
Abbreviations
| GRiPS | General Risk Propensity Scale |
| GLMM | Generalized Linear Mixed Model |
| HEV | Hybrid Electric Vehicle |
| IRB | Institutional Review Board |
| LASSO | Least Absolute Shrinkage and Selection Operator |
| SDV | Self-Driving Vehicle |
| TOR | Takeover Request |
| TSR | Traffic Sign Recognition |
| WTP | Willingness to Pay |
Appendix A


References
- Kim, J.H.; Lee, G.; Lee, J.; Yuen, K.F.; Kim, J. Determinants of personal concern about autonomous vehicles. Cities 2022, 120, 103462. [Google Scholar] [CrossRef]
- Wang, J.; Zhang, L.; Huang, Y.; Zhao, J. Safety of autonomous vehicles. J. Adv. Transp. 2020, 2020, 8867757. [Google Scholar] [CrossRef]
- Lee, D.; Hess, D.J. Public concerns and connected and automated vehicles: Safety, privacy, and data security. Soc. Sci. Commun. 2022, 9, 90. [Google Scholar] [CrossRef]
- Li, J.; Liu, J.; Wang, X.; Liu, L. Investigating the factors influencing user trust and driving performance in level 3 automated driving from the perspective of perceived benefits. Transp. Res. Part F Traffic Psychol. Behav. 2024, 105, 58–72. [Google Scholar] [CrossRef]
- Fink, P.D.S.; Brown, J.R.; Kutzer, K.M.; Giudice, N.A. Does trust even matter? Behavioral evidence for the disconnect between people’s subjective trust and decisions to use autonomous vehicles. Transp. Res. Part F Traffic Psychol. Behav. 2025, 114, 99–117. [Google Scholar] [CrossRef]
- Lee, Y.C.; Hand, S.H.; Lilly, H. Are parents ready to use autonomous vehicles to transport children? Concerns and safety features. J. Saf. Res. 2020, 72, 287–297. [Google Scholar] [CrossRef]
- Kohanpour, E.; Davoodi, S.R.; Shaaban, K. Trends in autonomous vehicle performance: A comprehensive study of disengagements and mileage. Future Transp. 2025, 5, 38. [Google Scholar] [CrossRef]
- Tan, X.; Zhang, Y. Driver Situation Awareness for Regaining Control from Conditionally Automated Vehicles: A Systemic Review of Empirical Studies. Hum. Factors 2025, 67, 367–403. [Google Scholar] [CrossRef]
- Deng, H.; Xiang, G.; Pan, J.; Wu, X.; Fan, C.; Wang, K.; Peng, Y. How to design driver takeover request in real-world scenarios: A systematic review. Transp. Res. Part F Traffic Psychol. Behav. 2024, 104, 411–432. [Google Scholar] [CrossRef]
- Mature-Peaspan, J.A.; Perez, J.; Zubizarreta, A. A Fail-Operational Control Architecture Approach and dead-reckoning strategy in case of positioning failures. Sensors 2020, 20, 442. [Google Scholar] [CrossRef]
- Lee, C.; An, D. Decision-making in fallback scenarios for autonomous vehicles: Deep reinforcement learning approach. Appl. Sci. 2023, 13, 12258. [Google Scholar] [CrossRef]
- Kang, C.; Lee, C.; Zhao, X.; Daeho Lee, D.; Shin, J.; Lee, J. Safety still matters: Unveiling the value propositions of augmented reality head-up displays in autonomous vehicles through conjoint analysis. Travel Behav. Soc. 2025, 39, 100915. [Google Scholar] [CrossRef]
- Nickkar, A.; Lee, Y.-J. Willingness to pay for advanced safety features in vehicles: An adaptive choice-based conjoint analysis approach. Transp. Res. Rec. J. Transp. Res. Board 2022, 2676, 173–185. [Google Scholar] [CrossRef]
- Pronay, S.; Lukovics, M.; Ujhazi, T. Teenage dreams of self-driving cars: Findings of a UTAUT-based conjoint analysis among the 14–19 age group. Transp. Res. Interdiscip. Perspect. 2025, 29, 101304. [Google Scholar] [CrossRef]
- Stewart, E.; Gallegos, E. What would I see in court? A survey analysis of who Americans would blame for self-driving vehicle crashes and traffic violations. Int. Counc. Syst. Eng. Int. Symp. 2025, 35, 736–759. [Google Scholar] [CrossRef]
- Xhang, D.; Highhouse, S.; Nye, C.D. Development and validation of the General Risk Propensity Scale (GRiPS). J. Behav. Decis. Mak. 2019, 32, 152–167. [Google Scholar] [CrossRef]
- Getting Started with Conjoint Projects. Available online: https://www.qualtrics.com/support/conjoint-project/getting-started-conjoints/getting-started-choice-based/getting-started-with-conjoint-projects/ (accessed on 21 August 2025).
- Silaen, R.V.; Windasari, N.A. Customer preference analysis on attributes of hybrid electric vehicle: A choice-based conjoint approach. Int. J. Curr. Sci. Res. Rev. 2022, 5, 4704–4713. [Google Scholar] [CrossRef]
- Li, W.; Yamamoto, T.; Guan, H.; Han, Y. Assessing consumer preferences for hydrogen fuel cell vehicles: A conjoint analysis approach across multiple cities in China. Int. J. Hydrogen Energy 2024, 80, 1210–1222. [Google Scholar] [CrossRef]
- Min, J.; Hong, Y.; King, C.B.; Meeker, W.Q. Reliability analysis of artificial intelligence systems using recurrent events data from autonomous vehicles. J. R. Stat. Soc. Ser. C Appl. Stat. 2022, 71, 987–1013. [Google Scholar] [CrossRef]
- Bas Kaman, F.; Olmus, H. Statistical approaches used in studies evaluating the reliability of autonomous vehicles based on disengagements and reaction times. Int. J. Automot. Sci. Technol. 2024, 8, 279–287. [Google Scholar] [CrossRef]
- Khattak, Z.H.; Fontaine, M.D.; Smith, B.L. Exploratory investigation of disengagements and crashes in autonomous vehicles under mixed traffic: An endogenous switching regime framework. IEEE Trans. Intell. Transp. Syst. 2021, 22, 7485–7495. [Google Scholar] [CrossRef]
- de Bekker-Grob, E.W.; Donkers, B.; Jonker, M.F.; Vleggeert-Paulus, M.A. Sample size requirements for discrete-choice experiments in Healthcare: A practical guide. Pract. Appl. 2015, 8, 373–384. [Google Scholar] [CrossRef]
- Conjoint Analysis Technical Overview. Available online: https://www.qualtrics.com/support/conjoint-project/getting-started-conjoints/getting-started-choice-based/conjoint-analysis-white-paper/ (accessed on 14 September 2025).
- Lesaffre, E.; Lawson, A.B. Bayesian Biostatistics; John Wiley & Sons: Hoboken, NJ, USA, 2012; pp. 46–81. [Google Scholar]
- Pérez-Millan, A.; Contador, J.; Tudela, R.; Ninerola-Baizan, A.; Setoain, X.; Llado, A.; Sanchez-Valle, R.; Sala-Llonch, R. Evaluating the performance of Bayesian and frequentist approaches for longitudinal modeling: Application to Alzheimer’s disease. Sci. Rep. 2022, 12, 14448. [Google Scholar] [CrossRef]
- Le, B.V.Q.; Nguyen, A.; Richter, O.; Nguyen, T.T. Comparison of frequentist and Bayesian generalized linear models for analyzing the effects of fungicide treatments on the growth and mortality of piper nigrum. Agronomy 2021, 11, 2524. [Google Scholar] [CrossRef]
- Flores, R.D.; Sanders, C.A.; Duran, S.X.; Bishop-Chrzanowski, B.M.; Oyler, D.L.; Shim, H.; Clocksin, H.E.; Miller, A.P.; Merkle, E.C. Before/after Bayes: A comparison of frequentist and Bayesian mixed-effects models in applied psychological research. Br. J. Psychol. 2022, 113, 1164–1194. [Google Scholar] [CrossRef]
- Bhat, C.R.; Castelar, S. A unified mixed logit framework for modeling revealed and stated preferences: Formulation and application to congestion pricing analysis in the San Francisco Bay area. Transp. Res. Part B Methodol. 2002, 36, 593–616. [Google Scholar] [CrossRef]
- Matuschek, H.; Kliegl, R.; Vasishth, S.; Baayen, H.; Bates, D. Balancing type I error and power in linear mixed models. J. Mem. Lang. 2017, 94, 305–315. [Google Scholar] [CrossRef]
- McCulloch, C.E.; Neuhaus, J.M. Misspecifying the shape of a random effects distribution: Why getting it wrong may not matter. Stat. Sci. 2011, 26, 388–402. [Google Scholar] [CrossRef]
- Tibshirani, R. Regression Shrinkage and Selection Via the Lasso. J. R. Stat. Soc. Ser. B (Methodol.) 1996, 58, 267–288. [Google Scholar] [CrossRef]
- Zou, H. The adaptive Lasso and its oracle properties. J. Am. Stat. Assoc. 2006, 101, 1418–1429. [Google Scholar] [CrossRef]
- Desboulets, L.D.D. A review of variable selection in regression analysis. Econometrics 2018, 4, 45. [Google Scholar] [CrossRef]
- Archsmith, J.; Muehlegger, E.; Rapson, D.S. Future paths of electric vehicle adoption in the United States: Predictable determinants, obstacles, and opportunities. Environ. Energy Policy Econ. 2022, 3, 71–110. [Google Scholar] [CrossRef]
- Filip, M. Electric vehicles and consumer choices. Renew. Sustain. Energy Rev. 2021, 142, 110874. [Google Scholar] [CrossRef]
- American Community Survey: S0101 Age and Gender. Available online: https://data.census.gov/table/ACSST1Y2022.S0101?q=Gender%20identity (accessed on 10 November 2024).
- American Community Survey: S1201 Marital Status. Available online: https://data.census.gov/table?q=Marital%20Status (accessed on 10 November 2024).
- American Community Survey: S1501 Educational Attainment. Available online: https://data.census.gov/table/ACSST1Y2022.S1501?q=Educational%20Attainment (accessed on 10 November 2024).
- American Community Survey: S1901 Income in the Past 12 Months (in 2022 Inflation-Adjusted Dollars). Available online: https://data.census.gov/table/ACSST1Y2022.S1901?q=Household%20income (accessed on 10 November 2024).
- Decennial Census: DP1 Profile of General Population and Housing Characteristics. Available online: https://data.census.gov/table?g=010XX00US&d=DEC+Demographic+Profile (accessed on 10 November 2024).
- National Population by Characteristics: 2020–2024. Available online: https://www.census.gov/data/tables/time-series/demo/popest/2020s-national-detail.html (accessed on 19 October 2025).
- Green, P.E.; Srinivasan, V. Conjoint analysis in marketing: New developments with implications for research and practice. J. Mark. 1990, 54, 3–19. [Google Scholar] [PubMed]
- Hebiri, M.; Lederer, J. How correlations influence Lasso prediction. IEEE Trans. Inf. Theory 2013, 59, 1846–1854. [Google Scholar]
- Pan, F.; Zhang, Y.; Liu, J.; Head, L.; Elli, M.; Alvarez, I. Reliability modeling for perception systems in autonomous vehicles: A recursive event-triggering point process approach. Transp. Res. Part C Emerg. Technol. 2024, 169, 104868. [Google Scholar] [CrossRef]


| Effect Size δ | Odds Ratio | Required N (80% Power) | Power for N = 403 | Power at Effective N = 282 |
|---|---|---|---|---|
| 0.2 | 1.22 | 196 | 97% | 95% |
| 0.3 | 1.35 | 87 | 99+% | 99+% |
| 0.5 | 1.65 | 31 | 99+% | 99+% |
| Demographic Factor | Survey Sample | U.S. Census (%) |
|---|---|---|
| Gender | Male (48.88%) | 49.58 |
| Female (49.13%) | 50.42 | |
| Non-Binary/Other (1.74%) | N/A | |
| Prefer Not to Answer (0.25%) | N/A | |
| Race/Ethnicity | Hispanic/Latino (13.65%) | 18.7 |
| African American (13.9%) | 12.4 | |
| White/Non-Latino (60.55%) | 61.6 | |
| Asian (5.96%) | 6.0 | |
| Pacific Islander (0.25%) | 0.20 | |
| Native American/Alaskan Native (0.99%) | 1.10 | |
| Other (3.97%) | 8.4 | |
| Prefer Not to Answer (0.74%) | N/A | |
| Marital Status | Single (41.69%) | 36.0 |
| Married (44.42%) | 48.0 | |
| Divorced (9.93%) | 10.5 | |
| Widow/Widower (2.98%) | 5.5 | |
| Prefer Not to Answer (0.99%) | N/A | |
| Education | Less Than High School (0%) | 10.4 |
| High School Diploma (14.14%) | 26.1 | |
| Some College (22.58%) | 19.1 | |
| Associate’s Degree (12.90%) | 8.8 | |
| Bachelor’s Degree (39.49%) | 21.6 | |
| Graduate Degree (15.85%) | 14.0 | |
| Household Income | Less Than USD 10,000 (9.93%) | 5.5 |
| USD 10,000–USD 49,999 (31.76%) | 28.5 | |
| USD 50,000–USD 99,999 (35.23%) | 29.0 | |
| USD 100,000–USD 149,999 (14.14%) | 16.9 | |
| More than USD 150,000 (12.90%) | 20.20 | |
| Age | 15 to 19 Years (1.97%) | 6.56 |
| 20 to 24 Years (10.10%) | 6.48 | |
| 25 to 29 Years (9.85%) | 6.75 | |
| 30 to 34 Years (7.64%) | 6.94 | |
| 35 to 39 Years (9.11%) | 6.69 | |
| 40 to 44 Years (7.39%) | 6.39 | |
| 45 to 49 Years (8.87%) | 6.03 | |
| 50 to 54 Years (7.14%) | 6.26 | |
| 55 to 59 Years (16.50%) | 6.41 | |
| 60 to 64 Years (10.84%) | 6.42 | |
| 65 to 69 Years (4.43%) | 5.52 | |
| 70 to 74 Years (4.93%) | 4.50 | |
| 75 to 79 Years (1.23%) | 3 |
| Feature | Optimal Package Value |
|---|---|
| Human Interventions | 1× per 5-years |
| Failure Allowance | 5% |
| Failure Behavior | Vehicle Stops Safely |
| Alert Method | Audio & Visual Alert |
| WTP by Automation Level | Feature | Level | Coeff | p-Value |
|---|---|---|---|---|
| Full Self-Drive | Human Interventions | 100× per 5 years | −7.29 × 10⁻⁵ | <0.001 |
| Full Self-Drive | Human Interventions | 1000× per 5 years | −1.51 × 10⁻⁴ | <0.001 |
| Full Self-Drive | Human Interventions | 500× per 5 years | −8.81 × 10⁻⁵ | <0.001 |
| Driver Assist | Human Interventions | 100× per 5 years | 1.13 × 10⁻⁴ | 0.041 |
| Driver Assist | Human Interventions | 1000× per 5 years | 2.53 × 10⁻⁴ | <0.001 |
| Driver Assist | Human Interventions | 500× per 5 years | 1.68 × 10⁻⁴ | 0.002 |
| Driver Assist | Failure Allowance | 15% | 1.87 × 10⁻⁴ | <0.001 |
| Variable | Feature | Level | Coeff. | p-Value |
|---|---|---|---|---|
| Impact of Advertising Score | Human Interventions | 1000× per 5 years | −0.08 | 0.040 |
| Variable | Feature | Level | Coeff. | p-Value |
|---|---|---|---|---|
| Risk Score | Alert Method | Audio & Visual | 0.027 | 0.013 |
| Drive Frequency | Feature | Level | Coeff. | p-Value |
|---|---|---|---|---|
| 2–3× per week | Alert Method | No Alert | −0.50 | 0.048 |
| Never | Failure Allowance | 5% | −0.77 | 0.012 |
| 4–6× per week | Failure Allowance | 5% | 0.46 | 0.043 |
| Income Level | Feature | Level | Coeff. | p-Value |
|---|---|---|---|---|
| $60 k–$79,999 | Alert Method | No Alert | 0.79 | 0.007 |
| $100 k–$149,999 | Alert Method | No Alert | 0.74 | 0.014 |
| $100 k–$149,999 | Alert Method | Visual Alert | 0.71 | 0.014 |
| Feature | Income $100,000–144,999 | Entire Sample |
|---|---|---|
| Human Interventions | 1× per 5 years | 1× per 5 years |
| Failure Allowance | 5% | 5% |
| Failure Behavior | Vibration Alert + TOR | Vehicle Stops Safely |
| Alert Method | Audio & Visual Alert | Audio & Visual Alert |
| Race/Ethnicity | Feature | Level | Coeff. | p-Value |
|---|---|---|---|---|
| African American | Human Interventions | 1000× per 5 years | 0.56 | 0.028 |
| Hispanic | Human Interventions | 1000× per 5 years | 0.72 | 0.015 |
| Hispanic | Alert Method | No Alert | −1.00 | 0.002 |
| Feature | Hispanic Respondents | Entire Sample |
|---|---|---|
| Human Interventions | 100× per 5 years | 1× per 5 years |
| Failure Allowance | 5% | 5% |
| Failure Behavior | Vehicle Stops Safely | Vehicle Stops Safely |
| Alert Method | Audio & Visual Alert | Audio & Visual Alert |
| Marital Status | Feature | Level | Coeff. | p-Value |
|---|---|---|---|---|
| Single | Human Interventions | 100× per 5 years | 0.65 | 0.033 |
| Single | Human Interventions | 500× per 5 years | 0.83 | 0.006 |
| Education Level | Feature | Level | Coeff. | p-Value |
|---|---|---|---|---|
| Associate’s Degree | Alert Method | Visual Warning | 0.58 | 0.043 |
| Some College | Human Interventions | 100× per 5 years | 0.80 | 0.006 |
| Feature | Level | Coeff. | Odds Ratio |
|---|---|---|---|
| Human Interventions | 1000× per 5 years | −0.30 | 0.74 |
| Failure Allowance | 20% | −0.19 | 0.83 |
| Failure Allowance | 5% | 0.22 | 1.24 |
| Alert Method | No Alert | −0.88 | 0.41 |
| Alert Method | Visual & Audio | 0.41 | 1.50 |
| Alert Method | Visual | −0.05 | 0.95 |
| Feature | Coefficient Range | Relative Importance (%) |
|---|---|---|
| Human Interventions | 0.300 | 15.0 |
| Failure Allowance | 0.405 | 20.3 |
| Failure Behavior | 0 | 0 |
| Alert Type | 1.29 | 64.7 |
Disclaimer/Publisher’s Note: The statements, opinions and data contained in all publications are solely those of the individual author(s) and contributor(s) and not of MDPI and/or the editor(s). MDPI and/or the editor(s) disclaim responsibility for any injury to people or property resulting from any ideas, methods, instructions or products referred to in the content. |
© 2025 by the authors. Licensee MDPI, Basel, Switzerland. This article is an open access article distributed under the terms and conditions of the Creative Commons Attribution (CC BY) license (https://creativecommons.org/licenses/by/4.0/).
Share and Cite
Stewart, E.; Gallegos, E.E. Reliability, Resilience, and Alerts: Preferences for Autonomous Vehicles in the United States. Future Transp. 2025, 5, 164. https://doi.org/10.3390/futuretransp5040164
Stewart E, Gallegos EE. Reliability, Resilience, and Alerts: Preferences for Autonomous Vehicles in the United States. Future Transportation. 2025; 5(4):164. https://doi.org/10.3390/futuretransp5040164
Chicago/Turabian StyleStewart, Eric, and Erika E. Gallegos. 2025. "Reliability, Resilience, and Alerts: Preferences for Autonomous Vehicles in the United States" Future Transportation 5, no. 4: 164. https://doi.org/10.3390/futuretransp5040164
APA StyleStewart, E., & Gallegos, E. E. (2025). Reliability, Resilience, and Alerts: Preferences for Autonomous Vehicles in the United States. Future Transportation, 5(4), 164. https://doi.org/10.3390/futuretransp5040164


