Abstract
Early detection of dyslexia and learning disorders is vital for avoiding a learning disability, as well as supporting dyslexic students by tailoring academic programs to their needs. Several studies have investigated using supervised algorithms to screen dyslexia vs. control subjects; however, the data size and the conditions of data acquisition were their most significant limitation. In the current study, we leverage a large dataset, containing 4243 time series of eye movement records from children across Europe. These datasets were derived from various tests such as saccade, vergence, and reading tasks. Furthermore, our methods were evaluated with realistic test data, including real-life biases such as noise, eye tracking misalignment, and similar pathologies among non-scholar difficulty classes. In addition, we present a novel convolutional neural network architecture, adapted to our time series classification problem, that is intended to generalize on a small annotated dataset and to handle a high-resolution signal (1024 point). Our architecture achieved a precision of 80.20% and a recall of 75.1%, when trained on the vergence dataset, and a precision of 77.2% and a recall of 77.5% when trained on the saccade dataset. Finally, we performed a comparison using our ML approach, a second architecture developed for a similar problem, and two other methods that we investigated that use deep learning algorithms to predict dyslexia.
1. Introduction
Reading is a complex process that requires precise control of the eyes to maintain a stable angle between the optic axes and move smoothly from left to right. This demands coordination among three physiological eye movement systems—saccades, fixations, and vergence control—enabling systematic capture and analysis of each word. Analyzing these coordination properties can help detect multiple pathologies such as dyslexia by identifying distinguishing patterns for targeted pathologies.
For instance, research has shown that dyslexics present abnormalities in their eye movements during reading [1]. Ward and Kapoula [2] demonstrated that these abnormalities are intrinsic to individuals with dyslexia and can be observed even outside of a reading context.
Previous studies indicate that machine learning models utilizing handcrafted features can capitalize on these physiological differences to predict the presence of pathologies. These methods have proven effective in predicting specific disorders, especially when applied to small datasets. Consequently, supervised learning-based prediction of eye movement disorders has become a focal point in scientific research [3,4,5,6,7,8,9]. However, many existing methods tend to discard noisy data and encounter common limitations.
One notable limitation is that patients with pathologies other than dyslexia are excluded from the training distribution, potentially introducing biases in the results. Additionally, these studies often use small datasets from laboratory experiments, and are conducted exclusively during reading tasks, which limits the generalizability of the findings. Consequently, the performance of such methods on larger population data remains largely unexplored. Furthermore, in real-world pathology detection settings, eye movement recordings are obtained from various healthcare centers and cover a diverse population. These data typically show significantly increased variability due to the wide range of samples and variations in acquisition protocols across different healthcare centers, which can affect the model generalization when employing the trained algorithms on real life application [10].
In this context, there is a compelling argument to transition from traditional machine learning paradigms to end-to-end deep learning approaches. Deep learning models have demonstrated a remarkable capacity to learn robust features when provided with a sufficient amount of data. Therefore, adopting a deep learning approach holds great potential for overcoming the aforementioned limitations and effectively addressing the challenges associated with variability in eye movement recordings, obtained from real-world scenarios.
In this study, we aim to establish the ability to predict dyslexia and learning disorders from other pathologies in large-scale multi-clinical center European environments using deep learning applied to various types of eye movements in reading and non-reading tasks. Our dataset contains 4243 time series from 1575 patients across 18 different classes, with a total size of 5.82 GB. Our study establishes the feasibility of employing deep learning techniques to detect learning disorders in real clinical settings, surpassing the capabilities of traditional machine learning approaches.
Overall, our contributions are as follows:
- We introduce a simple architecture that exhibits a promising performance in comparison to existing deep learning methods.
- We demonstrate the feasibility of using deep learning, which outperforms machine learning, for detecting learning disorders in real clinical settings.
- We achieve a substantial increase of 10% in F-score versus the previous best method, and across three distinct sub-datasets, namely saccade, vergence, and reading eye movement tasks. This improvement further validates the effectiveness of our approach in accurately identifying and diagnosing learning disorders.
2. Related Work
2.1. Traditional Machine Learning Methods
Automated analysis of eye movement data for medical analysis is field of growing interest. The existing approaches can be broadly categorized into studies using traditional machine learning methods, and works applying modern deep learning models.
The studies using machine learning are briefly summarized in Table 1. Such studies, including our prior studies, use features (such as amplitude, velocity of the saccades, fixation duration based on velocity thresholds, etc.) defined explicitly. Many of these studies use small sets of eye movement data restricted to reading tasks [11]. In contrast, our prior studies [3,4] use a variety of eye movement tasks, from reading and non-reading conditions, namely including saccades and vergence tests with a technology that allows eye movement recording using a standardized eye movement stimulation routine. In our prior studies using machine learning, we extend this to include vergence and saccade tests in non-reading conditions using the REMOBI&AIDEAL technology. Our studies show a capacity to discriminate dyslexic from non-dyslexic adolescents and consolidate other studies using limited datasets. For instance, Asvestopoulou et al. trained multiple classifiers to predict dyslexia and reported an accuracy of 97%. On the other hand, our own studies [3] reported an accuracy of 81.25% when trained on the REMOBI saccade dataset.

Table 1.
Summary of our review of studies using traditional machine learning methods.
Next, we will describe in more detail the few studies using deep learning.
2.2. Supervised Deep Learning Approaches
Many other studies have used the supervised learning paradigm to train deep learning architectures to predict pathologies such as dyslexia [8,9,20], Parkinson’s disease [21], Alzheimer’s disease [22], and autism spectrum disorder [23,24,25] relative to control healthy subjects, or task classification, such as search, memorization, attention, and rating [26,27,28]; those studies are summarized in Table 2. Additionally, these studies have explored various data structures, including text, image, and time series. As a result, processing methods can be grouped into three categories: mapping each time series to a sequence of letters using NLP processing, mapping each time series to a scan path, or mapping each time series data to an ensemble of segments using sliding windows. Furthermore, in terms of architecture, some studies use CNNs with learnable kernels as well as non learnable kernels [21], while others use recurrent neural networks. The dataset sizes, in term of subjects for these studies, ranged from 15 to 210, with a median size of 59.
2.2.1. Deep Learning Based Dyslexia Classification
A few studies investigate the use of deep learning to predict dyslexia from eye movement data collected during reading tasks. Nerusil et al. [9] attempt to predict dyslexia using deep learning by training a CNN on raw eye movement position data in the spectral domain. They achieve an accuracy of 96.6% using this approach, which is slightly better than the 95.67% accuracy achieved using threshold-based methods on the histogram of reading times. However, the study has limitations such as a low temporal resolution eye tracker, subjects being placed in artificial conditions with head stabilization, and the use of reading duration as the sole discriminatory parameter, which is well-known as dyslexic readers tend to read slower. To address these limitations, we use an eye tracker with a high sampling rate of 200 Hz.
Moreover, in two separate studies, Vajs et al. tackle the same issue by using CNNs trained on eye movement trajectory plots. In the first study [20], each plot corresponds to a 3D image encoding segment length through color representations. In the second study [8], each trajectory is represented by multiple 1D plots, where they train a CNN-based autoencoder to minimize the reconstruction error of eye position segments and utilize the model to construct handcrafted features for classification. Despite achieving an accuracy of up to 87%, these studies have limitations such as small datasets with low temporal resolution and the use of noise as a physiological criterion, which is not robust since noise can also be present in healthy subject data. Consequently, these studies fail to provide strong physiological evidence of eye movement abnormalities in dyslexia; therefore, we extend the related work to cover other deep learning-based applications on eye movement data.
2.2.2. Autism Classification Task
Additionally, image processing-based methods have also been investigated for predicting autism spectrum disorder (ASD). Chen et al., Ming et al., and Yudong et al. [24,25,29] all used convolutional neural network (CNN)-based architectures to analyze eye movements from images. Chen et al. used a convolutional-LSTM neural network to classify eye movement data from two separate datasets, reporting an accuracy of 0.84 on the ROC-AUC metric.
Table 2.
Summary of the studies on applied deep learning on eye movement data.
Table 2.
Summary of the studies on applied deep learning on eye movement data.
| Article | Model | Learning Task | Dataset Size | Paradigm |
|---|---|---|---|---|
| Bautista et al. [30] | CNN | (age, gender, id) classification | 45,755 (143) | Unsup. learning (Time series) |
| Bautista et al. [31] | CNN | (age, gender, id) classification | 45,755 (143) | Self-sup. Learning (Time series) |
| Lee et al. [32] | Multiple CNN | screening abnormal behavior | 45,000 (15) | Self-sup. learning (Image) |
| Zemblys et al. [26] | RNN | Eye-based event segmentation | 151,639 (31) | Sup. learning (Time series) |
| Cole et al. [27] | CNN | Task classification | 12,177 (124)/10,395 (77) | Sup. learning |
| Elbattah et al. [23] | CNN/LSTM | Autism classification | 2018 (59) | Sup. learning (NLP) |
| Chen et al. [24] | CNN-LSTM | Autism classification | 700 (39)/1800 (45) | Sup. learning (Image) |
| Ming et al. [25] | CNN | Autism classification | 700 (39) | Sup. learning (Image) |
| Yudong et al. [29] | SP-ASDNet | screening TD and ASD | 300 (28) | Sup. learning (Image) |
| Vajs et al. [20] | CNN | Predicting dyslexia | 390 (30) | Sup. learning (Image) |
| Vajs et al. [8] | CNN | Predicting dyslexia | 378 (30)/181 (185) | Sup. learning (image) |
| Nerusil et al. [9] | CNN | Predicting dyslexia | 185 (185) | Sup. learning (Time series) |
| Harisinghani et al. [33] | GRU | Screening Alzheimer | - (162) | Sup. learning (Time series) |
| Sun et al. [22] | CNN-AE | Screening Alzheimer | - (210) | Sup. learning (Image) |
| Ahmed et al. [34] | CNN-SVM | screening ASD | 500 (59) | Sup. learning (Image) |
| Uribarri et al. [21] | Rocket | Screening Parkison | 1582 (67) | Sup learning. (time serie) |
| Uppal et al. [28] | GRU | Attention zone localisation | 105,532 (16) | Sup learning (image) |
Ming et al. [25] fine-tuned a VGG-16 CNN on the OSEI dataset to learn an embedding representation for eye movement data, achieving 92% accuracy when training an SVM using the learned embedding.
Yudong et al. [29] trained a CNN to learn an embedding representation, which was used to train an LSTM and achieved an accuracy of 74.22%. Their approach involved processing each image with a saliency prediction model to segment the most attractive zone, then highlighting the scan path in the image and decomposing it into multiple patches fed to the SP-ASDNet model. Finally, Elbattah et al. use NLP to predict autism based on eye movement position. They divide the time series into equal intervals, replacing each segment with “s” for saccades or “f” for fixations. then, they use an NLP processing technique to generate embedding vectors from the text. Finally, they train CNN and LSTM models and report precision of 79%, recall of 71%, and an ROC-AUC score of 0.84, which is lower than prior studies.
2.2.3. Event Detection Tasks
For instance, Zembly et al. [26] propose a deep learning framework for saccade and fixation detection, using a generative model to augment their dataset size and training a recurrent neural network on the augmented dataset. They achieve a performance similar to that of expert coders and better than that of other algorithms. In a more complex task classification task, Cole et al. [27] trained a convolution-based architecture to predict three tasks (search, memorization, or rating) from eye movements, using two datasets of 12,177 and 10,395 samples. They reported up to 55% accuracy on the validation set.
2.3. Unsupervised Deep Learning Approaches
Several approaches propose learning features in an unsupervised manner by generating high-dimensional embeddings, which can be applied to various tasks such as patient identification, age and gender classification, and screening abnormal behavior [30,31,32]. The three studies used CNN-based architectures, but the input space structure of their proposed methods and the evaluation models used to assess the learned embedding’s relevance differ. Bautista et al. [30,31] utilized time series data as the input space and employed SVM for downstream task evaluation, while Lee et al. [32] worked with image data and evaluated the embedding using MLP.
Furthermore, Bautista et al. utilized a temporal convolutional network autoencoder to separately learn high-dimensional representations from eye movement position segments and velocity segments. They assessed the quality of the embeddings by training a linear SVM for a patient identification task, achieving an accuracy of up to 93.9% on the stimuli task and up to 87.8% on the biometrics task. In another approach, they applied the same encoder architecture in implementing self-supervised contrastive learning paradigm, which resulted in an accuracy of up to 94.5% on the biometrics task; however, generalization ability decreased significantly when evaluating using datasets not included in the training/testing set split algorithm. Lee et al. also trained a model using self-supervised contrastive learning framework for screening abnormal behavior when observing screen movements and reported an accuracy of 91% for detecting abnormal eye movements indicating a lack of attention.
3. Materials and Methodology
3.1. Eye Movement Recordings
Our data are collected in real clinical centers in Europe that examine eye movement in individuals with dyslexia and learning disorders, rather than from laboratory-designed studies. All centers record eye movements using the Pupil Core head-mounted video-oculography device [35] at a frequency of 200 Hz per eye, which provided real-time estimation of gaze position for both the left and right eyes along the vertical (y) and horizontal (x) axes. All centers use the same REMOBI technology (patent WO2011073288), presented in Figure 1, and AIDEAL technology (patent PCT/EP2021/062224) to stimulate eye movements (saccades, vergence) and reading tasks, and used the same eye tracker. All records are anonymized before being stored in our database following European regulations on personal data.
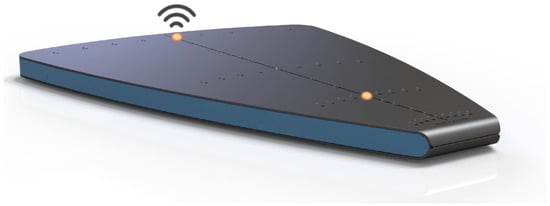
Figure 1.
Presentation of the Remobi device used in the clinical centers. Subjects are asked to visually fixate on a randomly moving LED on the Remobi device while their eye movements are recorded with an eye tracker.
3.2. Eye Movement Tasks
Our database contains eye movement recordings of three types of eye movement tasks: saccade, vergence, and reading.
3.2.1. Saccade Task
In this setting, patients are asked to visually fix stimuli (LEDs) that are randomly lit on a horizontal axis in order to stimulate right and left saccade movements. The duration and position of the LEDs are randomly configured in order to prevent subjects from anticipating the movements. The objective of this test is to analyze saccadic movement, as well as post-saccadic fixation. In total, each test is composed of 40 saccadic movements (20 left and 20 right).
3.2.2. Vergence Task
In the vergence test, the stimuli were presented over the optical axis to stimulate conjugate and disconjugate vergence movements. The configuration settings are similar, with randomized position and duration, and a total of 40 trials.
3.2.3. Reading Task
Finally, the reading test requires subjects to read a text while their eye movements are recorded.
3.3. Data Annotation
We obtain annotations from clinicians’ reports of patient information and eye tracker records. This information includes predefined categories such as age, details on the eye movement task performed, and a text description of each patient’s reasons for seeking orthoptic attention. Patients are grouped into ten pathologies, including dyslexia and learning disorders, strabismus, vertigo, presbycusis, vergence-accommodation disorders, low vision, and motor restlessness. Subsequently, we cluster multiple families of disorders to form the final labels, considering that dyslexia and learning disorders contain dysgraphia, dysorthographia, dyscalculia, and learning disability. Figure 2 lists the main groups present in each class, using a tree structure.
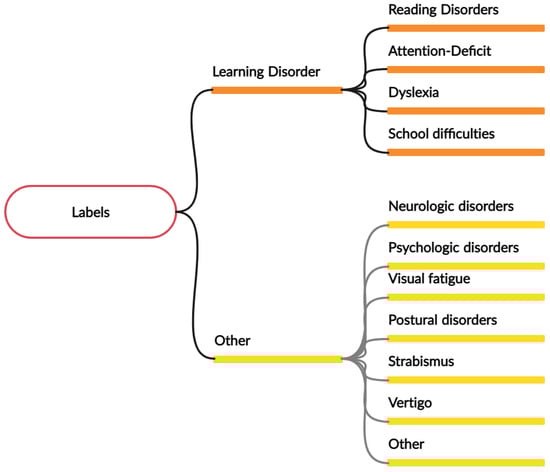
Figure 2.
An overview of the different pathology groups for each of the positive class and negative class, each pathology is a group of multiple sub-pathologies. For example, dyslexia regroups dysgraphia, dysorthographia, and dyscalculia.
Traditionally, a model is trained to distinguish dyslexia from control subjects, defined as those without any pathology. One limitation of this approach is the absence of patients with pathologies other than dyslexia from the training distribution, which can lead to confusion when facing data from patients with other pathologies that have similarities with dyslexia, which typically happens in a clinical setting. To overcome these limitations, we propose including subjects with pathologies other than dyslexia in the negative population, using a dataset with matching acquisition conditions.
3.4. Datasets Overview
For this study, we construct two datasets: ora2021 and ora2022. These datasets display two levels of task difficulty, to address different research questions and to account for different levels of variability in terms of pathology and population.
3.4.1. Ora2021 Dataset
The first dataset (Ora2021) comprises all the data collected by only two clinical centers. Using this dataset, we aim to screen for dyslexia and reading disorder in a group of patients with two other pathologies, including strabismus and vertigo. This dataset consists of eye movement recordings from 125, 164, and 222 subjects, for the saccade, vergence, and reading tasks, respectively. The positive class in this dataset includes dyslexia and reading disorders, while the negative class includes strabismus and vertigo.
3.4.2. Ora2022 Dataset
The second dataset (Ora2022) is composed of data from a larger number of centers (20) and includes data from the period 2021. It is composed of 1080, 1384, and 1126 subjects for each of the saccade, vergence, and reading tests, respectively. With this dataset, the target population is more complex, including dyslexia and school learning disorders, as well as a wider variety of other pathologies, such as vertigo, strabismus, neurologic disorders, postural and equilibrium problems, and attention deficits. Thus, in the second case, the comparison population is more varied. The challenge of this task is to establish the capacity to discriminate between reading and school disorders from a variety of other dysfunctions and pathologies, with a larger data variability.
3.4.3. Class Imbalance
The distribution of each class for the six datasets is presented in Table 3. In terms of the number of subjects per class, the Ora2021 datasets exhibit a high imbalances, with a notably lower number of negative class subjects compared to the positive class. In contrast, the Ora2022 datasets demonstrate a relatively balanced distribution between the two classes for the saccade and vergence eye movement tasks, and a significant imbalance for the reading eye movement task.
Table 3.
Class distribution on the two datasets. We also report the imbalance factor.
3.5. Problem Statement
In general terms, our dataset is composed of N samples, where each is a multivariate time series containing the eye movement recording, and is the target class. Each contains the horizontal and vertical angular positions of both eyes across the recording time of length T: . The task at hand is to predict the correct class based on the input .
The time series in our dataset are typically very long (approximately 30,000 time points). Therefore, we propose to operate on segments of size of the original full time series. This corresponds to 5 s of recording. We allow for overlap in the sliding window, and each segment is labeled with the same label as the full time series.
3.6. Data Pre-Processing
To process our data, we follow several steps. First, we filter each time series and then divide them into segments. Next, we split the data into a training set and a test set. Finally, we standardize both sets.
3.6.1. Outlier Removal
We use two filtering methods before dividing each time series into segments. The first method is a low-pass filter with a cutoff 33 Hz. Additionally, we calculate the z-score for each point in each time series to identify outliers. Any point with a z-score greater than 2.5 is filtered out as well.
3.6.2. Standardization
To standardize the input time series, we customize the standardization procedure to maintain a physiologically plausible signal.
Each time series segment of size S is standardized individually by subtracting the channelwise mean and dividing by the standard deviation. The mean is computed per segment and channel; however, we adopt a different approach for the standard deviation. We first compute the variance of the left-eye channels, and that of the right-eye channels. We then divide all channels by the square root of the mean of these two variances. This preserves the conjugation of the two eyes, i.e., the mean divergence between the left and right eye position. Conjugation is an important feature in saccade and vergence analysis, hence our effort to preserve it in the normalization procedure. In practice, we found this normalisation procedure to be experimentally better than standard normalization techniques.
3.6.3. Train/Test Split
The target diagnosis labels have two levels of certainty. To ensure reliable test performance metrics, we only use 40% of the high-certainty samples in the test set, and include the remaining high and medium certainty samples in the training set.
The trade-off is a reduced number of patients in the test set compared to the training set, but a smaller and more accurately annotation. Finally, Figure A1 presents the sample-based distribution of the two classes for saccades, vergence, and reading tasks for Ora2021 and Ora2022 datasets.
3.7. Architecture Design
We introduce a new architecture dubbed Hierarchical Temporal Convolutions for Eye Movement Analysis. Our approach is built on temporal convolutions, which are known for their strong performance with sequential data and high computational efficiency. The HTCE model consists of multiple hierarchical convolutional blocks followed by a Multi-Layer Perceptron for classification. Key elements of our HTCE architecture include dilated convolutions and multi-scale context.
Dilated convolutions are a technique used in computer vision and have been adapted for time series analysis. Unlike regular convolutions with a fixed receptive field, dilated convolutions introduce gaps between kernel elements to increase the range of the receptive field. This allows the model to capture larger temporal contexts, which is particularly beneficial for eye movement time series classification as it enables efficient capturing of long-term dependencies and patterns in the data.
Another important aspect of HTCE is the multi-scale context [36,37], which involves aggregating information from different scales by concatenating convolution layers with various receptive fields. By incorporating features from different scales, the model becomes more robust to variations in eye movement patterns and can capture both local and global temporal characteristics crucial for accurately classifying eye movement time series. This is essential as the temporal dimension holds significant importance, considering the notable noise-to-signal ratio.
3.8. Overall Architecture
Our architecture is mainly composed of a feature extractor implemented using convolution layers and a 2-layer perceptron classifier. We show a schematic overview of our HTCE architecture in Figure A4. The feature extractor is composed of four stages, where each stage has a different number of filters for the convolution layers. The first stage module used 64 filters for each convolution layer, and for each next stage, we doubled the number of filters used in the previous stage. Each stage is composed of three different Convblocks with the same hyperparameter setting. A pooling layer has been added after the second and third Convblock. In addition, a skip connection is implemented between the input and the output of each stage, followed by a normalization layer.
In addition, when choosing the normalization layer, we experimented with batch normalization and layer normalization. However, using batch normalization made training too unstable due to high variability of the input space’s covariance. Adjusting momentum parameters did not mitigate this issue. We hypothesize that the high variability of the input space’s covariance is responsible for this instability; for example, while image data exhibit some level of stationarity, time series data are more variable. This problem is further amplified when dealing with noisy signals. As a result, we decided to retain layer normalization.
Finally, the Head classifier consists of global average pooling to compress the temporal dimension followed by two linear layers, each with 256 units. We use leaky ReLU activation function for the first layer and sigmoid for the second in order to output a probability distribution for each pathology separately.
Hierarchical Convolutional Layer
The main building block of our architecture is the ConvBlock module, Figure A3 presents the architecture of this module. It is composed of three concatenated convolutional layers with the same hyperparameters (number of filters, kernel size, and stride) but with different dilation ratios, equal to 1, 4, and 8 for the three convolution layers, to enable fusion of different scale information. Each convolution layer was followed by a layer normalization and a ReLU activation. In addition, the padding is chosen to preserve the temporal dimension inside each block and the ReLU activation. Finally, we use a skip connection between the input and the output of each sub-block.
3.9. Additional Hyperparameters Tuning
The different modules used to build our architecture are widely discussed in the academic literature. However, the originality of our method is in the way we conduct hyperparameter tuning. An incorrect or inappropriate choice of hyperparameters can lead even advanced methods to underperform. We chose not to utilize automated hyperparameter tuning tools and focused on deriving insights directly from the data instead. Our approach involves leveraging our knowledge in physiology and deep learning to specialize our architecture on eye movement gaze data.
Furthermore, beyond the activation and dilation rates discussed previously, we fine-tune additional hyperparameters such as the number of filters, kernel size, and pooling size. The hyperparameters utilized for each stage and in every convolution block are detailed in Table A1. It is important to note that each value represents a tuple of three elements, aligning with the configurations of the three distinct convolutional blocks within each stage. Additionally, all convolution layers within the same convolution block adhere to the same hyperparameter setting.
First, we optimize the number of filters for each convolution layer, a crucial parameter that controls the model’s capacity by adjusting the feature space size. A higher value without sufficient augmentation can lead to overfitting, while selecting smaller parameters may mitigate sample size on simple tasks but is prone to underfitting on complex tasks. In our studies, we aim to maintain the cardinality of the input space by reducing the temporal dimension while increasing the input dimension. We adopted an approach similar to ResNet, with a fixed-size feature space per stage and set the number of filters to 64, 64, 128, and 256 for the first, second, third, and the last stage, respectively.
Alongside the filter size, the kernel size controls the model’s capacity, determining the dimension of the parameter tensor for each layer. Using a larger kernel in the first layers where the filter size is smaller, and a smaller kernel size when the filter size becomes larger helps to keep the size of the weight tensor and of the corresponding layers relatively small. Thus, we set k to 5 for the first three stages, and to 3 for the last stage where the filter size is equal to 256.
The pooling layer is used to increase the receptive field of the last layers. In modern deep learning architectures, we progressively reduce the temporal dimension and increase the pooling size per stage. This allows the last layers to have a larger receptive field while letting the first layers take advantage of larger temporal space information. As a result, for the first two stages, we perform pooling only in the last ConvBlock, while in the last two stages, pooling is performed on the second and the last ConvBlocks.
3.10. Implementation Details
We follow the same learning procedure for all analyses. The models are trained using a batch size of 128 and for a maximum of 100 epochs, utilizing the early stopping technique with a patience of 5 on the validation macro F1 metric. In practice, the models converged within the first 20 epochs.
Our model, implemented in Keras, uses the AdamW optimizer with its default configuration, a learning rate of , and a weight decay of . We optimize the focal loss, with and , to handle the imbalanced nature of the different datasets. For robust validation results, we perform 5 model training sessions, with different random seed parameters, to perform the train/test split presented in Section 3.6.3 and report the mean performance across runs. We evaluate the models using the macro F1 score as our primary metric.
In addition to the macro F1 score, we consider three other metrics to better assess the performance of the model. To evaluate the performance with respect to class 1, we use the precision and recall (sensitivity) of class 1. To track when the model is exploiting the distribution of the dataset by making fewer predictions about the negative class, we use specificity. Finally, the different Hyper parameters are summarized in Table A2.
4. Results and Evaluation
4.1. Comparison with Existing Literature
We evaluate our HTCE architecture using two datasets, Ora2022 and Ora2021, each consisting of three distinct eye movement tasks. Consequently, our models are assessed using a total of six different sub-datasets. We first experimentally compare HTCE to recent existing approaches for automated eye movement analysis. Second, we focus on the capacity of our approach to screen learning disorders using different visual tasks. First, we compare our architecture to different existing approaches for eye movement analysis:
- TC, the temporal convolutional architecture used in [30];
- AE, the autoencoder reconstruction error-based methods presented in [8];
- the Fourier-based (Fourier) method described in [9].
4.1.1. Ora2021 Dataset
We present a comprehensive performance analysis in Table 4, evaluating our deep learning method alongside other existing approaches on the low-variability Ora2021 dataset. For the saccade visual task, all models except the AE-based one demonstrate commendable performance, achieving macro F1 scores of , , and for the HTCE, TC, and Fourier-based models, respectively. Conversely, in the vergence visual task, only the HTCE and TC models exhibit robust generalization.
Table 4.
Performance benchmark on the Ora2021 low-variability dataset. The best metric is highlighted in bold.
Additionally, the Fourier-based model excels in the saccade visual task, while the HTCE-based model achieves the highest scores in both the vergence and reading datasets ( and ). Notably, there is discernible variation in model performance across the three visual tasks—saccade, vergence, and reading. The macro-F1 scores for the saccade task generally outshine the others, reaching , , , and , while models operating on eye movements during reading demonstrate a comparatively lower performance.
4.1.2. Ora2022 Dataset
We then evaluate the same set of models on the Ora2022 dataset, which encompasses a wider population and eye recordings originating from twenty different clincal centers. We report the performance on Table 5.
Table 5.
Performance benchmark on the Ora2022 high-variability dataset. The best metric is highlighted in bold.
On this more challenging dataset, our deep learning model significantly outperforms all the other approaches. It reaches a F1 score of on the saccade sub-dataset, while the second best approach achieves a 10 point smaller score. Similar results are obtained on the two other sub-datasets. a In comparison, the AE approach yields very poor performance on Ora2022. While its sensitivity (recall) is very high, it achieves a specificity almost equal to zero. This suggests that in a setting with high data variability the ML model fails to learn a robust classifier and largely over detects positive samples. The Fourier methods show similar behavior, scoring very low specificity across the three sub-datasets.
Conversely, the TC and our approach prove more robust and maintain better specificity scores than the other three approaches. This supports the value of using supervised deep learning approaches for large scale eye movement data analysis.
Lastly, compared to the TC architecture, our approach achieves a consistent improvement across tasks. We improve the F1 performance by , , and points on the saccade, vergence, and reading sub-datasets, respectively. Also, even if the reading task also yields the poorest performance on Ora2022, our model performs remarkably well with an F1 score of and a specificity of .
4.2. A Comparison with Other Traditional Machine Learning Algorithms
Furthermore, we compared our method with the traditional machine learning approach on three visual tasks of the Ora22 dataset and we report the performance on Table 6. First, we experimentally compared HTCE to our method based on ideal eye movement parameters. Then, we experimented with additional machine learning methods using the same set of eye movement parameters:
- Our own machine learning approach outlined in [3,4] and based on Support Vector Machine with a radial basis function (SVM-RBF).
- We replaced SVM-RBF with Support Vector Machine with a linear kernel using recursive feature elimination (SVM-RFE) set to 8 features.
- We explored the Random Forest algorithm (RF) using the scikit learn implementation with default parameters.
- We experimented with the General Regression Neural Network algorithm (GRNN). During each fold, the model is calibrated using gradient search algorithm.
- We trained a 3-layer perceptron (MLP) of 64 neurons each, utilizing relu activation.
Table 6.
Performance Benchmarking with Machine Learning Algorithms.The best metric is high-lighted in bold.
Table 6.
Performance Benchmarking with Machine Learning Algorithms.The best metric is high-lighted in bold.
| Saccade | Vergence | Reading | ||||||||||
|---|---|---|---|---|---|---|---|---|---|---|---|---|
| F1 | Prec. | Sens. | Spec. | F1 | Prec. | Sens. | Spec. | F1 | Prec. | Sens. | Spec. | |
| HTCE (Ours) | 65.5 | 77.2 | 77.5 | 53.7 | 68.1 | 80.2 | 75.1 | 62.7 | 59.6 | 75.5 | 77.2 | 42.2 |
| RF | 60.8 | 64.0 | 70.2 | 51.3 | 59.7 | 61.3 | 69.8 | 50.0 | 47.6 | 67.5 | 95.0 | 9.7 |
| GRNN | 55.9 | 60 | 61.8 | 48.7 | 52.1 | 55.1 | 57.4 | 47 | 52.0 | 67.7 | 71.4 | 32.5 |
| MLP | 56.5 | 61.0 | 62.2 | 50.7 | 57.1 | 59.5 | 63.4 | 50.8 | 51.8 | 67.6 | 75.2 | 28.7 |
| SVM-RBF | 38.8 | 55.5 | 97.3 | 3.7 | 60.0 | 61.4 | 71.3 | 49 | 40.0 | 66.4 | 71.2 | 48.9 |
| SVM-RFE | 44.1 | 56.2 | 92.5 | 11.0 | 48.3 | 55.3 | 87.6 | 19.15 | 39.9 | 66.4 | 100.0 | 00.0 |
Our deep learning approach consistently outperforms other machine learning algorithms on three visual tasks, achieving unweighted F1 scores of 65.5%, 68.1%, and 59.6%, respectively. Notably, the deep learning validation set includes all data, encompassing highly noisy time series. In contrast, for the machine learning algorithms, data are filtered during the computation of eye movement parameters through a software analysis stage.
Within the realm of machine learning algorithms, the SVM-RBF attains the highest score for the vergence visual task, while achieving the lowest F1 score for the saccade visual task. On the other hand, the Random Forest algorithm exhibits the best sensitivity and specificity trade-off for both saccade and vergence visual tasks, while for the reading task it is the SVM variant models that give the best sensitivity and specificity tradeoff.
Moreover, although SVM-RBF leads to the best score when predicting dyslexia on a smaller dataset compared to other machine learning algorithms, especially the Random Forest algorithm, considering a more realistic dataset with a higher sample size reveals that Random Forest achieves better overall performance on the three visual tasks, with a macro F1 score up to .
However, this improvement comes at the cost of sacrificing decision explainability. While the machine learning approach may achieve a lower performance, it enables the explicit evaluation of the importance of specific parameters, and this is not the case for deep learning.
4.3. Screening Dyslexia and Reading Disorders from Strabismus and Vertigo
Table 7 summarizes the metrics score for each of the three eye movement sub-datasets (saccade, vergence, and reading), using the Ora2021 data.
Table 7.
Performance metrics for each eye movement task of the Ora2021 dataset. The best score for each metric is highlighted in bold.
Overall, the performance is good when considering the saccade and vergence eye movement tasks. The model trained on the saccade eye movement task achieves the best macro F1 score of 66.7%, while the model trained on the reading task achieves the lowest macro F1 score of 53.5%.
Moreover, the three models achieve a precision between 90.3% and 95.6%, and a recall between 85.5% and 97.6%, suggesting a good performance in positive sample classification. On the other hand, the specificity is relatively low for the saccade and vergence tasks (43.5% and 46.6%, respectively) and extremely low for the reading task.
When considering the saccade task, the model achieves the best sensitivity specificity trade, leading to a good macro F1 score of 66.7%. On the other hand, when considering the vergence task, the model achieves the best specificity of 46.6%, and an acceptable sensitivity (85.5%).
Finally, when considering the reading task, the model achieves the best performance in terms of precision and recall but has a very low specificity score. This suggests that the model learned to exploit the differences in the sample size of each class by optimizing positive sample classification, but failed to correctly identify negative samples despite the use of the focal loss to encourage the model to focus more on hard examples.
In summary, the model performs well on tasks with more balanced class distributions but struggles with highly imbalanced datasets.
4.4. Screening Dyslexia and Learning Disorders from a Larger Group of Pathologies Classification
In Table 8, we report the metrics score for each of the three eye movement sub-datasets (saccade, vergence, and reading), using the Ora2022 data. Overall, the performance was good on all three datasets. Despite an increase in variability in the Ora2022 dataset, the macro F1 score magnitude order remained consistent. However, the precision and recall of the positive class decreased, indicating that detecting subjects with dyslexia and learning disorders became more challenging. On the other hand, the classification of the negative class improved, which we hypothesize is due to the increased dataset size.
Table 8.
Performance of the models on different eye movement tasks of the Ora2022 dataset. The best score for each metric is highlighted in bold.
Additionally, the order of performance remained similar when considering the Ora2022 dataset compared to the Ora2021 dataset. The best performances are obtained on the saccade and vergence sub-datasets, while the model trained on the reading task achieved the lowest performance, with a macro F1 score of 59.6%. Moreover, for all three eye movement tasks, the sensitivity was higher than the specificity.
Regarding the saccade and the reading tasks, the precision and recall of the positive class were between 75.5% and 77.5%, indicating that the performance of the two models was good when considering the positive-related metrics. However, the specificity was 53.7% for the saccade task and 42.2% for the reading task, suggesting a significant false positive rate.
Finally, when considering the vergence eye movement task, the precision and recall of the positive class (dyslexic and scholar learning disorder) were 80.2% and 75%, respectively, indicating a high ability to detect true positives. On the other hand, the specificity was 62.7%, which was higher than that of the saccade and reading tasks, suggesting better generalization ability.
5. Discussion
5.1. Comparison with Existing Literature
Our findings highlight the challenges of applying machine learning models to real-world situations, especially when dealing with data that show greater variability and a wider range of pathologies. Nonetheless, our study also demonstrates the promise of deep learning models in these contexts, as they surpass machine learning models on the Ora2022 dataset.
Despite some loss in predictive power for class 1 (dys) in the Ora2022 dataset, our models demonstrate high sensitivity and specificity in accurately predicting class 0 (normal + other pathologies). This indicates that our models can effectively learn from the data and improve their predictive capabilities even when faced with challenging and complex scenarios.
Furthermore, our architecture demonstrates strong performance across all six datasets when compared to the two different methods proposed in previous studies [8,9], achieving acceptable error rates for both positive and negative classes. These results offer promising evidence for the potential of deep learning models in real-world clinical settings, especially when dealing with greater variability in data and pathologies.
Lastly, it is important to note that while deep learning methods are robust, they often sacrifice the interpretability of predictions. Unlike traditional machine learning approaches which operate on clearly defined features and explicit decision rules, deep learning models make predictions that are less easily explained. This lack of transparency is particularly concerning in a medical context and we believe that both traditional ML and deep learning methods can be used together effectively in practical applications.
5.2. Analyzing Feature Importance in Machine Learning Algorithms
Additionally, we performed a permutation test to estimate the feature importance of each method, as opposed to deep learning methods, machine learning algorithms are more suited for explainability. We present in Figure A5 the feature importance for each algorithm when trained on the saccade or the vergence tasks. We train each method using 5-fold cross-validation. During each fold, we apply the permutation test 100 times. Subsequently, we train the model and evaluate it on the corresponding validation set to compute the mean accuracy decrease. Finally, we aggregate the scores from the 100 iterations as well as the 5 folds by calculating the mean. We omit the reading visual task, as none of the machine learning algorithms achieved a satisfactory score. Additionally, we refrain from analyzing the results of applying the permutation test to GRNN on the saccade visual task as the optimizer was diverging.
Overall, the set of determining parameters varies according to the machine learning algorithm used and to the dataset it is applied to.
When considering the saccade dataset, a noteworthy observation arises when focusing solely on the Multilayer Perceptron (MLP) and the Random Forest models. These two models share a resemblance in terms of their top three important features, specifically the standard deviation of the latency parameters for both the left and right saccades, along with the standard deviation of disconjugacy for saccades to the left. On the other hand, when considering the vergence visual task, the mean value of the latency of convergence emerges as a consistent and influential feature across all models.
Recall, the latency is the time period between the target onset and the beginning of eye movement. Physiologically, the longer the latency the more efficient the neural network programming of eye movement is. Concerning the variability of the latency and any other parameter, the larger the variability the worse is the efficiency of the biological eye movement system, i.e., lacking precision and capacity of reproducibility. Saccade disconjugacy is a parameter that describes the capacity of the human brain to control the saccades of the left right eye together, as ideally the two eye should move yoked by the same amount yoked.
It is crucial to note that permutation tests are subject to limitations arising from feature correlation. For instance, if two highly important parameters exhibit a strong correlation, altering the value of the first feature may not significantly impact the overall performance of the model. This is because the other correlated feature can still encapsulate the essential information, mitigating the potential impact of the perturbation.
5.3. Physiologic Validity
This study provides support for recent evidence suggesting that it is possible to accurately differentiate dyslexia and learning disorders from other pathologies using raw eye movement data. The data consists of time series of x, y eye positions from individuals being tested in various physiological tests (saccades, vergence, and reading), then deep learning algorithms are applied to classify the data. It is noteworthy that the data used in the study are realistic clinical data from multiple centers in Europe, all using the same technology to test eye movements. Therefore, the study addresses a real health and education issue: can individuals with dyslexia and learning disorders be classified differently from individuals with other pathologies based on their eye movements? The answer is yes. By training deep learning models using eye movement data from each individual studied in several tests, such as saccades, vergence, and reading, it is possible to achieve physiologically plausible discrimination between the two groups.
5.4. Limitations of Using Data Points from Reading Only
Most of the existing studies are limited to analyzing eye movements during reading. The present study addresses this limitation and particularly emphasizes the discriminative capacity of vergence eye movements—considered the most complex type of eye movement, crucial for activities at near and intermediate viewing distances, including reading. For instance, the quality of binocular coordination during reading relies on the effectiveness of vergence, and even large saccades in a real-world environment are better coordinated when vergence capacity is strong.
This study employs deep learning methods applied to time series data of various eye movements, offering multiple advantages. From a physiological perspective, this approach is relevant as it incorporates all eye position data points over time, even in the presence of noise. Additionally, vergence eye movements, being the least stereotyped among eye movements and varying even among healthy subjects, exhibit higher predictive capacity, thereby enhancing the physiological validity of the results.
5.5. Screening Dyslexia and Learning Disorders with Other Pathologies
Moreover, almost all prior studies presented in the introduction compared healthy individuals to patients, whereas this study compares dyslexia and scholar learning disorders to a number of other pathologies. This is a more realistic clinical approach. The results confirm that eye movement features are a valid way to differentiate dyslexia and scholar learning disorders from other pathologies or dysfunctions.
5.6. Controversy about Dyslexia
The neurological causes of dyslexia are still not completely understood, and there is ongoing debate surrounding various controversial theories [38,39,40]. This research introduces the idea that even subtle eye movement abnormalities, when combined with advanced deep learning methods, could help distinguish individuals with dyslexia from those without this condition. As a result, it suggests that, in some cases of dyslexia, issues with eye movements themselves might be a significant factor contributing to reading difficulties. While it is uncertain whether this is the sole causal factor, it certainly appears to exacerbate reading challenges and serves as a biomarker for such difficulties. For instance, understanding the impact of these findings can lead to demystifying dyslexia and potentially offering solutions; for example, addressing eye movement abnormalities through specialized training methods like vergence eye movement training as introduced by Kapoula et al. [41,42].
5.7. On the Complementarity between Saccade and Vergence Task
When considering the Ora2022 dataset alongside the Ora2021 dataset, we observe that the models trained on the vergence task exhibit higher specificity but lower sensitivity compared to the models trained on the saccade task. This suggests a complementarity between the two trained models. We have observed this same order of performance, in terms of sensitivity and specificity, in our previous studies when applying machine learning approaches to different datasets.
5.8. On the Reported Validation Score
Our study reports validation macro F1 scores up to 68.1%. Several studies report remarkably high generalization scores [34]. However, it is crucial to note that the reliability of the validation score depends on the fidelity of the validation set. This includes factors such as the absence of bias, data variability reflecting real-world scenarios, and the rigor of the training process. The latter can introduce additional problems like overfitting and validation information leaks. Moreover, the test scores of different methods evaluated on different test datasets are incomparable. Thus, in our opinion, a 70% F1 score on a realistic dataset is more reliable than 95% on biased test set.
5.9. Major Finding
Our findings show that existing supervised learning algorithms perform well on research datasets but struggle with clinical data due to label variability and high input variation. Factors such as signal quality, calibration, recording duration, and clinician proficiency in eye movement recording contribute to the input variability in clinical data.
Moreover, diverse pathologies are present within the target population of clinical data, leading to label variability. In contrast to research data with only healthy subjects in class 0, multicenter clinical data contain subjects with various pathologies within the negative class, which makes model training more challenging.
When considering high-quality research data, machine learning shows a competitive performance against deep learning but in realistic scenarios deep learning outperforms machine learning at the expense of reduced model explainability.
To address these challenges, we propose a deep-learning-based solution which demonstrates robustness in handling noisy data and capturing underlying distribution for improved performance.
6. Limitation and Future Direction
6.1. Limitation
In our study, we demonstrate the feasibility of using deep learning to detect scholar disorders in clinical data. However, the macro F1-score of up to 68.1% on the vergence visual task needs further improvement. We are currently exploring the addition of contextual information, such as spatial position coordinates and timing of stimuli, along with real-time interval confidence for technical quality of eye movement recordings. Another limitation is the explainability of model decisions; currently, decision explainability is lacking. Future research could consider more expressive transformers and visualization algorithms.
Additionally, investigating screening for each pathology relative to others using architectures like transformers would be a next step due to their high model capacity and improved performance across various domains. The imbalance factor is another limitation (the ratio between positive and negative samples). Constructing balanced datasets may mitigate this bias in future studies. To reduce its impact, focal loss is used to encourage focus on misclassified samples rather than well-classified ones although completely eliminating this bias when possible might be preferable.
Finally, bigger datasets collected after 2022 will be important for training stability and model performance. Thus, enabling the use of the same test dataset for both machine learning and deep learning approaches mitigates the risk of biased comparisons.
6.2. Enhancing Model Training Conditions
Screening pathology from eye movement gaze data involves a two-stage process. The initial stage entails constructing a model to estimate eye movement gaze data from video recordings, while the subsequent stage focuses on leveraging this data for pathology screening. While deep learning methodologies have gained significant attention for the first stage [43,44,45,46,47], there remains a noticeable gap in their application to the second stage, both in terms of the number of studies, dataset sizes, and architecture complexity.
For instance, the learning process for these two stages differs substantially in dataset construction. While collecting and annotating eye movement recordings using similar solutions is relatively straightforward, building a dataset tailored to a specific pathology presents unique challenges. Moreover, while various image-based data augmentation methods exist to augment the training data for the first task, identifying suitable techniques for augmenting eye movement gaze time series that align with physiological characteristics without distorting population patterns remains a significant challenge.
Therefore, a future direction would be to focus more on improving model learning conditions, such as ensuring a large training set size and a reliable testing set with a data distribution similar to real clinical data [10]. Additionally, incorporating physiologically-driven data augmentation methods that act as data samplers rather than just regularizers is crucial. Without these building blocks, overparameterized deep learning models are prone to overfitting.
6.3. Future Direction
Deep learning, when trained with the appropriate data and structure, has demonstrated superiority over traditional machine learning methods. This superiority stems from the expressive nature of deep learning models, their capacity to autonomously select pertinent features for task learning, and their robustness in handling noisy data. However, a significant drawback at this juncture is the lack of clear decision explainability inherent in deep learning models. Unlike many machine learning algorithms that enable the capture of the most predictive set of features, deep learning algorithms are often perceived as black boxes. Therefore, an avenue for improvement lies in exploring methods for visualizing the patterns learned by the model or understanding its decision paths.
In our study, we categorized the data into two distinct groups: a scholarly disorder population and the remaining population. To address the limitations of a small dataset, we filtered out other pathologies. A potential future direction involves developing the capability to screen each pathology group separately, rather than solely focusing on identifying scholarly disorders within the broader pathology group.
Furthermore, incorporating contextual information, such as stimulus position, confidence levels of gaze data estimation, and latency, can significantly enhance model performance.
6.4. Toward an AI Assistant
Our primary objective is to integrate the learning model into an AI assistant [48,49] for guiding clinicians to prioritize screened pathologies before addressing others. It is important to note that our aim is not direct classification; rather, we advocate for clinicians to make final decisions based on our model’s insights. However, our model seeks to stimulate clinicians to envisage a broad and nuanced distribution proposed by eye movement gaze data analysis when assessing new patients.
7. Conclusions
In this study, we introduced a novel neural architecture for eye movement analysis. We conducted an experimental study using a large dataset that we designed to be closer the the clinical reality of eye movement pathology detection. We compared our approach to other deep learning methods and traditional machine learning approaches. Our results showed that our method yields a significantly better performance than previous approaches in this real-world setting. We hope that our results will foster further research into automated eye movement analysis with modern deep learning methods.
8. Patents
Zoï Kapoula has applied for patents for the technology used to conduct this experiment: REMOBI table (patent US8851669, WO2011073288); AIDEAL analysis software (EP20306166.8, 7 October 2020; EP20306164.3, 7 October 2020—Europe). Patent application pending EP22305903.1.
Author Contributions
Conceptualization, A.E.E.H. and V.S.F.G.; methodology, A.E.E.H.; software, A.E.E.H.; validation, A.E.E.H., V.S.F.G. and ZK; formal analysis, A.E.E.H.; investigation, A.E.E.H.; resources, ZK.; data curation, A.E.E.H.; writing—original draft preparation, A.E.E.H., V.S.F.G. and Z.K.; writing—review and editing, A.E.E.H., V.S.F.G. and Z.K.; visualization, A.E.E.H.; project administration, V.S.F.G. and Z.K.; funding acquisition, Z.K. All authors have read and agreed to the published version of the manuscript.
Funding
Alae Eddine El Hmimdi is funded by Orasis-Ear and ANRT, CIFRE.
Informed Consent Statement
This meta-analysis drew upon data sourced from Orasis Ear, in collaboration with clinical centers employing Remobi and Aideal technology. Participating centers agreed to store their data anonymously for further analysis.
Data Availability Statement
The datasets generated during and/or analyzed during the current study are not publicly available. However, upon reasonable request, they are available from the corresponding author.
Conflicts of Interest
Zoï Kapoula is the founder of Orasis-EAR.
Appendix A
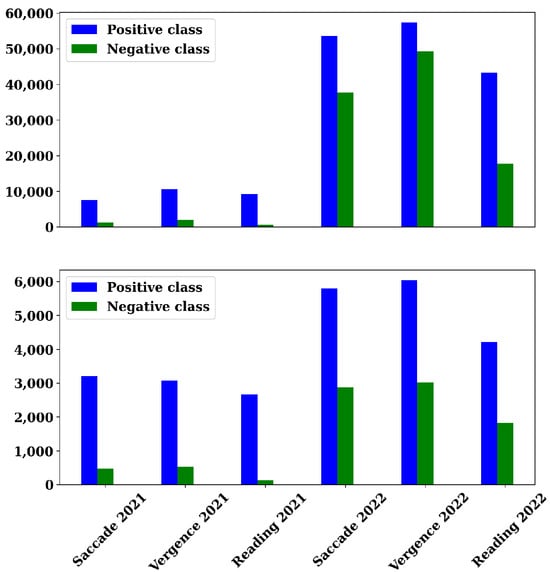
Figure A1.
Presentation of the number of positive and negative windows for each of the six sub-datasets, divided into the training set (top) and the test set (bottom).
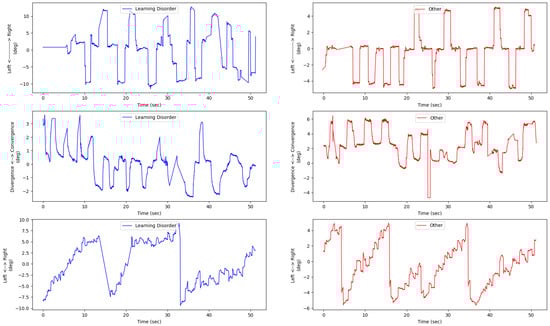
Figure A2.
Illustration of eye movement left and right positions for each of the saccade (first row), the y axis direction correspond to the right saccade direction, vergence (second row), the y axis direction correspond to the convergence direction, and reading (last row) tests. For each of the three rows, the left subfigure corresponds to the eye movement of a subject from the positive class (dyslexia and learning disorder), and the right subfigure corresponds to the eye movement conjugate signal of a subject from the negative class (pathologies other than dyslexia and learning disorder).
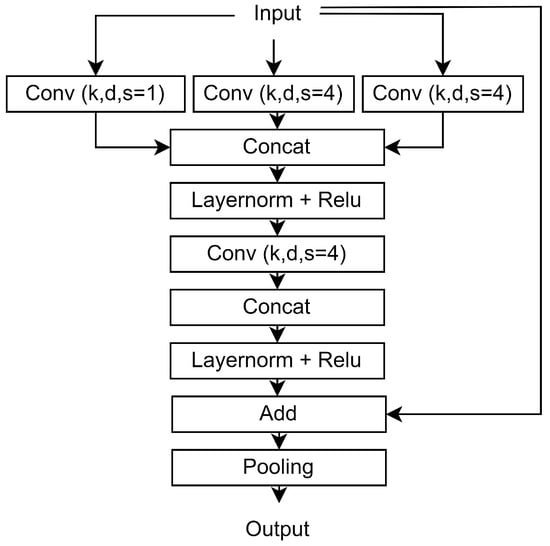
Figure A3.
Presentation of the basic block of the proposed architecture (Convblock). k, d, and s correspond to the kernel size, the filters, and the dilation rate, respectively.
Table A1.
Convolutional layer hyperparameters.
Table A1.
Convolutional layer hyperparameters.
| Stage | Filter Size | Pooling | Kernel Size | Activation |
|---|---|---|---|---|
| 1 | 64-64-64 | 0-0-2 | 5-5-5 | relu |
| 2 | 64-64-64 | 0-0-2 | 5-5-5 | relu |
| 3 | 128-128-128 | 0-2-2 | 5-5-5 | relu |
| 4 | 256-256-256 | 0-2-2 | 3-3-3 | relu |
Table A2.
Model Training Hyperparameters.
Table A2.
Model Training Hyperparameters.
| Value | |
|---|---|
| Optimizer | |
| name | AdamW |
| Learning rate | 0.0001 |
| Beta1 | 0.9 |
| Beta2 | 0.999 |
| Weight decay | 0.00001 |
| Loss | |
| name | Focal loss |
| Alpha | 0 |
| Gamma | 2 |
| Training | |
| batch size | 128 |
| epochs | 100 |
| number of folds | 5 |
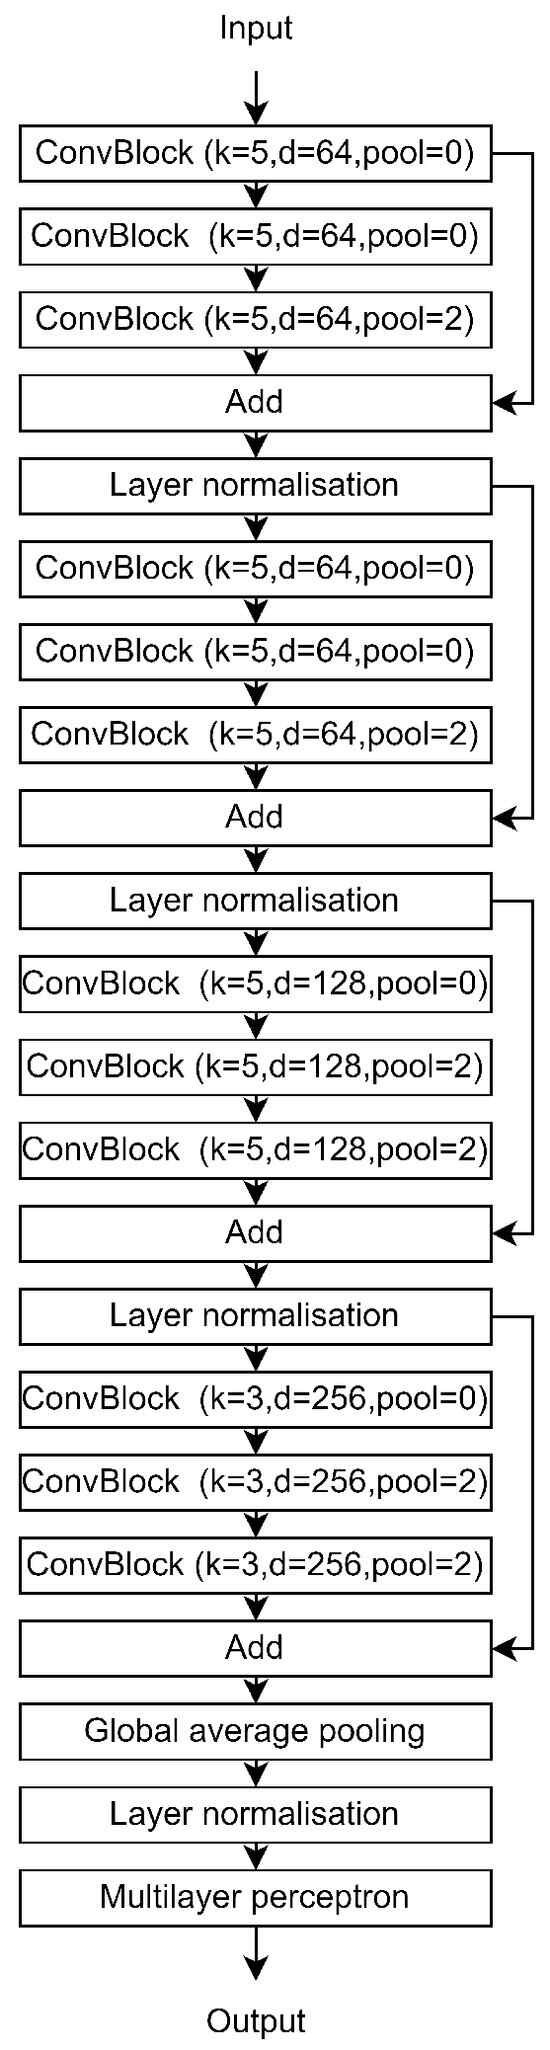
Figure A4.
Presentation of our proposed HTCE architecture. k and d correspond to the kernel size and the filters. Finally, pool corresponds to the pool size of the max-pooling layer of each ConvBlock.
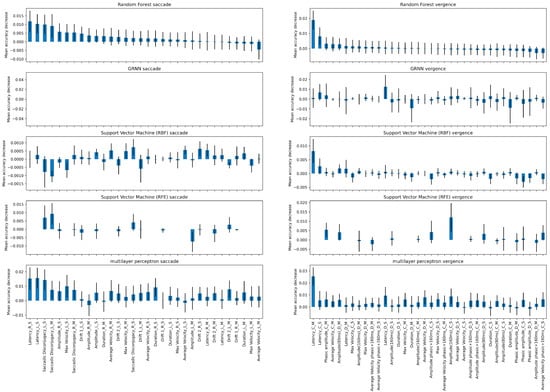
Figure A5.
An overview of feature importance estimation using the permutation test algorithm for each machine learning model and across different visual tasks. Please note that the 8 suffixes C, D, L and R correspond to conjugate, disconjugate, left, and right saccade. Additionally, M and S correspond to the mean and the std.
References
- Ward, L.M.; Kapoula, Z. Creativity, Eye-Movement Abnormalities, and Aesthetic Appreciation of Magritte’s Paintings. Brain Sci. 2022, 12, 1028. [Google Scholar] [CrossRef]
- Ward, L.M.; Kapoula, Z. Differential diagnosis of vergence and saccade disorders in dyslexia. Sci. Rep. 2020, 10, 22116. [Google Scholar] [CrossRef]
- El Hmimdi, A.E.; Ward, L.M.; Palpanas, T.; Kapoula, Z. Predicting dyslexia and reading speed in adolescents from eye movements in reading and non-reading tasks: A machine learning approach. Brain Sci. 2021, 11, 1337. [Google Scholar] [CrossRef]
- El Hmimdi, A.E.; Ward, L.M.; Palpanas, T.; Sainte Fare Garnot, V.; Kapoula, Z. Predicting Dyslexia in Adolescents from Eye Movements during Free Painting Viewing. Brain Sci. 2022, 12, 1031. [Google Scholar] [CrossRef]
- Nilsson Benfatto, M.; Öqvist Seimyr, G.; Ygge, J.; Pansell, T.; Rydberg, A.; Jacobson, C. Screening for dyslexia using eye tracking during reading. PLoS ONE 2016, 11, e0165508. [Google Scholar] [CrossRef]
- Asvestopoulou, T.; Manousaki, V.; Psistakis, A.; Smyrnakis, I.; Andreadakis, V.; Aslanides, I.M.; Papadopouli, M. Dyslexml: Screening tool for dyslexia using machine learning. arXiv 2019, arXiv:1903.06274. [Google Scholar]
- Jothi Prabha, A.; Bhargavi, R. Prediction of dyslexia from eye movements using machine learning. IETE J. Res. 2022, 68, 814–823. [Google Scholar] [CrossRef]
- Vajs, I.A.; Kvaščev, G.S.; Papić, T.M.; Janković, M.M. Eye-tracking Image Encoding: Autoencoders for the Crossing of Language Boundaries in Developmental Dyslexia Detection. IEEE Access 2023, 11, 3024–3033. [Google Scholar] [CrossRef]
- Nerušil, B.; Polec, J.; Škunda, J.; Kačur, J. Eye tracking based dyslexia detection using a holistic approach. Sci. Rep. 2021, 11, 15687. [Google Scholar] [CrossRef] [PubMed]
- Pooch, E.H.; Ballester, P.; Barros, R.C. Can we trust deep learning based diagnosis? The impact of domain shift in chest radiograph classification. In Proceedings of the Thoracic Image Analysis: Second International Workshop, TIA 2020, Held in Conjunction with MICCAI 2020, Lima, Peru, 8 October 2020; Springer: Berlin/Heidelberg, Germany, 2020; pp. 74–83. [Google Scholar]
- Smyrnakis, I.; Andreadakis, V.; Selimis, V.; Kalaitzakis, M.; Bachourou, T.; Kaloutsakis, G.; Kymionis, G.D.; Smirnakis, S.; Aslanides, I.M. RADAR: A novel fast-screening method for reading difficulties with special focus on dyslexia. PLoS ONE 2017, 12, e0182597. [Google Scholar] [CrossRef] [PubMed]
- Rello, L.; Ballesteros, M. Detecting readers with dyslexia using machine learning with eye tracking measures. In Proceedings of the 12th International Web for All Conference, Mallorca, Spain, 20–23 September 2015; pp. 1–8. [Google Scholar]
- Bixler, R.; D’Mello, S. Automatic gaze-based user-independent detection of mind wandering during computerized reading. User Model. -User-Adapt. Interact. 2016, 26, 33–68. [Google Scholar] [CrossRef]
- Skaramagkas, V.; Ktistakis, E.; Manousos, D.; Kazantzaki, E.; Tachos, N.S.; Tripoliti, E.; Fotiadis, D.I.; Tsiknakis, M. eSEE-d: Emotional State Estimation Based on Eye-Tracking Dataset. Brain Sci. 2023, 13, 589. [Google Scholar] [CrossRef]
- JothiPrabha, A.; Bhargavi, R.; Rani, B.D. Prediction of dyslexia severity levels from fixation and saccadic eye movement using machine learning. Biomed. Signal Process. Control. 2023, 79, 104094. [Google Scholar] [CrossRef]
- Rizzo, A.; Ermini, S.; Zanca, D.; Bernabini, D.; Rossi, A. A machine learning approach for detecting cognitive interference based on eye-tracking data. Front. Hum. Neurosci. 2022, 16, 806330. [Google Scholar] [CrossRef]
- Ktistakis, E.; Skaramagkas, V.; Manousos, D.; Tachos, N.S.; Tripoliti, E.; Fotiadis, D.I.; Tsiknakis, M. COLET: A dataset for COgnitive workLoad estimation based on eye-tracking. Comput. Methods Programs Biomed. 2022, 224, 106989. [Google Scholar] [CrossRef]
- Vajs, I.; Ković, V.; Papić, T.; Savić, A.M.; Janković, M.M. Spatiotemporal eye-tracking feature set for improved recognition of dyslexic reading patterns in children. Sensors 2022, 22, 4900. [Google Scholar] [CrossRef]
- Hutt, S.; Hardey, J.; Bixler, R.; Stewart, A.; Risko, E.; D’Mello, S.K. Gaze-Based Detection of Mind Wandering during Lecture Viewing. In Proceedings of the International Educational Data Mining Society, Paper presented at the International Conference on Educational Data Mining (EDM), Wuhan, China, 25–28 June 2017. [Google Scholar]
- Vajs, I.; Ković, V.; Papić, T.; Savić, A.M.; Janković, M.M. Dyslexia detection in children using eye tracking data based on VGG16 network. In Proceedings of the 2022 30th European Signal Processing Conference (EUSIPCO), Belgrade, Serbia, 29 August–2 September 2022; IEEE: Piscataway, NJ, USA, 2022; pp. 1601–1605. [Google Scholar]
- Uribarri, G.; von Huth, S.E.; Waldthaler, J.; Svenningsson, P.; Fransén, E. Deep Learning for Time Series Classification of Parkinson’s Disease Eye Tracking Data. arXiv 2023, arXiv:2311.16381. [Google Scholar]
- Sun, J.; Liu, Y.; Wu, H.; Jing, P.; Ji, Y. A novel deep learning approach for diagnosing Alzheimer’s disease based on eye-tracking data. Front. Hum. Neurosci. 2022, 16, 972773. [Google Scholar] [CrossRef]
- Elbattah, M.; Guérin, J.L.; Carette, R.; Cilia, F.; Dequen, G. NLP-Based Approach to Detect Autism Spectrum Disorder in Saccadic Eye Movement. In Proceedings of the 2020 IEEE Symposium Series on Computational Intelligence (SSCI), Canberra, Australia, 1–4 December 2020; IEEE: Piscataway, NJ, USA, 2020; pp. 1581–1587. [Google Scholar]
- Chen, S.; Zhao, Q. Attention-based autism spectrum disorder screening with privileged modality. In Proceedings of the IEEE/CVF International Conference on Computer Vision, Seoul, Republic of Korea, 27 October–2 November 2019; pp. 1181–1190. [Google Scholar]
- Jiang, M.; Zhao, Q. Learning visual attention to identify people with autism spectrum disorder. In Proceedings of the IEEE International Conference on Computer Vision, Venice, Italy, 22–20 October 2017; pp. 3267–3276. [Google Scholar]
- Zemblys, R.; Niehorster, D.C.; Holmqvist, K. gazeNet: End-to-end eye-movement event detection with deep neural networks. Behav. Res. Methods 2019, 51, 840–864. [Google Scholar] [CrossRef]
- Cole, Z.; Kuntzelman, K.; Dodd, M.D.; Johnson, M.R. Convolutional neural networks can decode eye movement data: A black box approach to predicting task from eye movements. J. Vis. 2020, 21, 9. [Google Scholar] [CrossRef]
- Uppal, K.; Kim, J.; Singh, S. Decoding Attention from Gaze: A Benchmark Dataset and End-to-End Models. In Proceedings of the Annual Conference on Neural Information Processing Systems, New Orleans, LA, USA, 10–16 December 2023; pp. 219–240. [Google Scholar]
- Tao, Y.; Shyu, M.L. SP-ASDNet: CNN-LSTM based ASD classification model using observer scanpaths. In Proceedings of the 2019 IEEE International Conference on Multimedia & Expo Workshops (ICMEW), Shanghai, China, 8–12 July 2019; IEEE: Piscataway, NJ, USA, 2019; pp. 641–646. [Google Scholar]
- Bautista, L.G.C.; Naval, P.C. Gazemae: General representations of eye movements using a micro-macro autoencoder. In Proceedings of the 2020 25th International Conference on Pattern Recognition (ICPR), Milan, Italy, 10–15 January 2021; IEEE: Piscataway, NJ, USA, 2021; pp. 7004–7011. [Google Scholar]
- Bautista, L.G.C.; Naval, P.C. CLRGaze: Contrastive Learning of Representations for Eye Movement Signals. In Proceedings of the 2021 29th European Signal Processing Conference (EUSIPCO), Dublin, Ireland, 23–27 August 2021; IEEE: Piscataway, NJ, USA, 2021; pp. 1241–1245. [Google Scholar]
- Lee, S.W.; Kim, S. Detection of Abnormal Behavior with Self-Supervised Gaze Estimation. arXiv 2021, arXiv:2107.06530. [Google Scholar]
- Harisinghani, A.; Sriram, H.; Conati, C.; Carenini, G.; Field, T.; Jang, H.; Murray, G. Classification of Alzheimer’s using Deep-learning Methods on Webcam-based Gaze Data. Proc. ACM Hum.-Comput. Interact. 2023, 7, 1–17. [Google Scholar] [CrossRef]
- Ahmed, I.A.; Senan, E.M.; Rassem, T.H.; Ali, M.A.; Shatnawi, H.S.A.; Alwazer, S.M.; Alshahrani, M. Eye tracking-based diagnosis and early detection of autism spectrum disorder using machine learning and deep learning techniques. Electronics 2022, 11, 530. [Google Scholar] [CrossRef]
- Pupila Capture Eye Tracker. Available online: http://https://pupil-labs.com/ (accessed on 13 April 2023).
- Yu, F.; Koltun, V. Multi-scale context aggregation by dilated convolutions. arXiv 2015, arXiv:1511.07122. [Google Scholar]
- Gridach, M.; Voiculescu, I. OXENDONET: A dilated convolutional neural networks for endoscopic artefact segmentation. In Proceedings of the CEUR Workshop Proceedings, Padua, Italy, 4–9 October 2020; Volume 2595. [Google Scholar]
- Stein, J.F. Does dyslexia exist? Lang. Cogn. Neurosci. 2018, 33, 313–320. [Google Scholar] [CrossRef]
- Stein, J. What is developmental dyslexia? Brain Sci. 2018, 8, 26. [Google Scholar] [CrossRef]
- Elliott, J.G.; Gibbs, S. Does dyslexia exist? J. Philos. Educ. 2008, 42, 475–491. [Google Scholar] [CrossRef]
- Kapoula, Z.; Morize, A.; Daniel, F.; Jonqua, F.; Orssaud, C.; Bremond-Gignac, D. Objective evaluation of vergence disorders and a research-based novel method for vergence rehabilitation. Transl. Vis. Sci. Technol. 2016, 5, 8. [Google Scholar] [CrossRef]
- Daniel, F.; Morize, A.; Brémond-Gignac, D.; Kapoula, Z. Benefits from vergence rehabilitation: Evidence for improvement of reading saccades and fixations. Front. Integr. Neurosci. 2016, 10, 33. [Google Scholar] [CrossRef]
- Deane, O.; Toth, E.; Yeo, S.H. Deep-SAGA: A deep-learning-based system for automatic gaze annotation from eye-tracking data. Behav. Res. Methods 2023, 55, 1372–1391. [Google Scholar] [CrossRef]
- Ghosh, S.; Dhall, A.; Hayat, M.; Knibbe, J.; Ji, Q. Automatic gaze analysis: A survey of deep learning based approaches. IEEE Trans. Pattern Anal. Mach. Intell. 2023, 46, 61–84. [Google Scholar] [CrossRef] [PubMed]
- Bao, Y.; Liu, Y.; Wang, H.; Lu, F. Generalizing gaze estimation with rotation consistency. In Proceedings of the IEEE/CVF Conference on Computer Vision and Pattern Recognition, New Orleans, LA, USA, 18–24 June 2022; pp. 4207–4216. [Google Scholar]
- Sun, Y.; Zeng, J.; Shan, S. Gaze estimation with semi-supervised eye landmark detection as an auxiliary task. Pattern Recognit. 2024, 146, 109980. [Google Scholar] [CrossRef]
- Lin, Z.; Liu, Y.; Wang, H.; Liu, Z.; Cai, S.; Zheng, Z.; Zhou, Y.; Zhang, X. An eye tracker based on webcam and its preliminary application evaluation in Chinese reading tests. Biomed. Signal Process. Control. 2022, 74, 103521. [Google Scholar] [CrossRef]
- Jiang, H.; Hou, Y.; Miao, H.; Ye, H.; Gao, M.; Li, X.; Jin, R.; Liu, J. Eye tracking based deep learning analysis for the early detection of diabetic retinopathy: A pilot study. Biomed. Signal Process. Control. 2023, 84, 104830. [Google Scholar] [CrossRef]
- Wang, S.; Ouyang, X.; Liu, T.; Wang, Q.; Shen, D. Follow my eye: Using gaze to supervise computer-aided diagnosis. IEEE Trans. Med. Imaging 2022, 41, 1688–1698. [Google Scholar] [CrossRef] [PubMed]
Disclaimer/Publisher’s Note: The statements, opinions and data contained in all publications are solely those of the individual author(s) and contributor(s) and not of MDPI and/or the editor(s). MDPI and/or the editor(s) disclaim responsibility for any injury to people or property resulting from any ideas, methods, instructions or products referred to in the content. |
© 2024 by the authors. Licensee MDPI, Basel, Switzerland. This article is an open access article distributed under the terms and conditions of the Creative Commons Attribution (CC BY) license (https://creativecommons.org/licenses/by/4.0/).