Article

Explainable AI-Based Identification of Contributing Factors to the Mood State Change in Children and Adolescents with Pre-Existing Psychiatric Disorders in the Context of COVID-19-Related Lockdowns in Greece

by
Charis Ntakolia
1,*,
Dimitrios Priftis
1,
Konstantinos Kotsis
2,
Konstantina Magklara
3,
Mariana Charakopoulou-Travlou
1,
Ioanna Rannou
1,
Konstantina Ladopoulou
4,
Iouliani Koullourou
5,
Emmanouil Tsalamanios
6,
Eleni Lazaratou
3,
Aspasia Serdari
7,
Aliki Grigoriadou
8,
Neda Sadeghi
9,
Kenny Chiu
10 and
Ioanna Giannopoulou
11
1
University Mental Health Research Institute, 11527 Athens, Greece
2
Department of Psychiatry, Faculty of Medicine, School of Health Sciences, University of Ioannina, 45110 Ioannina, Greece
3
First Psychiatric Department, Eginition Hospital, National and Kapodistrian University of Athens, 11528 Athens, Greece
4
Athens Child and Adolescent Mental Health Centre, General Children’s Hospital ‘Pan. & Aglaia Kyriakou’, 11527 Athens, Greece
5
Mental Health Center, General Hospital ‘G. Hatzikosta’, 45445 Ioannina, Greece
6
Department of Child and Adolescent Psychiatry, Division of Psychiatry, ‘Asklepieion Voulas’ General Hospital, 16673 Attica, Greece
7
Department of Child and Adolescent Psychiatry, Medical School, University Hospital of Alexandroupolis, Democritus University of Thrace, 68100 Alexandroupolis, Greece
8
Hellenic Centre for Mental Health and Research, 10683 Athens, Greece
9
Section of Clinical and Computational Psychiatry, National Institute of Mental Health, National Institutes of Health, 6001 Executive Boulevard, MSC 9663, Bethesda, MD 20892-9663, USA
10
Norwich Research Park, Norwich Medical School, University of East Anglia, Norwich NR4 7TJ, UK
11
Second Psychiatric Department, ‘Attikon’ University Hospital, National and Kapodistrian University of Athens, 12462 Athens, Greece
*
Author to whom correspondence should be addressed.
BioMedInformatics 2023, 3(4), 1040-1059; https://doi.org/10.3390/biomedinformatics3040062
Submission received: 3 July 2023 / Revised: 29 July 2023 / Accepted: 23 October 2023 / Published: 7 November 2023

Abstract

:
The COVID-19 pandemic and its accompanying restrictions have significantly impacted people’s lives globally. There is an increasing interest in examining the influence of this unprecedented situation on our mental well-being, with less attention towards the impact of the elongation of COVID-19-related measures on youth with a pre-existing psychiatric/developmental disorder. The majority of studies focus on individuals, such as students, adults, and youths, among others, with little attention being given to the elongation of COVID-19-related measures and their impact on a special group of individuals, such as children and adolescents with diagnosed developmental and psychiatric disorders. In addition, most of these studies adopt statistical methodologies to identify pair-wise relationships among factors, an approach that limits the ability to understand and interpret the impact of various factors. In response, this study aims to adopt an explainable machine learning approach to identify factors that explain the deterioration or amelioration of mood state in a youth clinical sample. The purpose of this study is to identify and interpret the impact of the greatest contributing features of mood state changes on the prediction output via an explainable machine learning pipeline. Among all the machine learning classifiers, the Random Forest model achieved the highest effectiveness, with 76% best AUC-ROC Score and 13 features. The explainability analysis showed that stress or positive changes derived from the imposing restrictions and COVID-19 pandemic are the top two factors that could affect mood state.

1. Introduction

The 2019 coronavirus disease (COVID-19) outbreak and accompanying public health measures, enforced to mitigate the risk of exponential virus transmission, have brought on unprecedented changes to people’s day-to-day life [1,2]. Since the early days the COVID-19 pandemic has been recognized as having potential mental health impact, particularly for vulnerable population groups [3] and was described as a ‘perfect storm’ with exposure to known risks and lack of support affecting the mental health of young people and their families [4,5]. Stringent restriction measures such as social distancing, the lack of face-to-face contact with peers and teachers due to school closures, and changes to daily behaviors (e.g., decreased physical activity, increased screen time, irregular sleep patterns, overeating) are some of the identified pandemic-related stressors that have negatively impacted children’s mental health globally [6,7,8].
Several studies have investigated the prevalence rates of mental health problems in adolescent general population samples [9]. A meta-analysis that summarized the results of 29 studies conducted worldwide reported global prevalence estimates of child and adolescent depression and anxiety to have doubled during the first year of the COVID-19 pandemic, compared to pre-pandemic estimates, with 1 in 4 youth experiencing clinically elevated depression symptoms and 1 in 5 youth experiencing clinically elevated anxiety symptoms [10]. Two longitudinal surveys in Germany found that up to 30.1% of 11–17-year-olds had symptoms of generalized anxiety compared with 14.9% before the pandemic [9]. Notably, feelings of loneliness was one of the symptoms most frequently experienced by youth during the early waves of pandemic, particularly during the lockdowns [11], which were associated with higher levels of all mental health difficulties [12,13]. A systematic review of 21 studies from 11 countries, including individuals aged 3–24 years, showed increased depression, anxiety, and psychological distress levels during the initial phase of the pandemic. Also, deteriorated negative affect, psychological well-being, and increased loneliness were reported [14].
In terms of demographic variables, research findings so far point to sex and age differences in the mental health impact of COVID-19 in youth. In several studies, females were reported to be at a higher risk for higher levels and/or greater increases in internalizing, anxiety and depressive symptoms, stress, and lower levels of well-being than males. Concurrently, males were observed to display more attention problems, addictive gameplay behaviors, and sharper decreases in quality of life and life satisfaction than females. Most of these gender differences were almost exclusively found in adolescent samples [15]. Concerning age, the results were inconclusive. Some studies reported higher rates for depression and anxiety in adolescents (i.e., individuals 12–18 years of age) compared to children [16], whereas other studies did not observe an age effect on the severity of psychological problems [17,18]. Additional demographic factors reported to be associated with child mental health outcomes are living in rural areas and loss of family income [19,20].
Other factors that were found to be associated with increased levels of emotional and behavior difficulties included excessive use of video games and social media and exposure to pandemic-related news [21]; COVID-19-related worries and increased conflict with parents were found to predict increases in mental health problems from prior to pandemic onset to two months after introduction of the lockdown, whereas adherence to stay-at-home orders, feeling socially connected during the COVID-19 lockdown, and a good parent–child relationship were found to be linked with a lower risk of mental health problems [12].
In terms of pre-existing psychiatric or developmental disorder various clinicians and researchers, as well as policy makers, have expressed their early concerns about the COVD-19 pandemic’s impact on the mental health of this vulnerable youth population [22]. Studies utilizing clinical samples of children and adolescents with or at risk for developing a psychiatric disorder showed that some symptoms increased and other decreased or remained relatively stable as compared to the pre-pandemic period [23,24,25,26]. Specifically, exacerbation of obsessive compulsive disorder (OCD) symptoms [27], worsening of attention deficit hyperactivity (ADHD) symptoms [28], deterioration of behavioral problems and anxiety among young people with autism spectrum disorders [29], and reactivation of eating disorder (ED) symptoms [30] during COVID-19 confinement were reported; however, other studies indicated no deterioration of the clinical condition [26].
In a multi-country clinical sample during the early phase of the pandemic COVID-related worry, parental emotional difficulties and the quality of parent–child relationships were found to predict higher levels of emotional and behavioral difficulties [31]. A systematic review of the impact of the COVID-19 lockdown on child and adolescent mental health highlighted that those with pre-existing mental health difficulties and/or neurodevelopmental disorders suffered increased stress [8].
While prior survey-study work has helped to recognize the impact of the COVID-19 pandemic on mental health and well-being of children and adolescents, research in this area has mainly adopted cross-sectional designs, utilized general and at-risk population or clinical samples, and used traditional inferential statistical analysis. In contrast to traditional statistical analysis, the artificial intelligence approach followed by a post hoc explainability analysis (XAI) provides a higher level of interpretability, recognizes patterns in complex datasets, and allows for better inference of the contribution of the most important features to the prediction output [32,33]. The results of a longitudinal cohort (convenience sample drawn from general population) study in US and UK, using the Coronavirus Health Impact Survey (CRISIS) questionnaire, derived from a conditional random forest approach for data analysis revealed that lifestyle changes and stress regarding friendships were the most important predictive factors of mood state outcomes in children with no pre-existing mental health conditions [34].
A recently published Greek study concerning the first wave of the COVID-19 pandemic employed an explainable ML approach in a heterogeneous clinical sample, using the CRISIS questionnaire. The results indicated that about 77% of children maintained stable mood states or presented positive mood state changes during the pandemic-related lockdown. This outcome was mostly predicted by positive changes experienced in children’s lives due to the COVID-19 pandemic, better relationships among family members, less time spent on watching TV, and less stress derived from the restrictive measures [35]. In order to evaluate how the mood states of children in the above clinical sample were impacted by the second wave of the pandemic that led to a six-month lockdown, i.e., if they got worse, better, or if they remained stable, a follow-up study was conducted using the same methodology. In this context, we analyzed parent-reported data of a large set of variables (Table 1 and Table 2), which were collected during the 1st six-week lockdown (Wave 1) and during the 2nd six-month lockdown (Wave 2) in a clinical sample to answer the question of whether the elongation of the 2nd lockdown affected the mood states of children and adolescents with pre-existing psychiatric disorders. We used a XAI pipeline to identify and quantify factors associated with mood states stability or change, either positive or negative, from the 1st to the 2nd lockdown (Figure 1).
The main objectives of the current study are (a) to determine the most accurate prediction model through a comparative evaluation of seven popular ML classification algorithms; and (b) to identify and interpret the contribution of the most important factors to the prediction of mood states outcome, i.e., amelioration/stability or deterioration.

2. Materials and Methods

2.1. Participants and Procedure

A total of 738 parents of children and adolescents with pre-pandemic psychiatric or developmental diagnosis attending 12 outpatient child and adolescent mental health services (CAMHS) across four geographical regions in Greece who participated in the first wave data collection (9 May to 1 June 2020) during the 1st national lockdown were invited to complete the same survey questionnaire during the 2nd lockdown (16 December 2020, to 8 February 2021). The response rate was 40.5% (N = 299). Table 1 presents the sociodemographic data of the sample.
All parents who took part in the survey during the 1st lockdown were sent an email containing information about the study, along with the same unique identification code number used in the first survey and the link to log into the Google Forms Survey app. After reading the information about the goals of the study, the process of data collection and confidentiality, and providing informed consent online they proceeded answering the questionnaire. The study was approved by the Ethics Committee of each hospital, with which the CAMHS is affiliated.

2.2. Measures

Demographic information included questions about children’s age, sex, area of living, and pre-pandemic primary diagnosis code according to the International Classification of Diseases, 10th Revision (ICD-10; World Health Organization, 1992 [36]), assigned by clinicians during the first wave of data collection [25].

2.3. Mood States

Ten items from the CoRonavIruS Health Impact Survey (CRISIS) tool were used to measure the following emotional reactions in children: sadness, reduced enjoyment in usual activities, general worry, irritability, concentration difficulties, anxiety, loneliness, rumination, restlessness, and fatigue. Parents were asked to rate the frequency of each symptom on their children on a 5-point Likert-type scale, ranging from 0 to 4, during the past 2 weeks. The scores on these ten items were summed to generate the total mood states score (range 0–40), with higher scores indicating worse mood states. The internal consistency of the measure was α = 0.83 and α = 0.7 at the first and the second wave data collection.
COVID-19 impacts on social life, personal life, family life, daily activities, health concerns, daily stresses, physical health (personal and family), disruption of care, and support/extra-curricular activities were derived from 32 items of the CRISIS questionnaire [34] and are presented in Table 2.

2.4. Data Analysis Plan

In this study the impact of the second pandemic-related lockdown was investigated on children and adolescents with diagnosed developmental or psychiatric disorders. To this end, a machine learning pipeline was adopted, which consisted of: (i) data pre-processing; (ii) clustering based on the change in mood state score between the 1st and 2nd lockdowns; (iii) feature selection wrapped with 7 popular classifiers; and (iv) post hoc explainability based on the SHAP model. This approach aimed to identify the greatest contributing features that lead to mood state amelioration or deterioration as a means to diagnose, develop strategies, and prepare for potential upcoming similar events.
Data derived from the questionnaires identified 52 features (Table 2) where 10 were used to define the mood state score during the 1st lockdown and another 10 for the 2nd lockdown (see Section 2.2). The remaining (32) features were analyzed using a wrapper feature selection method for various popular classifiers to identify the most important feature. This led to the development of an accurate classification model to predict the change in mood state of children and adolescents between the 1st and 2nd lockdown in Greece, and to the identification of the most contributing features to the prediction output by using an explainability model.
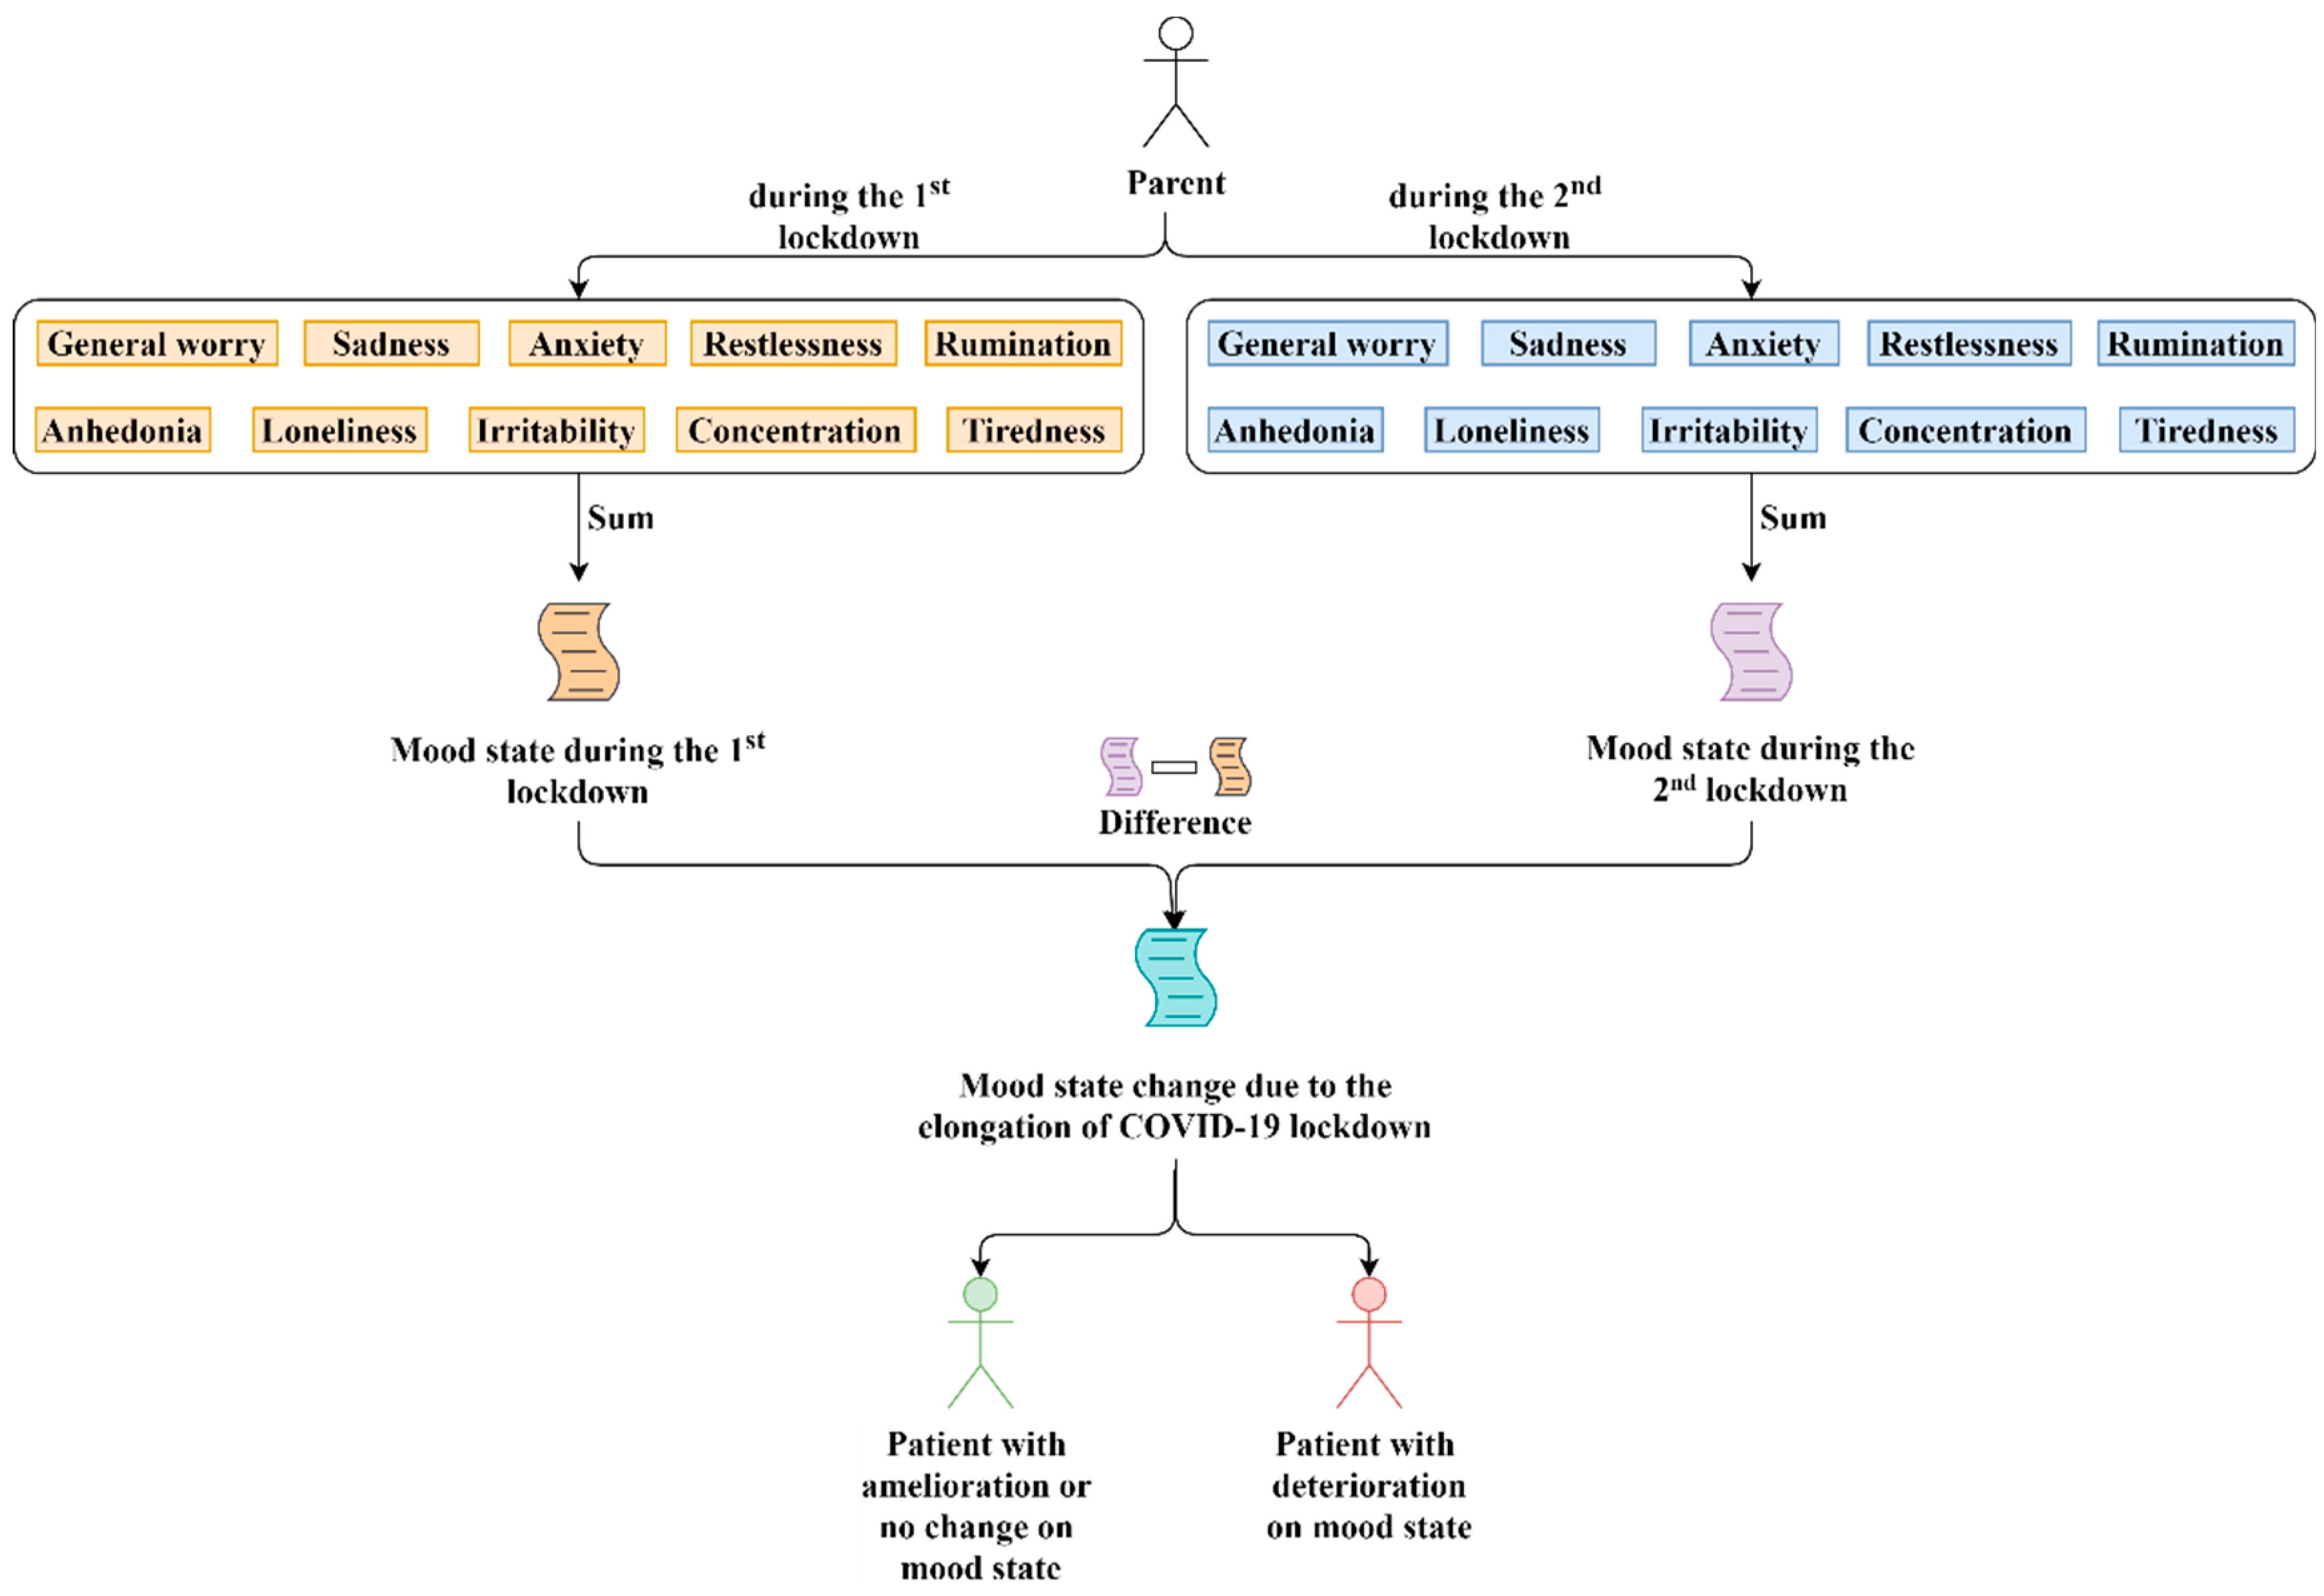
To cluster the subjects the following process, depicted in Figure 2, was followed: (i) the mood state score for the 1st lockdown (Equation (1) and the 2nd lockdown (Equation (2) was calculated by the sum of the variables general_worry, sadness, anxiety, restlessness, anhedonia, loneliness, irritability, concentration, tiredness, and rumination (Table 2); (ii) the change in mood state was defined as the difference between their mood state score during the 2nd and 1st lockdowns in Greece (Equation (3). Therefore, a negative value of the predicted variable mood_change indicated an overall improvement in the subject’s mood state score, while a positive value indicated an overall worsening in the subject’s mood state score. Values equal to zero showed that there was no change in the subject’s mood state score during to the elongation of the lockdown.
l 1 _ m o o d _ s t a t e = l 1 _ g e n e r a l _ w o r r y + l 1 _ s a d n e s s + l 1 _ a n x i e t y + l 1 _ r e s t l e s s n e s s + l 1 _ a n h e d o n i a + l 1 _ l o n e l i n e s s + l 1 _ i r r i t a b i l i t y + l 1 _ c o n c e n t r a t i o n + l 1 _ t i r e d n e s s + l 1 _ r u m i n a t i o n
l 2 _ m o o d _ s t a t e = l 2 _ g e n e r a l _ w o r r y + l 2 _ s a d n e s s + l 2 _ a n x i e t y + l 2 _ r e s t l e s s n e s s + l 2 _ a n h e d o n i a + l 2 _ l o n e l i n e s s + l 2 _ i r r i t a b i l i t y + l 2 _ c o n c e n t r a t i o n + l 2 _ t i r e d n e s s + l 2 _ r u m i n a t i o n
m o o d _ c h a n g e = l 2 _ m o o d _ s t a t e l 1 _ m o o d _ s t a t e
To solve the binary classification problem, seven popular classifiers were employed and tested: Linear Regression (LR); Logistic Regression (LogR); Multi-Layer Perceptron (MLP); LightGBM; Support Vector Machine (SVM) with linear, polynomial, and radial basis function kernel; Random Forest (RF); and Extreme Gradient Boosting (XG Boost). The adopted models are frequently used for medical classification problems while covering various types of prediction models such as tree-based, linear, or neural networks [35,37,38].
Specifically, LR and LogR are used to find a linear relationship between one or more predictors. LogR is a mathematical model that describes the relationship betweem data and a dichotomous dependent variable. The model is based on the logistic function, f x = 1 1 + e x , where x , + and 0 f x 1 . Thus, regardless of the value of x the model is designed to describe the data with a probability in the range of 0 and 1 in a A-shaped graph [39,40].
LightGBM is a gradient boosting framework that uses tree-based learning algorithms. It uses the histogram-based algorithm to speed up the training process, reduce memory usage, and combine advanced network communication to optimize parallel distributed and GPU learning, called the parallel voting decision tree algorithm, and handle large-scale data. LightGBM uses the leaf-wise strategy to find a leaf with largest splitter gain [41,42].
MLP belongs in the category of Artificial Neural Networks (ANN) and it is the most common neural network. MLP is based on a supervised training procedure to generate a nonlinear model for prediction. MLP consists of layers, such as the input layer, output layer, and hidden layers. Thus, MLP is a layered feedforward neural network where the information is transferred unidirectionally from the input layer to the output layer through the hidden layers [43,44].
SVM is another supervised learning model. SVM aims to create a decision boundary, the hyperplane, between two classes which enables the prediction of labels from one or more feature vectors, such that the distance between the closest points of each class, called support vectors, and the hyperplane is maximized [45,46].
RF is an ensemble learning method based on decision trees. RF constructs a large number of decision trees. Each decision tree denotes a class prediction and the class with the most votes represents the model’s prediction [47,48].
XG Boost falls in the category of gradient-boosting decision tree algorithms. Gradient boosting is an algorithm in which new models are created that predict the residuals of prior models and then add them together to make the final prediction. XGBoost is an extendible and cutting-edge application of gradient boosting machines, and it has been proven to push the limits of computing power for boosted trees algorithms. It uses multi-threading of the CPU, which in turn reduces the computing time [49,50,51].
Following the classification process, a post hoc explainability model was applied, such as the Shapley Additive Explanations (SHAP), to rank the features with respect to their impact on the final outputs of the best performed classifier. SHAP calculates optimal Shapley values from the coalitional game theory. These values show how fairly the impact on a model’s prediction is distributed among the features of the dataset. Then, SHAP develops a mini-explainer model that corresponds to a single-row-prediction pair in order to explain how this prediction was achieved [52,53].

2.5. Evaluation Set-Up

The above comparative evaluation of the models, the post hoc, and statistical analyses were coded with Python 3.9 programming language. For the classification models the python package scikit-learn (https://scikit-learn.org/stable/ accessed on May 2022) was used while for the SHAP model the relevant package was employed (https://shap.readthedocs.io/en/latest/ accessed on May 2022).
Table 3 shows the hyperparameters used for tuning each classifier.
The computer used for the tests had 64-bit windows 10 Pro environment, with an AMD Ryzen 7 3800X 8-Core Processor 3.89 GHz and 32 GB RAM.

3. Results and Discussion

Regarding missing data during our prospective (two-wave) survey, a statistical analysis was performed with the non-parametric test, Mann–Whitney U test, or else Wilcoxon rank sum test, between respondents (N = 299) and non-respondents (N = 439) in the second wave data collection. The results revealed differences between the two groups with regard to age, overall mood states score, and living area (Table 4). More specifically, children whose parents dropped out of the study during the 2nd lockdown were older (11.1 ± 4.25) and had significantly lower mood state scores (13.63 ± 7.17) during the first lockdown as compared to those whose parents continued their participation in the study with mean age (9.97 ± 3.38), and mean mood state score (14.42 ± 6.62). Regarding the living area, a higher percentage of participants who had quit the study were living outside of a city.
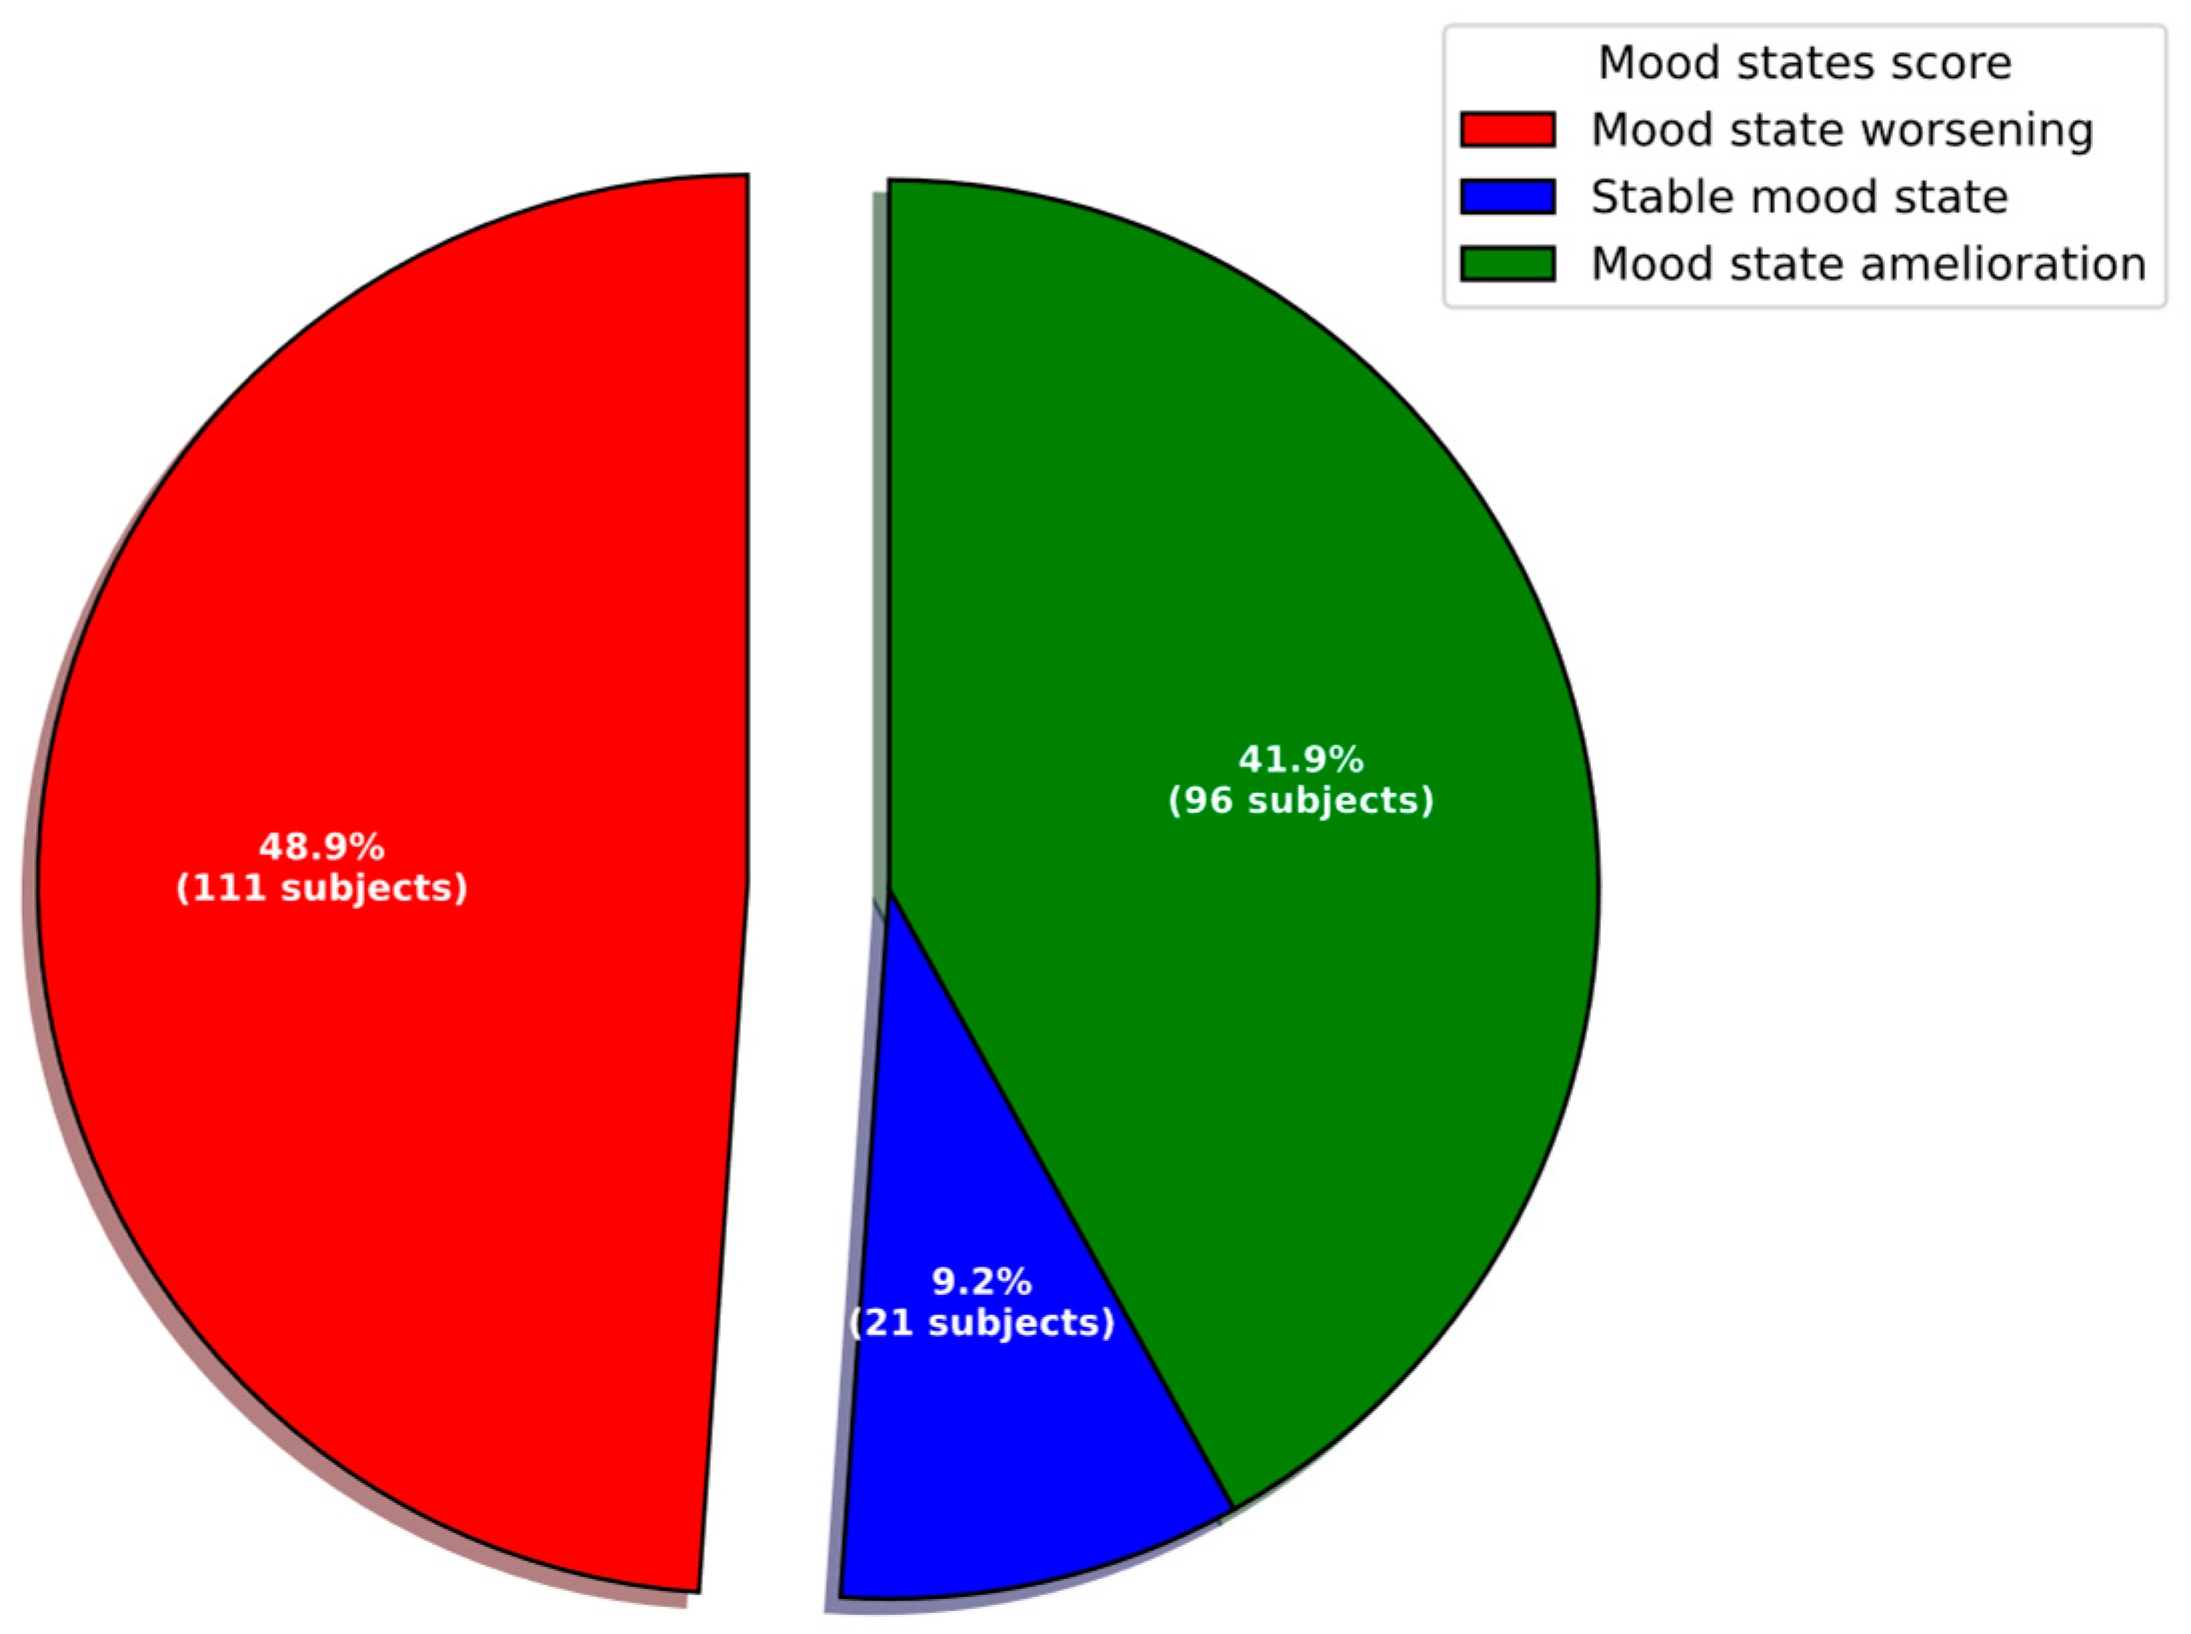
The results are reported on the sample that participated at both time points of data collection. Based on the parent-ratings of child mood states, nearly half of the sample (48.9%) presented with an overall mood state deterioration from the 1st to 2nd lockdown, whereas just over half (51.1%) showed no change or improvement (Figure 3).
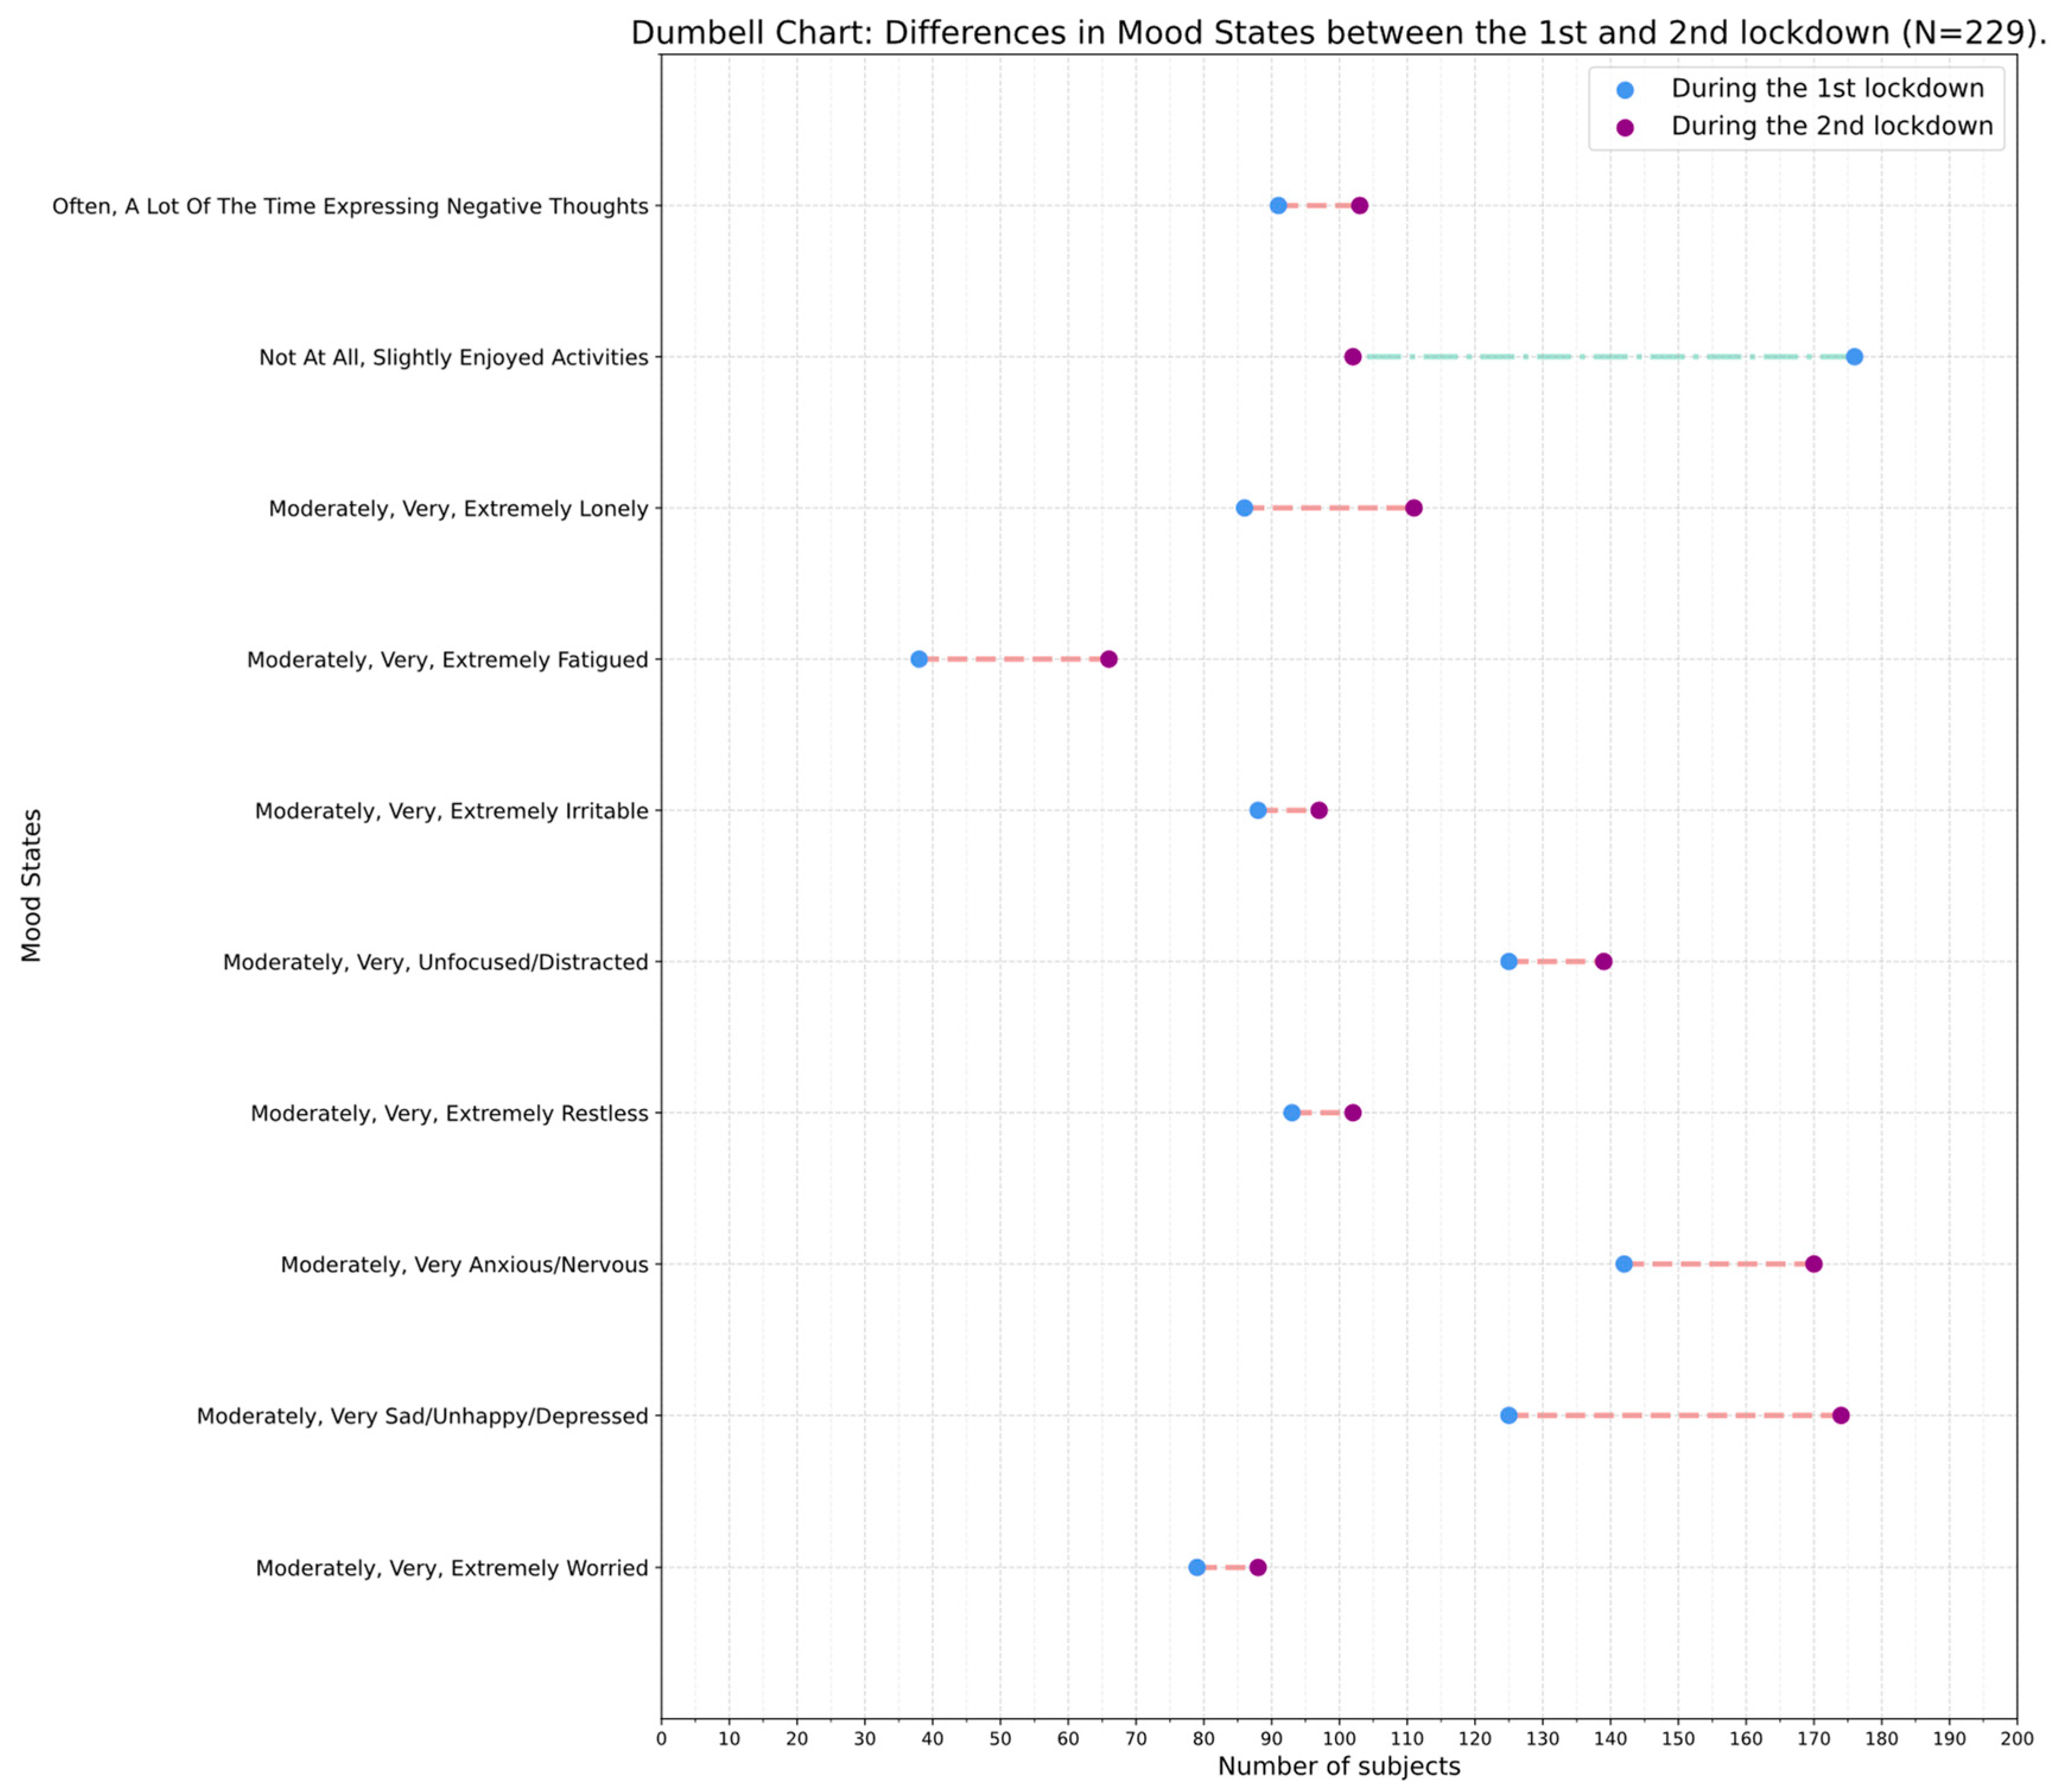
Visual inspection of Figure 4 shows an increase in the number of children who got worse across almost all features that form the overall mood state; interestingly, the number of children reported by their parents to experience “anhedonia” (slight or not at all enjoyment during activities) decreased from the first to the second lockdown. One possible explanation for this finding may be that children and youth during the 2nd lockdown, having experienced the first one, were able to adapt better to restrictions imposed on them through appreciating having more time for themselves to play and initiate new activities of their choice at a pace that suited them.
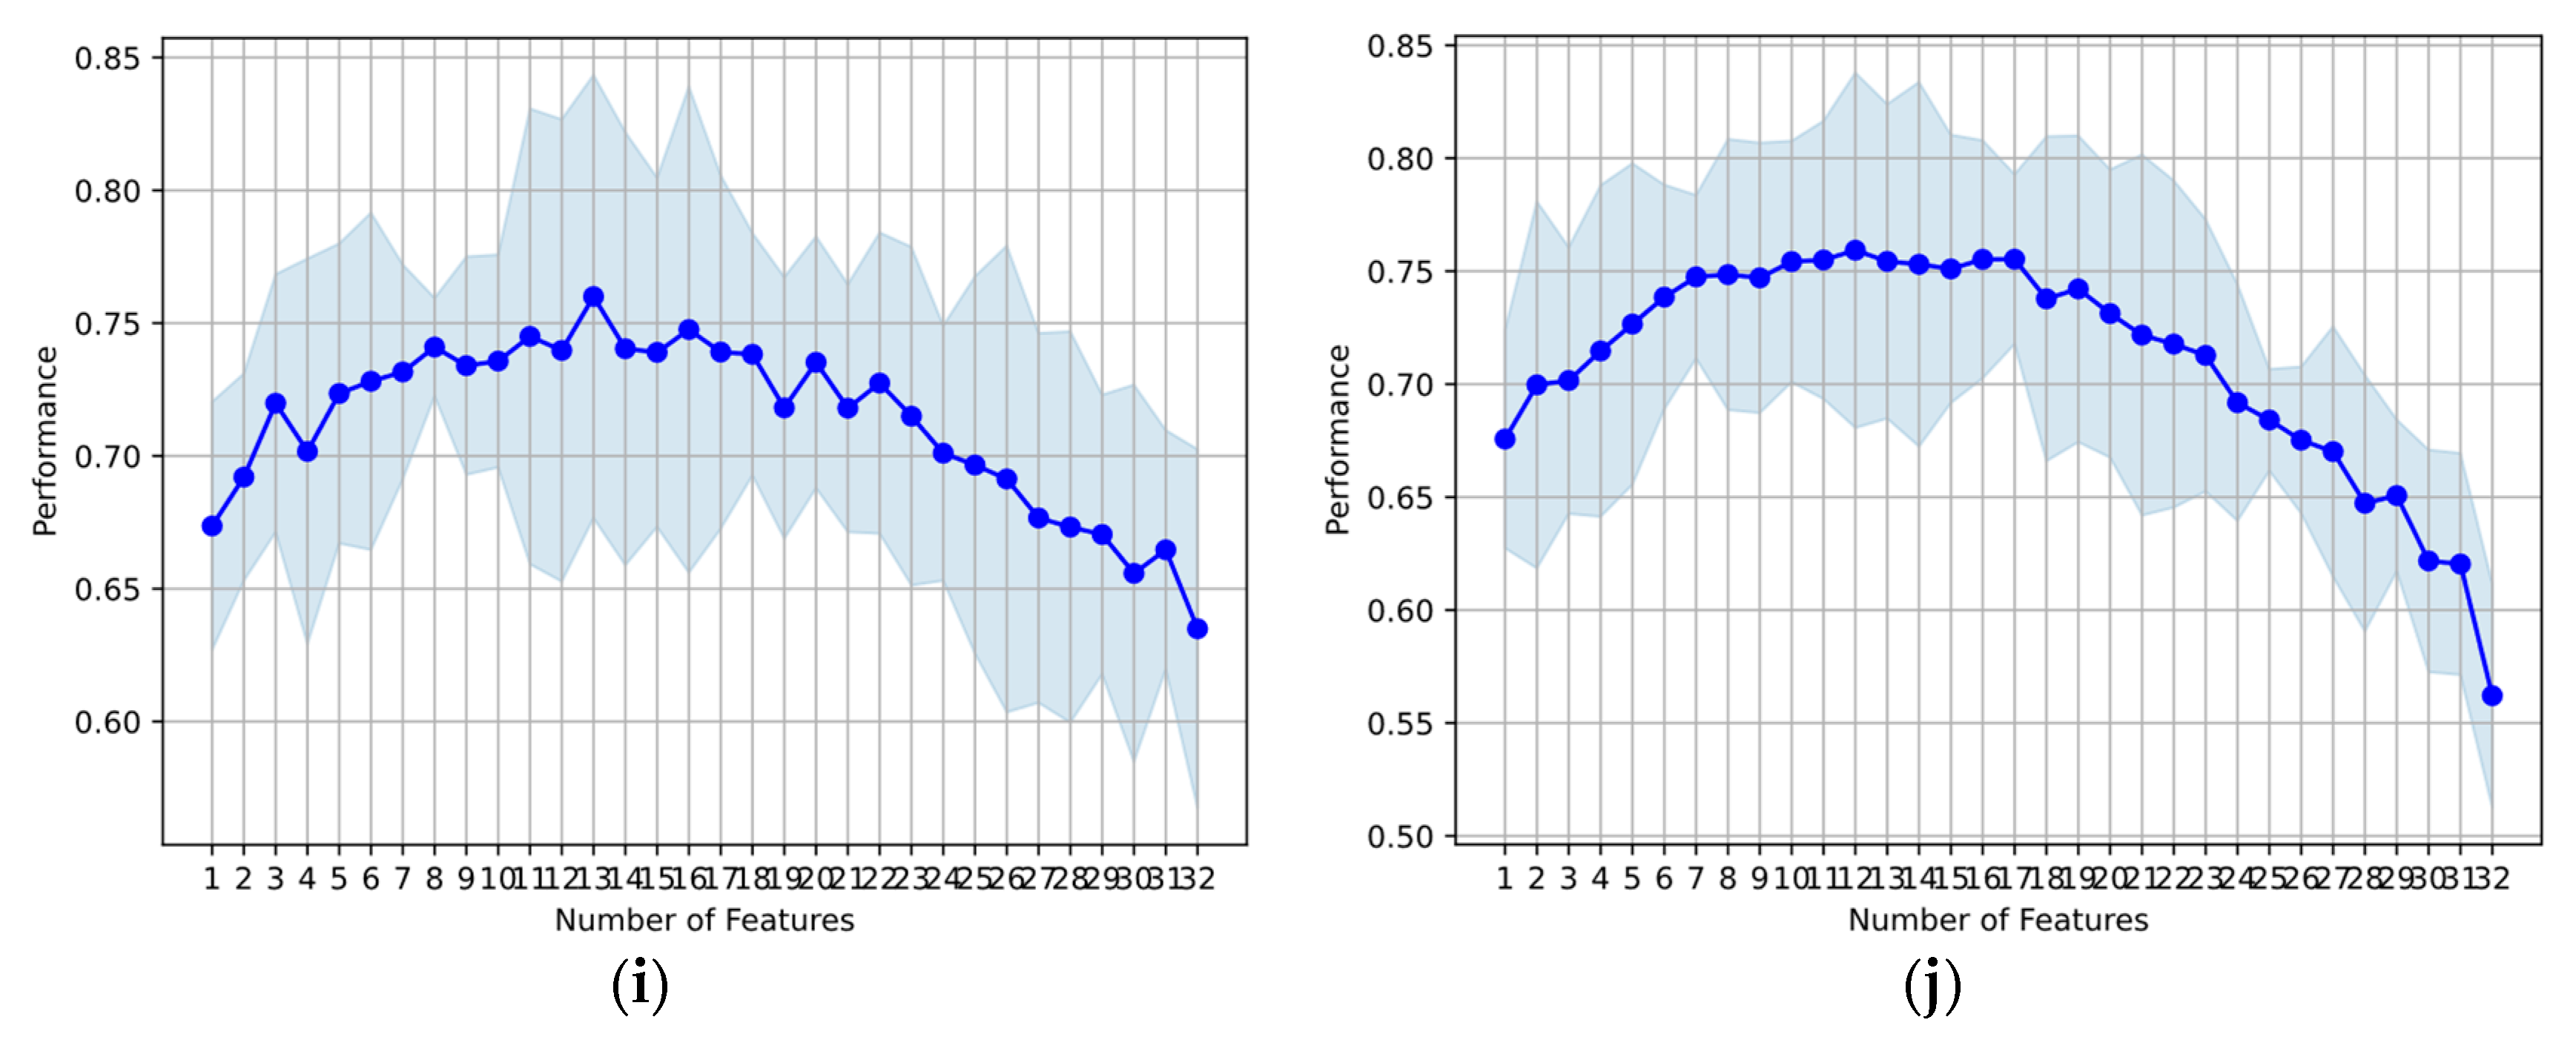
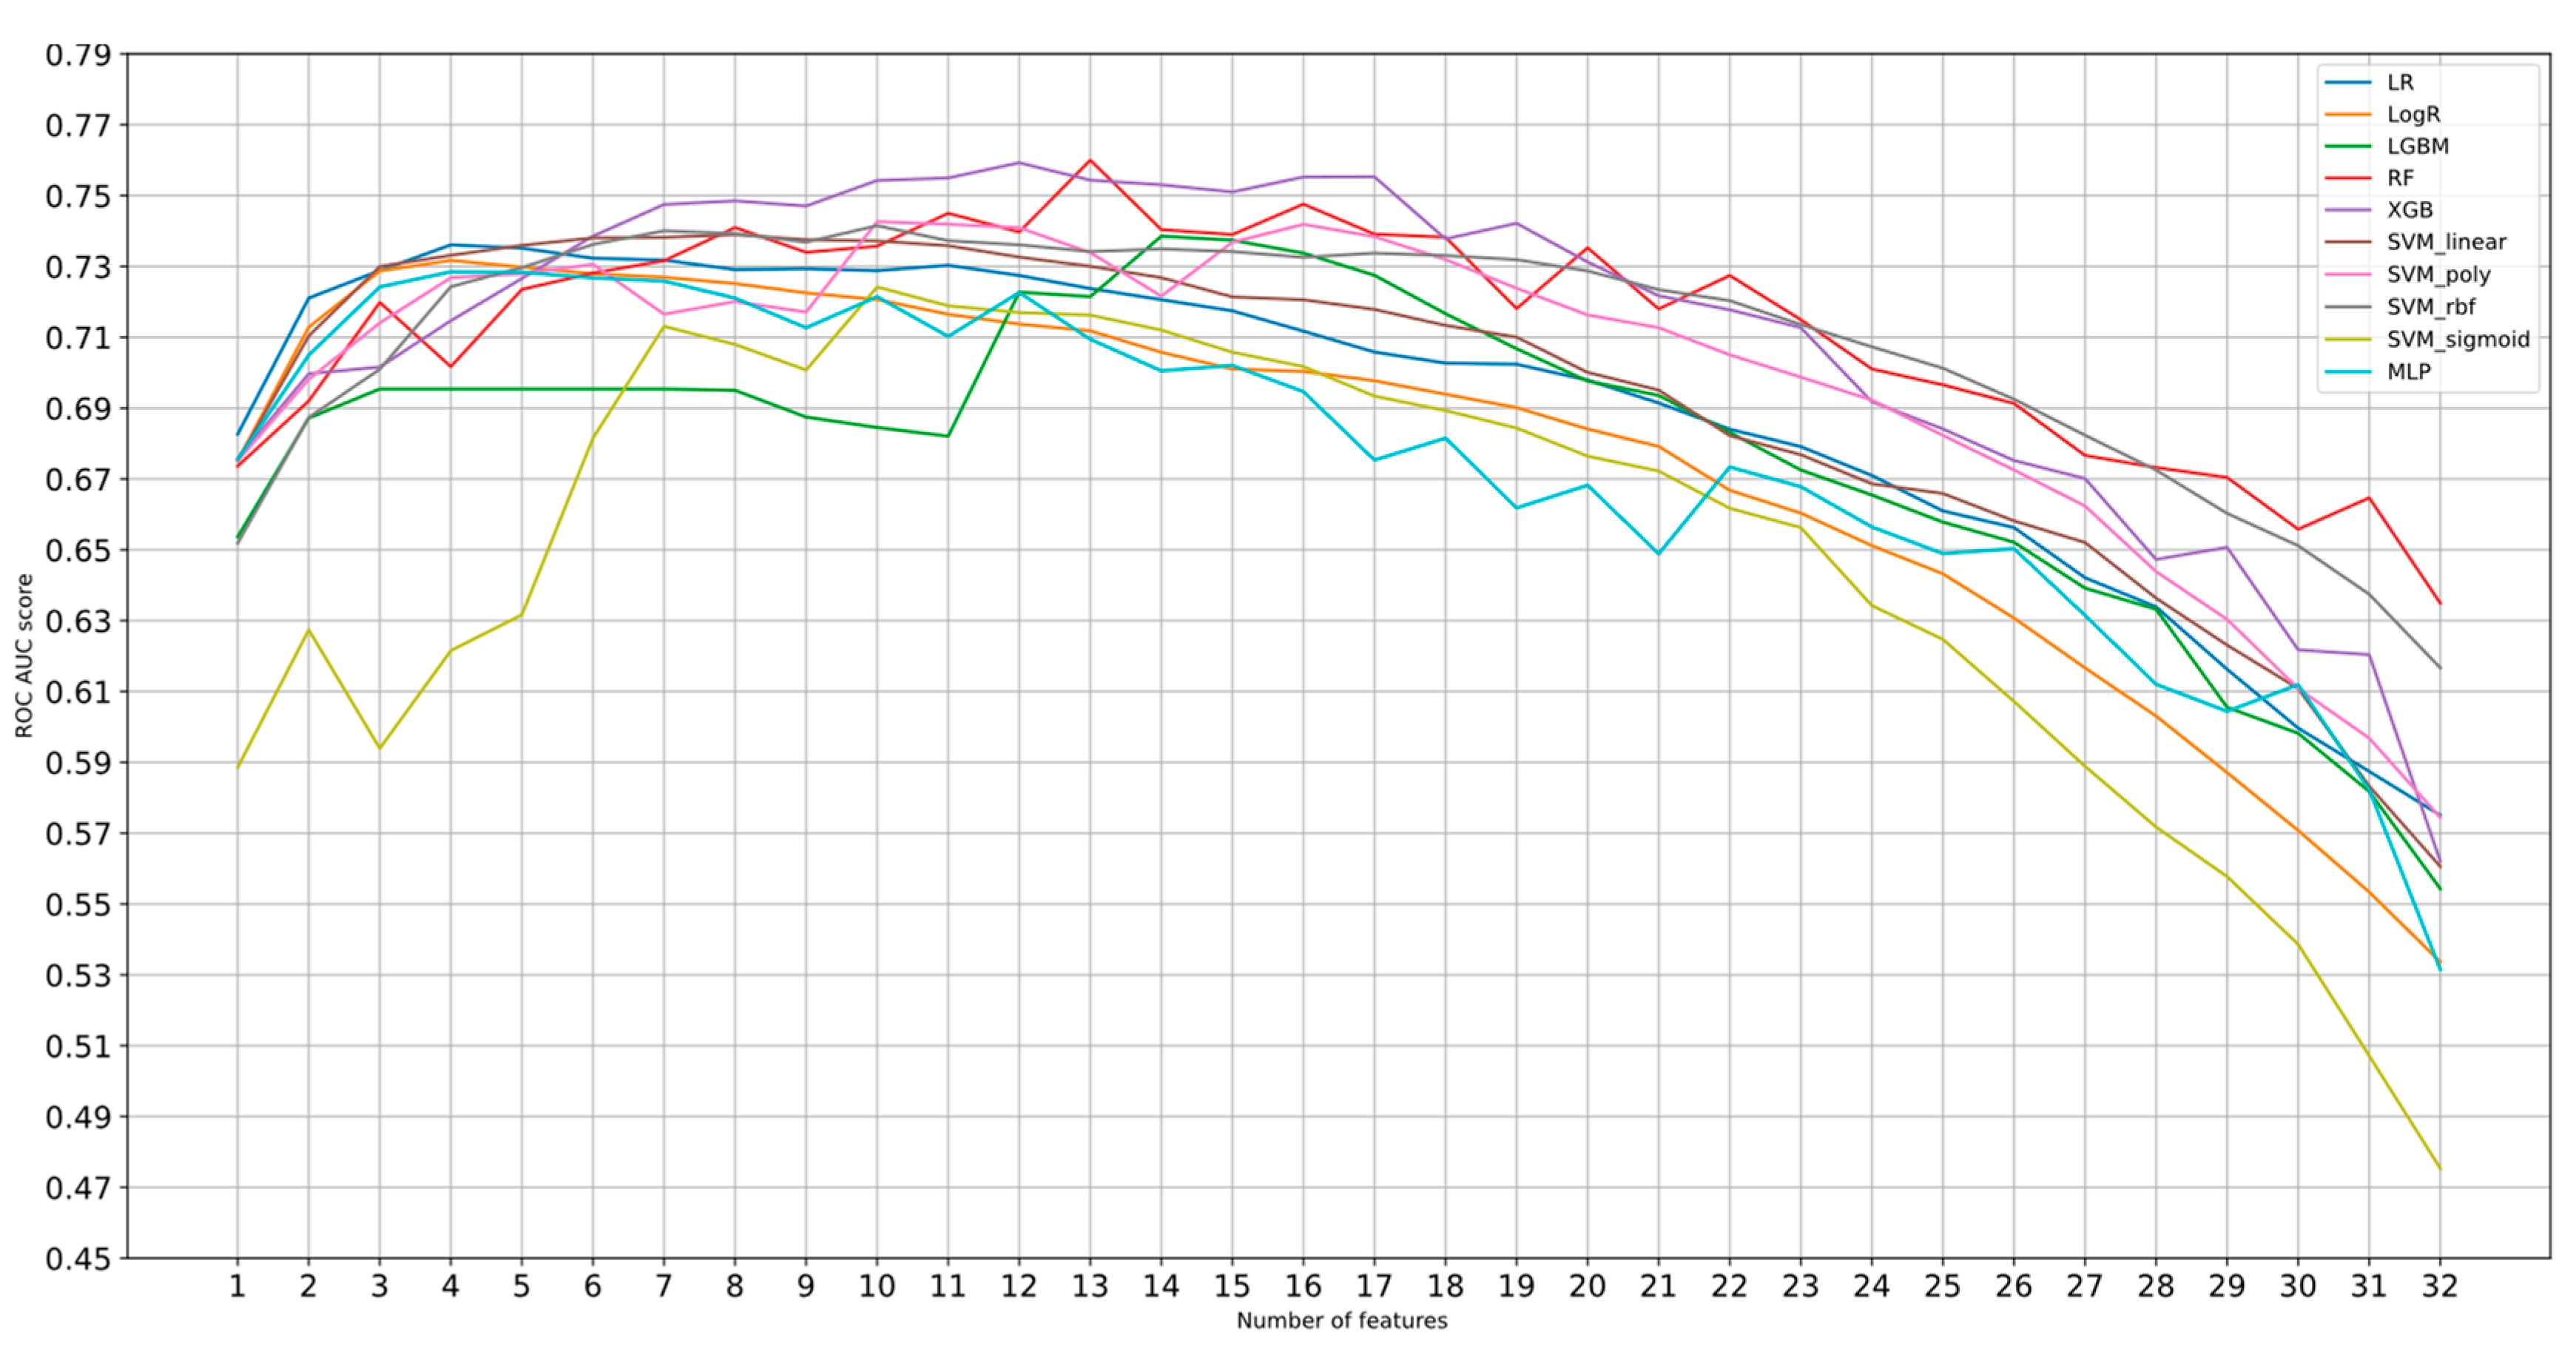
Figure 5 shows the performance results (AUC-ROC score) of the SSFS with 5-fold cross-validation wrapped in the comparative classifiers, while Figure 6 illustrates the mean ROC-AUC score of each classifier per number of features. The results show that the RF model reached the best performance in 13 features (Table 5). The 13 selected features were the following: area_live, diagnosis_group, stress_restrict, positive_change, worry_phys_health, reading, video_games, relationships_friends, social_media, family_illness, family_hospitalization, family_death, and family_diagnosis.
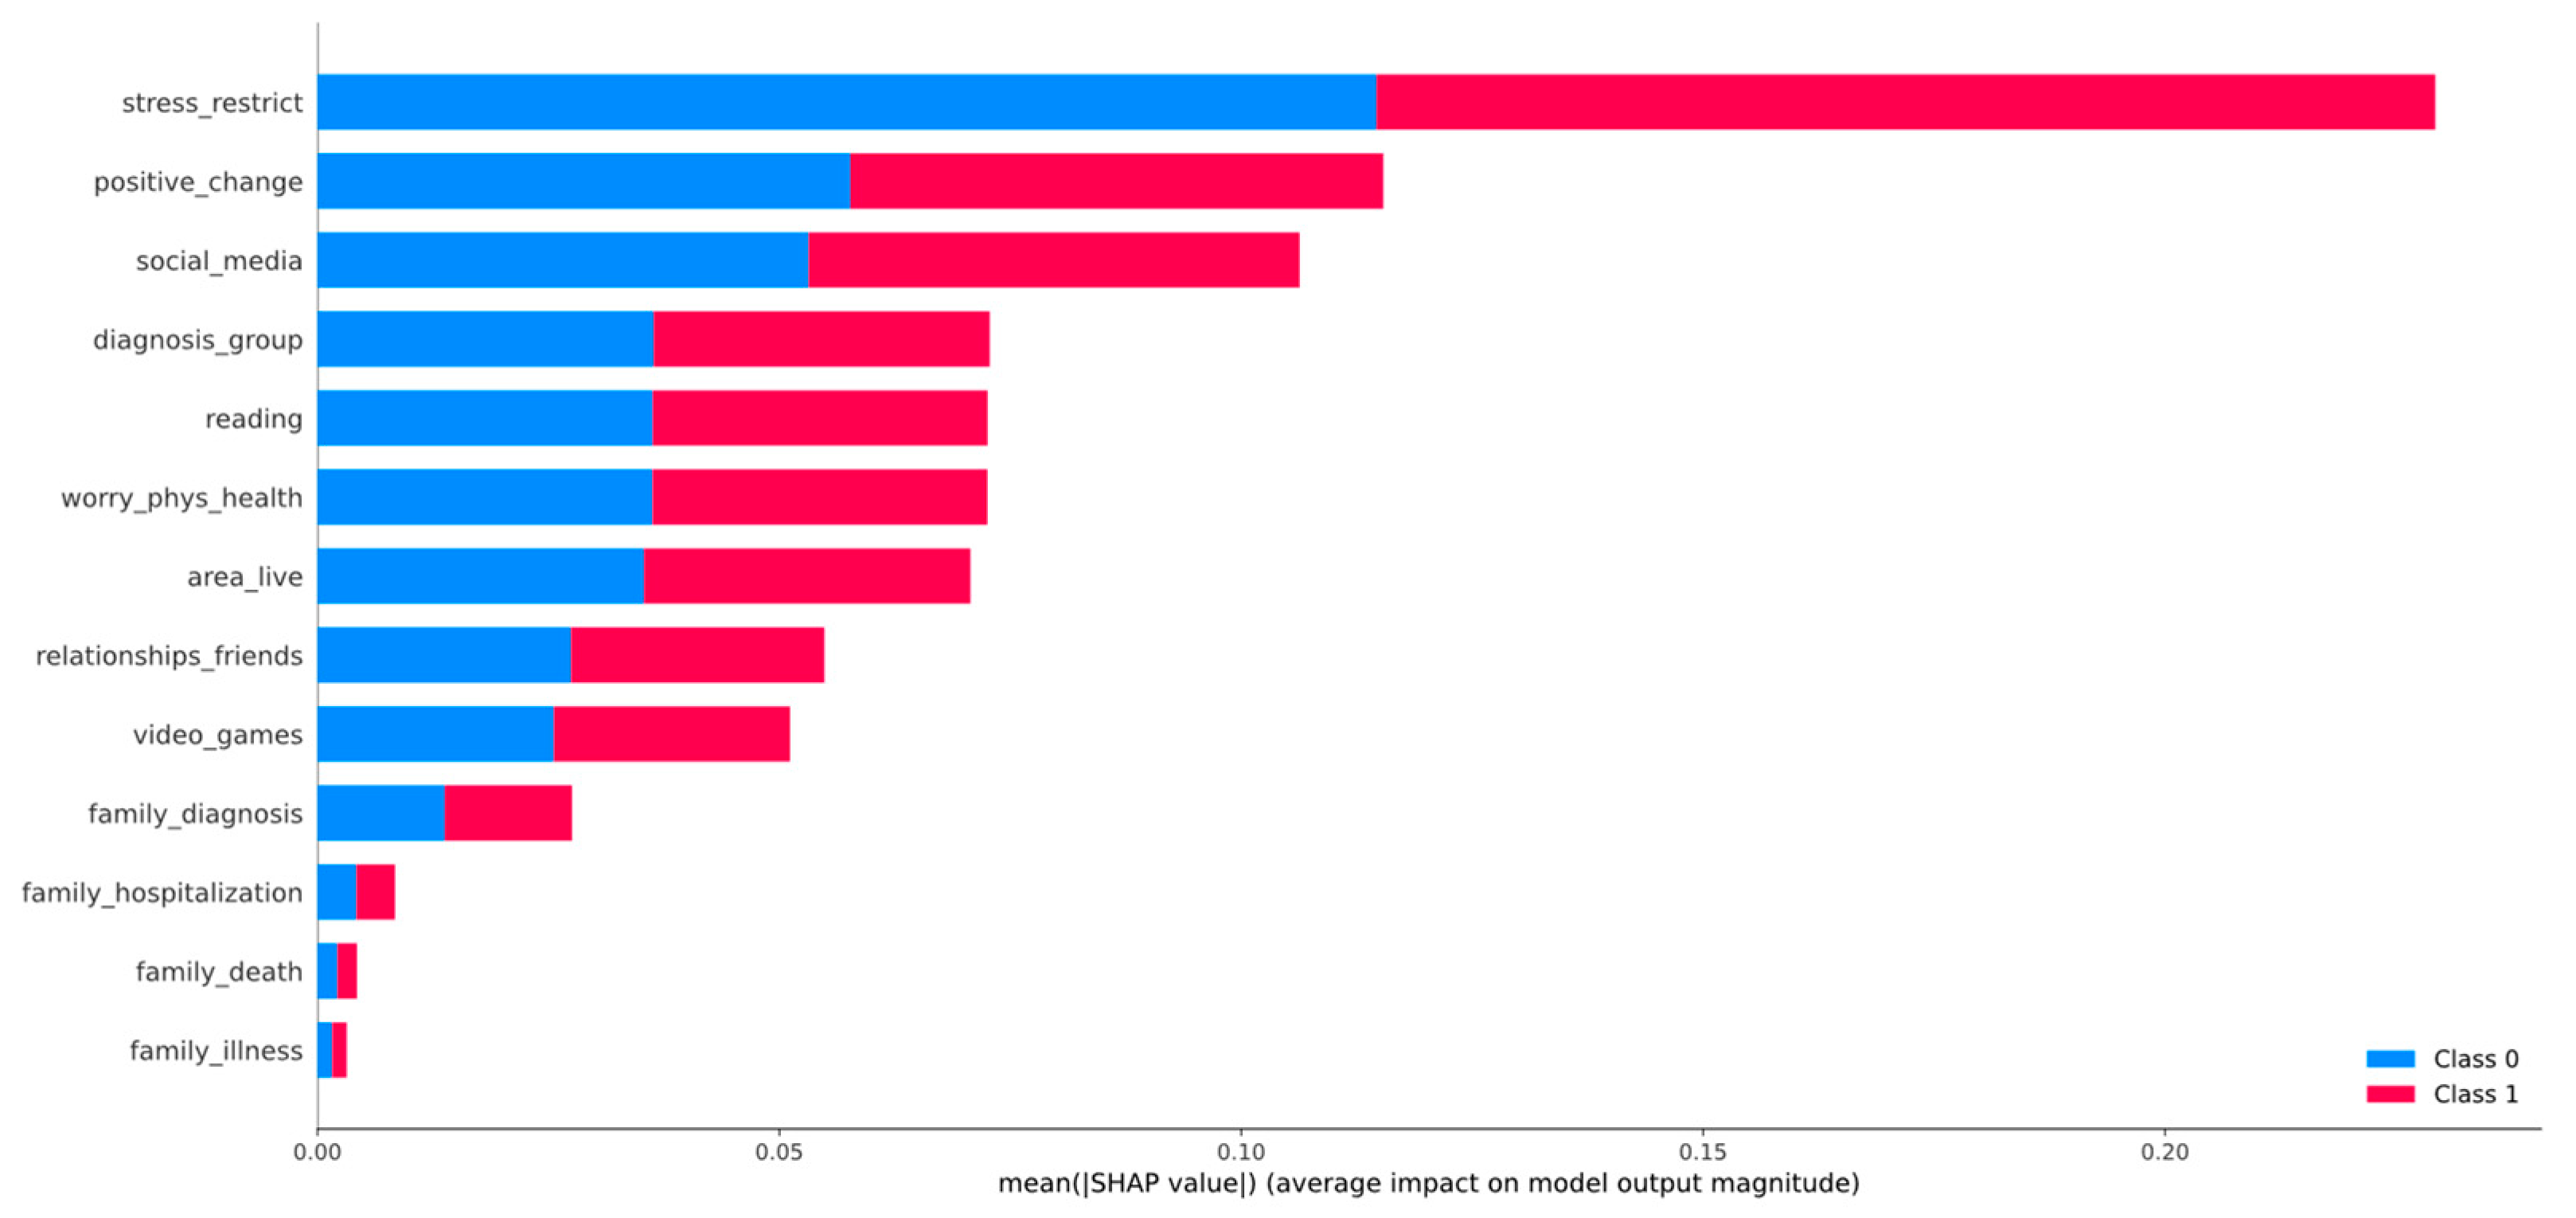
For the best performed model (RF), a SHAP explainability analysis was performed. In Figure 7 the x-axis represents the average magnitude change in model output when a feature was excluded from the model. The higher the value, the higher the importance of this feature in the prediction outcome of the model. Figure 8 depicts the beeswarm plot where the feature names are presented in y-axis based on their importance from top to bottom, while the x-axis indicates the mean SHAP value showing the change in log-odds. Gradient color (red to blue) indicates the original value of that feature. Each point represents a patient from the original dataset. Figure 9 and Figure 10 illustrate the forceplots as an example of how the most important features contribute to the classification of a subject with amelioration in the mood change (mood change score = −6) and of a subject with deterioration in the mood change (mood change score = 8), respectively.
The post hoc explainability analysis showed that the change in perceived stress derived from the restriction measures, the change in the perceived positive changes in a child’s life during the COVID-19, and the change in the time spent on social media were identified as the most contributing factors to the mood state changes. Moreover, the change in the amount of time spent on reading information about COVID-19, the change in how much the child was worried about his/her physical health, the living area, the change in relationships with friends, and the change in time spent on playing videogames from the 1st to the 2nd lockdown can also be considered important (Figure 7). Figure 8 depicts the summary beeswarm plot which shows the global importance of each feature and the distribution of effect sizes. It reveals that, for instance, if a subject feels less stressed by the imposed restriction measures during the 2nd lockdown compared to the period of the 1st one, it then pushes the prediction output to the class 0 (stability/improvement of mood state). Less time spent on social media and on reading/getting informed about COVID-19 signifies stability/improvement in mood state. Moreover, if a subject feels that more positive changes have occurred during the 2nd lockdown as compared to the 1st one, then his/her mood state remains stable or improves (Figure 8).
For instance, Figure 9 depicts a subject with improved mood state during the 2nd lockdown compared to the 1st one. It can be noticed that no significant changes occurred in his/her relationships with friends nor in his/her personal life (positive changes, worrying about restrictions, and time spent on social media). This could be interpreted as the subject’s ability to adjust to the “new normality” of daily life. On the other hand, a subject with mood state deterioration from the 1st to the 2nd lockdown presents a decrease in perceived positive changes that have occurred in his/her life during the 2nd lockdown, a worsening of their relationships with friends, and an increase in the amount of time spent on reading information about COVID-19. Remarkably, even if no change was noticed in parent-reported child stress levels due to restrictions during both lockdowns, these were experienced, according to parents, as moderately stressful by the child (Figure 10).
A statistical analysis to identify significant differences between selected features was performed by using a t-test. Specifically, statistical comparisons were performed to identify whether statistically significant differences exist between the classes considered for the most important features as were highlighted by the explainability analysis. The features included in the analysis were: stress_restrict, positive_change, social_media, diagnosis_group, reading, worry_phys_health, and area_live. Table 6 shows the research of the t-test analysis. Significant differences were observed between the two groups of patients for almost all the features considered, specifically the first four (stress_restrict, positive_change, social_media, and diagnosis_group) along with reading, while two of the features (worry_phys_health and area_live) that were considered important by the explainability analysis had no significant changes between the two groups.
Table 7 presents the most important features derived from the RF model based on ROC_AUC and SHAP. It was observed that the first three features remain the most important in both cases while the RF model included relationships_friends in the top seven features instead of reading. Overall, six out of seven top features were the same in both cases regardless of the features’ rating. Indeed, these features can also be seen in Figure 9 and Figure 10, where the greatest contributing factors for each subject are presented.
The present study contributes to our understanding how COVID-19 lockdown regulations may affect child mood states and thereby their mental health. The proportion of children and adolescents whose mood states remained stable or showed positive change dropped from the 1st national lockdown (77.7%) period investigated in our previous study [35] to the 2nd national lockdown (51%). This finding highlights the adverse effects that repeated lockdowns may have on some children’s mental health and are in line with the existing literature, suggesting the development of stress-related problems, especially in children and adolescents with pre-existing mental health or development issues [54].
On the other hand, the observed mood state stability/positive mood state changes in just under half of the sample are in line with a longitudinal study of mental health in at-risk adolescents, highlighting that the effects of the COVID-19 pandemic may not necessarily be detrimental, at least among a specific subgroup of adolescents with pre-existing mental health problems [23]. Notably, deterioration in mood states was observed in children with pre-pandemic psychiatric disorders, while those with pre-pandemic developmental disorders showed stability or positive mood state changes. These results are aligned with the literature findings [21,55].
Taking the research findings altogether, the contributions of this study to the current literature include:
  • A longitudinal survey during two consecutive lockdowns of different duration in Greece.
  • A focus on children and adolescents with pre-pandemic diagnosed psychiatric and developmental disorders (Table 1).
  • The development of a dataset with 52 heterogenous features related to demographics, medical data, social life, personal life, family life, daily stresses, and daily activities (Table 2). The dataset consists of a blend of features that were identified as important through the presented literature review (Section 1).
  • The use of an XAI pipeline for the identification of the most contributing factors that helped the examined population to retain their mood state, i.e., searching for possible activities and behaviors that helped children cope with the new daily life during COVID-19 pandemic and related restrictive measures.
  • The findings have implications for clinical practice as they highlight both the importance of ongoing monitoring mood states during lockdown periods, and the personal characteristics and daily activities that could contribute positively to mood states during severe events, such as lockdowns.
  • The findings have implications for policy-makers’ decisions relevant for child mental health care in Greece, i.e., prioritization, better access to mental health care and psychosocial support services for children and their families, and development of evidence-based interventions to mitigate mental health impact of future pandemic-related lockdowns.

4. Conclusions

In this study, an explainable machine learning (ML) approach was adopted to identify and quantify factors associated with mood state change in the aforementioned population. The purpose of this study was to further understand the effects of COVID-19-pandemic-related control measures and identify the factors that may reduce the mental health effects of such restrictions in children and adolescents. The sample comprised 229 children and adolescents diagnosed with a mental health or developmental disorder during the year preceding the pandemic, whose parents completed a survey at two time points—during the 1st and the 2nd lockdown in Greece. This population was grouped into subjects with negative change in their mood state (deterioration of mood state) and positive or no change in their mood state (amelioration or stability of mood state).
To develop a classification model a comparative evaluation was conducted by using well known classifiers, such as Linear Regression, Logistic Regression, LightGBM, Random Forest, XGBoost, SVM, and MLP. Of 32 features in total, 13 features were identified as important with the Random Forest classifier achieving 76% ROC-AUC. This comparative evaluation was followed by a post hoc explainability analysis by using the SHAP model. The results showed that from the initial 13 identified features, the change in perceived stress derived from the restriction measures, the change in the perceived positive changes in the child’s life during the COVID-19, and the change in the time spent on social media were the greatest contributing factors to the mood state changes. These findings have implications for clinical practice, underscoring the need for regular monitoring of changes in stress levels during periods of restrictive pandemic-related measures and of time spent on social media, as well as positive changes occurring in children’s daily life, in order to timely intervene to prevent deterioration in mood state.
The contributions of this study to the current literature include a focus on children and adolescents with pre-existing psychiatric/developmental disorders, use of a longitudinal (repeated cross-sectional) study design that controls for baseline variables, and an explainable machine learning pipeline for identifying the most important contributing factors affecting their mood states during the first year of the COVID-19 pandemic.
As with all studies, the presented results are linked with several limitations. First, this study relied on parent reports of children. While parental surveys offer several benefits such as providing the parental point view of their child, their reports may be less accurate for older children and for internalizing symptoms across ages [56]. For example, results from a Dutch study showed that children in the clinical population reported more internalized symptoms over the course of the pandemic while parents did not report differences in those symptoms from the pre-pandemic period to the first peak of the pandemic, nor over the course of the pandemic [57]. Furthermore, we did not have data available on the parents’ own COVID-19 stress and worries, which may have influenced their ratings of their child’s mood states. Second, this was a longitudinal study, and whilst it offers data on the changes in mood states, it poses a question of replicability and application in different follow-up cohorts. We drew our sample from the population attending public CAMHS, and thus it cannot be considered representative of children and adolescents with mental health problems whose parents seek help in the private sector. Moreover, the differences between the responders and non-responders to the second wave of data collection raises concerns about the potential for selection bias and limits the validity of our findings. Third, the diverse mix of clinical diagnoses and the small number of children falling into each diagnostic code necessitated grouping them to two broad diagnostic categories, which does not allow for commentary on the impacts of COVID-19-related lockdowns on youth meeting diagnostic criteria for a specific disorder (e.g., ADHD). Future studies should focus on expanding participant populations and employing self-reported measures.

Author Contributions

Conceptualization, C.N.; methodology, C.N.; software, C.N.; validation, C.N.; formal analysis, C.N., I.G., K.K. and K.M.; data curation, C.N., D.P., K.M., I.G., K.K., A.S., E.T., A.G., K.L., I.K., N.S. and E.L.; writing—original draft preparation, C.N., D.P., I.R., I.G., K.K., M.C.-T. and K.M.; writing—review and editing, C.N., I.G., K.K., K.C. and K.M. visualization, C.N.; supervision, I.G. and C.N.; All authors have read and agreed to the published version of the manuscript.

Funding

This research received no external funding.

Institutional Review Board Statement

Each CAMHS contacted the parents of all children and adolescents who attended the service during the study. All parents interested in taking part in the survey were sent an email containing information about the study, along with a unique identification code number and the link to log into the Google Forms Survey app. After reading the information about the goals of the study, the process of data collection and confidentiality, and providing informed consent online, they proceeded to answer the questionnaire. The study was approved by the Ethics Committee of each hospital, with which the service is affiliated. The study was performed in line with the principles of the Declaration of Helsinki.

Informed Consent Statement

Informed consent was obtained from all subjects involved in the study.

Data Availability Statement

The data can be available upon request.

Acknowledgments

The authors would like to thank all the respondents to this study who took the time to complete the questionnaire. We would like to thank the Hellenic COVID-19 imPact survEy (HOPE) Consortium for their contribution during the data collection process: Lagakou E., First Psychiatric Department, Eginition Hospital, National and Kapodistrian University of Athens, Athens, Greece; [email protected]. Mamaki, E., Mental Health Center, General Hospital “G. Hatzikosta”, Ioannina, Greece; [email protected]. Neou, E., Hellenic Centre for Mental Health and Research, Athens, Greece; [email protected]. Polaki, O., Community Mental Health Center for Children and Adolescents in N.Smyrni, Division of Psychiatry, “Asklepieion Voulas’ General Hospital, Attica, Greece; [email protected]. Priftis D., University Mental Health Research Institute; [email protected]. Triantafyllou, G., Second Psychiatric Department, “Attikon” University Hospital, National and Kapodistrian University of Athens, Athens, Greece; and [email protected]. Valvi E., Athens Child and Adolescent Mental Health Centre, General Children’s Hospital “Pan. & Aglaia Kyriakou”, Athens, Greece. Vassara, V., Community Mental Health Center for Children and Adolescents, Department of Psychiatry, University Hospital of Ioannina, Ioannina, Greece; [email protected].

Conflicts of Interest

The authors declare no conflict of interest.

References

  1. Muehlschlegel, P.A.; Parkinson, E.A.; Chan, R.Y.; Arden, M.A.; Armitage, C.J. Learning from Previous Lockdown Measures and Minimising Harmful Biopsychosocial Consequences as They End: A Systematic Review. J. Glob. Health 2021, 11, 05008. [Google Scholar] [CrossRef] [PubMed]
  2. Bhatia, M.; Manocha, A.; Ahanger, T.A.; Alqahtani, A. Artificial Intelligence-Inspired Comprehensive Framework for COVID-19 Outbreak Control. Artif. Intell. Med. 2022, 127, 102288. [Google Scholar] [CrossRef] [PubMed]
  3. Holmes, E.A.; O’Connor, R.C.; Perry, V.H.; Tracey, I.; Wessely, S.; Arseneault, L.; Ballard, C.; Christensen, H.; Silver, R.C.; Everall, I.; et al. Multidisciplinary Research Priorities for the COVID-19 Pandemic: A Call for Action for Mental Health Science. Lancet Psychiatry 2020, 7, 547–560. [Google Scholar] [CrossRef] [PubMed]
  4. Danese, A.; Smith, P. Debate: Recognising and Responding to the Mental Health Needs of Young People in the Era of COVID-19. Child Adolesc. Ment. Health 2020, 25, 169–170. [Google Scholar] [CrossRef] [PubMed]
  5. Giannopoulou, I.; Galinaki, S.; Kollintza, E.; Adamaki, M.; Kympouropoulos, S.; Alevyzakis, E.; Tsamakis, K.; Tsangaris, I.; Spandidos, D.A.; Siafakas, N.; et al. COVID-19 and Post-traumatic Stress Disorder: The Perfect ‘Storm’ for Mental Health (Review). Exp. Ther. Med. 2021, 22, 1162. [Google Scholar] [CrossRef] [PubMed]
  6. Guessoum, S.B.; Lachal, J.; Radjack, R.; Carretier, E.; Minassian, S.; Benoit, L.; Moro, M.R. Adolescent Psychiatric Disorders during the COVID-19 Pandemic and Lockdown. Psychiatry Res. 2020, 291, 113264. [Google Scholar] [CrossRef] [PubMed]
  7. Singh, S.; Roy, D.; Sinha, K.; Parveen, S.; Sharma, G.; Joshi, G. Impact of COVID-19 and Lockdown on Mental Health of Children and Adolescents: A Narrative Review with Recommendations. Psychiatry Res. 2020, 293, 113429. [Google Scholar] [CrossRef]
  8. Panchal, U.; Salazar de Pablo, G.; Franco, M.; Moreno, C.; Parellada, M.; Arango, C.; Fusar-Poli, P. The Impact of COVID-19 Lockdown on Child and Adolescent Mental Health: Systematic Review. Eur. Child Adolesc. Psychiatry 2023, 32, 1151–1177. [Google Scholar] [CrossRef]
  9. Ravens-Sieberer, U.; Kaman, A.; Erhart, M.; Otto, C.; Devine, J.; Löffler, C.; Hurrelmann, K.; Bullinger, M.; Barkmann, C.; Siegel, N.A.; et al. Quality of Life and Mental Health in Children and Adolescents during the First Year of the COVID-19 Pandemic: Results of a Two-Wave Nationwide Population-Based Study. Eur. Child Adolesc. Psychiatry 2023, 32, 575–588. [Google Scholar] [CrossRef]
  10. Racine, N.; McArthur, B.A.; Cooke, J.E.; Eirich, R.; Zhu, J.; Madigan, S. Global Prevalence of Depressive and Anxiety Symptoms in Children and Adolescents During COVID-19: A Meta-Analysis. JAMA Pediatr. 2021, 175, 1142–1150. [Google Scholar] [CrossRef]
  11. Orgilés, M.; Morales, A.; Delvecchio, E.; Mazzeschi, C.; Espada, J.P. Immediate Psychological Effects of the COVID-19 Quarantine in Youth From Italy and Spain. Front. Psychol. 2020, 11, 579038. [Google Scholar] [CrossRef] [PubMed]
  12. Cooper, K.; Hards, E.; Moltrecht, B.; Reynolds, S.; Shum, A.; McElroy, E.; Loades, M. Loneliness, Social Relationships, and Mental Health in Adolescents during the COVID-19 Pandemic. J. Affect. Disord 2021, 289, 98–104. [Google Scholar] [CrossRef]
  13. Loades, M.E.; Chatburn, E.; Higson-Sweeney, N.; Reynolds, S.; Shafran, R.; Brigden, A.; Linney, C.; McManus, M.N.; Borwick, C.; Crawley, E. Rapid Systematic Review: The Impact of Social Isolation and Loneliness on the Mental Health of Children and Adolescents in the Context of COVID-19. J. Am. Acad. Child Adolesc. Psychiatry 2020, 59, 1218–1239.e3. [Google Scholar] [CrossRef] [PubMed]
  14. Kauhanen, L.; Wan Mohd Yunus, W.M.A.; Lempinen, L.; Peltonen, K.; Gyllenberg, D.; Mishina, K.; Gilbert, S.; Bastola, K.; Brown, J.S.L.; Sourander, A. A Systematic Review of the Mental Health Changes of Children and Young People before and during the COVID-19 Pandemic. Eur. Child Adolesc. Psychiatry 2023, 32, 995–1013. [Google Scholar] [CrossRef] [PubMed]
  15. Wolf, K.; Schmitz, J. Scoping Review: Longitudinal Effects of the COVID-19 Pandemic on Child and Adolescent Mental Health. Eur. Child Adolesc. Psychiatry 2023, 1–56. [Google Scholar] [CrossRef]
  16. Chen, F.; Zheng, D.; Liu, J.; Gong, Y.; Guan, Z.; Lou, D. Depression and Anxiety among Adolescents during COVID-19: A Cross-Sectional Study. Brain Behav. Immun. 2020, 88, 36–38. [Google Scholar] [CrossRef] [PubMed]
  17. Schmidt, S.J.; Barblan, L.P.; Lory, I.; Landolt, M.A. Age-Related Effects of the COVID-19 Pandemic on Mental Health of Children and Adolescents. Eur. J. Psychotraumatol. 2021, 12, 1901407. [Google Scholar] [CrossRef]
  18. Liu, S.; Liu, Y.; Liu, Y. Somatic Symptoms and Concern Regarding COVID-19 among Chinese College and Primary School Students: A Cross-Sectional Survey. Psychiatry Res. 2020, 289, 113070. [Google Scholar] [CrossRef]
  19. McKune, S.L.; Acosta, D.; Diaz, N.; Brittain, K.; Beaulieu, D.J.; Maurelli, A.T.; Nelson, E.J. Psychosocial Health of School-Aged Children during the Initial COVID-19 Safer-at-Home School Mandates in Florida: A Cross-Sectional Study. BMC Public Health 2021, 21, 603. [Google Scholar] [CrossRef]
  20. Zhou, S.-J.; Zhang, L.-G.; Wang, L.-L.; Guo, Z.-C.; Wang, J.-Q.; Chen, J.-C.; Liu, M.; Chen, X.; Chen, J.-X. Prevalence and Socio-Demographic Correlates of Psychological Health Problems in Chinese Adolescents during the Outbreak of COVID-19. Eur. Child Adolesc. Psychiatry 2020, 29, 749–758. [Google Scholar] [CrossRef]
  21. Magson, N.R.; Freeman, J.Y.A.; Rapee, R.M.; Richardson, C.E.; Oar, E.L.; Fardouly, J. Risk and Protective Factors for Prospective Changes in Adolescent Mental Health during the COVID-19 Pandemic. J. Youth Adolesc. 2021, 50, 44–57. [Google Scholar] [CrossRef] [PubMed]
  22. Fegert, J.M.; Vitiello, B.; Plener, P.L.; Clemens, V. Challenges and Burden of the Coronavirus 2019 (COVID-19) Pandemic for Child and Adolescent Mental Health: A Narrative Review to Highlight Clinical and Research Needs in the Acute Phase and the Long Return to Normality. Child Adolesc. Psychiatry Ment. Health 2020, 14, 20. [Google Scholar] [CrossRef] [PubMed]
  23. Bouter, D.C.; Zarchev, M.; de Neve-Enthoven, N.G.M.; Ravensbergen, S.J.; Kamperman, A.M.; Hoogendijk, W.J.G.; Grootendorst-van Mil, N.H. A Longitudinal Study of Mental Health in At-Risk Adolescents before and during the COVID-19 Pandemic. Eur. Child Adolesc. Psychiatry 2023, 32, 1109–1117. [Google Scholar] [CrossRef] [PubMed]
  24. Lopez-Serrano, J.; Díaz-Bóveda, R.; González-Vallespí, L.; Santamarina-Pérez, P.; Bretones-Rodríguez, A.; Calvo, R.; Lera-Miguel, S. Psychological Impact during COVID-19 Lockdown in Children and Adolescents with Previous Mental Health Disorders. Rev. Psiquiatr. Salud Ment. 2023, 16, 32–41. [Google Scholar] [CrossRef]
  25. Magklara, K.; Giannopoulou, I.; Kotsis, K.; Tsalamanios, E.; Grigoriadou, A.; Ladopoulou, K.; Koullourou, I.; Serdari, A.; Sadeghi, N.; O’Callaghan, G.; et al. Mental Health of Children and Adolescents with Pre-Existing Psychiatric and Developmental Disorders during the First Pandemic-Related Lockdown: A Cross-Sectional Study in Greece. Psychiatry Res. Commun. 2022, 2, 100034. [Google Scholar] [CrossRef]
  26. Lavenne-Collot, N.; Ailliot, P.; Badic, S.; Favé, A.; François, G.; Saint-André, S.; Thierry, A.; Bronsard, G. Les enfants suivis en psychiatrie infanto-juvénile ont ils connu la dégradation redoutée pendant la période de confinement liée à la pandémie COVID-19? Neuropsychiatr. L’Enfance L’Adolescence 2021, 69, 121–131. [Google Scholar] [CrossRef]
  27. Tanir, Y.; Karayagmurlu, A.; Kaya, İ.; Kaynar, T.B.; Türkmen, G.; Dambasan, B.N.; Meral, Y.; Coşkun, M. Exacerbation of Obsessive Compulsive Disorder Symptoms in Children and Adolescents during COVID-19 Pandemic. Psychiatry Res. 2020, 293, 113363. [Google Scholar] [CrossRef]
  28. Zhang, J.; Shuai, L.; Yu, H.; Wang, Z.; Qiu, M.; Lu, L.; Cao, X.; Xia, W.; Wang, Y.; Chen, R. Acute Stress, Behavioural Symptoms and Mood States among School-Age Children with Attention-Deficit/Hyperactive Disorder during the COVID-19 Outbreak. Asian J. Psychiatr. 2020, 51, 102077. [Google Scholar] [CrossRef]
  29. Masi, A.; Mendoza Diaz, A.; Tully, L.; Azim, S.I.; Woolfenden, S.; Efron, D.; Eapen, V. Impact of the COVID-19 Pandemic on the Well-Being of Children with Neurodevelopmental Disabilities and Their Parents. J. Paediatr. Child Health 2021, 57, 631–636. [Google Scholar] [CrossRef]
  30. Graell, M.; Morón-Nozaleda, M.G.; Camarneiro, R.; Villaseñor, Á.; Yáñez, S.; Muñoz, R.; Martínez-Núñez, B.; Miguélez-Fernández, C.; Muñoz, M.; Faya, M. Children and Adolescents with Eating Disorders during COVID-19 Confinement: Difficulties and Future Challenges. Eur. Eat Disord. Rev. 2020, 28, 864–870. [Google Scholar] [CrossRef]
  31. Stevanovic, D.; Kabukcu Basay, B.; Basay, O.; Leskauskas, D.; Nussbaum, L.; Zirakashvili, M. COVID-19 Pandemic-Related Aspects and Predictors of Emotional and Behavioural Symptoms in Youth with Pre-Existing Mental Health Conditions: Results from Georgia, Lithuania, Romania, Serbia, and Turkey. Nord. J. Psychiatry 2021, 76, 515–522. [Google Scholar] [CrossRef] [PubMed]
  32. Orrù, G.; Monaro, M.; Conversano, C.; Gemignani, A.; Sartori, G. Machine Learning in Psychometrics and Psychological Research. Front. Psychol. 2020, 10, 2970. [Google Scholar] [CrossRef] [PubMed]
  33. Comito, C.; Pizzuti, C. Artificial Intelligence for Forecasting and Diagnosing COVID-19 Pandemic: A Focused Review. Artif. Intell. Med. 2022, 128, 102286. [Google Scholar] [CrossRef] [PubMed]
  34. Nikolaidis, A.; DeRosa, J.; Kass, M.; Droney, I.; Alexander, L.; Di Martino, A.; Bromet, E.; Merikangas, K.; Milham, M.P.; Paksarian, D. Heterogeneity in COVID-19 Pandemic-Induced Lifestyle Stressors Predicts Future Mental Health in Adults and Children in the US and UK. J. Psychiatr. Res. 2022, 147, 291–300. [Google Scholar] [CrossRef]
  35. Ntakolia, C.; Priftis, D.; Charakopoulou-Travlou, M.; Rannou, I.; Magklara, K.; Giannopoulou, I.; Kotsis, K.; Serdari, A.; Tsalamanios, E.; Grigoriadou, A.; et al. An Explainable Machine Learning Approach for COVID-19’s Impact on Mood States of Children and Adolescents during the First Lockdown in Greece. Healthcare 2022, 10, 149. [Google Scholar] [CrossRef]
  36. National Center for Health Statistics. International Classification of Diseases, Tenth Revision (ICD-10); Centers for Disease Control and Prevention: Herndon, VA, USA, 2023. [Google Scholar]
  37. Ntakolia, C.; Kokkotis, C.; Moustakidis, S.; Tsaopoulos, D. A Machine Learning Pipeline for Predicting Joint Space Narrowing in Knee Osteoarthritis Patients. In Proceedings of the 2020 IEEE 20th International Conference on Bioinformatics and Bioengineering (BIBE), Cincinnati, OH, USA, 26–28 October 2020; pp. 934–941. [Google Scholar]
  38. Ntakolia, C.; Kokkotis, C.; Moustakidis, S.; Tsaopoulos, D. Identification of Most Important Features Based on a Fuzzy Ensemble Technique: Evaluation on Joint Space Narrowing Progression in Knee Osteoarthritis Patients. Int. J. Med. Inform. 2021, 156, 104614. [Google Scholar] [CrossRef]
  39. Boateng, E.Y.; Abaye, D.A. A Review of the Logistic Regression Model with Emphasis on Medical Research. J. Data Anal. Inf. Process. 2019, 7, 190–207. [Google Scholar] [CrossRef]
  40. Hosmer, D.W., Jr.; Lemeshow, S.; Sturdivant, R.X. Applied Logistic Regression; John Wiley & Sons, Inc.: Hoboken, NJ, USA, 2013; ISBN 978-0-470-58247-3. [Google Scholar]
  41. Ke, G.; Meng, Q.; Finley, T.; Wang, T.; Chen, W.; Ma, W.; Ye, Q.; Liu, T.-Y. LightGBM: A Highly Efficient Gradient Boosting Decision Tree. In Advances in Neural Information Processing Systems; Curran Associates, Inc.: New York, NY, USA, 2017; Volume 30. [Google Scholar]
  42. Wang, D.; Zhang, Y.; Zhao, Y. LightGBM: An Effective MiRNA Classification Method in Breast Cancer Patients. In Proceedings of the 2017 International Conference on Computational Biology and Bioinformatics, Newark, NJ, USA, 18–20 October 2017; Association for Computing Machinery: New York, NY, USA, 2017; pp. 7–11. [Google Scholar]
  43. Taud, H.; Mas, J.F. Multilayer Perceptron (MLP). In Geomatic Approaches for Modeling Land Change Scenarios; Camacho Olmedo, M.T., Paegelow, M., Mas, J.-F., Escobar, F., Eds.; Lecture Notes in Geoinformation and Cartography; Springer International Publishing: Cham, Switzerland, 2018; pp. 451–455. ISBN 978-3-319-60801-3. [Google Scholar]
  44. Karlik, B.; Olgac, A.V. Performance Analysis of Various Activation Functions in Generalized MLP Architectures o. J. Artif. Intell. Expert Syst. 2010, 1, 111–122. [Google Scholar]
  45. Awad, M.; Khanna, R. Support Vector Machines for Classification. In Efficient Learning Machines: Theories, Concepts, and Applications for Engineers and System Designers; Awad, M., Khanna, R., Eds.; Apress: Berkeley, CA, USA, 2015; pp. 39–66. ISBN 978-1-4302-5990-9. [Google Scholar]
  46. Cortes, C.; Vapnik, V. Support-Vector Networks. Mach. Learn. 1995, 20, 273–297. [Google Scholar] [CrossRef]
  47. Biau, G.; Scornet, E. A Random Forest Guided Tour. Test 2016, 25, 197–227. [Google Scholar] [CrossRef]
  48. Breiman, L. Random Forests. Mach. Learn. 2001, 45, 5–32. [Google Scholar] [CrossRef]
  49. Chen, T.; Guestrin, C. XGBoost: A Scalable Tree Boosting System. In Proceedings of the 22nd ACM Sigkdd International Conference on Knowledge Discovery and Data Mining, San Francisco, CA, USA, 13–17 August 2016; pp. 785–794. [Google Scholar]
  50. Ogunleye, A.; Wang, Q.-G. XGBoost Model for Chronic Kidney Disease Diagnosis. IEEE/ACM Trans. Comput. Biol. Bioinform. 2020, 17, 2131–2140. [Google Scholar] [CrossRef]
  51. Prabha, A.; Yadav, J.; Rani, A.; Singh, V. Design of Intelligent Diabetes Mellitus Detection System Using Hybrid Feature Selection Based XGBoost Classifier. Comput. Biol. Med. 2021, 136, 104664. [Google Scholar] [CrossRef]
  52. Ntakolia, C.; Kokkotis, C.; Moustakidis, S.; Tsaopoulos, D. Prediction of Joint Space Narrowing Progression in Knee Osteoarthritis Patients. Diagnostics 2021, 11, 285. [Google Scholar] [CrossRef]
  53. Lundberg, S.M.; Lee, S.-I. A Unified Approach to Interpreting Model Predictions. In Advances in Neural Information Processing Systems; Curran Associates, Inc.: New York, NY, USA, 2017; Volume 30. [Google Scholar]
  54. Bai, M.-S.; Miao, C.-Y.; Zhang, Y.; Xue, Y.; Jia, F.-Y.; Du, L. COVID-19 and Mental Health Disorders in Children and Adolescents (Review). Psychiatry Res. 2022, 317, 114881. [Google Scholar] [CrossRef]
  55. Patel, K. Mental Health Implications of COVID-19 on Children with Disabilities. Asian J. Psychiatr. 2020, 54, 102273. [Google Scholar] [CrossRef]
  56. Aebi, M.; Kuhn, C.; Banaschewski, T.; Grimmer, Y.; Poustka, L.; Steinhausen, H.-C.; Goodman, R. The Contribution of Parent and Youth Information to Identify Mental Health Disorders or Problems in Adolescents. Child Adolesc. Psychiatry Ment. Health 2017, 11, 23. [Google Scholar] [CrossRef]
  57. Fischer, K.; Tieskens, J.M.; Luijten, M.A.J.; Zijlmans, J.; van Oers, H.A.; de Groot, R.; van der Doelen, D.; van Ewijk, H.; Klip, H.; van der Lans, R.M.; et al. Internalizing Problems before and during the COVID-19 Pandemic in Independent Samples of Dutch Children and Adolescents with and without Pre-Existing Mental Health Problems. Eur. Child Adolesc. Psychiatry 2022, 32, 1873–1883. [Google Scholar] [CrossRef]
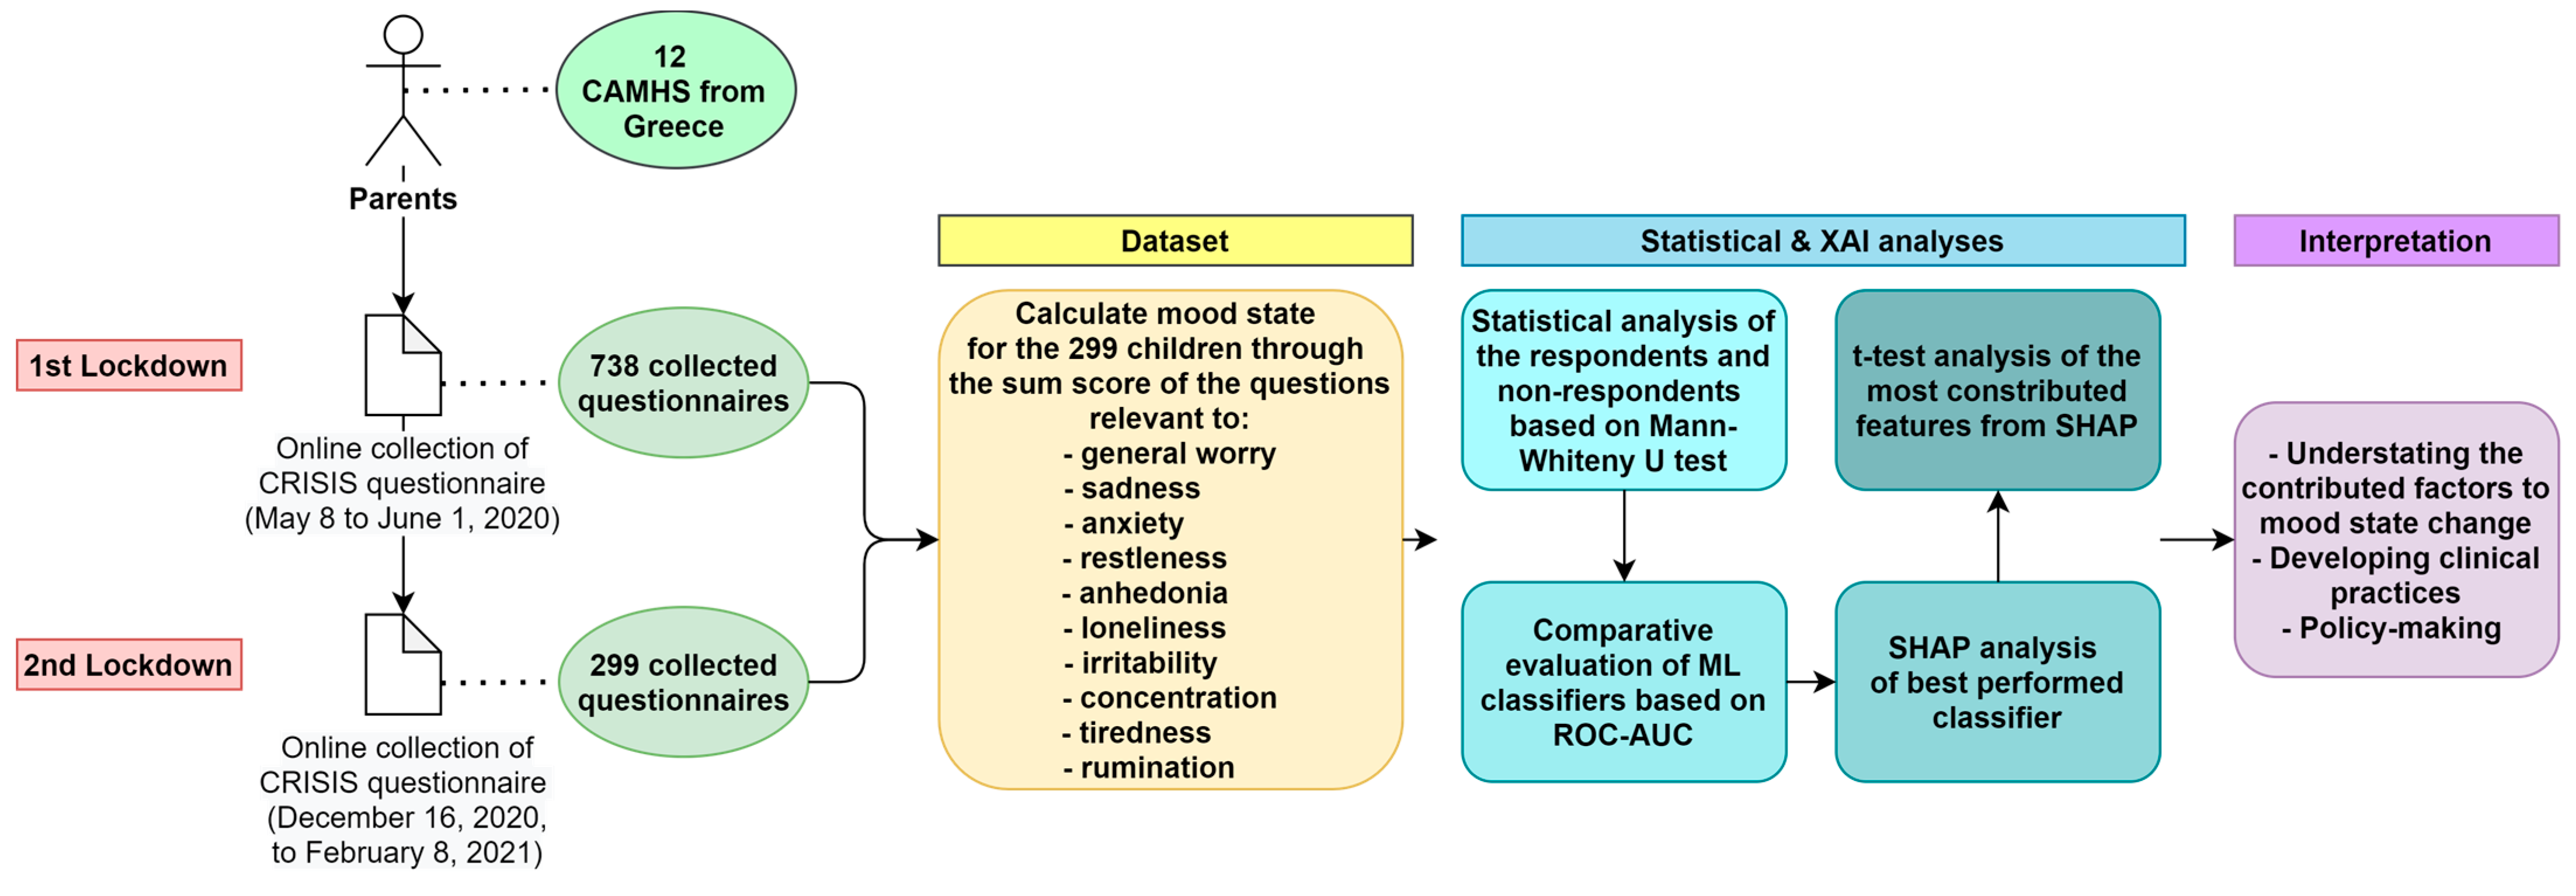
Figure 1. Flowchart of research steps of this study.
Biomedinformatics 03 00062 g001
Figure 2. Clustering of subjects based on the change on the mood state score between the 1st and 2nd lockdowns.
Biomedinformatics 03 00062 g002
Figure 3. Pie chart of mood change scores.
Biomedinformatics 03 00062 g003
Figure 4. Dumbbells of each mood state characteristic between the 1st and 2nd lockdown.
Biomedinformatics 03 00062 g004
Figure 5. Performance results (AUC-ROC score) of 5-fold step-wise Sequential Feature Selection with: (a) Linear Regression; (b) Logistic Regression; (c) Neural Network (MLP); (d) LightGBM; (e) SVM with linear kernel; (f) SVM with polynomial kernel; (g) SVM with radial basis function kernel; (h) SVM with sigmoid kernel; (i) Random Forest; and (j) XGBoost.
Biomedinformatics 03 00062 g005aBiomedinformatics 03 00062 g005b
Figure 6. Mean ROC-AUC score of classifiers per number of features.
Biomedinformatics 03 00062 g006
Figure 7. SHAP summary plot.
Biomedinformatics 03 00062 g007
Figure 8. SHAP beeswarm plot of class 0 (stability/improvement of mood state).
Biomedinformatics 03 00062 g008
Figure 9. Example of a forceplot of a subject classified in class 0 (subject with amelioration on the mood state: mood change score = −6).
Biomedinformatics 03 00062 g009
Figure 10. Example of a forceplot of a subject classified in class 1 (subject with deterioration on the mood state: mood change score = 8).
Biomedinformatics 03 00062 g010
Table 1. Sociodemographic characteristics of the dataset.
Sociodemographic CharacteristicsPopulation (%)
Age, mean ± standard deviation9.97 ± 3.77
Sex
Male154 (67.25%)
Female75 (32.75%)
Residential area
City135 (58.95%)
Suburbs of a city64 (27.95%)
Town22 (9.61%)
Rural area6 (2.62%)
Island2 (0.87%)
Disorders
Developmental disorders 1105 (45.85%)
Psychiatric disorders 2124 (54.15%)
1 The following disorders were classified as developmental disorders: mild mental disability; moderate mental disability; severe mental disability; specific developmental disorders of speech and language; specific developmental disorders of scholastic skills; specific developmental disorder of motor function; mixed specific developmental disorder; conductive and sensorineural hearing loss; and lack of expected normal physiological development. 2 The following disorders were classified as psychiatric disorders: mental and behavioral disorders due to use of cannabinoids; acute and transient psychotic disorders; manic episode; depressive episode; recurrent depressive disorder; persistent mood [affective] disorders; unspecified mood [affective] disorder; phobic anxiety disorders; other anxiety disorders; obsessive compulsive disorder; reaction to severe stress and adjustment disorders; somatoform disorders; eating disorders; habit and impulse disorders; childhood autism; hyperkinetic disorder; conduct disorders; mixed disorders of conduct and emotions; emotional disorders with onset specific to childhood; disorders of social functioning with onset specific to childhood and adolescence; tic disorders; other behavioral and emotional disorders with onset usually occurring in childhood and adolescence.
Table 2. Dataset description.
CategoryFeaturesDescription
Demographicsage_groupAge group of the children
gender_childGender of the children
area_liveArea of residence
Social liferecommendationsChange in the difficulty to follow recommendations regarding social distancing between the 1st and 2nd lockdown
relationships_friendsChange in the quality of the child’s relationships with his/her friends between the 1st and 2nd lockdown
soc_mediaChange in the time spent using social media (e.g., Facetime, Facebook, Instagram, Snapchat, Twitter, Tiktok) between the 1st and 2nd lockdown
Personal lifepositive_changeChange in the positive changes in the child’s life due to the coronavirus/COVID-19 crisis between the 1st and 2nd lockdown
Family lifefamily_impactIf any event that affected the family occurred due to COVID-19 in the 1st and 2nd lockdown
financeChange in the financial problems faced by the family due to the coronavirus/COVID-19 crisis between the 1st and 2nd lockdown
relationships_familyChanges in the quality of relationships between the child and members of his/her family between the 1st and 2nd lockdown
family_lost_jobWhether the child’s family members lost their job due to coronavirus/COVID-19 in the 1st or/and 2nd lockdown
economical_impactWhether the child’s family members lost earnings due to coronavirus/COVID-19 in the 1st or/and 2nd lockdown
Daily activitiesexerciseChange in the frequency the child engaged in exercise (e.g., increased heart rate, breathing) for at least 30 min between the 1st and 2nd lockdown
video_gamesChange in the time spent playing video games between the 1st and 2nd lockdown
tvChange in the time spent watching TV or digital means (e.g., Netflix, Youtube, or web surfing) between the 1st and 2nd lockdown
readingChange in the frequency the child asked questions, read, or talked about coronavirus/COVID-19 between the 1st and 2nd lockdown
Health concernsworry_self_infectedChange in the child’s worry about becoming infected between the 1st and 2nd lockdown
worry_family_infectedChange in the child’s worry about family members or friends becoming infected between the 1st and 2nd lockdown
worry_phys_healthChange in worry that physical health will be affected by coronavirus/COVID-19
worry_mental_healthChange in worry that the child’s mental/emotional health will be affected by coronavirus/COVID-19 between the 1st and 2nd lockdown
Daily stressesstress_restrictChange in stress caused by the curfew between the 1st and 2nd lockdown
stress_familyChange in stress caused to the child by changes in family contacts between the 1st and 2nd lockdown
worry_living_stabilityChange in the child’s concern about the stability of the family’s living situation between the 1st and 2nd lockdown
hopeful_endChange in how hopeful the child is that the coronavirus/COVID-19 crisis will end between the 1st and 2nd lockdown
Medical diagnosis and carediagnosis_groupDiagnosis defined by the medical expert
symptomsChange in symptoms the child had between the 1st and 2nd lockdown
exposureChild exposed to someone likely to have coronavirus/COVID-19 in the 1st and/or 2nd lockdown
support_activities
support_medical
Support activities, physical or medical, respectively, which were in place for the child and have been disrupted in the 1st and/or 2nd lockdown
family_diagnosisWhether any members of the child’s family have been diagnosed with COVID-19 in the 1st and/or 2nd lockdown
family_hospitilization
family_quarantine
family_death
family_illness
Whether any of the following have happened to the child’s family members because of Coronavirus/COVID-19: hospitalization, self-quarantine, death, and physical illness in the 1st and/or 2nd lockdown
Mood statel1_general_worry
l2_general_worry
How worried the child generally was, in the 1st and 2nd lockdown, respectively
l1_sadness
l2_sadness
How happy versus sad the child was, in the 1st and 2nd lockdown, respectively
l1_anxiety
l2_anxiety
How relaxed versus anxious the child was, in the 1st and 2nd lockdown, respectively
l1_restlessness
l2_restlessness
How fidgety or restless the child was, in the 1st and 2nd lockdown, respectively
l1_anhedonia
l2_anhedonia
Ability of the child to enjoy his/her usual activities, in the 1st and 2nd lockdown, respectively
l1_loneliness
l2_loneliness
How lonely the child was, in the 1st and 2nd lockdown, respectively
l1_irritability
l2_irritability
How irritable or easily angered the child was, in the 1st and 2nd lockdown, respectively
l1_concentration
l2_concentration
How well the child was able to concentrate or focus, in the 1st and 2nd lockdown, respectively
l1_tiredness
l2_tiredness
How fatigued or tired the child was, in the 1st and 2nd lockdown, respectively
l1_rumination
l2_rumination
How often the child was expressing negative thoughts, in the 1st and 2nd lockdown, respectively
Table 3. Hyperparameters of classifiers.
ClassifierHyperparameters
LR-
LogRpenalty = [11, 12], C: [0, 1, 2, 4, 6, 8, 10]
MLPhidden layer sizes: [(2, 5, 10), (5, 10, 20), (10, 20, 50)], activation: [tanh, relu], solve: [sgd, adam], alpha: [0.0001, 0.05], learning rate: [constant, adaptive]
LightGBMn estimators: range (200, 600, 80), num leaves: range (20, 60, 10)
SVM C: [0.001, 0.01, 0.1, 1, 2, 3, 4, 5, 6, 7, 8, 9, 10, 11, 12, 13, 14, 15], kernel: [linear,sigmoid,rbf,poly]
RF criterion: [gini, entropy], n estimators: [10, 15, 20, 25, 27, 30], min samples leaf: [1, 2, 3, 4, 5], min samples split: [2, 3, 4, 5, 6, 7]
XG Boostmax depth: [1, 2, 3, 4, 5, 6, 7, 8, 9, 10], min child weight: [1, 2, 3, 4, 5, 6, 8, 10], gamma: [0, 0.4, 0.5, 0.6, 0.7, 0.8, 0.9, 1]
Table 4. Statistical results of the Mann–Whitney U test for various features between the participants who continued the survey and those who quitted. The p-values lower than 0.05 are shown in bold.
Mann–Whitney U Test
VariableUp-Value
Age49,181.50.00033
Gender54,811.50.06065
Mood state score53,129.50.02715
Diagnosis54,927.00.09506
Living area50,203.00.00050
Positive changes55,271.50.09720
Daily behaviors54,586.00.08347
Table 5. Best AUC-ROC score achieved by each model. The best performing model is indicated in bold.
Prediction ModelBest AUC-ROC ScoreNumber of Features
Linear Regression73.61%4
Logistic Regression73.17%4
LightGBM73.85%14
Random Forest76%13
XGBoost75.93%12
SVM linear73.90%8
SVM poly74.26%10
SVM rbf74.15%10
SVM sigmoid72.42%10
MLP72.85%4
Table 6. Statistical analysis for mood state change between classes based on the most contributed factors derived from SHAP analysis.
FeaturesDeterioration vs. Amelioration/Stability of Mood State
stress_restrictp = 0.001
positive_changep = 0.000
social_mediap = 0.002
diagnosis_groupp = 0.000
readingp = 0.001
worry_phys_healthp = 0.057
area_livep = 0.061
Table 7. Most important features of RF based on ROC_AUC and SHAP.
Most Important Features
RF with ROC_AUCRF with SHAP
stress_restrictstress_restrict
positive_changepositive_change
social_mediasocial_media
worry_phys_healthdiagnosis_group
relationships_friendsreading
diagnosis_groupworry_phys_health
readingarea_live
Disclaimer/Publisher’s Note: The statements, opinions and data contained in all publications are solely those of the individual author(s) and contributor(s) and not of MDPI and/or the editor(s). MDPI and/or the editor(s) disclaim responsibility for any injury to people or property resulting from any ideas, methods, instructions or products referred to in the content.