Article

Integrative Meta-Analysis during Induced Pluripotent Stem Cell Reprogramming Reveals Conserved Networks and Chromatin Accessibility Signatures in Human and Mouse

by
Chloe S. Thangavelu
1,* and
Trina M. Norden-Krichmar
1,2,*
1
Department of Biological Chemistry, University of California, Irvine, CA 92697, USA
2
Department of Epidemiology and Biostatistics, University of California, Irvine, CA 92697, USA
*
Authors to whom correspondence should be addressed.
BioMedInformatics 2023, 3(4), 1015-1039; https://doi.org/10.3390/biomedinformatics3040061
Submission received: 30 August 2023 / Revised: 23 September 2023 / Accepted: 17 October 2023 / Published: 6 November 2023
(This article belongs to the Special Issue Feature Papers in Applied Biomedical Data Science)

Abstract

:
iPSC reprogramming involves dynamic changes in chromatin accessibility necessary for the conversion of somatic cells into induced pluripotent stem cells (iPSCs). IPSCs can be used to generate a wide range of cells to potentially replace damaged cells in a patient without the threat of immune rejection; however, efficiently reprogramming cells for medical applications remains a challenge, particularly in human cells. Here, we conducted a cross-species meta-analysis to identify conserved and species-specific differences in regulatory patterns during reprogramming. Chromatin accessibility and transcriptional data as fibroblasts transitioned to iPSCs were obtained from the publicly available Gene Expression Omnibus (GEO) database and integrated to generate time-resolved regulatory networks during cellular reprogramming. We observed consistent and conserved trends between the species in the chromatin accessibility signatures as cells transitioned from fibroblasts into iPSCs, indicating distal control of genes associated with pluripotency by master reprogramming regulators. Multi-omic integration showed key network changes across reprogramming states, revealing regulatory relationships between chromatin regulators, enhancers, transcription factors, and target genes that result in the silencing of the somatic transcription program and activation of the pluripotency gene regulatory network. This integrative analysis revealed distinct network changes between timepoints and leveraged multi-omics to gain novel insights into the regulatory mechanisms underlying reprogramming.

Graphical Abstract

1. Introduction

Characterized by the phenomenal capacity to give rise to every cell type in the body, induced pluripotent stem cells (iPSCs) can be used to replace damaged or diseased tissues and hold great promise for the advancement of potential therapeutics in the field of regenerative medicine [1]. Somatic cells can be reverted to a pluripotent state by inducing the expression of the four Yamanaka factors, Oct4, Sox2, Klf4, and c-Myc, in a process known as iPSC reprogramming [2]. However, iPSC reprogramming, especially in human cells, is an inefficient process that results in heterogeneous populations wherein few cells effectively achieve pluripotency [3,4]. Currently, our ability to harness reprogramming for practical applications in regenerative medicine is hampered by our incomplete understanding of the molecular mechanism that underpins reprogramming in human cells.
In the interest of developing more efficient ways to derive these cells for clinical applications, various genomic and epigenomic sequencing approaches have been conducted to better understand the mechanism of reprogramming. The reprogramming process has most extensively been characterized in mouse embryonic fibroblasts (MEFs) in an effort to describe the transcriptomic and epigenomic modifications involved in the acquisition of pluripotency [5,6,7,8,9]. Fewer studies have focused on reprogramming towards pluripotency in human cells due to the comparative technical challenges and confounding factors, such as variations in donor genetic background and reprogramming systems [10,11]. Human and mouse pluripotent stem cells have different morphologies, signaling systems, and epigenetic configurations, that result in differences between the two models with respect to reprogramming [12]. Mouse studies have mainly focused on reprogramming to a naïve pre-implantation-like cellular state [13], whereas human cells conventionally undergo reprogramming to a more advanced, primed state, complicating the translatability of mouse models to human reprogramming.
Various transcriptomic and epigenetic approaches have been employed to understand reprogramming mechanisms and profile the transcriptome and chromatin accessibility of human reprogramming cells [14,15,16,17]. Genome-wide analyses of accessible chromatin, which marks the presence of active regulatory DNA [18], including promoters, enhancers [19,20,21], and transcription factor binding sites [19,22,23,24]. These studies have uncovered orchestrated global changes in chromatin accessibility [25] and regulatory elements directing the reprogramming process that are crucial components of the reprogramming mechanism [8]. However, regulatory networks for reprogramming typically rely on co-expression analysis, and fail to incorporate how these extensive changes in chromatin accessibility relate to changes in gene expression. Current network models of human cellular reprogramming have been limited by lack of temporal resolution or multi-omic integration. Some studies do not incorporate time course data of the reprogramming process, but rather iPSCs that had already undergone reprogramming [25]. Alternatively, others use co-expression-based software to derive regulatory networks primarily from expression data or do not fully capitalize on integration of both transcriptome and epigenome data when constructing their network [14,26].
Associating changes in chromatin accessibility with changes in gene expression can help to decipher gene regulatory networks by informing whether differentially expressed genes also have differential chromatin accessibility in regulatory regions [27] or are controlled by certain transcription factors based on the accessibility of specific motifs present in open chromatin [28]. Paired expression and chromatin analysis algorithms have been developed to link regulatory regions and their targets on a genome-wide basis using prior ChIP-seq and co-accessibility data [29], highlighting local cis interactions such as co-binding transcription factors (TFs), promoter regulation, and local enhancer regulation, and long-range cis interactions such as chromatin looping and distal enhancer regulation [30,31].
While prior studies have pioneered the study of the diverse routes traversed by reprogramming cells [14] and presented a roadmap for transcription-factor-mediated reprogramming in human cells [32], no study to date has integrated transcriptomic and epigenomic data to reconstruct regulatory networks and develop a model that fully encompasses the reprogramming machinery in the human cell. How the epigenome directs changes in gene expression that result in the reprogramming process remains a key missing link in our knowledge of how pluripotency is attained and remains a hinderance in our ability to innovate efficient reprogramming methods for therapeutic use. More integrative approaches have now been developed to construct regulatory networks from joint analysis of gene expression and chromatin accessibility data [29] that can be utilized to address these knowledge gaps.
In this present work, we first conducted a meta-analysis on chromatin accessibility in reprogramming iPSCs to identify conserved patterns across species. Using recently developed integrative approaches to address the limitations of earlier studies, multiple next generation sequencing data types were integrated to generate novel regulatory networks reflecting the changes reprogramming cells undergo, integrating the regulatory action of distal elements on their target genes. The results from these analyses can be used to better understand the mechanism of reprogramming, and how it can be exploited to improve the efficiency of current reprogramming methods so that they can be harnessed for therapeutic purposes.

2. Materials and Methods

Data Acquisition. RNA and ATAC-sequencing data that were generated as mouse and human fibroblasts transitioned to iPSCs, were obtained from the publicly available Gene Expression Omnibus (GEO) database. The datasets used in this study were deposited under accession numbers GSE101905 [8], GSE93029 [33], and GSE147641 [32]. The GSE101905 and GSE93029 datasets contained samples from a fibroblast stage, four intermediate reprogramming stages, and a pluripotent stage. GSE147641 contained samples from a fibroblast stage, three intermediate reprogramming stages, and two pluripotent stages. The pluripotent stages included iPSC cells from day 21, as well as later iPSC cells derived after several passages to check genomic stability. The RNA sequencing data from GSE101905 utilized in the current study, had been processed with HISAT2 [34] and GenomicRanges [35] software and deposited in the GEO database in tabular format consisting of transcripts per million (TPM) counts. The RNA sequencing data from GSE93029 had been processed with RSEM [36] software and deposited in the GEO database as raw counts. The RNA sequencing data from GSE147641 had been processed with STAR [37] v2.5.2b and featureCounts [38] v1.5.2 software and deposited in the GEO database as raw counts. For the characterization of peaks, we used and compared the two mouse datasets, GSE101905 and GSE93029. For the paired expression and chromatin accessibility analysis, we used only the GSE101905 dataset for mouse, and GSE147641 for human.
RNA-seq Pre-processing. For the mouse dataset GSE101905 [8], processed GEO expression files were provided in gene symbol and TPM format and directly inputted into PECA2 [29,39] v3.0.1 for paired expression and chromatin analysis (PECA). For the human dataset GSE147641 [32], gene Ensemble IDs were supplied in processed GEO RNA-seq files; therefore, Ensemble IDs were converted to gene symbols with the Biomart [40,41] v2.46.3 mapIds function using the AnnotationDbi package org.Hs.eg.db [42] v3.12.0. Human RNA-sequencing files containing transcript-level values were consolidated to gene-level values using TxImport [43] v1.18.0. Human dataset tag counts were normalized by the gene length provided by FeatureCounts and converted into reads per kilobase per million mapped reads (RPKM) values using the rpkm() function in edgeR [44] v3.32.1. To directly compare gene expression in similar units for human and mouse in figures detailing gene expression, raw human counts were converted to TPM values using the TPM() function in RNAnorm [45] 2.0.0, then analyzed with PECA2 software. RNA-sequencing files containing gene symbols and TPM or RPKM values were used for downstream paired chromatin and expression analysis. The methods diagram for the data analysis used in the current study is summarized in Figure 1.
ATAC-seq Pre-processing. To obtain binary alignment and map (BAM) files necessary for downstream PECA analysis, raw ATAC-sequencing fastq files were obtained from the Sequence Read Archive (SRA) with the SRAtoolkit [46] v2.10.8 prefetch command. ATAC-seq SRA fastq files were aligned to the mouse mm10 genome and human ATAC-seq SRA files to the human hg19 genome using bowtie2 [47] v2.3.2. The resulting ATAC-seq BAM files were sorted and indexed with SAMtools [48] v1.10. Mitochondrial DNA alignments were removed with the removeChrom Harvard ATAC-seq module (https://github.com/jsh58/harvard/blob/master/removeChrom.py, accessed on 20 September 2021). PCR duplicates were removed with Picard v2.24.1 (http://broadinstitute.github.io/picard/, accessed on 20 September 2021). Blacklisted genomic from the mm10 Boyle Lab Blacklist [49] v2 regions, which generally cause erroneous signal, were filtered out from mouse files and blacklisted genomic regions from the hg19 Boyle Lab blacklist v2, 2019 were filtered out from human files using bedtools2 [50] v2.29.2.
Differential Chromatin Accessibility and Motif Enrichment Analysis. To visualize the variation in chromatin accessibility in multiple reprogramming datasets, processed ATAC-seq bed files from two mouse studies, GSE101905 and GSE93029, were merged. ATAC-seq samples provided in the GSE101905 dataset were previously processed with bowtie2 v2.2.7, sambamba [51] v0.6.3, and MACS [52] v2.1.0 software. ATAC-seq samples provided in the GSE93029 dataset were previously processed with bowtie2, SAMtools, and dfilter [53] software. ATAC-seq samples from two human donors, GSE147641, were also merged. Bedtools2 v2.29.2 intersect was used to merge peaks of biological and technical replicates of ATAC-sequencing samples, requiring a reciprocal 50% overlap between replicate peaks. Corresponding MEF and iPSC timepoints from both datasets were merged. For intermediate timepoints, all peaks provided by GSE101905 that were present in at least one intermediate peak in the GSE93029 dataset were retained for downstream analysis, using the multi-intersect bedtools function. For motif enrichment analysis, bedtools subtract was used to remove fibroblast stage peaks that overlapped with peaks in reprogramming cell samples, which were not differentially accessible. Hypergeometric Optimization of Motif EnRichment [54] (HOMER) v3.12, 6-8-2012 was used to identify motifs enriched in peaks with the findMotifsGenome.pl program and locate genes nearest to each consensus peak to perform gene ontology analysis with the annotatePeaks.pl –go option. The Chipseeker [55,56] v1.36.0 R package was used to generate plots of locations of consensus peaks and their genomic features. To visualize the correlation between peaks and motifs, a motif file was generated with findMotifsGenome.pl and used with the annotatePeaks.pl tss –m option to locate distances of each motif instance from accessible regions.
Paired Expression and Chromatin Accessibility Analysis (PECA2). For each sample, ATAC-seq BAM files were integrated with TPM or RPKM gene expression files with PECA2 [29,39] v3.0.1. PECA2 was selected because the software is able to correlate a large number of transcription factors with enhancers and target genes by taking advantage of prior Encyclopedia of DNA Elements (ENCODE) data from multiple cellular contexts. PECA2 canvases the whole spectrum of known transcription factors in the ENCODE mouse and human ChIP-seq databases, and as a result, can investigate diverse transcription factor binding interactions and a broader context of regulatory activity than individual ChIP-seq experiments. PECA2 generated the output files containing epigenetic regulatory interactions for each sample. PECA2 prior data combines an extensive amount of ChIA-PET data, co-accessibility data, and ENCODE ChIP-seq datasets from a diversity of tissues, totaling 931,427 enhancers in total that include more than 70% of conserved non-coding sequences [29]. The construction of trans-regulatory networks is based off several assumptions built into the PECA model, which supports that the interactions between target genes and their transcription factors can be modeled based on the accessibility of regulatory elements and expression of TFs and chromatin regulators. It should be noted that while PECA’s prior information is experimentally validated in multiple cellular contexts, PECA extrapolates data derived from known contexts and transfers these findings to new, different contexts [29,39].
Using the PECA.sh MATLAB script, PECA2 was used to generate six kinds of output files: a chromatin regulator (CR) binding matrix, enhancer openness file, trans-regulatory score (TRS) matrix, transcription factor–target gene (TF–TG) interaction network file, and a TF–TG interaction module file. The chromatin regulator (CR) binding matrix contained the likelihood of recruitment of common CRs to known enhancers by TFs. The likelihood p-value was calculated based on the accessibility of the enhancer region, the expression of transcription factors that mediate the interaction (which are TFs that have a motif match to the enhancer and known protein–protein interactions with the CR), and the binding potential and specificity of the transcription factor for the given enhancer. The enhancer openness file contained the calculated openness score of enhancer regulatory elements (REs), based on user-provided chromatin accessibility data versus prior ENCODE data containing the median openness of known enhancers. The trans-regulatory score (TRS) matrix file contained the predicted regulation score of transcription factors (TF) on target genes (TG), which are used to infer important TF–TG interactions. The TRS incorporates information about the expression of a TF, the expression of a target gene, and whether the TF has motif-matches for the target gene’s enhancers. Enhancers are associated with genes using the distance between the target gene and the enhancer, as well as the correlation between the accessibility of the target gene’s promoter and the enhancer. The TF–TG interaction network file contained TF–TG regulatory relationships scored by probability of regulation, and the predicted enhancers mediating these interactions. Lastly, the TF–TG interaction module file contained only the highest ranked interactions in the network file. The PECA_compare_Diff.sh function was used to merge technical replicates and compare all timepoints against the fibroblast stage to create differential networks, identifying transcription factor–target gene interactions unique to that timepoint.
Enhancer Identification and Analysis. PECA2 was also used to identify the most essential enhancers mediating interactions between hub transcription factors and their target genes. From the PECA2 network file for each timepoint, the enhancers that were associated with the top 200 TF–TG interactions with the highest scores were selected for downstream analysis. The sum of the associated TF–TG score interactions for six main transcription factors were plotted as a heatmap with the gplots [57] R package heatmap.2 function, with enhancer regions clustered on the y-axis by dendrogram. The row z-score histogram color legend was produced by setting the scale parameter to normalize the heatmap by row. In addition, the top 60 enhancers from the PECA2 network file for mouse day 9 and human day 13 were selected and cross-referenced with the enhancer openness files for all timepoints. Enhancers were matched to corresponding enhancer regions in all other timepoints, provided that the enhancer remained open and was detected as accessible in the other timepoints. For dissimilar timepoints with significantly less enhancer overlap, such as the fibroblast stage, the proportion of enhancers that were no longer open were not included in median/distribution analysis for that timepoint. Statistics comparing the mean openness between timepoints were calculated with the stat_compare_means function t-test option from the ggpubr [58] v0.6.0 R package.
Network Visualization and Analysis. Network files were imported into Cytoscape [59] v3.9.1 to visualize transcription factor (TF)–target gene (TG) interactions, depicted by network edges. Edge width was scaled by the probability of regulation according the to the score provided by PECA2’s analysis, and edge color was scaled by the Pearson’s correlation of the TF and TG expression across ENCODE data. Corresponding expression files quantified in transcripts per million (TPM) were imported per timepoint, and node color was scaled according to gene expression. Networks were filtered for transcription factors and target genes with the top 15 highest PECA scores, and all edges between these nodes using Cytoscape edge and node filter functionalities. In cases where the difference in node significance between the 15th and 16th ranked nodes was arbitrarily close, the top 16 nodes were included.
Cytohubba [60] v0.1 was used for topological analysis such as degree and bottleneck centrality, and multiple other centralities for the selected nodes, including edge percolated component (EPC), closeness, betweenness, and stress centralities. Degree indicates the number of connections a node has with other nodes in the network, or how many genes a given gene regulates. A higher degree score correlates with the essentiality of the gene [61] and is a characteristic of a hub regulator. Bottleneck centrality [62] is a measure of the extent to which a node constrains connectivity, and how greatly the removal of a node disrupts the network structure. Betweenness centrality [63] correlates closely with bottleneck centrality and identifies nodes that act as focal points of information traffic in the network. A node behaves as a bottleneck with high betweenness centrality if many of the shortest paths between nodes must go through it to communicate across the network. These nodes may have a low degree but are crucial to preserve network connectivity. Other centralities included closeness centrality [64], where a high closeness score corresponds to short distances to all other nodes; edge percolated component, a global measure of connectivity also associated with essentiality [65]; and stress centrality [66], a measure of the ability of a node to control the flow in a network based on the number of shortest paths passing through the node. Nodes that are frequently on shortest paths between nodes will have a higher stress centrality. Unlike bottleneck centrality, stress centrality measures the absolute number of shortest paths instead of a fraction of the shortest paths passing through a node.
The TRS matrix generated by PECA2 was used to produce TRS heatmaps of select genes within module file networks using the base R heatmap function. The ggplot2 [67] v.3.3.3 R package with the stat_summary mean function was used to produce line graphs of the mean expression of network genes from each module file produced by PECA2. Human symbols were converted to mouse symbols with the Human and Mouse Homology Classes with Sequence information provided by the Mouse Genome Informatics (MGI) Database (http://www.informatics.jax.org/downloads/reports/HOM_MouseHumanSequence.rpt, accessed on 30 June 2023) by matching corresponding gene symbols by DB Class Key. Jaccard Similarity, defined as the number of common genes divided by the total genes in two networks, was used to compare similarity between networks. All transcription factors and the top 200 target genes identified in each module file were used as input for canonical pathway analysis with Ingenuity Pathway Analysis [68] software (QIAGEN Inc., Redwood City, USA, June 2023 release). Heatmaps of the top canonical pathways were visualized using the −log(p-values) and gene ratios across the timepoints.

3. Results

3.1. Differential Chromatin Accessibility and Motif Enrichment Analysis

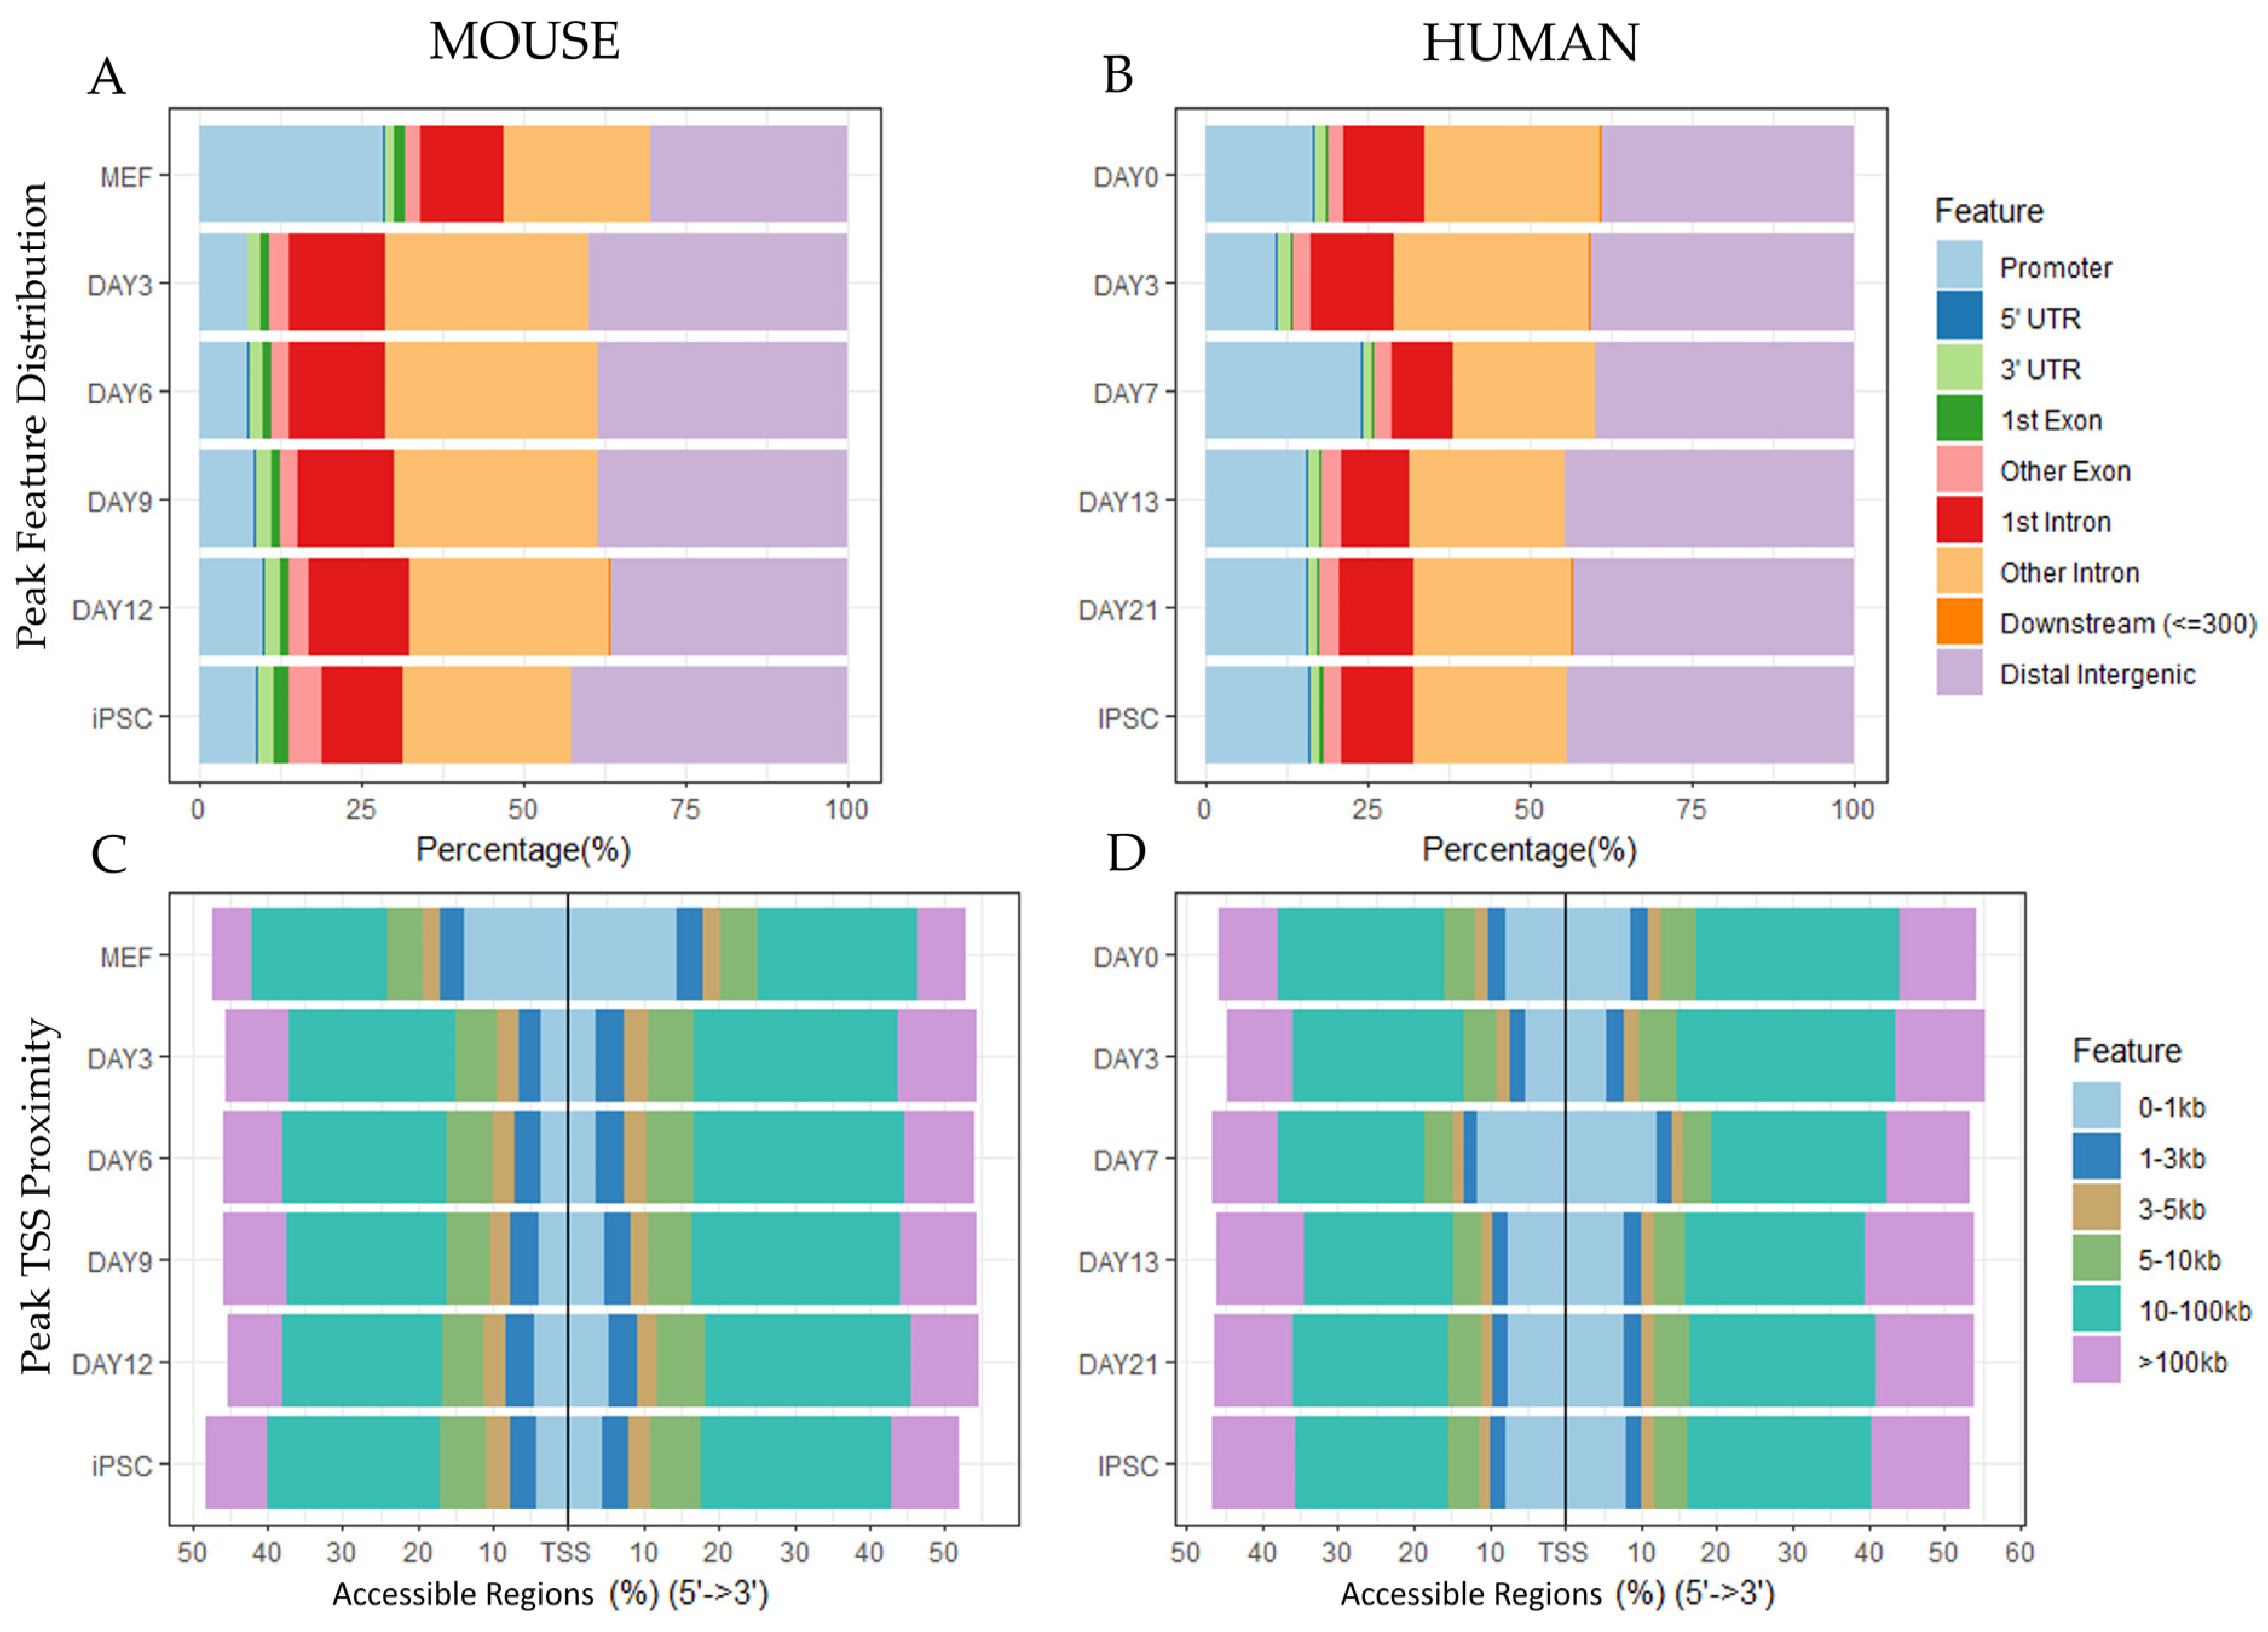
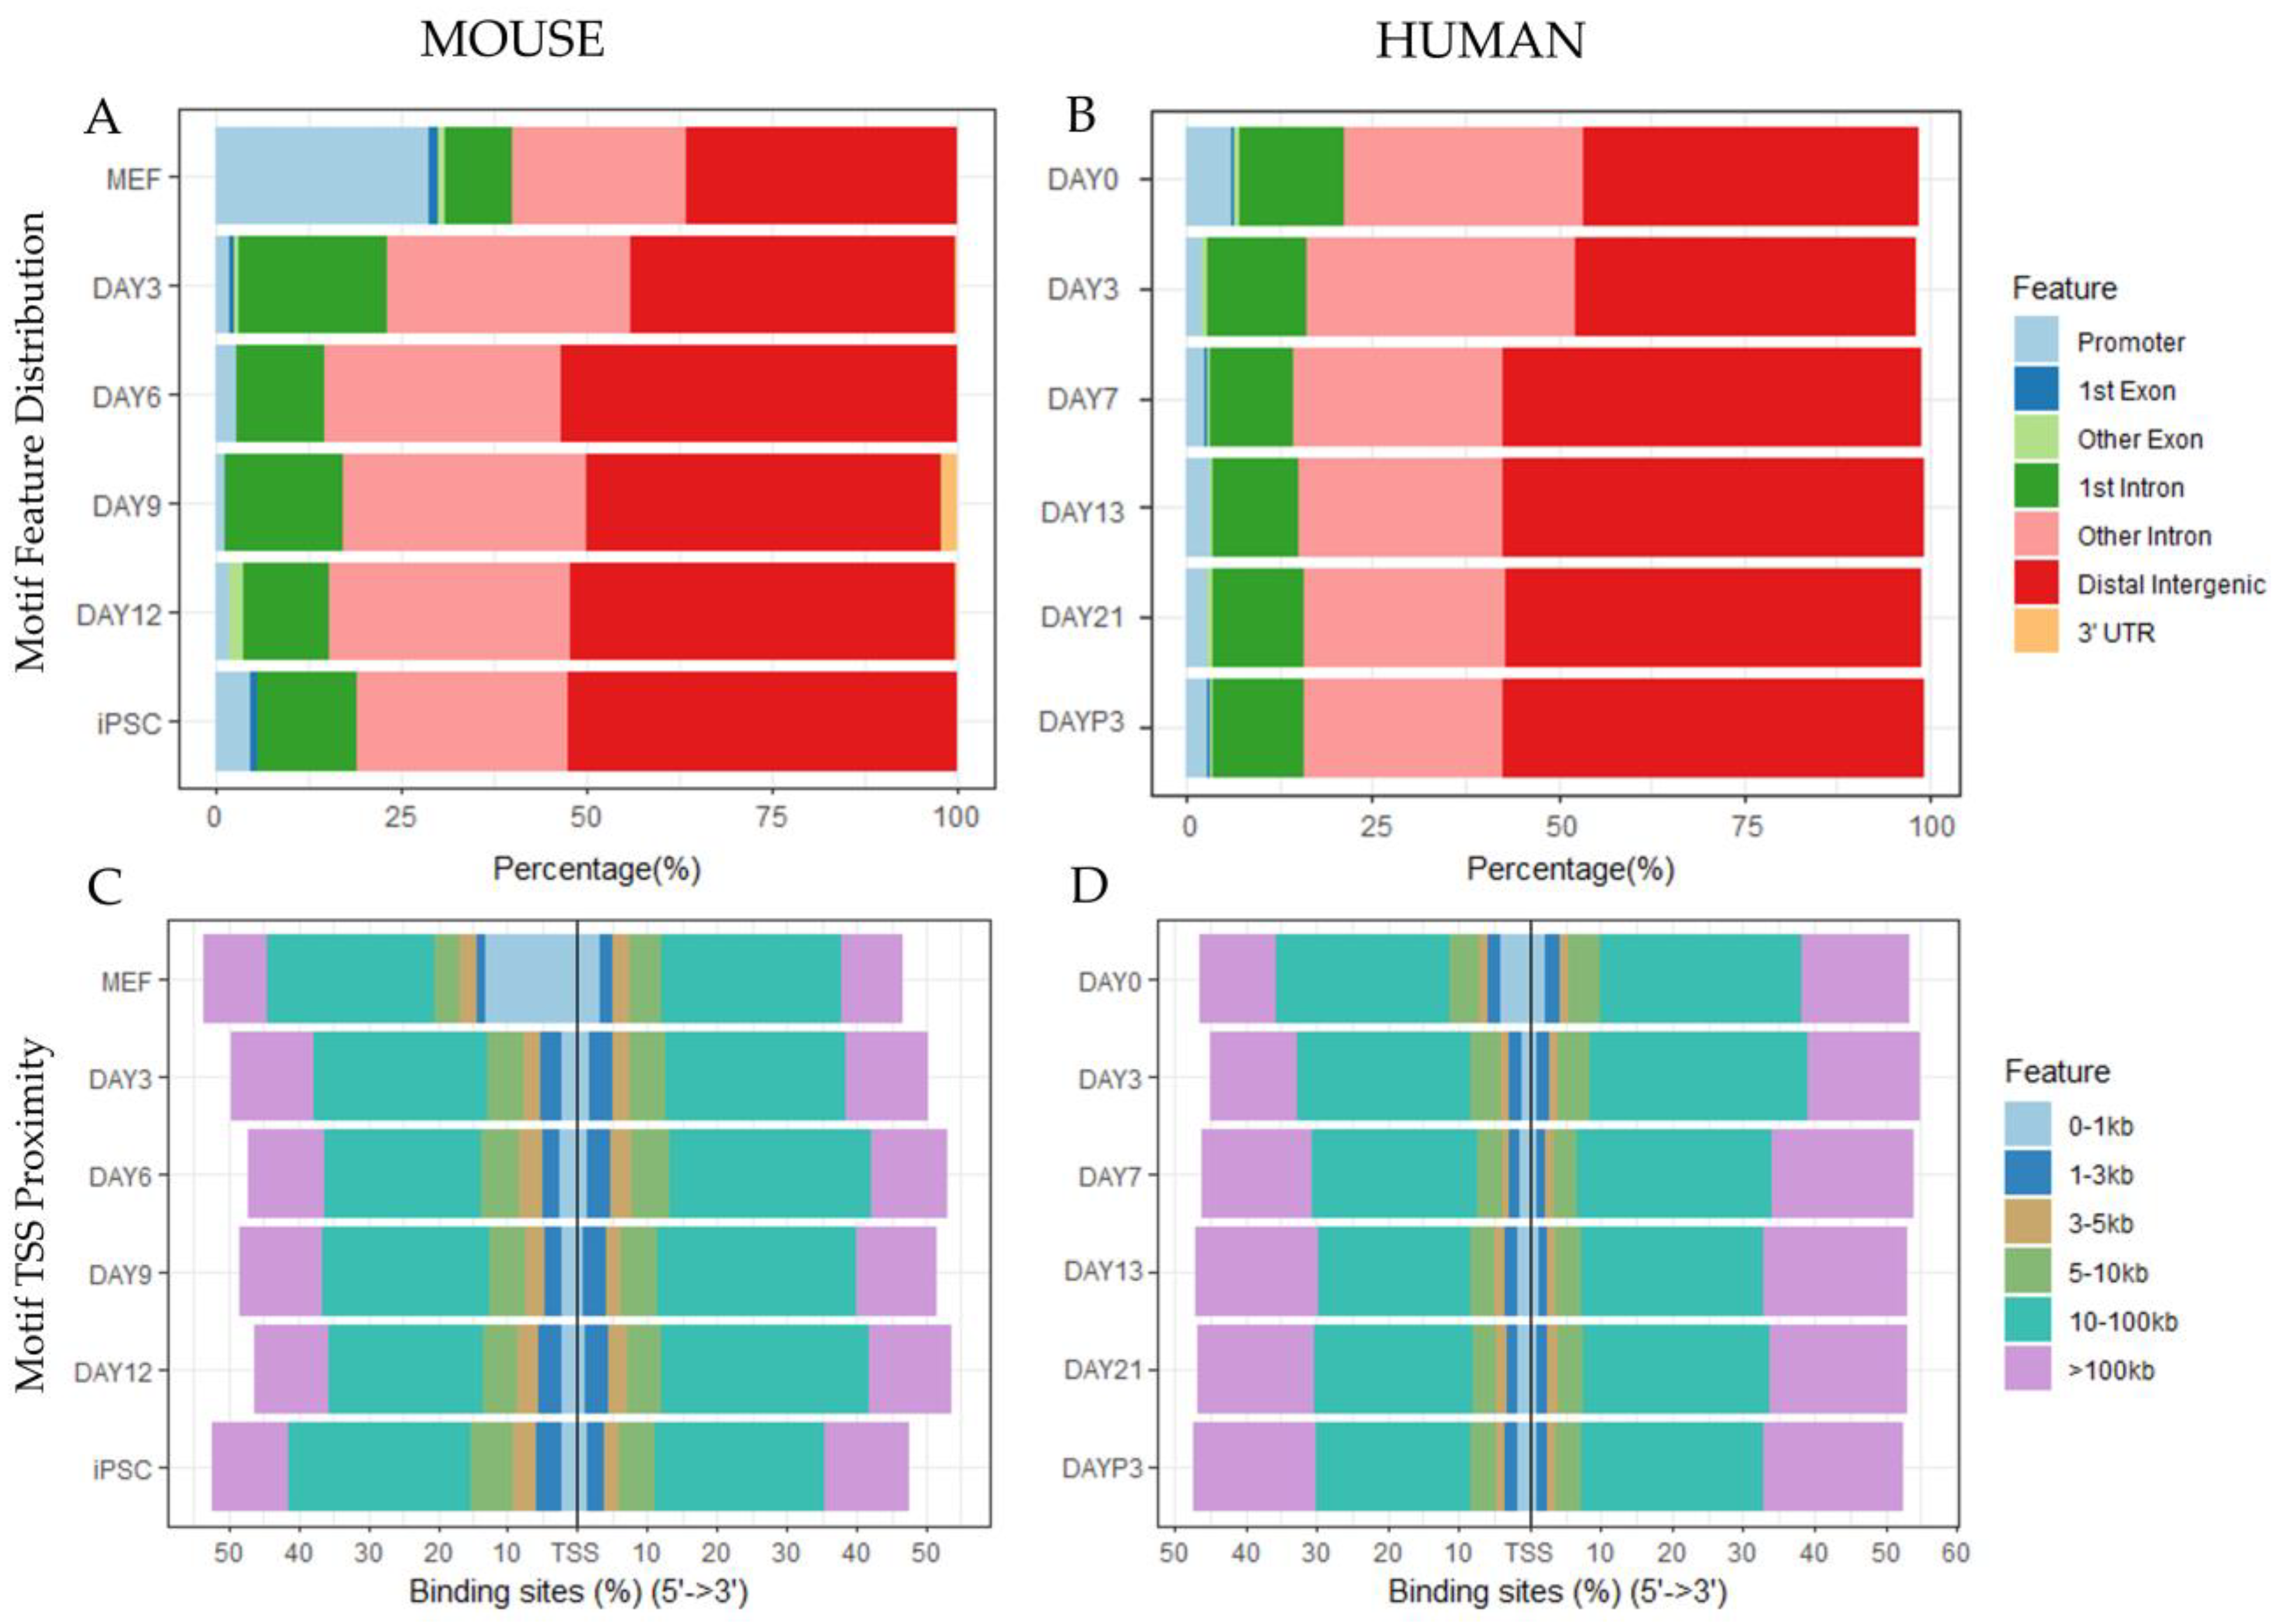
3.1.1. Peak Locations Show Diverse Changes in Chromatin Accessibility across Species and Datasets

The initial objective of the meta-analysis was exploration of several datasets to confirm conserved patterns between species and to verify the datasets were suitable for integrative analysis. The locations of accessible regions within the genome were compared between mouse and human reprogramming ATAC sequencing datasets (Figure 2). Two mouse reprogramming datasets and two human reprogramming replicates were merged to visualize species-specific trends in chromatin accessibility. The meta-analysis revealed that distributions of ATAC peaks by timepoint varied between experiments conducted on the same species, which is attributable to differences in methodology, statistical selection of peaks, and natural variation. Despite variation between studies, species-specific patterns emerged. Reprogramming mouse cells exhibited a decrease in accessibility in promoter regions at day 3 that continued until the iPSC stage, and human reprogramming cells exhibited a slight increase in accessibility in promoter regions at day 7. The locations of peak with respect to the transcription start site (TSS) showed a similar distribution for human and mouse. The majority of accessible regions were located 10kb or further from the transcription start site of genes. Regions 0-1kb from the transcription start site became less accessible early in the time course at day 3 for mouse but stayed relatively constant for human.

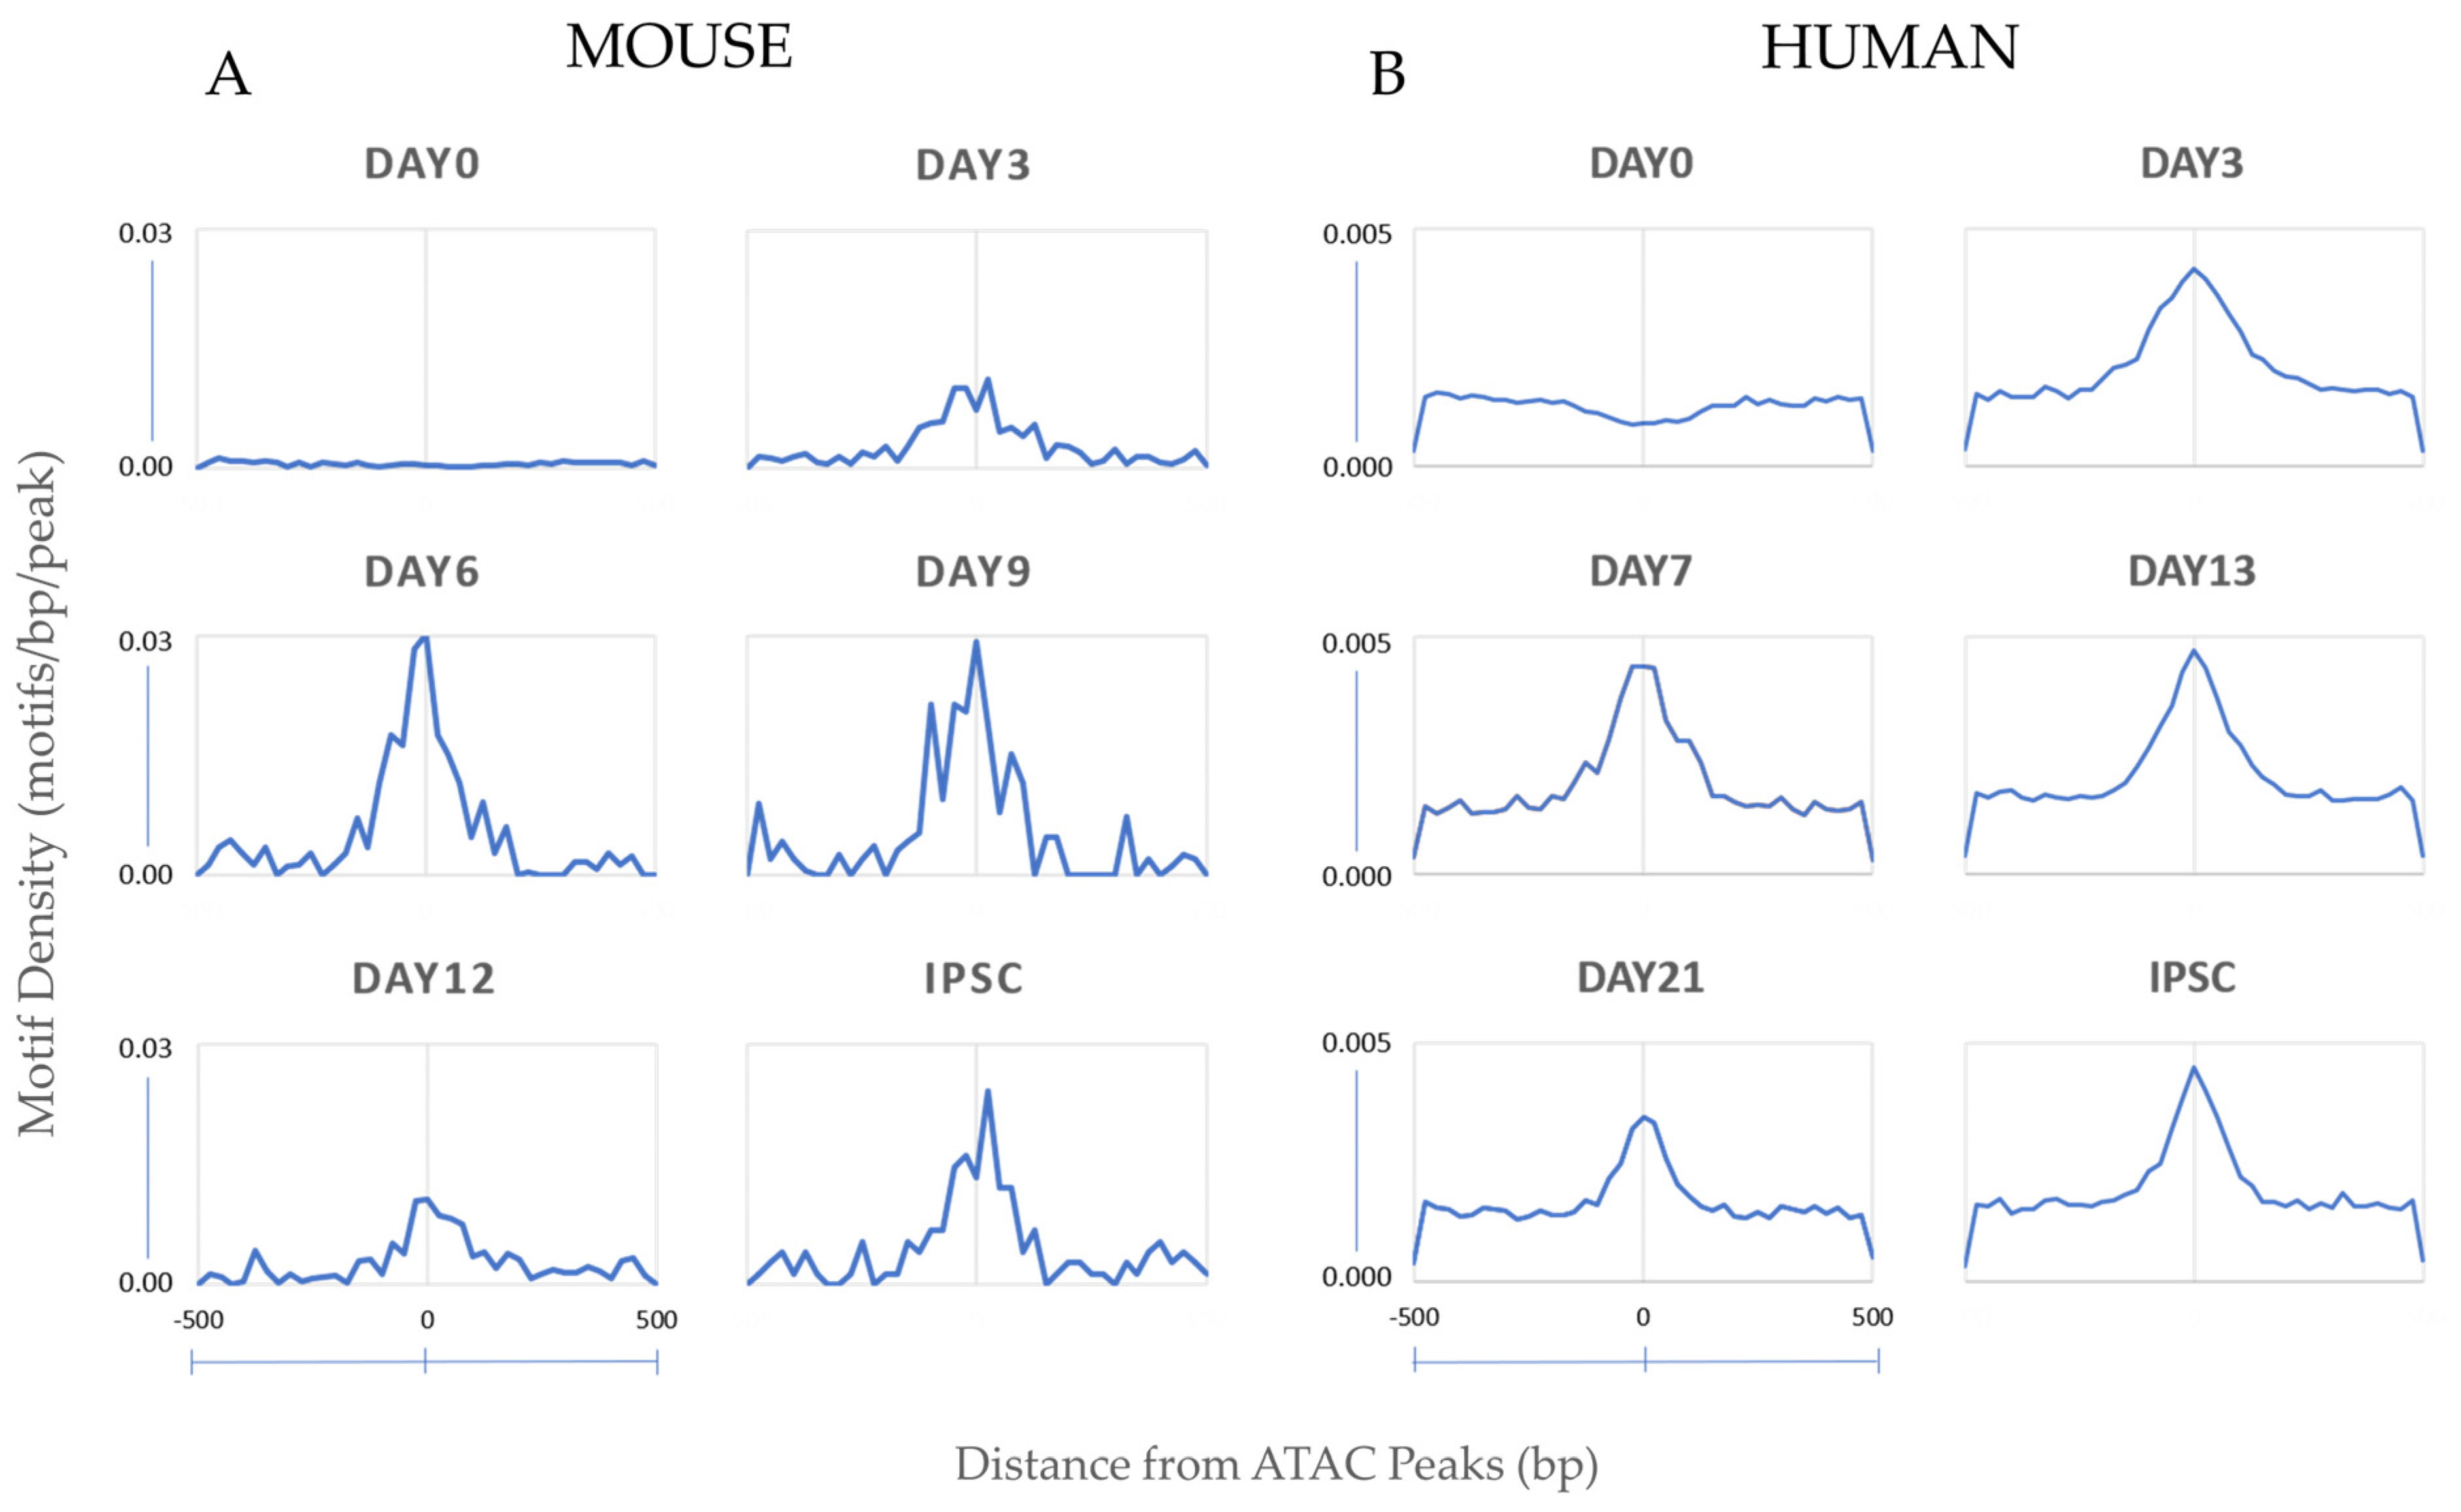
3.1.2. Motif Enrichment Analysis Reveals Common and Species-Specific Motifs across Timepoints

We were able to confirm the presence of key transcription factor motifs and analyze differences in their frequencies between species. The most highly enriched motifs in accessible regions were identified by day for each species using HOMER [54], which identifies these motifs by sequence matching to known transcription factor motifs in the HOMER database. Species comparison showed differences in the levels of motif enrichment at the later timepoints. Somatic transcription factors such as FOSL-encoding genes and JunB, which preserve fibroblast identity, were only highly enriched in the initial, pre-reprogramming and the earliest intermediate stages of each species and lost enrichment thereafter, similar to previous patterns observed in mouse [7] and human [14]. The most highly enriched motif in human accessible regions was CCCTC-binding factor (CTCF), a zinc-finger protein that controls gene expression by rearranging chromosomal architecture and regulating distant chromatin interactions, as well as the CTCF paralog, BORIS.
Notably, both species showed the composite Oct4-Sox2-Tcf-Nanog (OSTN) motif as highly enriched and statistically significant by HOMER during the reprogramming timepoints (Table 1). Tcf3, which enhances early-stage reprogramming and co-occupies many pluripotency genes with Oct4, Sox2, and Nanog, is part of the T-cell factor protein family. Binding sites for T-cell factor proteins (Tcf) [69], which constitute part of the WNT signaling pathway and are sufficient for embryonic stem cell self-renewal [70,71,72,73], were present in this motif. The OSTN motif became increasingly more accessible during the reprogramming time course for both species, indicating that regulatory elements containing the motif became open as reprogramming progressed (Figure 3).

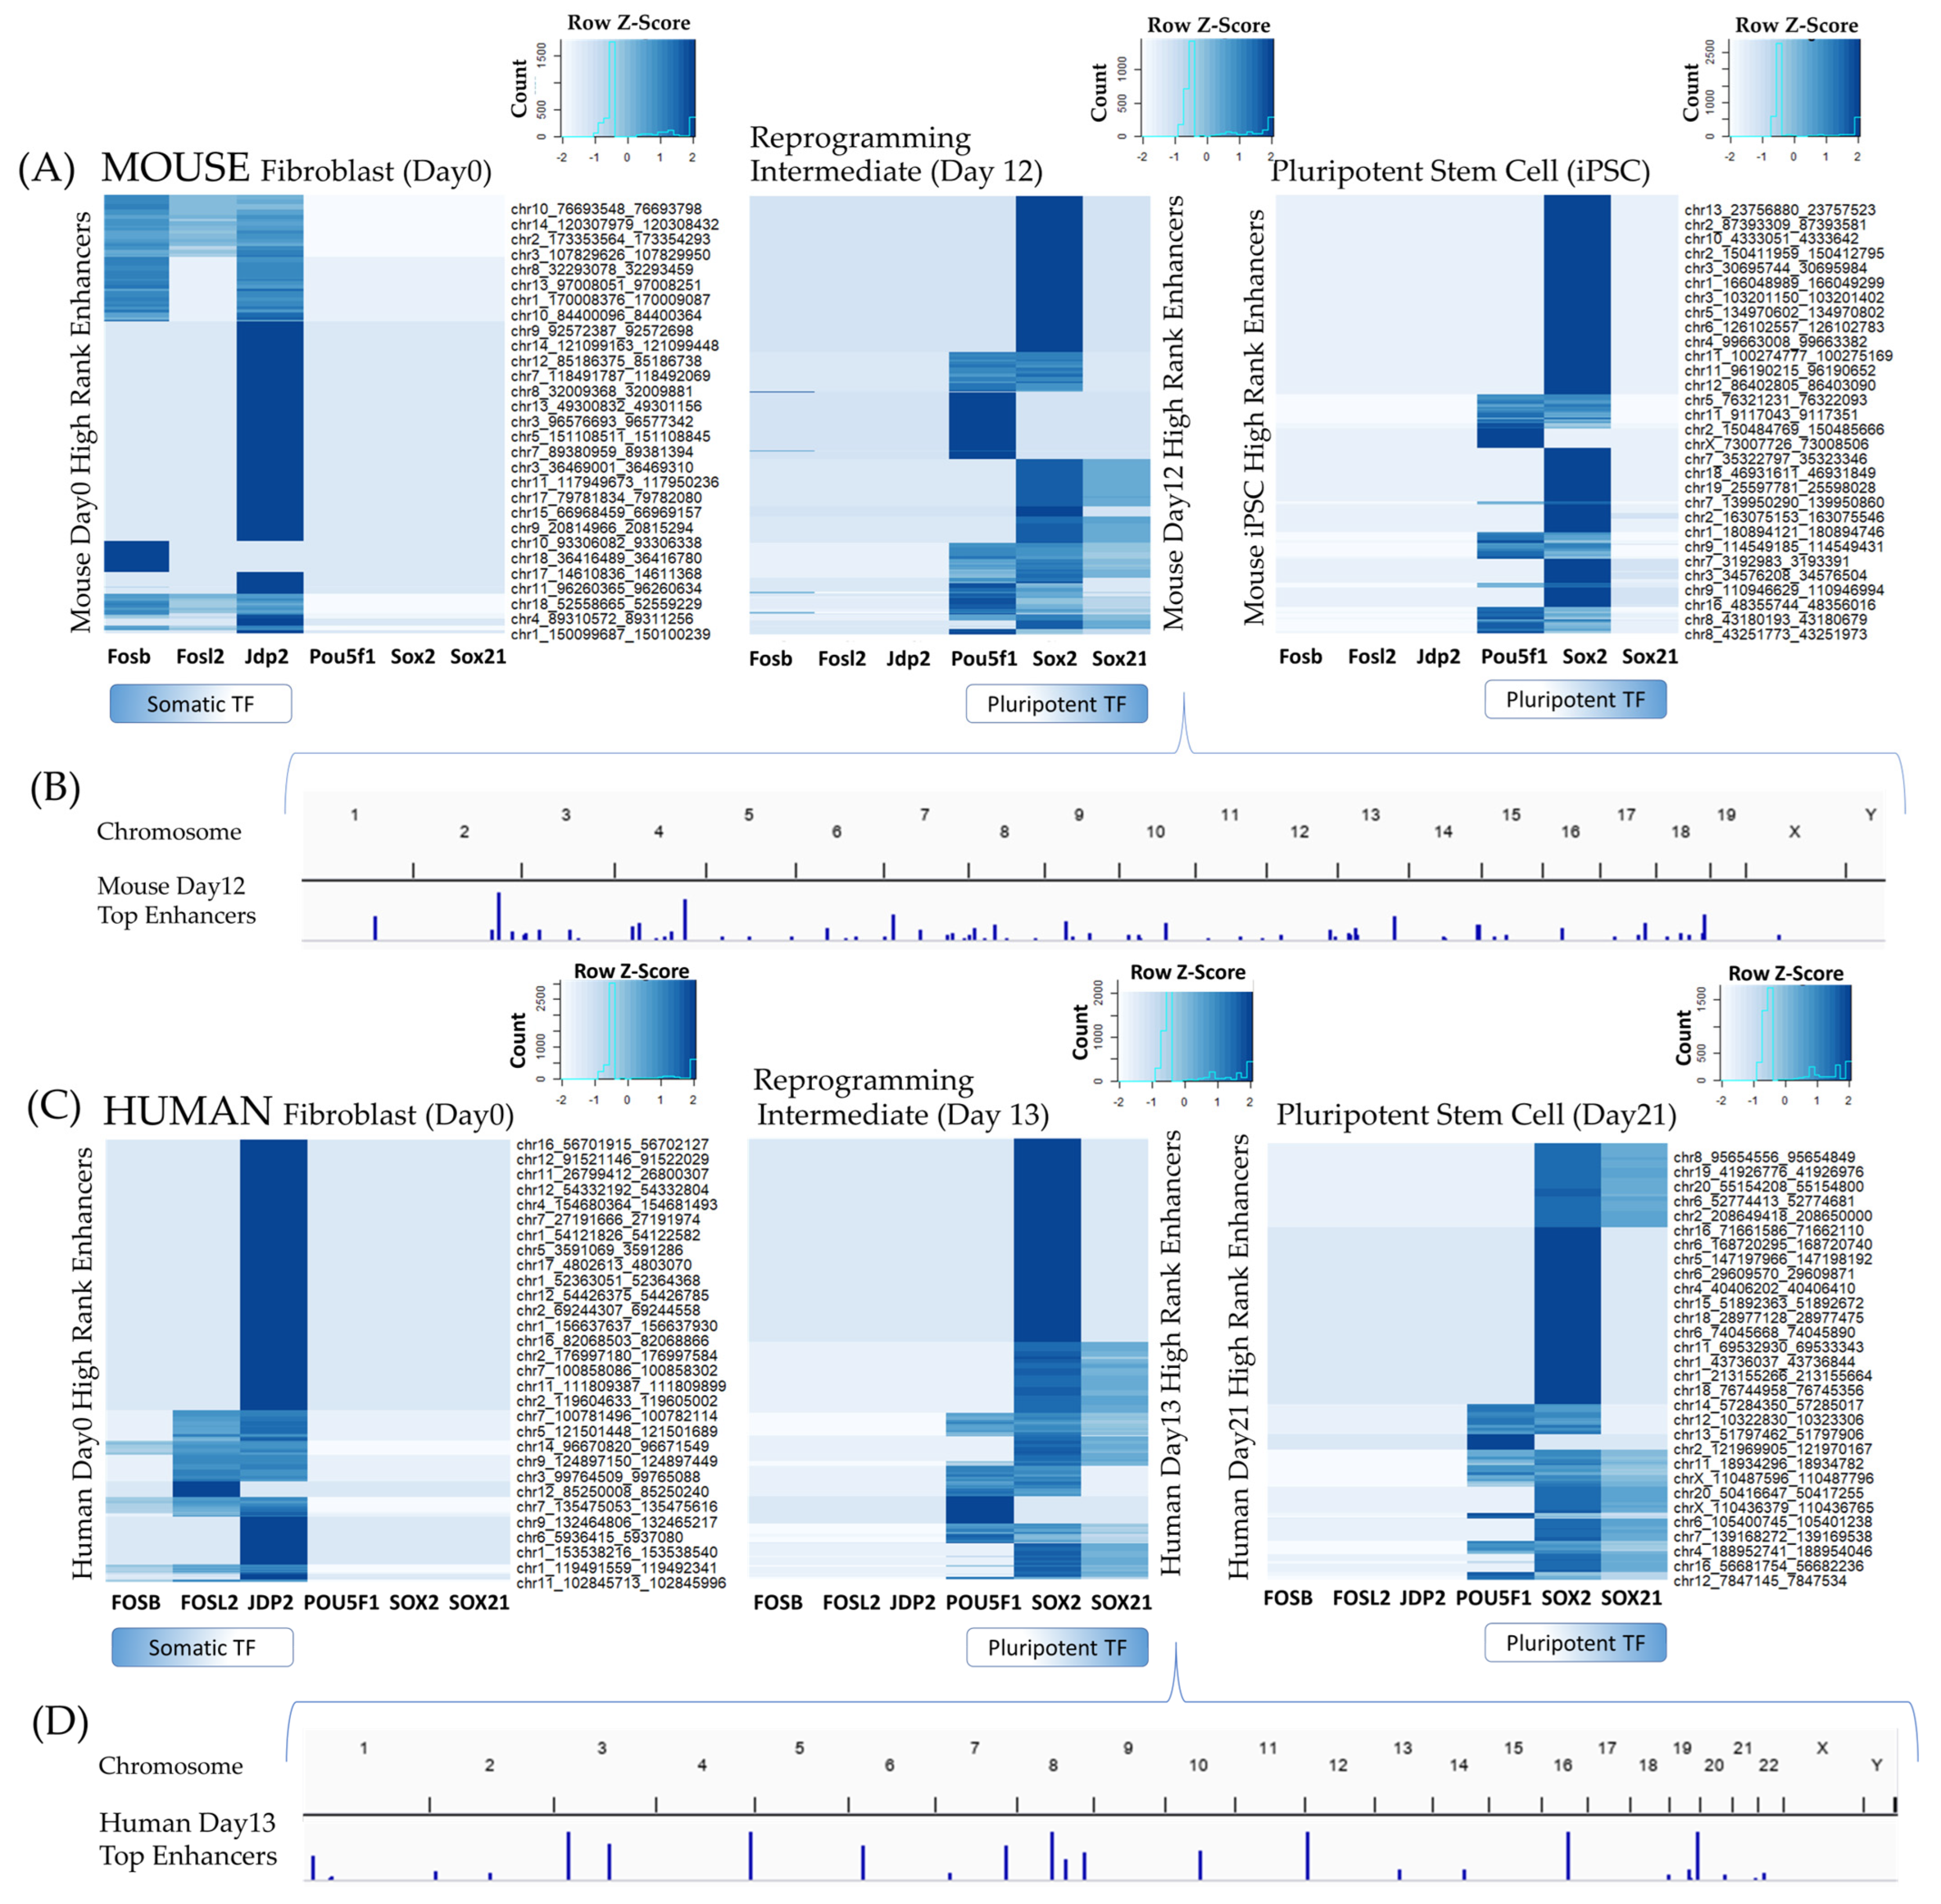
3.1.3. Oct4-Sox2-Tcf-Nanog (OSTN) Orchestrates Changes from Distal Enhancers

Limiting the accessible regions to those containing the highly enriched OSTN motif revealed a clearer pattern that was conserved across species. The accessible OSTN motifs were predominately located in distal intergenic and downstream accessible regions (Figure 4). This would suggest that while many promoter regions become accessible as a result of reprograming, the OSTN transcription factors mainly orchestrate reprogramming changes at much further distances, through regulatory elements at least 10–100 kb or even greater distances away from the target gene.

3.2. Cis-Regulatory Network Analysis

3.2.1. Enhancers Mediating TF–TG Interactions during Reprogramming

Because the Oct4 and Sox2 transcription factors acted primarily from distal regulatory regions to invoke transcriptional changes, identifying the key enhancers involved and their regulatory activities was the next consideration. Given that putative enhancers were located 10–100 kb or further from target genes, an integrative, paired expression, and chromatin accessibility (PECA) model was implemented instead of proximity-based enhancer annotation. PECA2 was used to rank the most essential enhancers and identify enhancer interactions with hub transcription factors and target genes. A total of 2,384,764 unique enhancer interactions were identified in mouse cis-regulatory networks, and 1,135,104 enhancers interactions in human networks in the initial timepoints (Supplemental Tables S1 and S2). Enhancers associated with the top 200 highest predicted regulatory scores between transcription factors and target genes were selected from each timepoint and correlated with fibroblast and pluripotent-associated transcription factors (Figure 5). The most active enhancers at day 0 fibroblast stages where the most highly associated with fibroblast-associated transcription factors such as Fosb, Fosl2, and Jdp2, for both mouse and human reprogramming cells. The most active enhancers at reprogramming timepoints day 3 and onwards, were associated with pluripotency-associated transcription factors such as Pou5f1, Sox2, and Sox21 for both species, indicating integrative paired chromatin accessibility and expression methods were able to quantify relationships between transcription factors and enhancers accurately. Regulatory relationships between additional transcription factors and enhancer regions are further documented in Supplemental Tables S1 and S2.

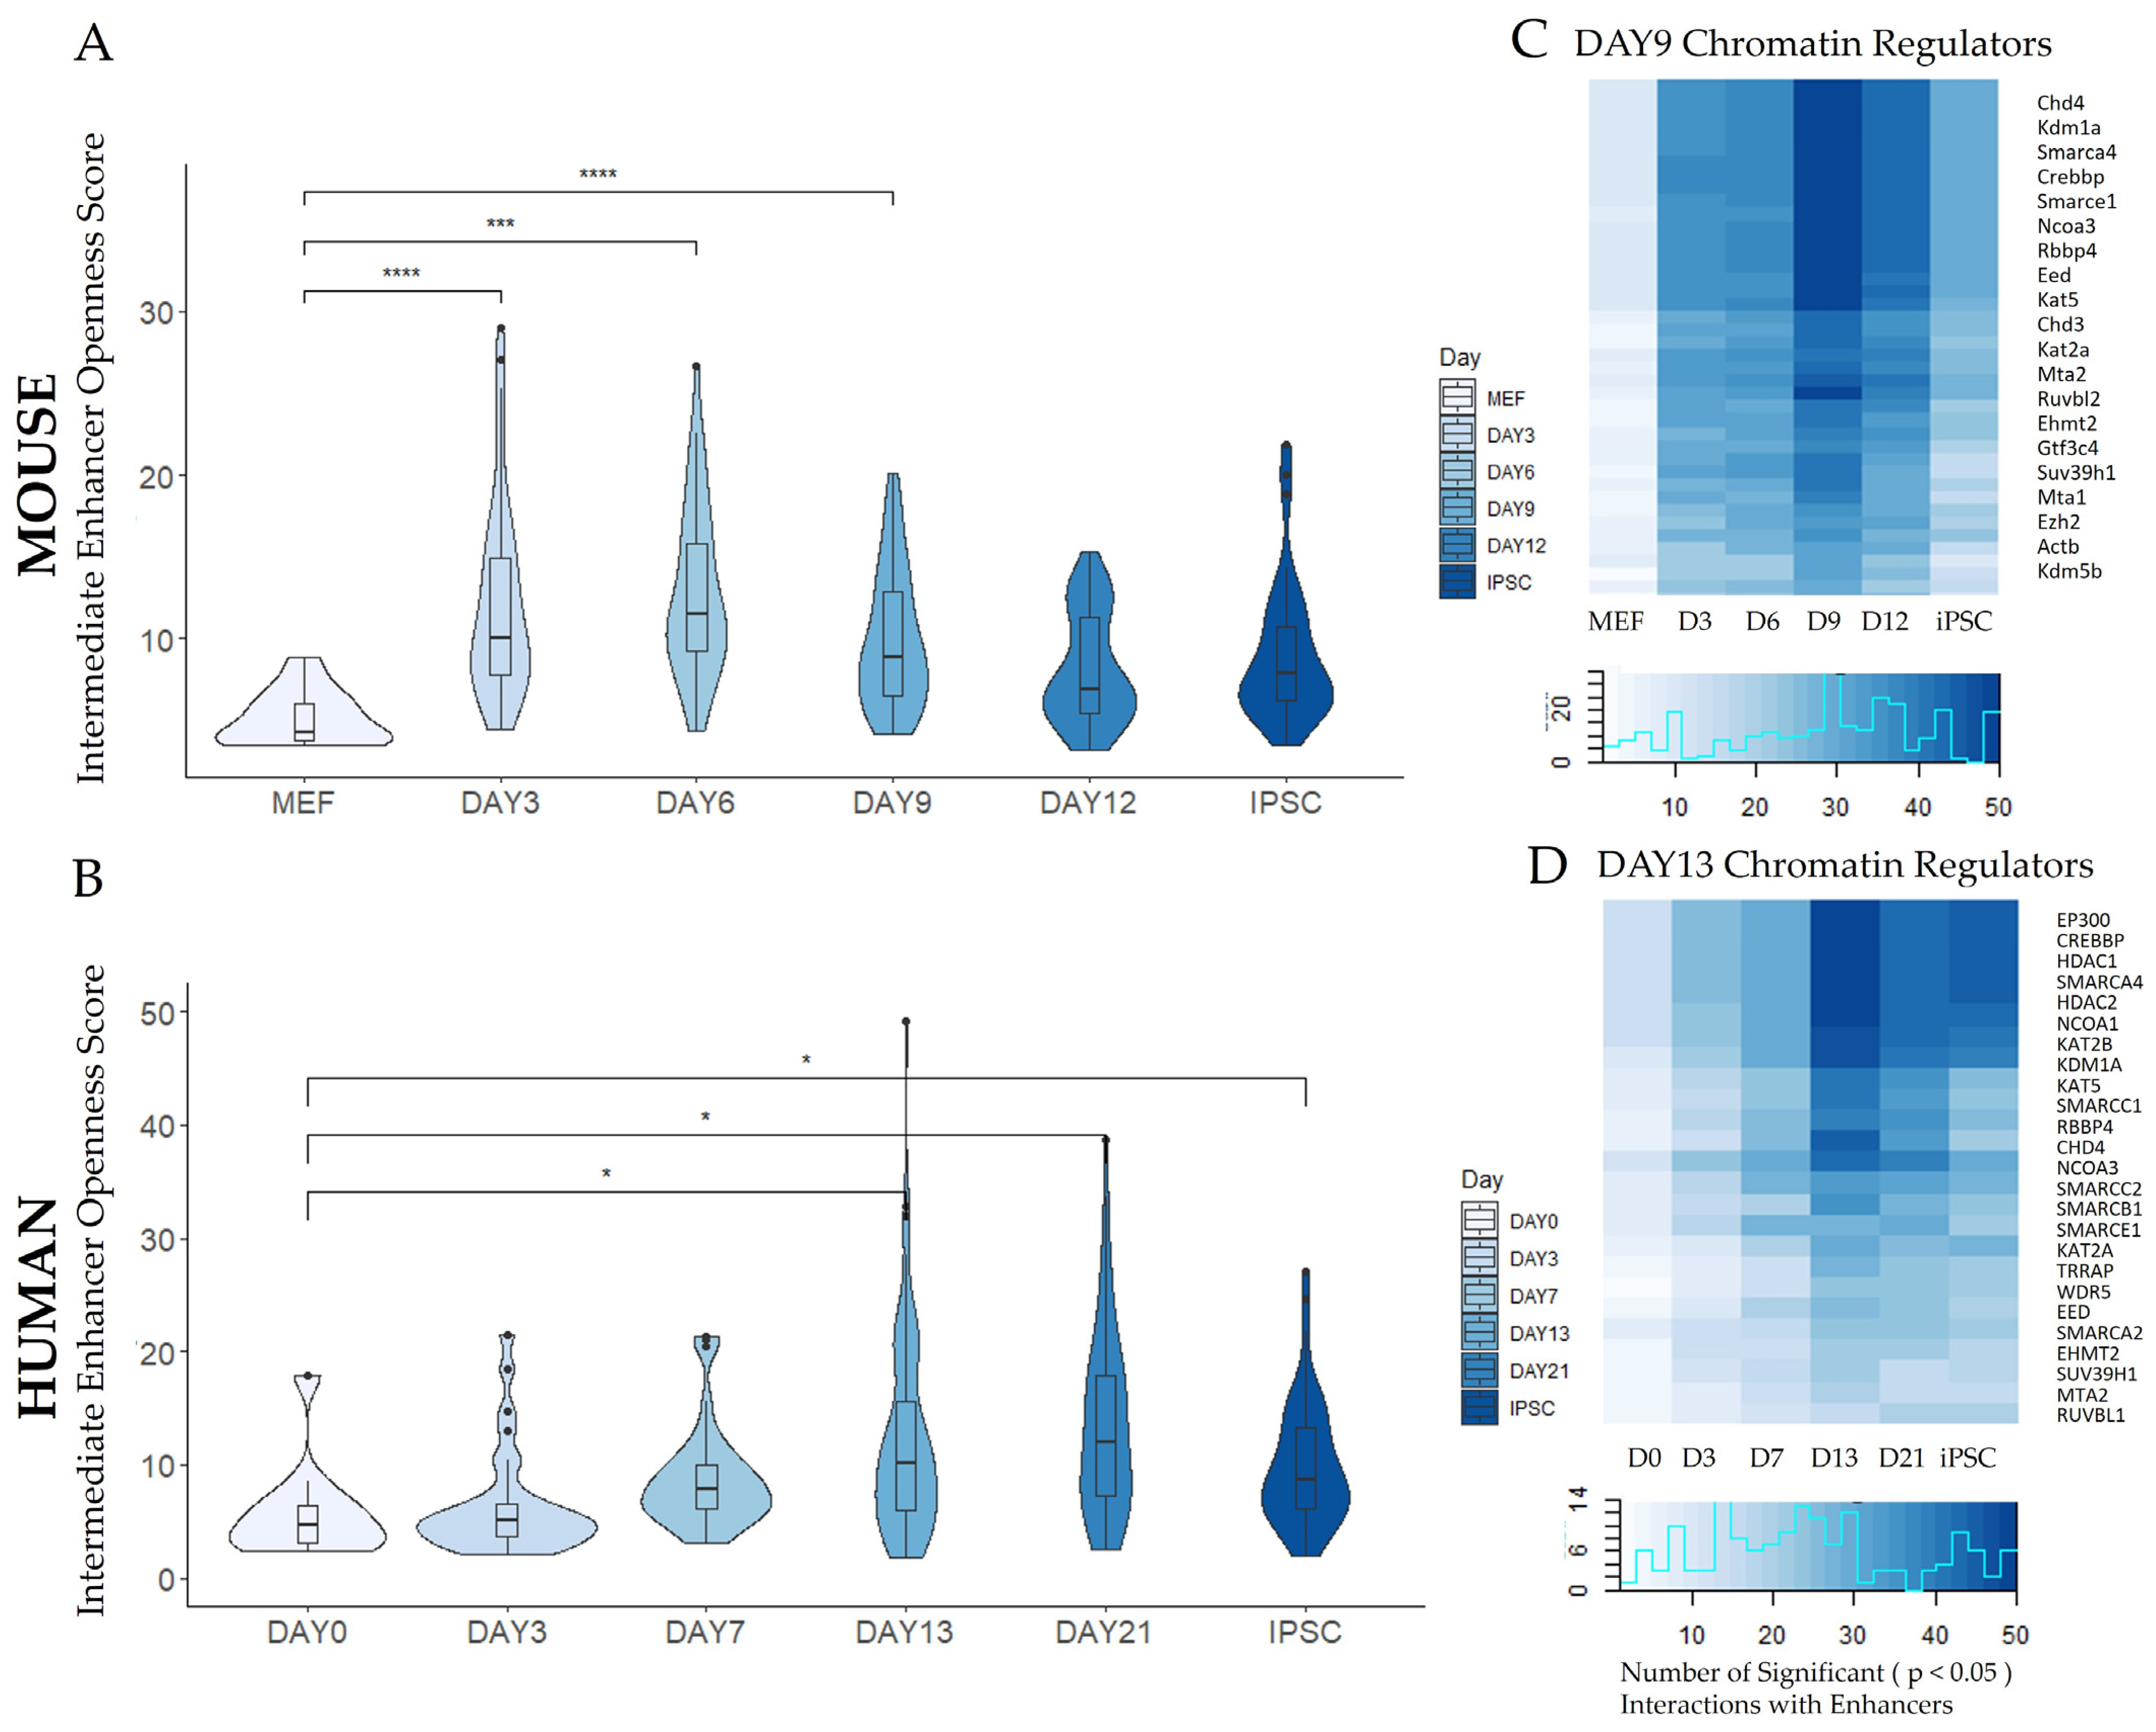
3.2.2. Enhancer Dynamics during Reprogramming

Paired chromatin and expression analysis revealed dynamic, genome-wide changes in enhancer reprogramming networks. The accessibility of enhancers from an intermediate time point in each species was assessed using a sequencing-depth-normalized measure of “openness” defined by PECA2 that is statistically comparable between samples. The openness scores of accessible intermediate timepoint enhancers were plotted over time for each species (Figure 6A,B). For mouse cells, the enhancer regions mediating the 50 most highly ranked TF–TG interactions on day 9 opened quickly after reprogramming-inducing doxycycline treatment was administered at day 3. For human cells, the top 50 enhancer regions mediating the most highly ranked TF–TG interactions on day 13 were most open during the latter half of the reprogramming time course, after the cells were transitioned to naïve reprogramming media.
In addition to pioneer transcription factors with the capacity to remodel chromatin, other epigenetic factors contributing to the openness state of these enhancers were also investigated. Chromatin regulators with the most interactions with the top 50 enhancers from the day 9 mouse and day 13 human samples included Chd4, a subunit of the NuRD complex that is required for the maintenance of stem cell renewal [74] and the histone methyl transferase Ezh2, which is required for a key step in iPSC generation, mesenchymal–epithelial transition [75] (Figure 6C,D). Other members of the CHD remodeling factor family, which are reported to actively open chromatin during factor-induced reprogramming, also exhibited high numbers of enhancer interactions [76]. Additionally, the H3K4me3 effector WDR5 [77], which binds to, activates, and co-occupies many pluripotency genes in coordination with Oct4 [77,78], was identified as a regulator of the selected 50 human enhancers. Chromatin regulators had the most statistically significant interactions with the highly ranked enhancers on the day the enhancers were detected, day 9 for mouse and day 13 for human. However, many of these enhancers remained open and highly ranked throughout the reprogramming process and maintained interactions with chromatin regulators at other timepoints.

3.3. Trans-Regulatory Network Analysis during Reprogramming

3.3.1. Construction of Trans-Regulatory Networks

By integrating the information provided by ATAC-seq and RNA-seq for each day, the regulation scores of transcription factors and their target genes were calculated for all timepoints (Figure 7). Fibroblast networks exhibited the highest regulatory scores between fibroblast-associated transcription factors such as FOSL2 and fibroblast-related target genes. Pluripotent networks exhibited the highest regulatory scores between transcription factors associated with pluripotency, such as POU5F1, an alias for Oct4. Early intermediate networks reflected the transition from fibroblast-associated gene interactions shown in earlier timepoints to pluripotent-associated gene interactions shown in later timepoints. The expression patterns of modules peaked at their respective timepoints, with earlier modules most highly expressed at earlier timepoints, and the reverse for later timepoints. The mean expression patterns of transcription factors in networks also correlated with those of the genes they regulated over time. TRS scores were then used to determine the interactions between transcription factors in networks and create time-resolved regulatory networks.

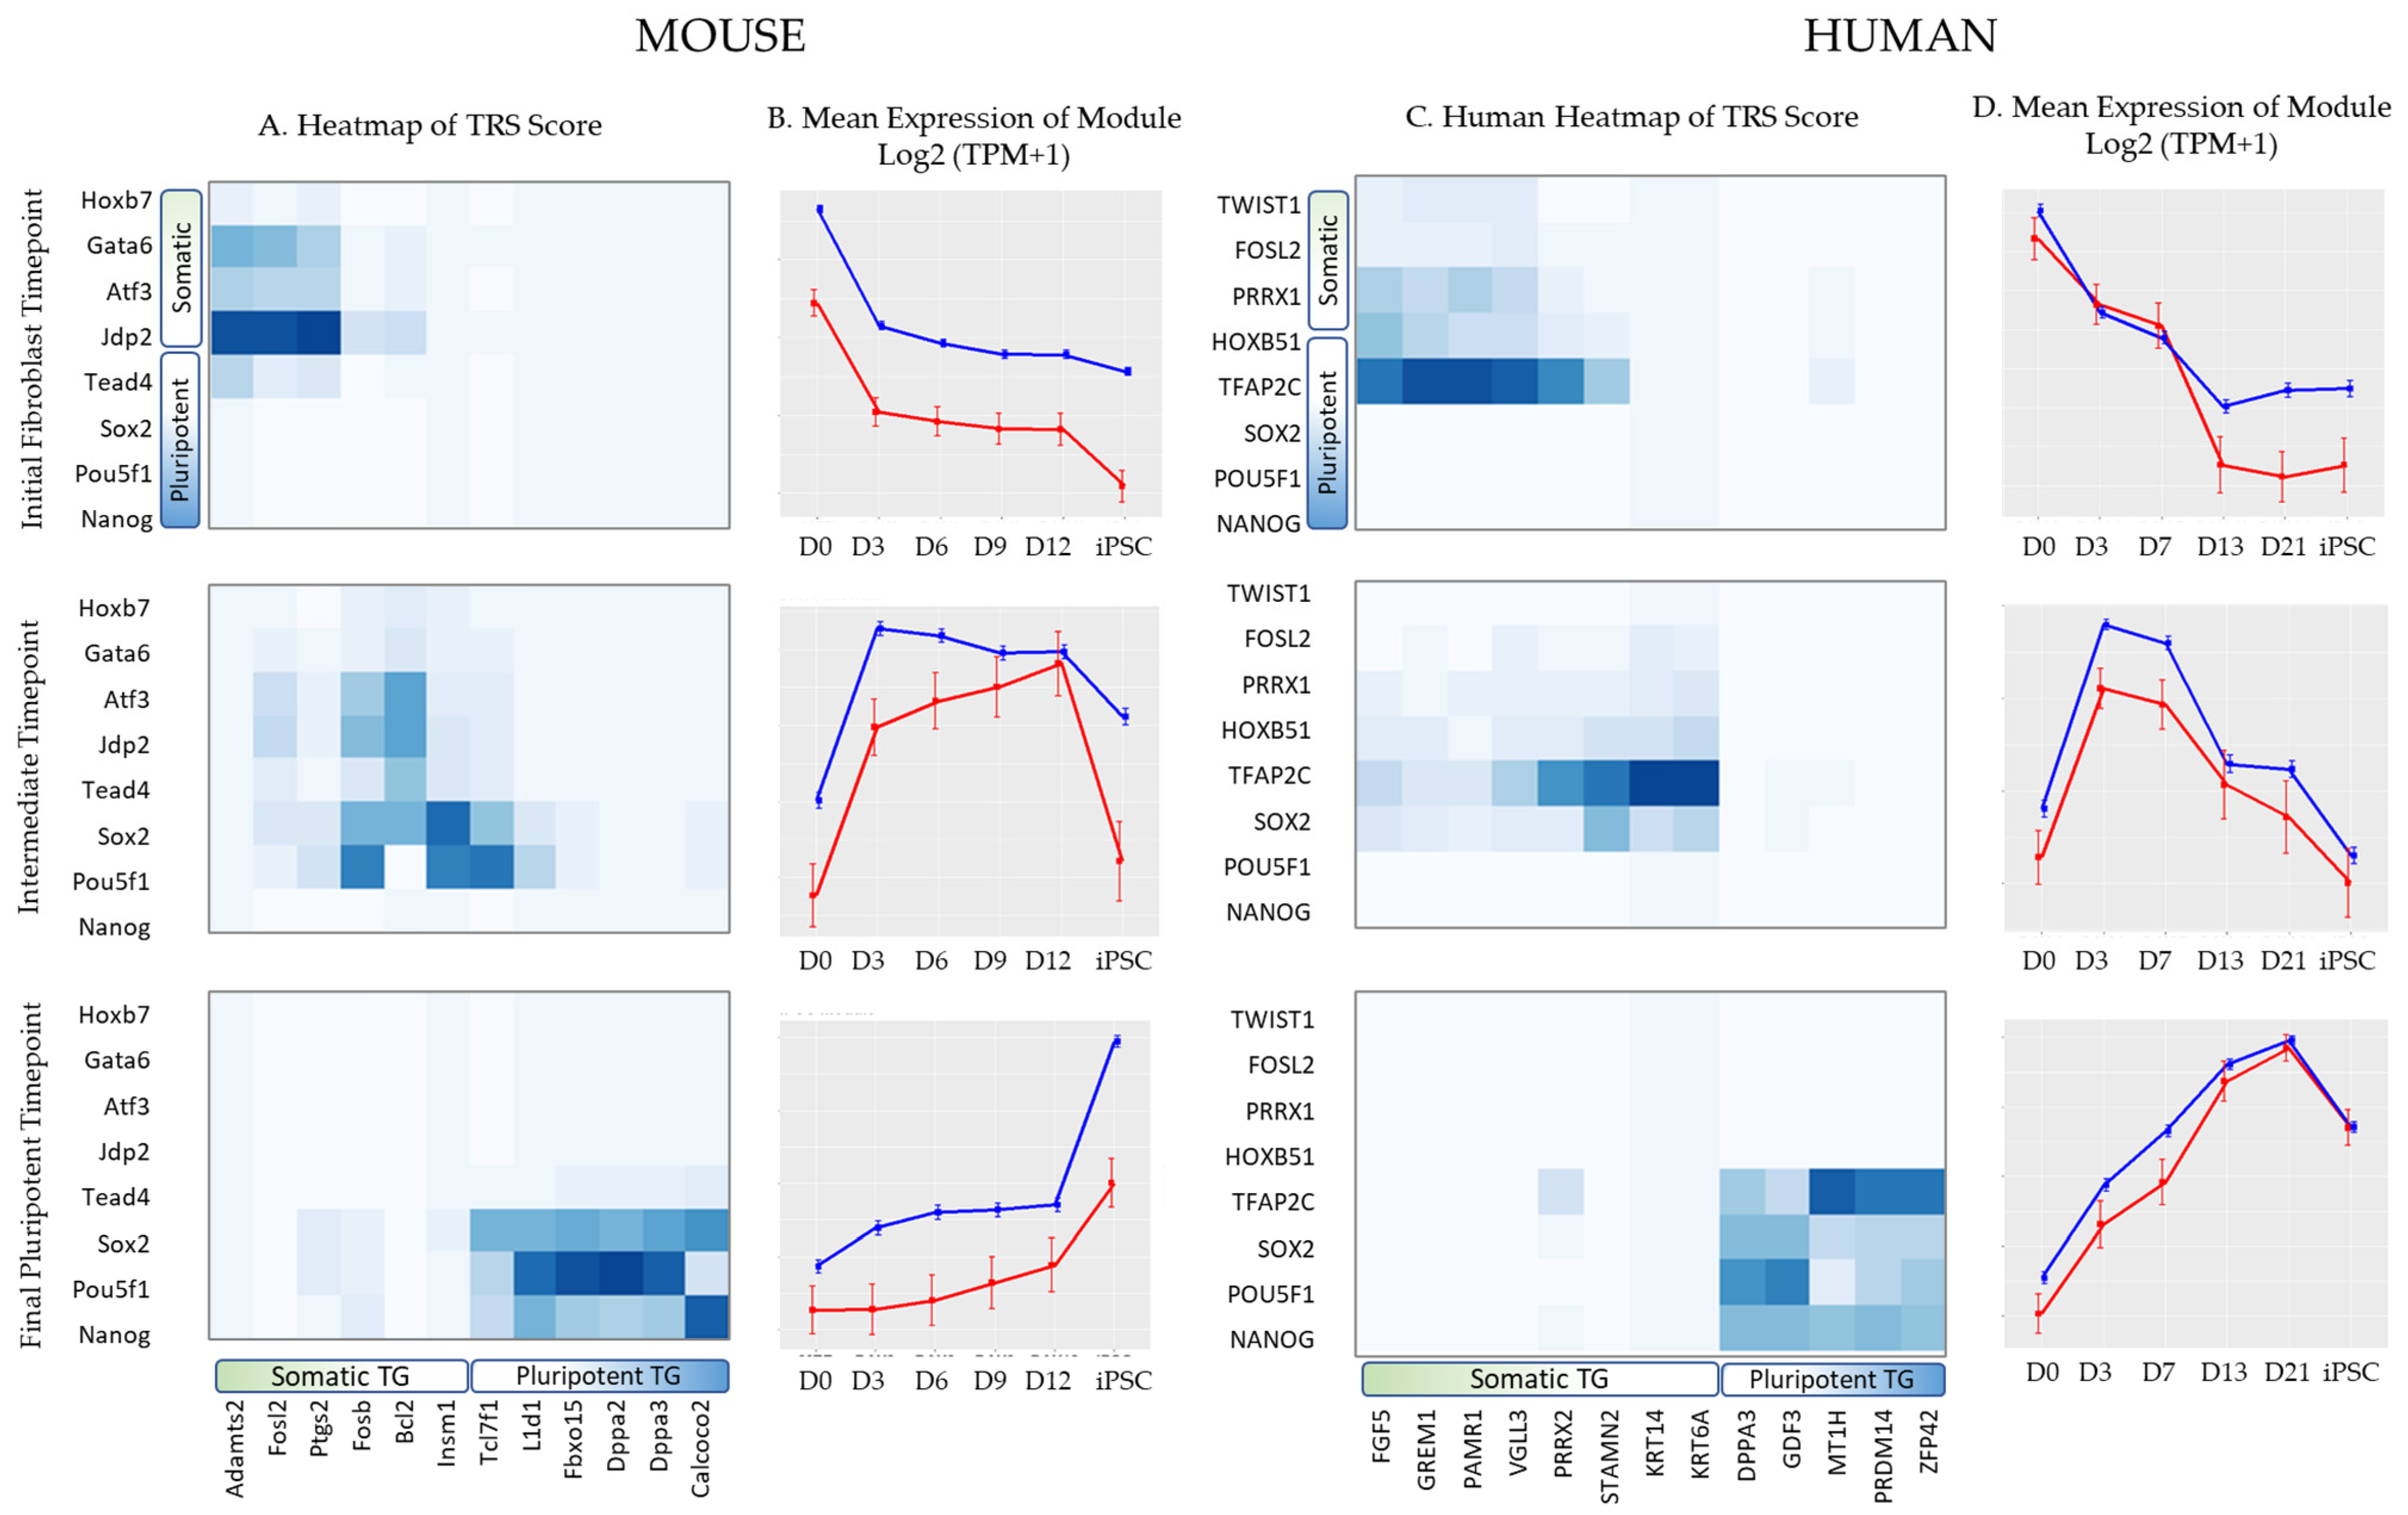
3.3.2. Paired Expression and Chromatin Accessibility Analysis Reveals Dynamic TF–TG Networks

Multi-timepoint networks containing between 244,978 and 328,433 unique TF–TG interactions were identified in mouse, and between 146,134 and 373,283 interactions in human. Network centrality analysis was conducted on full PECA-generated networks containing thousands of transcription factor and target gene interactions in order to better understand the function and regulatory relationships of each gene (Supplemental Tables S1–S4). Reprogramming networks were contrasted with the control fibroblast networks, and common genes were removed from the analysis to identify pathways that were specific to the reprogramming and pluripotent stages. Multiple centralities, including bottleneck (B.N.), closeness, betweenness, and stress, were calculated for each gene to identify central elements of the networks and infer the importance of nodes in each network. Tables containing topological and centrality analysis are provided for each network, ordered by bottleneck centrality.
For both species, the 15 most critical gene–gene interactions as calculated by PECA’s model included hub transcription factors Oct4, Sox2, and Nanog and their most highly scored gene targets (Figure 8). PECA score was inferred from paired transcriptional and epigenetic information, including the fold change and predicted activity of the interaction compared to control cellular contexts. For mouse, other critical hubs with high degree and bottleneck centrality included Pouf31, Sox21, Gsx1, and Zfp42. High-ranking pluripotency-associated target genes included Insm1, L1td1, Unc5d, Fbxo15, Tdh, and Asxl3. Novel target genes in simplified networks for which involvement in reprogramming has not been fully investigated included Fez1, Megf10, and Igfbpl1, which are associated with anti-apoptotic effects in embryonic stem cells (ESCs) [79].
For naïve human cells, the other critical hubs included TFAP2C and SOX21. Target genes associated with pluripotency included PRDM14, which represses Dnmt3a/b methylation and differentiation-inducing Fgfr signaling [80], NODAL which is required for human stem cell self-renewal [81], and the pluripotent markers GDF3 and LIN28A [82]. Other important target genes not previously highlighted in the human reprogramming networks included HHLA1 and KLRG2, a TEAD4 target [14].
The mesenchymal signature genes that were prominent in the fibroblast stage network such as AR, PRRX-encoding genes and FOSL2 were no longer present in reprogramming networks. The interactions of mesenchymal markers SNAI1, SNAI2, and ZEB2 shifted from a large somatic TF network in day 3 (containing FOSB-SP2-MAFG-MAFB), to a limited number of negatively correlated interactions with pluripotency factors NANOG and CTCF on day 7 and were no longer present from day 13 onwards (Supplemental Table S4). The fibroblast marker ANPEP, primarily regulated by fibroblast hubs, showed a negative Pearson’s correlation with SOX2, SOX21, and NANOG from day 7 onward. The extended network in fibroblasts contained cell cycle regulators including cyclin-dependent kinase inhibitors such as CDKN1A and CDKN2B, primarily regulated by somatic transcription factors such as FOSL2. Fibroblast networks also included target genes involved in extracellular matrix organization and collagen catabolic processes—such as MMP1 and PHLDA2, which, when down-regulated, promote epithelial-to-mesenchymal transition (EMT) via the Wnt pathway [83], and numerous collagen components which act as barriers to reprogramming including COL1A1, COL1A1, and COL6A3 [84] (Supplemental Table S4).
In extended networks not limited to the top 15 scores, the epithelial gene E-Cadherin (CDH1), necessary for establishing cell–cell contacts characteristic of the iPSC phenotype [85], formed an increasing number of regulatory interactions with hub regulators, most notably GATA3, NANOG, SOX15, and CTCF, from day 7 onwards, alongside other epithelial genes like EPCAM. Early changes in the network surrounding the down-regulated CDH2 (N-Cadherin), which serves as a switch between focal adhesion and cell–cell adhesion during EMT [86], from somatic to pluripotent factors also indicated a shift from mesenchymal to epithelial adhesion morphology [87]. Other interactions in extended networks included TFAP2C, SOX21, CTCF, and MYCN regulation of EZH2, which is required for reprogramming. Late-pluripotency transcription factors ZIC3 and REST, as well as the pre-implantation, naïve-associated marker TFCP2L1, were regulated by pluripotency master regulators in later timepoints. Tables of extended networks generated are included in Supplemental Table S4.

3.3.3. Trans-Regulatory Networks Involved in Reprogramming Efficiency

Successfully reprogramming cells and refractory cells that fail to yield iPSC colonies were compared in the interest of identifying network differences that may elucidate why reprogramming is often inefficient and unsuccessful for a majority of the cell population. Therefore, differential TF–TG networks contrasting day 6 reprogramming and refractory cells were created (Figure 9). Refractory cells retained TF–TG interactions that were present in fibroblast stages, including Jdp2, Fosl2, Fosb, and Maff interactions with somatic genes such as Serpine1, a p53 target that is associated with senescence [88] and acts a roadblock during the reprogramming process [89]. In addition, refractory cells lacked interactions found in reprogramming cells, including Pou3f1-, Sox21-, and Sox2-mediated interactions targeting key genes such as Insm1 and Unc5d. Refractory cells did, however, have some reprogramming-associated factors present in the network, including Tead4 and Tcf7l1.
Differential networks of primed and naïve cells were also contrasted for the human dataset (Figure 10). Primed cells exhibited certain interactions that were not present in naïve cell networks, including the neuro-ectodermal/ epiblast factor SOX3 which is indicative of priming [90] as well as PTPRZ1 and ZIC2 interactions. Specifically, SOX3 interacted with late pluripotency signature LIN28A, SFRP2, and early reprogramming marker SALL4. POU5F1 and SOX2 interacted with ZIC2 and PTPRZ1, which function in cellular proliferation, adhesion, and migration, as well as epithelial-to-mesenchymal transition, suggesting primed pluripotent cells retain certain mesenchymal features. In contrast, naïve cells had certain TFAP2C, Nanog, and Sox21 interactions in their networks were not present in primed cell networks. This included SOX21 interacting with LIN28B, an early pluripotency signature, KLRG2, ZFP42, and WIPF3, as well as early embryogenesis and primitive endodermal factors GDF3 and NANOG.

3.3.4. Inter-Species Conservation of Trans-Regulatory Networks

In order to determine how many of these TF–TG interactions were conserved between timepoints and between species, the content of networks was compared (Figure 11A). During human reprogramming, regulatory networks became increasingly similar to each other and to the pluripotent endpoint as reprogramming progressed. A similar pattern was observed in the mouse reprogramming experiment, where modules became increasingly similar to the penultimate day 12 timepoint, however, intermediates shared less similarity with the pluripotent timepoint. Mouse refractory cells closely resembled day 0 fibroblast cells and shared some similarity with successfully reprogramming cells at early stages, though this similarity decreased as reprogramming progressed. Human primed cells most closely resembled day 13 naïve cells, however, the similarity between the naïve and primed modules decreased as reprogramming continued. There was some interspecies overlap between mouse and human reprogramming intermediates, however, more overlap was found in the fibroblast and endpoint pluripotent stages.
Gene ontology analysis of the networks confirmed the presence of pluripotency terms at the endpoints and fibroblast terms at the initial timepoints in both species (Figure 11B). Transitioning terms were also identified at intermediate timepoints, including early reprogramming signatures such as Wnt and mesenchymal-to-epithelial transition (MET) signaling. Wnt/B-catenin signaling was enriched in both human and mouse reprogramming networks, which is required for self-renewal [91] and to prevent mouse embryonic stem cell differentiation [92]. Early steps involve an MET via silencing of Snail genes, suppression of TGF-β signaling, and upregulating E-cadherin (CDH1) [87]. In concordance with prior human studies [10], pathways related to mesenchymal to epithelial transition (MET), a critical early event in mouse cell reprogramming [93], were also observed as enriched in human naïve modules at later timepoints, concomitant with the integration of late core regulatory activity of NANOG and LIN28A markers in networks.

4. Discussion

Comparisons between human and mouse reprogramming previously presented numerous difficulties because mouse and human cells reprogram differently, into pre-implantation epiblast-like naïve cells and post-implantation epiblast primed cells, respectively [94]. Because human reprogramming has been less extensively studied than reprogramming in mouse models and time-resolved accessibility data during human reprogramming is comparatively scarce, the translatability of mouse reprogramming model findings for the benefit of human stem cell applications in disease modeling and medicine is a primary concern. With the advent of new methods to create naïve human iPSCs, inter-species comparisons during reprogramming using differential accessibility and epigenetic-inclusive network analysis were feasible in this study.
Differential accessibility analysis indicated both species exhibited similar motif enrichment profiles. While the percentage of accessible regions located in target gene promoters diminished significantly, Oct4, Sox2, Tcf, and Nanog were found to act similarly in mouse and human contexts to reprogram cells from distal enhancers, albeit with different kinetics. These results are supported by previous findings that Oct4 and Sox2 initial binding events occur predominantly in regions distal to gene promoters [95], and highlight the importance of distal regulatory involvement in the reprogramming process in both species. Confirmation of these findings in both species prompted further investigation into distal regulatory activity of enhancers and their associated target genes.
Prior studies in human data have primarily focused on detecting enhancers through histone methylation marks such as H3K4me1, H3K4me2, and H3K27ac [10,11]. However, conducting functional experiments to confirm whether the called region does in fact demonstrate regulatory activity is time-intensive and not easily scalable. By implementing an alternative approach using a paired expression and chromatin accessibility (PECA) conceptual model, we generated a ranked list of experimentally validated enhancers involved in reprogramming, as well as their downstream targets and upstream regulators.
The enhancers identified by PECA2 exhibited similar dynamics, locations, and motifs matching the profile of previously established enhancer mechanics during pluripotency. The sharp loss of fibroblast-associated enhancers interacting with transcription factors Fosb and Jdp2 is consistent with early silencing of the somatic program described in earlier works [96]. Examining the temporal kinetics of enhancer accessibility showed more immediate remodeling in mouse cells versus delayed remodeling in human cells, suggesting that differences in chromatin rewiring may be a rate-limiting factor in reprogramming efficiency. The majority of enhancers involved in the most highly scored regulatory interactions at each timepoint predominately interacted with both Sox2 and Oct4, consistent with the cooperative binding of transcription factors during reprogramming [7] Importantly, enhancers interacting with other transcription factors not as commonly assessed with ChIP-seq, such as the pluripotency hubs TFAP2C, MYCN, and GATA3 (Supplemental Tables S1 and S2) were also identified, sorted by predicted regulatory strength, and linked to associated target genes.
Using the information contained within the identified cis-regulatory interactions, we then proceeded to create transcription factor–target gene reprogramming networks. Multi-timepoint network analysis of human reprogramming has been previously performed mainly using expression analysis [14]. However, the majority of TF–TG interactions (68.26%) detected by paired chromatin and expression analysis were not found to have highly correlated expression, and were not detectable by co-expression analysis alone [29]. While precise correlations between TF–TG interactions and their mediating enhancers are not available from co-expression networks, multiple consistencies were observed between prior expression-based reprogramming networks, and networks identified by this study incorporating accessibility information. For example, cell cycle-associated genes were present in extended early-stage reprogramming networks and primarily regulated by somatic transcription factors, confirming increased proliferation rate as a hallmark of early reprogramming, consistent with prior studies. Mesenchymal-to-epithelial transition (MET) is another early reprogramming hallmark in mouse cells, but, due to differences in kinetics, MET is a more extended process in human reprogramming [10]. Supporting this finding from prior studies [14], we observed MET ontology in top tier TF–TG regulatory interactions later, rather than earlier, in human reprogramming networks, from day 7 onwards. We similarly observed diminished regulatory influence of mesenchymal genes in early human reprogramming networks, whereas the majority of epithelial genes such as EPCAM and the endpoint of MET, E-Cadherin (CDH1), formed hub regulatory interactions at the later stages of human reprogramming [93], corroborating previous findings that reprogramming factors suppress mesenchymal and activate epithelial transcriptional programs [97]. We also observed a hallmark pivot from a FOSL1 to TEAD4 network during reprogramming in human cells, where 16.99% genes in endpoint pluripotent human network were previously identified TEAD4 targets [14], and paralogs FOSL2 and TEAD1/3 were also observed as hub regulators in fibroblast and reprogramming networks. While FOSL1/2 exhibited a high degree of centrality in somatic cells, TEAD4 exhibited less centrality and regulatory interactions in reprogramming networks in comparison to the chromatin regulator CTCF, which mediates long-distance enhancer–promoter interactions of pluripotency-associated genes and coordinates the silencing of the somatic transcriptional program [98].
In conclusion, we propose an integrative model for reprogramming that is robustly supported by other independent findings, wherein the main transcription factors identified through motif enrichment analysis operate through select enhancers located by integrative cis-regulatory analyses, to regulate pluripotency target genes present in trans-regulatory networks. In addition, we submit that the mechanism of reprogramming can be accurately modeled as integrative time-series networks that capture significant events at each timepoint. We present these regulatory networks as a resource to inform future functional studies in dissecting the regulatory mechanisms underlying reprogramming.

Supplementary Materials

The following supporting information can be downloaded at: https://www.mdpi.com/article/10.3390/biomedinformatics3040061/s1, Table S1: Mouse enhancer networks; Table S2: Human enhancer networks; Table S3: Mouse differential networks; Table S4: Human differential networks.

Author Contributions

Conceptualization, C.S.T. and T.M.N.-K.; data curation, methodology, software, formal analysis, validation, visualization, C.S.T.; writing—original draft preparation, C.S.T.; writing—review and editing, C.S.T. and T.M.N.-K.; supervision, T.M.N.-K. All authors have read and agreed to the published version of the manuscript.

Funding

This research was funded by the National Science Foundation through the Graduate Research Fellowship (NSF 19-590), award number 1839285. Financial support for this project was also provided by the University of California Irvine through the Graduate Completion Fellowship.

Institutional Review Board Statement

Not applicable.

Informed Consent Statement

Not applicable.

Data Availability Statement

Publicly available datasets were analyzed in this study. Mouse datasets can be found under GEO accession number GSE101905 at https://www.ncbi.nlm.nih.gov/geo/query/acc.cgi?acc=GSE101905 (accessed on 26 May 2020) and GEO accession number GSE93029 at https://www.ncbi.nlm.nih.gov/geo/query/acc.cgi?acc=GSE93029 (accessed on 26 May 2020). Human datasets can be found under GEO accession number GSE147641 at https://www.ncbi.nlm.nih.gov/geo/query/acc.cgi?acc=GSE147641 (accessed on 12 December 2020) and GEO accession number GSE149694 at https://www.ncbi.nlm.nih.gov/geo/query/acc.cgi?acc=GSE149694 (accessed on 12 December 2020).

Acknowledgments

Portions of this manuscript were submitted as a thesis in partial fulfillment of the requirements for the degree of Doctor of Philosophy (C.S.T.).

Conflicts of Interest

The authors declare no conflict of interest. The funders had no role in the design of the study; in the collection, analyses, or interpretation of data; in the writing of the manuscript; or in the decision to publish the results.

References

  1. Seah, Y.F.S.; EL Farran, C.A.; Warrier, T.; Xu, J.; Loh, Y.-H. Induced Pluripotency and Gene Editing in Disease Modelling: Perspectives and Challenges. Int. J. Mol. Sci. 2015, 16, 28614–28634. [Google Scholar] [CrossRef]
  2. Takahashi, K.; Tanabe, K.; Ohnuki, M.; Narita, M.; Ichisaka, T.; Tomoda, K.; Yamanaka, S. Induction of Pluripotent Stem Cells from Adult Human Fibroblasts by Defined Factors. Cell 2007, 131, 861–872. [Google Scholar] [CrossRef]
  3. Cheow, L.F.; Courtois, E.T.; Tan, Y.; Viswanathan, R.; Xing, Q.; Tan, R.Z.; Tan, D.S.W.; Robson, P.; Loh, Y.-H.; Quake, S.R.; et al. Single-Cell Multimodal Profiling Reveals Cellular Epigenetic Heterogeneity. Nat. Methods 2016, 13, 833–836. [Google Scholar] [CrossRef]
  4. Stadtfeld, M.; Hochedlinger, K. Induced Pluripotency: History, Mechanisms, and Applications. Genes Dev. 2010, 24, 2239–2263. [Google Scholar] [CrossRef]
  5. Polo, J.M.; Anderssen, E.; Walsh, R.M.; Schwarz, B.A.; Nefzger, C.M.; Lim, S.M.; Borkent, M.; Apostolou, E.; Alaei, S.; Cloutier, J.; et al. A Molecular Roadmap of Reprogramming Somatic Cells into IPS Cells. Cell 2012, 151, 1617–1632. [Google Scholar] [CrossRef] [PubMed]
  6. O’Malley, J.; Skylaki, S.; Iwabuchi, K.A.; Chantzoura, E.; Ruetz, T.; Johnsson, A.; Tomlinson, S.R.; Linnarsson, S.; Kaji, K. High-Resolution Analysis with Novel Cell-Surface Markers Identifies Routes to IPS Cells. Nature 2013, 499, 88–91. [Google Scholar] [CrossRef]
  7. Chronis, C.; Fiziev, P.; Papp, B.; Butz, S.; Bonora, G.; Sabri, S.; Ernst, J.; Plath, K. Cooperative Binding of Transcription Factors Orchestrates Reprogramming. Cell 2017, 168, 442–459.e20. [Google Scholar] [CrossRef]
  8. Knaupp, A.S.; Buckberry, S.; Pflueger, J.; Lim, S.M.; Ford, E.; Larcombe, M.R.; Rossello, F.J.; de Mendoza, A.; Alaei, S.; Firas, J.; et al. Transient and Permanent Reconfiguration of Chromatin and Transcription Factor Occupancy Drive Reprogramming. Cell Stem Cell 2017, 21, 834–845.e6. [Google Scholar] [CrossRef]
  9. Schiebinger, G.; Shu, J.; Tabaka, M.; Cleary, B.; Subramanian, V.; Solomon, A.; Gould, J.; Liu, S.; Lin, S.; Berube, P.; et al. Optimal-Transport Analysis of Single-Cell Gene Expression Identifies Developmental Trajectories in Reprogramming. Cell 2019, 176, 1517. [Google Scholar] [CrossRef]
  10. Cacchiarelli, D.; Trapnell, C.; Ziller, M.J.; Soumillon, M.; Cesana, M.; Karnik, R.; Donaghey, J.; Smith, Z.D.; Ratanasirintrawoot, S.; Zhang, X.; et al. Integrative Analyses of Human Reprogramming Reveal Dynamic Nature of Induced Pluripotency. Cell 2015, 162, 412–424. [Google Scholar] [CrossRef]
  11. Wang, Y.; Zhao, C.; Hou, Z.; Yang, Y.; Bi, Y.; Wang, H.; Zhang, Y.; Gao, S. Unique Molecular Events during Reprogramming of Human Somatic Cells to Induced Pluripotent Stem Cells (IPSCs) at Naïve State. eLife 2018, 7, e29518. [Google Scholar] [CrossRef]
  12. Theunissen, T.W.; Friedli, M.; He, Y.; Planet, E.; O’Neil, R.C.; Markoulaki, S.; Pontis, J.; Wang, H.; Iouranova, A.; Imbeault, M.; et al. Molecular Criteria for Defining the Naive Human Pluripotent State. Cell Stem Cell 2016, 19, 502–515. [Google Scholar] [CrossRef]
  13. Stadtfeld, M.; Maherali, N.; Breault, D.T.; Hochedlinger, K. Defining Molecular Cornerstones during Fibroblast to IPS Cell Reprogramming in Mouse. Cell Stem Cell 2008, 2, 230–240. [Google Scholar] [CrossRef]
  14. Xing, Q.R.; El Farran, C.A.; Gautam, P.; Chuah, Y.S.; Warrier, T.; Toh, C.-X.D.; Kang, N.-Y.; Sugii, S.; Chang, Y.-T.; Xu, J.; et al. Diversification of Reprogramming Trajectories Revealed by Parallel Single-Cell Transcriptome and Chromatin Accessibility Sequencing. Sci. Adv. 2020, 6, eaba1190. [Google Scholar] [CrossRef] [PubMed]
  15. Toh, C.-X.D.; Chan, J.-W.; Chong, Z.-S.; Wang, H.F.; Guo, H.C.; Satapathy, S.; Ma, D.; Goh, G.Y.L.; Khattar, E.; Yang, L.; et al. RNAi Reveals Phase-Specific Global Regulators of Human Somatic Cell Reprogramming. Cell Rep. 2016, 15, 2597–2607. [Google Scholar] [CrossRef] [PubMed]
  16. Yang, C.-S.; Chang, K.-Y.; Rana, T.M. Genome-Wide Functional Analysis Reveals Factors Needed at the Transition Steps of Induced Reprogramming. Cell Rep. 2014, 8, 327–337. [Google Scholar] [CrossRef]
  17. Fang, H.-T.; El Farran, C.A.; Xing, Q.R.; Zhang, L.-F.; Li, H.; Lim, B.; Loh, Y.-H. Global H3.3 Dynamic Deposition Defines Its Bimodal Role in Cell Fate Transition. Nat. Commun. 2018, 9, 1537. [Google Scholar] [CrossRef] [PubMed]
  18. Felsenfeld, G.; Boyes, J.; Chung, J.; Clark, D.; Studitsky, V. Chromatin Structure and Gene Expression. Proc. Natl. Acad. Sci. USA 1996, 93, 9384–9388. [Google Scholar] [CrossRef] [PubMed]
  19. Thurman, R.E.; Rynes, E.; Humbert, R.; Vierstra, J.; Maurano, M.T.; Haugen, E.; Sheffield, N.C.; Stergachis, A.B.; Wang, H.; Vernot, B.; et al. The Accessible Chromatin Landscape of the Human Genome. Nature 2012, 489, 75–82. [Google Scholar] [CrossRef]
  20. McVean, G.A.; Altshuler (Co-Chair), D.M.; Durbin (Co-Chair), R.M.; Abecasis, G.R.; Bentley, D.R.; Chakravarti, A.; Clark, A.G.; Donnelly, P.; Eichler, E.E.; Flicek, P.; et al. An Integrated Map of Genetic Variation from 1,092 Human Genomes. Nature 2012, 491, 56–65. [Google Scholar] [CrossRef]
  21. Kundaje, A.; Meuleman, W.; Ernst, J.; Bilenky, M.; Yen, A.; Heravi-Moussavi, A.; Kheradpour, P.; Zhang, Z.; Wang, J.; Ziller, M.J.; et al. Integrative Analysis of 111 Reference Human Epigenomes. Nature 2015, 518, 317–330. [Google Scholar] [CrossRef] [PubMed]
  22. Neph, S.; Vierstra, J.; Stergachis, A.B.; Reynolds, A.P.; Haugen, E.; Vernot, B.; Thurman, R.E.; John, S.; Sandstrom, R.; Johnson, A.K.; et al. An Expansive Human Regulatory Lexicon Encoded in Transcription Factor Footprints. Nature 2012, 489, 83–90. [Google Scholar] [CrossRef] [PubMed]
  23. Gusmao, E.G.; Allhoff, M.; Zenke, M.; Costa, I.G. Analysis of Computational Footprinting Methods for DNase Sequencing Experiments. Nat. Methods 2016, 13, 303–309. [Google Scholar] [CrossRef] [PubMed]
  24. Pique-Regi, R.; Degner, J.F.; Pai, A.A.; Gaffney, D.J.; Gilad, Y.; Pritchard, J.K. Accurate Inference of Transcription Factor Binding from DNA Sequence and Chromatin Accessibility Data. Genome Res. 2011, 21, 447–455. [Google Scholar] [CrossRef] [PubMed]
  25. Greenwald, W.W.Y.; D’Antonio-Chronowska, A.; Benaglio, P.; Matsui, H.; Smith, E.N.; D’Antonio, M.; Frazer, K.A. Chromatin Co-Accessibility Is Highly Structured, Spans Entire Chromosomes, and Mediates Long Range Regulatory Genetic Effects. bioRxiv 2019, 604371. [Google Scholar] [CrossRef]
  26. Aibar, S.; González-Blas, C.B.; Moerman, T.; Huynh-Thu, V.A.; Imrichova, H.; Hulselmans, G.; Rambow, F.; Marine, J.-C.; Geurts, P.; Aerts, J.; et al. SCENIC: Single-Cell Regulatory Network Inference and Clustering. Nat. Methods 2017, 14, 1083–1086. [Google Scholar] [CrossRef] [PubMed]
  27. Ackermann, A.M.; Wang, Z.; Schug, J.; Naji, A.; Kaestner, K.H. Integration of ATAC-Seq and RNA-Seq Identifies Human Alpha Cell and Beta Cell Signature Genes. Mol. Metab. 2016, 5, 233–244. [Google Scholar] [CrossRef]
  28. Yan, F.; Powell, D.R.; Curtis, D.J.; Wong, N.C. From Reads to Insight: A Hitchhiker’s Guide to ATAC-Seq Data Analysis. Genome Biol. 2020, 21, 22. [Google Scholar] [CrossRef]
  29. Duren, Z.; Chen, X.; Jiang, R.; Wang, Y.; Wong, W.H. Modeling Gene Regulation from Paired Expression and Chromatin Accessibility Data. Proc. Natl. Acad. Sci. USA 2017, 114, E4914–E4923. [Google Scholar] [CrossRef] [PubMed]
  30. Gate, R.E.; Cheng, C.S.; Aiden, A.P.; Siba, A.; Tabaka, M.; Lituiev, D.; Machol, I.; Gordon, M.G.; Subramaniam, M.; Shamim, M.; et al. Genetic Determinants of Co-Accessible Chromatin Regions in Activated T Cells across Humans. Nat. Genet. 2018, 50, 1140–1150. [Google Scholar] [CrossRef] [PubMed]
  31. Kumasaka, N.; Knights, A.J.; Gaffney, D.J. High-Resolution Genetic Mapping of Putative Causal Interactions between Regions of Open Chromatin. Nat. Genet. 2019, 51, 128–137. [Google Scholar] [CrossRef]
  32. Liu, X.; Ouyang, J.F.; Rossello, F.J.; Tan, J.P.; Davidson, K.C.; Valdes, D.S.; Schröder, J.; Sun, Y.B.Y.; Chen, J.; Knaupp, A.S.; et al. Reprogramming Roadmap Reveals Route to Human Induced Trophoblast Stem Cells. Nature 2020, 586, 101–107. [Google Scholar] [CrossRef] [PubMed]
  33. Li, D.; Liu, J.; Yang, X.; Zhou, C.; Guo, J.; Wu, C.; Qin, Y.; Guo, L.; He, J.; Yu, S.; et al. Chromatin Accessibility Dynamics during IPSC Reprogramming. Cell Stem Cell 2017, 21, 819–833.e6. [Google Scholar] [CrossRef]
  34. Kim, D.; Paggi, J.M.; Park, C.; Bennett, C.; Salzberg, S.L. Graph-Based Genome Alignment and Genotyping with HISAT2 and HISAT-Genotype. Nat. Biotechnol. 2019, 37, 907–915. [Google Scholar] [CrossRef]
  35. Lawrence, M.; Huber, W.; Pagès, H.; Aboyoun, P.; Carlson, M.; Gentleman, R.; Morgan, M.T.; Carey, V.J. Software for Computing and Annotating Genomic Ranges. PLoS Comput. Biol. 2013, 9, e1003118. [Google Scholar] [CrossRef]
  36. Li, B.; Dewey, C.N. RSEM: Accurate Transcript Quantification from RNA-Seq Data with or without a Reference Genome. BMC Bioinform. 2011, 12, 323. [Google Scholar] [CrossRef] [PubMed]
  37. Dobin, A.; Davis, C.A.; Schlesinger, F.; Drenkow, J.; Zaleski, C.; Jha, S.; Batut, P.; Chaisson, M.; Gingeras, T.R. STAR: Ultrafast Universal RNA-Seq Aligner. Bioinform. Oxf. Engl. 2013, 29, 15–21. [Google Scholar] [CrossRef]
  38. Liao, Y.; Smyth, G.K.; Shi, W. FeatureCounts: An Efficient General Purpose Program for Assigning Sequence Reads to Genomic Features. Bioinform. Oxf. Engl. 2014, 30, 923–930. [Google Scholar] [CrossRef] [PubMed]
  39. Duren, Z.; Chen, X.; Xin, J.; Wang, Y.; Wong, W.H. Time Course Regulatory Analysis Based on Paired Expression and Chromatin Accessibility Data. Genome Res. 2020, 30, 622–634. [Google Scholar] [CrossRef]
  40. Durinck, S.; Moreau, Y.; Kasprzyk, A.; Davis, S.; De Moor, B.; Brazma, A.; Huber, W. BioMart and Bioconductor: A Powerful Link between Biological Databases and Microarray Data Analysis. Bioinform. Oxf. Engl. 2005, 21, 3439–3440. [Google Scholar] [CrossRef]
  41. Durinck, S.; Spellman, P.T.; Birney, E.; Huber, W. Mapping Identifiers for the Integration of Genomic Datasets with the R/Bioconductor Package BiomaRt. Nat. Protoc. 2009, 4, 1184–1191. [Google Scholar] [CrossRef]
  42. Carlson, M. org.Hs.eg.db: Genome wide annotation for Human. Bioconductor. Available online: http://bioconductor.org/packages/org.Hs.eg.db/ (accessed on 16 August 2023).
  43. Soneson, C.; Love, M.I.; Robinson, M.D. Differential Analyses for RNA-Seq: Transcript-Level Estimates Improve Gene-Level Inferences. F1000Research 2015, 4, 1521. [Google Scholar] [CrossRef]
  44. Robinson, M.D.; McCarthy, D.J.; Smyth, G.K. EdgeR: A Bioconductor Package for Differential Expression Analysis of Digital Gene Expression Data. Bioinformatics 2010, 26, 139–140. [Google Scholar] [CrossRef]
  45. Zmrzlikar, J.; Žganec, M.; Ausec, L.; Štajdohar, M. RNAnorm: RNA-seq data normalization in Python. GitHub. Available online: https://github.com/genialis/RNAnorm/blob/main/CITATION.cff (accessed on 16 August 2023).
  46. SRA Toolkit Develoment Team; SBGrid Consortium. SRA Toolkit. GitHub. Available online: https://trace.ncbi.nlm.nih.gov/Traces/sra/sra.cgi?view=software (accessed on 16 August 2023).
  47. Langmead, B.; Salzberg, S.L. Fast Gapped-Read Alignment with Bowtie 2. Nat. Methods 2012, 9, 357–359. [Google Scholar] [CrossRef]
  48. Li, H.; Handsaker, B.; Wysoker, A.; Fennell, T.; Ruan, J.; Homer, N.; Marth, G.; Abecasis, G.; Durbin, R.; 1000 Genome Project Data Processing Subgroup. The Sequence Alignment/Map Format and SAMtools. Bioinform. Oxf. Engl. 2009, 25, 2078–2079. [Google Scholar] [CrossRef]
  49. Amemiya, H.M.; Kundaje, A.; Boyle, A.P. The ENCODE Blacklist: Identification of Problematic Regions of the Genome. Sci. Rep. 2019, 9, 9354. [Google Scholar] [CrossRef] [PubMed]
  50. Quinlan, A.R.; Hall, I.M. BEDTools: A Flexible Suite of Utilities for Comparing Genomic Features. Bioinform. Oxf. Engl. 2010, 26, 841–842. [Google Scholar] [CrossRef] [PubMed]
  51. Tarasov, A.; Vilella, A.J.; Cuppen, E.; Nijman, I.J.; Prins, P. Sambamba: Fast Processing of NGS Alignment Formats. Bioinform. Oxf. Engl. 2015, 31, 2032–2034. [Google Scholar] [CrossRef]
  52. Zhang, Y.; Liu, T.; Meyer, C.A.; Eeckhoute, J.; Johnson, D.S.; Bernstein, B.E.; Nusbaum, C.; Myers, R.M.; Brown, M.; Li, W.; et al. Model-Based Analysis of ChIP-Seq (MACS). Genome Biol. 2008, 9, R137. [Google Scholar] [CrossRef]
  53. Kumar, V.; Muratani, M.; Rayan, N.A.; Kraus, P.; Lufkin, T.; Ng, H.H.; Prabhakar, S. Uniform, Optimal Signal Processing of Mapped Deep-Sequencing Data. Nat. Biotechnol. 2013, 31, 615–622. [Google Scholar] [CrossRef]
  54. Heinz, S.; Benner, C.; Spann, N.; Bertolino, E.; Lin, Y.C.; Laslo, P.; Cheng, J.X.; Murre, C.; Singh, H.; Glass, C.K. Simple Combinations of Lineage-Determining Transcription Factors Prime Cis-Regulatory Elements Required for Macrophage and B Cell Identities. Mol. Cell 2010, 38, 576–589. [Google Scholar] [CrossRef]
  55. Yu, G.; Wang, L.-G.; He, Q.-Y. ChIPseeker: An R/Bioconductor Package for ChIP Peak Annotation, Comparison and Visualization. Bioinform. Oxf. Engl. 2015, 31, 2382–2383. [Google Scholar] [CrossRef]
  56. Wang, Q.; Li, M.; Wu, T.; Zhan, L.; Li, L.; Chen, M.; Xie, W.; Xie, Z.; Hu, E.; Xu, S.; et al. Exploring Epigenomic Datasets by ChIPseeker. Curr. Protoc. 2022, 2, e585. [Google Scholar] [CrossRef] [PubMed]
  57. Warnes, G.R.; Bolker, B.; Bonebakker, L.; Gentleman, R.; Huber, W.; Liaw, A.; Lumley, T.; Maechler, M.; Magnusson, A.; Moeller, S. Gplots: Various R Programming Tools for Plotting Data. R Package Version 2009, 2, 1. [Google Scholar]
  58. Kassambara, A. ggpubr: “ggplot2” Based Publication Ready Plots. Available online: https://rpkgs.datanovia.com/ggpubr/authors.html#citation (accessed on 16 August 2023).
  59. Shannon, P.; Markiel, A.; Ozier, O.; Baliga, N.S.; Wang, J.T.; Ramage, D.; Amin, N.; Schwikowski, B.; Ideker, T. Cytoscape: A Software Environment for Integrated Models of Biomolecular Interaction Networks. Genome Res. 2003, 13, 2498–2504. [Google Scholar] [CrossRef] [PubMed]
  60. Chin, C.-H.; Chen, S.-H.; Wu, H.-H.; Ho, C.-W.; Ko, M.-T.; Lin, C.-Y. CytoHubba: Identifying Hub Objects and Sub-Networks from Complex Interactome. BMC Syst. Biol. 2014, 8 (Suppl. S4), S11. [Google Scholar] [CrossRef] [PubMed]
  61. Jeong, H.; Mason, S.P.; Barabási, A.-L.; Oltvai, Z.N. Lethality and Centrality in Protein Networks. Nature 2001, 411, 41–42. [Google Scholar] [CrossRef] [PubMed]
  62. Pržulj, N.; Wigle, D.A.; Jurisica, I. Functional Topology in a Network of Protein Interactions. Bioinformatics 2004, 20, 340–348. [Google Scholar] [CrossRef] [PubMed]
  63. Freeman, L.C. A Set of Measures of Centrality Based on Betweenness. Sociometry 1977, 40, 35–41. [Google Scholar] [CrossRef]
  64. Sabidussi, G. The Centrality Index of a Graph. Psychometrika 1966, 31, 581–603. [Google Scholar] [CrossRef]
  65. Chin, C.-S.; Samanta, M.P. Global Snapshot of a Protein Interaction Network—a Percolation Based Approach. Bioinformatics 2003, 19, 2413–2419. [Google Scholar] [CrossRef]
  66. Shimbel, A. Structural Parameters of Communication Networks. Bull. Math. Biophys. 1953, 15, 501–507. [Google Scholar] [CrossRef]
  67. Wickham, H.; Sievert, C. Ggplot2: Elegant Graphics for Data Analysis, 1st ed.; Vols. 1–1; Springer: New York, NY, USA, 2016; Volume 1. [Google Scholar]
  68. Krämer, A.; Green, J.; Pollard, J., Jr.; Tugendreich, S. Causal Analysis Approaches in Ingenuity Pathway Analysis. Bioinformatics 2014, 30, 523–530. [Google Scholar] [CrossRef] [PubMed]
  69. Cole, M.F.; Johnstone, S.E.; Newman, J.J.; Kagey, M.H.; Young, R.A. Tcf3 Is an Integral Component of the Core Regulatory Circuitry of Embryonic Stem Cells. Genes Dev. 2008, 22, 746–755. [Google Scholar] [CrossRef] [PubMed]
  70. Martello, G.; Sugimoto, T.; Diamanti, E.; Joshi, A.; Hannah, R.; Ohtsuka, S.; Göttgens, B.; Niwa, H.; Smith, A. Esrrb Is a Pivotal Target of the Gsk3/Tcf3 Axis Regulating Embryonic Stem Cell Self-Renewal. Cell Stem Cell 2012, 11, 491–504. [Google Scholar] [CrossRef]
  71. Tam, W.-L.; Lim, C.Y.; Han, J.; Zhang, J.; Ang, Y.-S.; Ng, H.-H.; Yang, H.; Lim, B. T-Cell Factor 3 Regulates Embryonic Stem Cell Pluripotency and Self-Renewal by the Transcriptional Control of Multiple Lineage Pathways. Stem Cells 2008, 26, 2019–2031. [Google Scholar] [CrossRef]
  72. Yi, F.; Pereira, L.; Merrill, B.J. Tcf3 Functions as a Steady-State Limiter of Transcriptional Programs of Mouse Embryonic Stem Cell Self-Renewal. Stem Cells 2008, 26, 1951–1960. [Google Scholar] [CrossRef] [PubMed]
  73. Ho, R.; Papp, B.; Hoffman, J.A.; Merrill, B.J.; Plath, K. Stage-Specific Regulation of Reprogramming to Induced Pluripotent Stem Cells by Wnt Signaling and T Cell Factor Proteins. Cell Rep. 2013, 3, 2113–2126. [Google Scholar] [CrossRef]
  74. Zhao, H.; Han, Z.; Liu, X.; Gu, J.; Tang, F.; Wei, G.; Jin, Y. The Chromatin Remodeler Chd4 Maintains Embryonic Stem Cell Identity by Controlling Pluripotency- and Differentiation-Associated Genes. J. Biol. Chem. 2017, 292, 8507–8519. [Google Scholar] [CrossRef] [PubMed]
  75. Rao, R.A.; Dhele, N.; Cheemadan, S.; Ketkar, A.; Jayandharan, G.R.; Palakodeti, D.; Rampalli, S. Ezh2 Mediated H3K27me3 Activity Facilitates Somatic Transition during Human Pluripotent Reprogramming. Sci. Rep. 2015, 5, 8229. [Google Scholar] [CrossRef] [PubMed]
  76. Gaspar-Maia, A.; Alajem, A.; Polesso, F.; Sridharan, R.; Mason, M.J.; Heidersbach, A.; Ramalho-Santos, J.; McManus, M.T.; Plath, K.; Meshorer, E.; et al. Chd1 Regulates Open Chromatin and Pluripotency of Embryonic Stem Cells. Nature 2009, 460, 863–868. [Google Scholar] [CrossRef] [PubMed]
  77. Ang, Y.-S.; Tsai, S.-Y.; Lee, D.-F.; Monk, J.; Su, J.; Ratnakumar, K.; Ding, J.; Ge, Y.; Darr, H.; Chang, B.; et al. Wdr5 Mediates Self-Renewal and Reprogramming via the Embryonic Stem Cell Core Transcriptional Network. Cell 2011, 145, 183–197. [Google Scholar] [CrossRef] [PubMed]
  78. Mansour, A.A.; Gafni, O.; Weinberger, L.; Zviran, A.; Ayyash, M.; Rais, Y.; Krupalnik, V.; Zerbib, M.; Amann-Zalcenstein, D.; Maza, I.; et al. The H3K27 Demethylase Utx Regulates Somatic and Germ Cell Epigenetic Reprogramming. Nature 2012, 488, 409–413. [Google Scholar] [CrossRef] [PubMed]
  79. Lin, T.-C.; Yen, J.-M.; Gong, K.-B.; Hsu, T.-T.; Chen, L.-R. IGF-1/IGFBP-1 Increases Blastocyst Formation and Total Blastocyst Cell Number in Mouse Embryo Culture and Facilitates the Establishment of a Stem-Cell Line. BMC Cell Biol. 2003, 4, 14. [Google Scholar] [CrossRef] [PubMed]
  80. Leitch, H.G.; McEwen, K.R.; Turp, A.; Encheva, V.; Carroll, T.; Grabole, N.; Mansfield, W.; Nashun, B.; Knezovich, J.G.; Smith, A.; et al. Naive Pluripotency Is Associated with Global DNA Hypomethylation. Nat. Struct. Mol. Biol. 2013, 20, 311–316. [Google Scholar] [CrossRef]
  81. Eiselleova, L.; Matulka, K.; Kriz, V.; Kunova, M.; Schmidtova, Z.; Neradil, J.; Tichy, B.; Dvorakova, D.; Pospisilova, S.; Hampl, A.; et al. A Complex Role for FGF-2 in Self-Renewal, Survival, and Adhesion of Human Embryonic Stem Cells. Stem Cells Dayt. Ohio 2009, 27, 1847–1857. [Google Scholar] [CrossRef]
  82. Chan, E.M.; Ratanasirintrawoot, S.; Park, I.-H.; Manos, P.D.; Loh, Y.-H.; Huo, H.; Miller, J.D.; Hartung, O.; Rho, J.; Ince, T.A.; et al. Live Cell Imaging Distinguishes Bona Fide Human IPS Cells from Partially Reprogrammed Cells. Nat. Biotechnol. 2009, 27, 1033–1037. [Google Scholar] [CrossRef]
  83. Lv, Y.; Dai, H.; Yan, G.; Meng, G.; Zhang, X.; Guo, Q. Downregulation of Tumor Suppressing STF CDNA 3 Promotes Epithelial-Mesenchymal Transition and Tumor Metastasis of Osteosarcoma by the Wnt/GSK-3β/β-Catenin/Snail Signaling Pathway. Cancer Lett. 2016, 373, 164–173. [Google Scholar] [CrossRef]
  84. Jiao, J.; Dang, Y.; Yang, Y.; Gao, R.; Zhang, Y.; Kou, Z.; Sun, X.-F.; Gao, S. Promoting Reprogramming by FGF2 Reveals That the Extracellular Matrix Is a Barrier for Reprogramming Fibroblasts to Pluripotency. Stem Cells 2013, 31, 729–740. [Google Scholar] [CrossRef]
  85. Chen, T.; Yuan, D.; Wei, B.; Jiang, J.; Kang, J.; Ling, K.; Gu, Y.; Li, J.; Xiao, L.; Pei, G. E-Cadherin-Mediated Cell–Cell Contact Is Critical for Induced Pluripotent Stem Cell Generation. Stem Cells 2010, 28, 1315–1325. [Google Scholar] [CrossRef]
  86. Lehembre, F.; Yilmaz, M.; Wicki, A.; Schomber, T.; Strittmatter, K.; Ziegler, D.; Kren, A.; Went, P.; Derksen, P.W.B.; Berns, A.; et al. NCAM-Induced Focal Adhesion Assembly: A Functional Switch upon Loss of E-Cadherin. EMBO J. 2008, 27, 2603–2615. [Google Scholar] [CrossRef]
  87. Mah, N.; Wang, Y.; Liao, M.-C.; Prigione, A.; Jozefczuk, J.; Lichtner, B.; Wolfrum, K.; Haltmeier, M.; Flöttmann, M.; Schaefer, M.; et al. Molecular Insights into Reprogramming-Initiation Events Mediated by the OSKM Gene Regulatory Network. PLoS ONE 2011, 6, e24351. [Google Scholar] [CrossRef] [PubMed]
  88. Utikal, J.; Polo, J.M.; Stadtfeld, M.; Maherali, N.; Kulalert, W.; Walsh, R.M.; Khalil, A.; Rheinwald, J.G.; Hochedlinger, K. Immortalization Eliminates a Roadblock during Cellular Reprogramming into IPS Cells. Nature 2009, 460, 1145–1148. [Google Scholar] [CrossRef] [PubMed]
  89. Kortlever, R.M.; Higgins, P.J.; Bernards, R. Plasminogen Activator Inhibitor-1 Is a Critical Downstream Target of P53 in the Induction of Replicative Senescence. Nat. Cell Biol. 2006, 8, 877–884. [Google Scholar] [CrossRef]
  90. Tesar, P.J.; Chenoweth, J.G.; Brook, F.A.; Davies, T.J.; Evans, E.P.; Mack, D.L.; Gardner, R.L.; McKay, R.D.G. New Cell Lines from Mouse Epiblast Share Defining Features with Human Embryonic Stem Cells. Nature 2007, 448, 196–199. [Google Scholar] [CrossRef] [PubMed]
  91. Ying, Q.-L.; Wray, J.; Nichols, J.; Batlle-Morera, L.; Doble, B.; Woodgett, J.; Cohen, P.; Smith, A. The Ground State of Embryonic Stem Cell Self-Renewal. Nature 2008, 453, 519–523. [Google Scholar] [CrossRef]
  92. ten Berge, D.; Kurek, D.; Blauwkamp, T.; Koole, W.; Maas, A.; Eroglu, E.; Siu, R.K.; Nusse, R. Embryonic Stem Cells Require Wnt Proteins to Prevent Differentiation to Epiblast Stem Cells. Nat. Cell Biol. 2011, 13, 1070–1075. [Google Scholar] [CrossRef] [PubMed]
  93. Samavarchi-Tehrani, P.; Golipour, A.; David, L.; Sung, H.-K.; Beyer, T.A.; Datti, A.; Woltjen, K.; Nagy, A.; Wrana, J.L. Functional Genomics Reveals a BMP-Driven Mesenchymal-to-Epithelial Transition in the Initiation of Somatic Cell Reprogramming. Cell Stem Cell 2010, 7, 64–77. [Google Scholar] [CrossRef] [PubMed]
  94. Hanna, J.H.; Saha, K.; Jaenisch, R. Pluripotency and Cellular Reprogramming: Facts, Hypotheses, Unresolved Issues. Cell 2010, 143, 508–525. [Google Scholar] [CrossRef] [PubMed]
  95. Soufi, A.; Donahue, G.; Zaret, K.S. Facilitators and Impediments of the Pluripotency Reprogramming Factors’ Initial Engagement with the Genome. Cell 2012, 151, 994–1004. [Google Scholar] [CrossRef]
  96. Koche, R.P.; Smith, Z.D.; Adli, M.; Gu, H.; Ku, M.; Gnirke, A.; Bernstein, B.E.; Meissner, A. Reprogramming Factor Expression Initiates Widespread Targeted Chromatin Remodeling. Cell Stem Cell 2011, 8, 96–105. [Google Scholar] [CrossRef] [PubMed]
  97. Li, R.; Liang, J.; Ni, S.; Zhou, T.; Qing, X.; Li, H.; He, W.; Chen, J.; Li, F.; Zhuang, Q.; et al. A Mesenchymal-to-Epithelial Transition Initiates and Is Required for the Nuclear Reprogramming of Mouse Fibroblasts. Cell Stem Cell 2010, 7, 51–63. [Google Scholar] [CrossRef] [PubMed]
  98. Song, Y.; Liang, Z.; Zhang, J.; Hu, G.; Wang, J.; Li, Y.; Guo, R.; Dong, X.; Babarinde, I.A.; Ping, W.; et al. CTCF Functions as an Insulator for Somatic Genes and a Chromatin Remodeler for Pluripotency Genes during Reprogramming. Cell Rep. 2022, 39, 110626. [Google Scholar] [CrossRef] [PubMed]
Figure 1. Methods diagram of multi-omic data integration procedure. RNA and ATAC sequencing data were obtained from publicly available Gene Expression Omnibus (GEO) repositories. The data were processed into the binary alignment and map (BAM) file and gene-level transcripts per million (TPM) format for integration with paired expression and chromatin accessibility analysis. Integrative regulatory networks were generated and visualized with Cytoscape software version 3.9.1.
Biomedinformatics 03 00061 g001
Figure 2. Peak locations show diverse changes in chromatin accessibility across species and datasets. The Chipseeker1 R package was used to generate plots of locations of consensus peaks and their genomic features. Mouse diagrams show the intersected ATAC peaks from two murine datasets (GSE101905 and GSE93029). Human diagrams show the intersected ATAC peaks from two different human donors (GSE147641). (A,B) The distribution of peaks within the genome in terms of promoters, introns, exons, and other regions at the different timepoints by species. (C,D) The distribution of peak locations with respect to the transcription start site (TSS) at the different timepoints by species.
Biomedinformatics 03 00061 g002
Figure 3. Motif instances centered on accessible peaks. Oct4−Sox2−Tcf−Nanog (OSTN) motif proximity to regulatory regions/putative enhancers located in accessible chromatin sites increases in both mouse (A) and human (B) reprogramming cells at the later timepoints. The number of instances of the OSTN motif per base pair per peak is indicated on the y-axis and the distance from ATAC peaks in base pairs is indicated on the X-axis. Peaks with the top 5000 p-values were selected for mouse motif density analysis.
Biomedinformatics 03 00061 g003
Figure 4. Oct4-Sox2-Tcf-Nanog (OSTN) orchestrates changes from distal enhancers. The Chipseeker R package was used to generate plots of locations of the OSTN motif. Mouse diagrams (A,C) show the intersected ATAC peaks from two murine datasets (GSE101905 and GSE93029). Human diagrams (B,D) show the intersected ATAC peaks from two different human donors (GSE147641). The distribution of the OSTN motif within the genome in terms of promoters, introns, exons, and other regions at different timepoints by species. The distribution of OSTN motif instances with respect to the transcription start site (TSS) at the different timepoints by species.
Biomedinformatics 03 00061 g004
Figure 5. Enhancers mediating transcription factor–target gene (TF−TG) interactions during reprogramming. Enhancers were filtered for those interacting with somatic and pluripotent hub regulators (Fosb, Fosl2, Jdp2, Pou5f1, Sox2, Sox21). Enhancers associated with the top 200 paired expression and chromatin accessibility (PECA) regulation scores in day 0 fibroblasts mediated interactions of fibroblast-associated transcription factors (Fosb, Fosl2, Jdp2) in both human (A) and mouse (C). Enhancers associated with the top 200 PECA regulation scores from reprogramming cells (day 12 mouse, day 13 human) and final pluripotent stem cells mediated interactions of pluripotent-associated transcription factors (Pou5f1, Sox2, Sox21). Enhancers on the y-axis are clustered by their transcription factor interaction profile. Not all enhancer labels are listed on the y-axis labels for improved readability; a select few enhancers representative of each cluster are displayed. For a complete list of the top enhancers identified by PECA2 software, refer to Supplemental Tables S1 and S2. Heatmaps were normalized by row, with a histogram of the number of values with a given z-score is provided in the upper right-hand corner of each timepoint plot. The histogram is overlaid on a color key, which indicates the corresponding color for a given z-score. Darker color indicates the enhancer is involved in TF–TG interactions with higher PECA scores with regards to probability of regulation for a given transcription factor. A Manhattan plot including the intermediate timepoint enhancers associated with the top 200 TF–TG regulatory scores for mouse day 12 (B) and human day 13 (D) are included. The height of the peak corresponds to the number of enhancers located in that region.
Biomedinformatics 03 00061 g005
Figure 6. Enhancer dynamics during reprogramming. (A,B) The top 50 enhancers mediating TF–TG interactions with the highest regulation scores at an intermediate timepoint (day 9 for mouse, day 13 for human) were identified with paired expression and chromatin accessibility analysis (PECA2). Openness distributions of these 50 enhancers were compared at each time point, indicating intermediate enhancers open shortly after reprogramming-inducing doxycycline treatment on day 3 (mouse) or shortly after transfer to naïve stem cell media on day 13 (human). The distribution of the enhancers’ openness is shown through violin plot curvature, where the majority of enhancers appear where the width of the violin plot is widest, and statistical outliers are plotted as individual points. Median values are indicated with a boxplot, with lower and upper hinges that correspond to the first and third quartiles (the 25th and 75th percentiles). Statistical significance was calculated in a pair-wise manner between the fibroblast stage and the corresponding timepoint (indicated with brackets) using a paired t-test. Statistical significance calculations are demarcated by asterisks: * (p ≤ 0.05), *** (p ≤ 0.001), **** (p ≤ 0.0001). (C,D) Chromatin regulators (shown on the y-axis) affecting the acetylation and methylation of these enhancers were identified and ranked by the number of significant (p ≤ 0.05) interactions with the selected 50 enhancers. Time points collected on each day (abbreviated as (D)) are indicated on the x-axis. The distribution of values in each heatmap is visualized as a color key and histogram plot.
Biomedinformatics 03 00061 g006
Figure 7. Analysis of core regulatory modules for mouse and human. (A) Heatmap of the normalized trans-regulatory score (TRS) on selected transcription factors and target genes for three mouse time points: an initial fibroblast timepoint (day 0), an early intermediate timepoint (day 3), and a final pluripotent timepoint. Transcription factors and target genes indicated on the axes are clustered by their association with fibroblast or pluripotent cell type. (B) Heatmap of the normalized trans-regulatory score (TRS) on selected transcription factors and target genes for three human time points, an initial fibroblast timepoint (day 0), an early intermediate timepoint (day 3), and a final pluripotent timepoint (day 21). (C,D) Mean expression pattern of transcription factors (shown in red) and the target genes they are predicted to regulate (shown in blue), represented as a log2 + 1 transformation of the transcripts per million (TPM) values for mouse (B) and human (D). Error bars indicate the standard error.
Biomedinformatics 03 00061 g007
Figure 8. Paired expression and chromatin accessibility analysis reveals dynamic TF–TG networks. Cytoscape-generated networks at fibroblast, intermediate, and pluripotent stages are provided for each species. Networks include the highest gene–gene interaction scores inferred by PECA, where a higher PECA score value indicates a higher probability of regulation. Each network contains the top 15 to 16 nodes associated with the highest interaction scores from differential network files created with the PECA_compare function, in addition to other lower scored edges associated with the top 15 nodes. To create differential networks with PECA_compare, each time point was compared to the fibroblast network as a control to create a timepoint-specific network, which was used for further analysis in Cytoscape. PECA score is represented by edge thickness and gene expression by node color. Tables including several kinds of centralities calculated by the application Cytohubba are supplied for each timepoint, including the number of degrees or connections a gene has, and bottleneck (B.N.) centrality, which calculates how much information flows through a given node. Centralities were calculated using full networks containing thousands of genes.
Biomedinformatics 03 00061 g008
Figure 9. Mouse refractory versus reprogramming network comparison. Differential networks between mouse refractory and reprogramming cells from day 6 were compared. Networks include the highest gene–gene interaction scores inferred by PECA. Differential network files created by comparing the refractory and successfully reprogramming samples using the PECA_compare function. PECA regulatory score is represented by edge thickness and gene expression by node color. Tables including several kinds of centralities calculated by the Cytoscape application Cytohubba are supplied for each timepoint, including node degree and bottleneck (B.N.) centrality.
Biomedinformatics 03 00061 g009
Figure 10. Human primed versus naïve reprogramming network comparison. Differential networks between human naive and primed cells from day 21 were compared. Networks include the highest gene–gene interaction scores inferred by PECA. Differential network files created by comparing the naive and primed samples using the PECA_compare function. PECA regulatory score is represented by edge thickness and gene expression by node color. Tables including several kinds of centralities calculated by the application Cytohubba are supplied for each timepoint, including node degree and bottleneck centrality.
Biomedinformatics 03 00061 g010
Figure 11. Inter-species network comparison based on TF–TG pairs. (A) Inter-species comparison of core regulatory network modules indicates the amount of similarity between human and mouse reprogramming mechanisms. Schematic diagram where each node represents a module, or regulatory unit, containing the most active transcription factors and target gene interactions at each timepoint. Edge width indicates the Jaccard similarity between neighboring modules based on the number of corresponding transcription factors and target genes. The Jaccard similarity index value is indicated for edges between neighboring modules. The modules recapitulate the reprogramming steps for each species as defined by paired expression and chromatin accessibility analysis (PECA2), integrating information from both RNA and ATAC sequencing data. (B) Inter-species temporal ontology correlation. Gene ontology (GO) analysis of top 200 genes in each network generated by Ingenuity Pathway Analysis. GO term p-values are indicated by color scale.
Biomedinformatics 03 00061 g011
Table 1. Motif enrichment analysis revealed common and species-specific motifs across timepoints. Hypergeometric optimization of motif enrichment (HOMER) software identified transcription factor binding sites that were most highly enriched in differentially accessible peak regions. The motifs are ordered by the top 10 most significant p-values returned by HOMER for each time point. Peaks with the top 5000 p-values were selected for motif enrichment analysis.
MOUSE
MEFDay 3Day 6Day 9Day 12iPSC
FosKlf5OSTN 1OSTN 1OSTN 1OSTN 1
Atf3Klf6Oct4Oct6Klf5Sox3
Fra1Sox3Oct6Sox3Sox2Sox10
BATFKlf4Sox3Oct4Sox3Sp5
Fra2OSTN 1Brn1Sox2Oct4Sox21
JunBKlf1Klf5Oct1Sox21Sox6
Fosl2Sox2Sox10Brn1Sox6Sox2
AP-1Klf3Sox6Sox6Klf1Sox15
Jun-AP1Sox10Sox2Sox10Klf4Oct4
NFYEKlfSox21Sox21Sox10Sp2
HUMAN
HFDay 3Day 7Day 13Day 21iPSC
FOSFOSCTCFCTCFCTCFCTCF
FRA1FRA1BORISBORISBORISBORIS
ATF3ATF3KLF5OSTN 1TEAD1OSTN 1
BATFBATFOSTN 1KLF5TEAD3SOX3
JUNBFRA-2KLF1KLF1OSTN 1OCT4
AP1AP-1KLF6OCT4TEAD4BRN1
FRA2JUNBSP2KLF6TEADSOX6
FOSL2KLF5KLF4SP5TEAD2SOX21
JUN-AP1FOSL2KLF14KLF14SOX3OCT6
CTCFJUN-AP-1EKLFKLF4JUN-AP1SOX2
1 OSTN is an abbreviation for the composite OCT4-SOX2-TCF-NANOG motif.
Disclaimer/Publisher’s Note: The statements, opinions and data contained in all publications are solely those of the individual author(s) and contributor(s) and not of MDPI and/or the editor(s). MDPI and/or the editor(s) disclaim responsibility for any injury to people or property resulting from any ideas, methods, instructions or products referred to in the content.

