Article

Abnormal Gait and Tremor Detection in the Elderly Ambulatory Behavior Using an IoT Smart Cane Device

by
Marion O. Adebiyi
1,2,3,
Surajudeen Abdulrasaq
1,* and
Oludayo Olugbara
3,4
1
Department of Computer Science, Landmark University, Omu-Aran 251103, Nigeria
2
Landmark University SDG 3: Good Health and Well-being, Omu-Aran 251103, Nigeria
3
Covenant Applied Informatics and Communications—Africa Centre of Excellence (CApIC-ACE), Covenant University, Ota 112104, Nigeria
4
Computer Science and Information Technology, Durban University of Technology, Durban 4001, South Africa
*
Author to whom correspondence should be addressed.
BioMedInformatics 2022, 2(4), 528-543; https://doi.org/10.3390/biomedinformatics2040033
Submission received: 1 September 2022 / Revised: 21 September 2022 / Accepted: 25 September 2022 / Published: 9 October 2022
(This article belongs to the Section Medical Statistics and Data Science)

Abstract

:
In this paper, a novel approach for abnormal gait and tremor detection using a smart walking cane is introduced. Periodic muscle movement associated with Parkinson’s disease, such as arm shaking, vibrating arm, trembling fingers, rhythmic wrist movements, normal and abnormal walking pattern, was learned and classified with linear discriminant analysis. Although detecting symptoms related to disease with walking sticks might look trivial at first, throughout history, a cane or walking stick has been used as an assistive device to aid in ambulating, especially in the elderly and disabled, so embedding smart devices (that can learn ambulating pattern and detect anomalies associated with it) in the cane will help in early detection of diseases and facilitate early intervention. This approach is non-intrusive, and privacy issues being experienced in visual models do not arise, as users do not need to wear any special bracelet or wrist monitoring, and they only need to pick up the cane when they wish to move. The simplicity and efficient usage of a technique for detecting ambulatory anomalies is also demonstrated in this research. We extracted step counts, fall data and other valuable features from the cane, and detected anomalies by using isolation forest and one-class support vector machine (SVM) methods. Falls were detected easily and naturally with the cane, which had different alert modes (a soft alert when the cane lost equilibrium and was picked up within 15 s, and a strong alert otherwise). Intervention systems are proposed to forestall and limit the possibility of a type 2 error.

1. Introduction

The developed world has witnessed a tremendous increase in the population of older people, and a similar phenomenon is occurring in the developing world. The quality of living has generally improved worldwide, and people now tend to live longer. It is estimated that this trend might continue to soar, and in 2013, the United Nations [1] projected a worldwide population of about 1.5 billion older people by 2050. Because people experience aging in different ways, this makes it is very difficult to evaluate the behavioral pattern of elderly people. However, proper knowledge and understanding the way senior citizens of nations may behave will assist in their care, especially in the eventuality of an emergency.
In this paper, we introduce a smart cane or walking stick as an ambulatory aid for the elderly or disabled that is adaptable to monitor user behavior which can be learned in both supervised and unsupervised ways. Our approach has many advantages over all other existing methods. First, with respect to the non-intrusive nature of this method, users do not need to wear any special bracelet or wrist monitoring devices, and only have to pick up the cane when they want to ambulate. A significant aspect of this technique is the ability to easily detect a tremor (an unintentional, periodic muscle movement) of the hand or other parts of the body. Shaking, trembling in fingers, hands and arms is most commonly associated with Parkinson’s disease. As well as Parkinson’s disease, other diseases with common symptoms include apraxia, Alzheimer’s disease and arthritis. All these diseases are neurological conditions characterized by loss of the ability to perform normal ambulation.
Existing methods mostly focus on falling and a fall detection algorithm based on falling or not. However, combining an accelerometer and gyrometer in wearable devices can be very ambiguous in detecting falls. Our approach is straight forward. A cane or walking stick has always been used as an assistive device to aid in ambulating, especially in the elderly and disabled. Therefore, embedding smart devices (that can learn an ambulating pattern and detect anomalies associated with it) in a cane will help in early detection of movement-related diseases and facilitate early intervention.

1.1. Gait Abnormality and Ambulation Pattern

Inability to walk without hindrance, also known as gait abnormality, is a major sign of aging. This form of anomaly has been categorized into five types based on the symptoms or appearance of an individual’s walk [2]. These are spastic gait, scissors gait, step-page gait, waddling gait and propulsive gait. Studying these gait abnormalities is an imperative part of diagnosis that can provide information about neurological conditions. Gait abnormality may be due to musculoskeletal weakness, injury or genetic factors. On the other hand, abnormal gait can also be the result of an attack on the nervous system by diseases. Nutt et al. [3] noted two conditions or abilities that are required for walking, i.e., equilibrium (the capacity to assume the upright posture and to maintain balance), and locomotion (the ability to initiate and to maintain rhythmic stepping). These two conditions are separate but interrelated components of gait, and when one or both of these conditions is lacking, it can be concluded that the individual may be suffering from a walking abnormality.

1.2. Elderly Activities Evaluation

A great percentage of elderly people are in constant need of help, which may warrant seeking help from outsider(s) or entering a nursing home. Questions arises concerning how to evaluate the needs of the elderly. Do we ask them verbally or study their behaviors? Advances in technology and the use of the Internet of Things (IoT) devices enable us to use the latter option. The rapid fast increase in the elderly population has necessitated growing demand in many sectors such as health-care systems for monitoring activities of daily living (ADL) and the use of context-aware computing systems. Using smart devices is becoming more popular, especially in the field of anomaly detection. Now it is possible to track occurrences of regular behavior to monitor health and detect changes in activity patterns and lifestyles [4] for the elderly or people with disabilities.
Behavior is an individual phenomenon which is difficult to generalize. Some studies suggest an older person will probably act the same way he or she acted when young, but in reality, aging affects the elderly in a different ways. Sense organ depreciation (frequent loss of hearing, poor vision) and cloudy thought (as a result of memory loss) may occur. Therefore, it is safe to conclude that the activities of the elderly are highly influenced by the health status of the individual.

1.3. Overview of This Paper

The aim and objective of this work are to develop an efficient and effective way of detecting tremor and gait abnormality based on ambulatory behavior using a smart cane device that can collate, learn, and predict user behavior. In addition to this, ambulatory pattern learning can lead to early diagnosis of impending disease and ailments. We also intend to detect anomalies related to ambulation in the activities of the elderly. This paper is organized as follows: Section 2 is the review of related work; Part 1 encompasses the Material and Methods section, which consists of Section 3 and Section 4, which explain the detection and classification of tremors; Part 2 is the second part, which is based on anomaly detection in ambulation. We conclude the paper with Section 6 and Section 7.

2. Related Work

Several studies have been carried out in order to segregate what can be termed normal and abnormal behavior among the aged. Most of these studies are based on heuristic analysis, discriminative, and generative methods. Sometimes, they may be combined for better classification. However, some of these methods are not so comfortable. Users are made to wear various sensors on areas of their body, including the neck, wrist, waist and even foot. A vision-based approach might be intrusive on the privacy of the user due to the fact that cameras are not suitable for bathroom purposes. Moreover, most of the existing techniques are based on fall detection, which at times report a number of false positives and lead to mistrust of such devices among the caregivers and relatives. The following are some of the existing methods and techniques adopted in learning the activities of daily living of the elderly people.
Wagner file analysis [5], a cloud-based health care system, was proposed for the elderly using an incremental SVM (CI-SVM) learning with tri-axial acceleration sensor embedded to capture the movement and ambulation information of elderly. The collected signals are first enhanced by a Kalman filter, and the magnitude of signal vector features is then extracted and decomposed into a linear combination of enhanced Gabor atoms. A slight change in air pressure [6] was used to detect vertical movements, and classification was achieved by using one acceleration sensor with one air pressure sensor attached on the waist to detect the moving styles of going up or down the stairs or in an elevator.
Artificial Neural Networks (ANNs) in conjunction with a simple kinematics model was used by [7] to detect different postural transitions (PTs) and walking periods during daily physical activity. The authors of [8] used conductive textile-based electrodes that are integrated into wearable garments, and capacitance change inside the human body was measured. Such changes are interrelated to motions and shape changes in muscle, skin, and other tissue, which can in turn be related to a broad range of activities and physiological parameters. Activities such as chewing, swallowing, speaking, sighing (taking a deep breath), as well as different head motions and positions was learned. Medrano et al. [9] tried out the use of a machine learning technique based on a one-class classifier that had only been trained on ADL to detect falls as anomalies with respect to ADL. Their experimentation was conducted with a k-Nearest Neighbor (kNN) classifier. Although they conducted their studies on simulated data provided by volunteers, the participants simulated about eight different types of falls (forward falls, backward falls, left and right-lateral falls, syncope, sitting on empty chair, falls using compensation strategies to prevent the impact and falls with contact to an obstacle before hitting the ground) using smart phone embedded with accelerometer. They then tried to learn one-class kNN and subsequently tried to evaluate their model on two classes. A support vector machine (SVM) gave a promising result. However, they concluded that an accelerometer provides detailed information on behavior such as physical activity and inactivity.
Mubashir et al. [10] categorized falls into falls from walking or standing, falls from standing on supports (such as ladders), falls from sleeping or lying in the bed, and falls from sitting on a chair. If we are to follow this classification, then the focus of this studies will be on the first two, since we are dealing majorly with ambulation as a subset of ADL.
Noury et al. [11], designed a smart fall sensor, the software application transmits the data remotely through the network as well as exploiting data locally. The data are further analyzed to determine the current state such as lying after a fall, sleeping, and walking, amongst others.
Alessandra Moschetti et al. [12] compared unsupervised and supervised methods in recognizing nine gestures by means of two inertial sensors placed on the index finger and on the wrist. Three supervised classification techniques (random forest, SVM, and multilayer perceptron), as well as three unsupervised classification techniques (k-Means, hierarchical clustering, and self-organized maps) were compared in the recognition of gestures made by 20 subjects. The obtained results show that the SVM classifier provided the best performance (0.94 accuracy) compared to the other supervised algorithms.

Drawback of the Existing Methods

Ref. [13] investigated a low-cost, wearable, intelligent accelerometer sensor with an IEEE 802.15.4-based communication paradigm for tracking human activity. Due to the system’s reliance on an 8-bit PIC18F2431 microcontroller for data processing, it was still insufficient for complicated signal processing.
Ref. [14] uses a motion-capture system comprising wall-mounted sensors and at least six body-worn tags, and the gait data of the elderly was recorded. Additionally, a machine learning classifier for identifying health issues was suggested. However, the system can only be used indoors due to the wall-mounted sensors.
In Refs. [15,16,17,18,19], all of the methods employ the use of surveillance videos, and elements of the human body or movement trajectory are taken. They are also used to detect and analyze aberrant gait behavior. Video-based solutions have certain difficult-to-solve issues, such as privacy invasion, which is constrained by the quantity, placement, and field of view of cameras, which significantly restricts their practical application.
In Ref [20], crucial sensor thresholds and a wearable sensor system comprising a 3-axis accelerometer and gyroscope were used, and the fall detection method was first proposed. However, more research was still needed to produce a reliable fall detection system using the suggested approach of merging accelerometer and gyroscope readings using critical criteria for the detection method.

3. Material and Methods

3.1. Tremor Detection

Tremor is a neurological disorder that results in involuntary shaking of hands, fingers or other parts of the body. Tremors are the common symptoms associated with Parkinson’s disease [21]. Parkinsonian tremors are often times referred to as resting tremors because they are often noticeable when the muscle is relaxed during walking or standing. Early detection of the symptom will allow for quicker action and necessary intervention.
Although none of the existing techniques has explored the use of a smart cane, proposed in this study for the detection of tremors and other anomalies, we presume this will be more convenient and more comfortable for the users compared to the wearable devices which may be intrusive and awkward. The system is composed of a perception layer, data collection and storage layer, smart learning platform, and intervention layer. Figure 1 depicts the block diagram of the proposed system.

3.2. Perception Layer

This layer represents the genesis of the whole system. It comprises an accelerometer, GSM, GPS and gyroscope. The accelerometer provides detailed information on physical activities and inactivity, and this information can be used to measure more comprehensive relationships among movement frequency, intensity, and duration. It can also measure vibration intensity. GSM and GPS are used to monitor the location of the user in case of emergency, while the gyroscope will be used to measure orientation. In addition to that, it also aids in putting the accelerometer to sleep when the cane is on pause mode and activates it when picked up again.
An accelerometer is a tool that gauges a structure’s vibration or acceleration of motion. The piezoelectric material is “squeezed” by the mass due to the force of vibration or a change in velocity (acceleration), which results in an electrical charge that is proportionate to the force applied to it. Since the mass is a constant and the charge is proportional to the force, the charge must likewise be proportional to the acceleration. From space stations to mobile gadgets, these sensors are utilized in a range of applications.
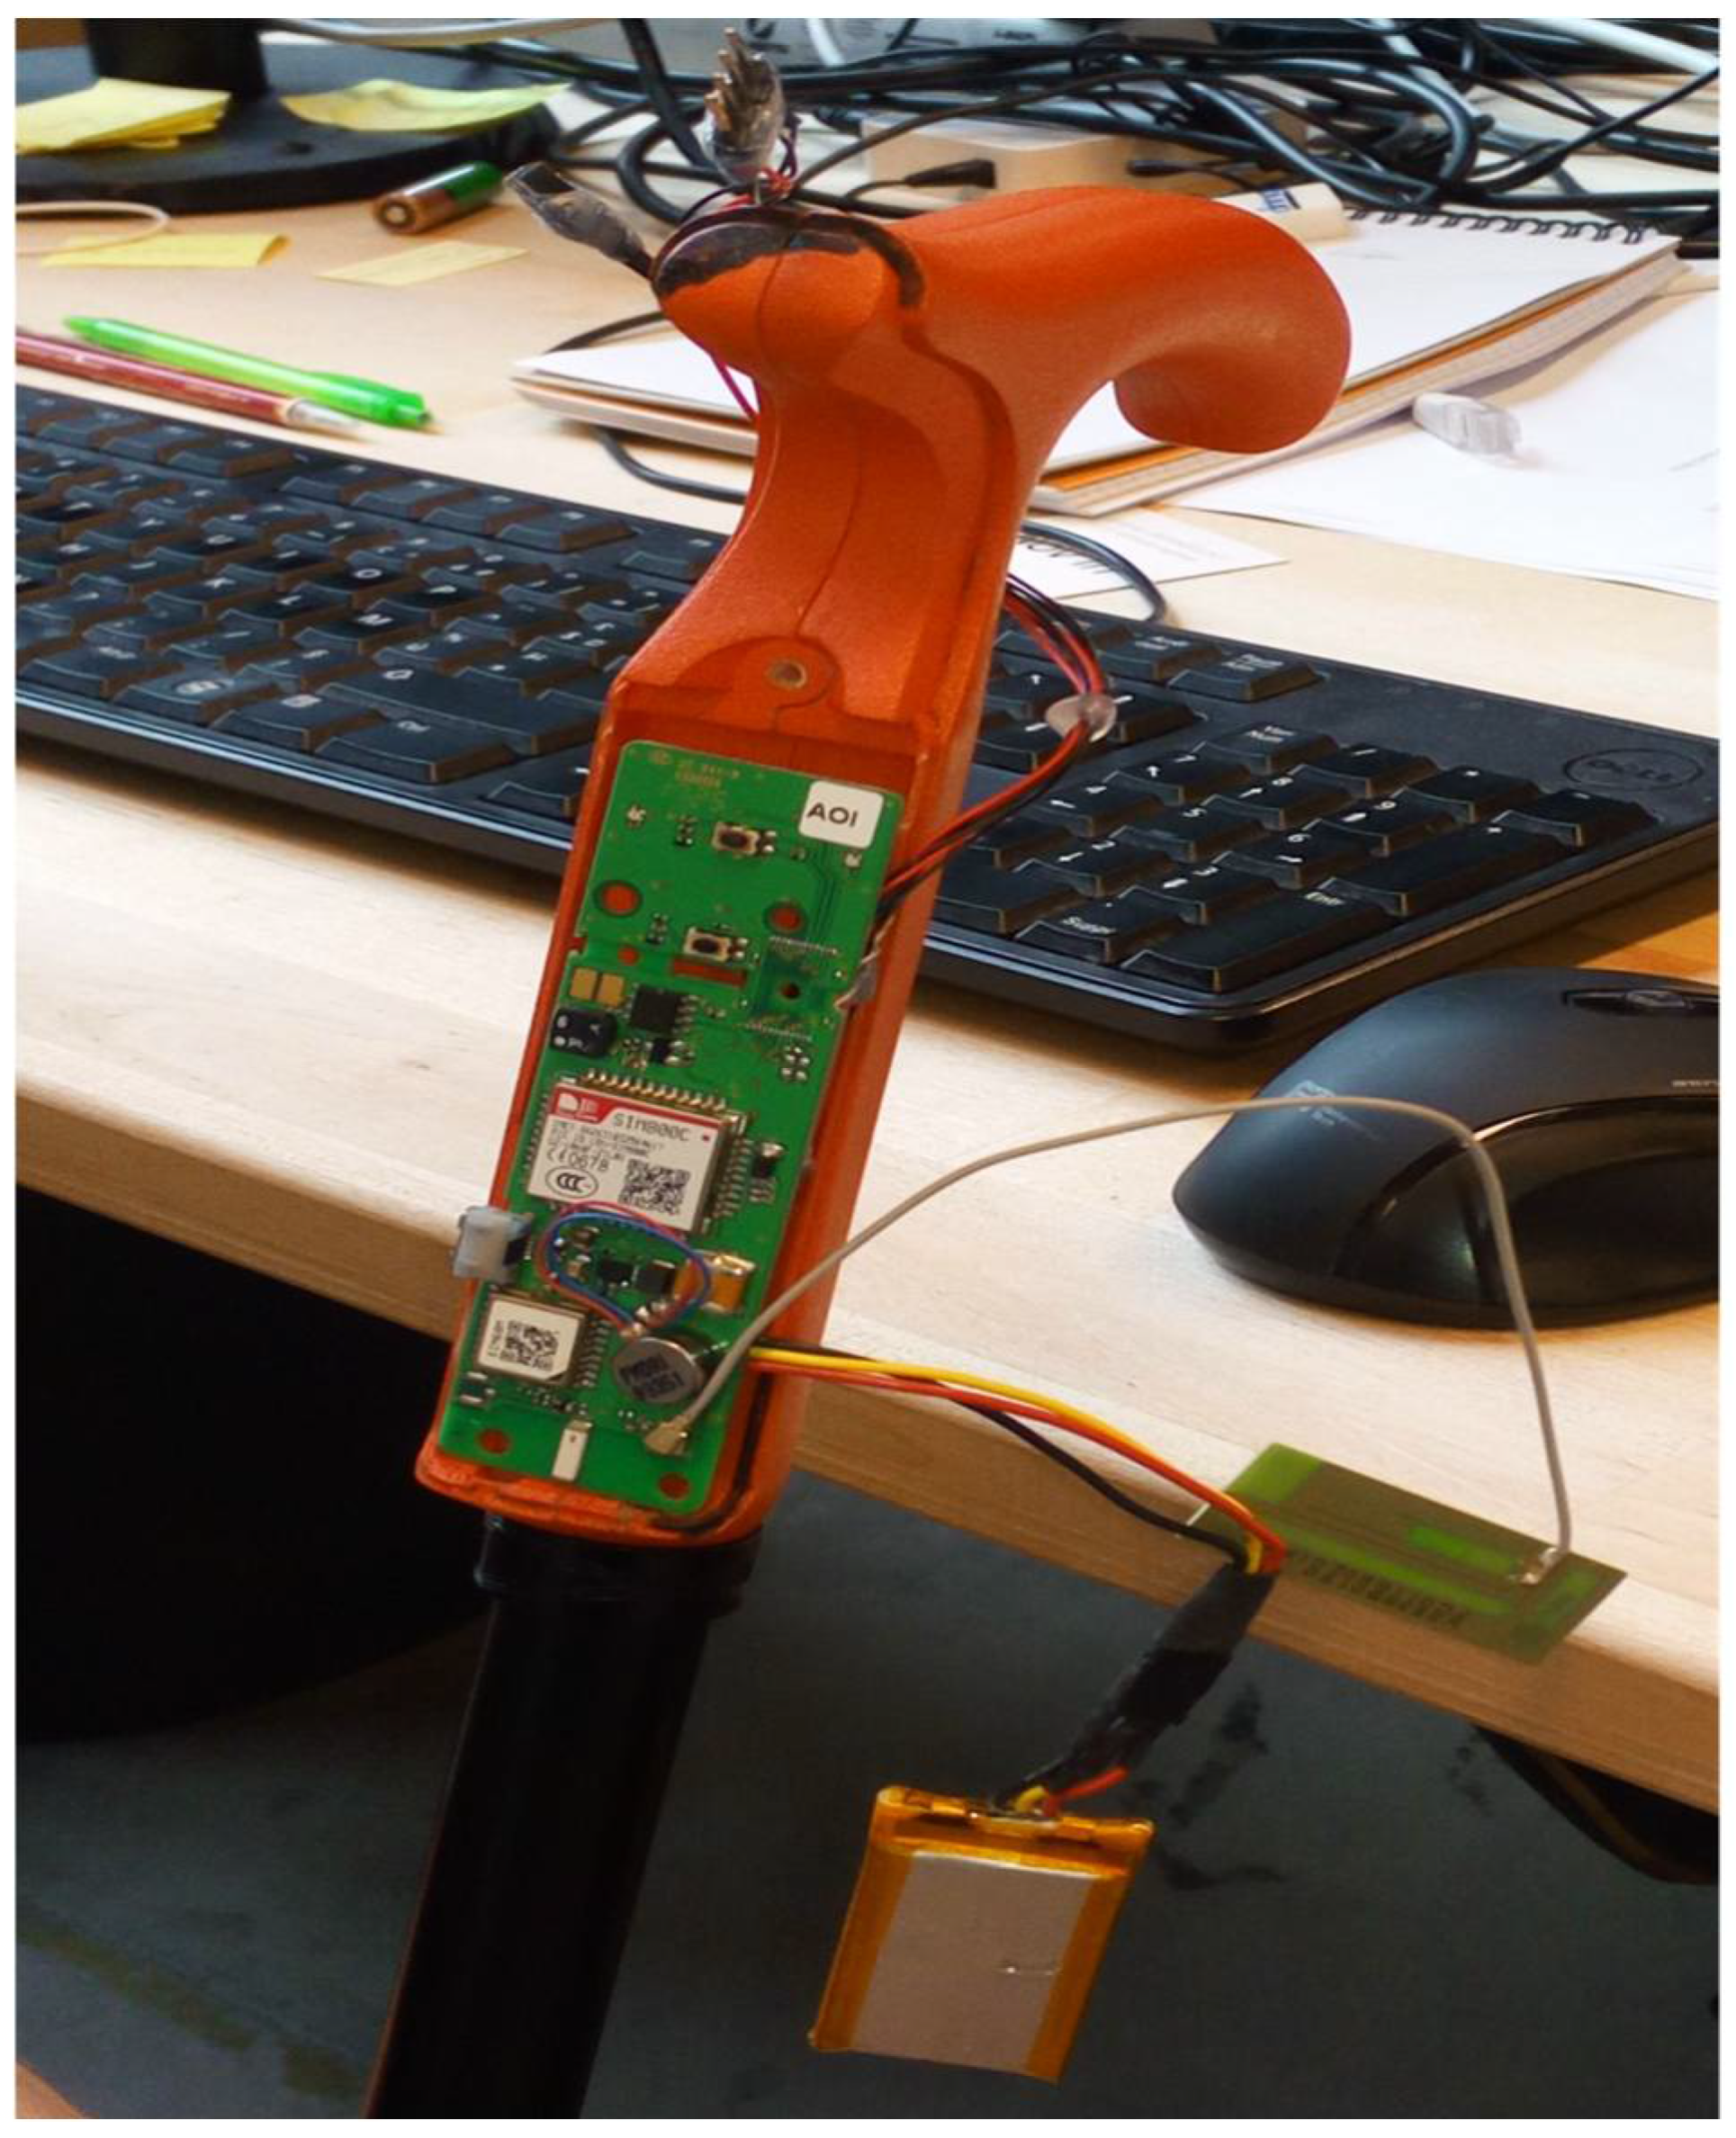
Data gathered by the cane will stored in the storage layer for analysis. Figure 2 shows the image of the cane and the attached devices and volunteer simulating some activities.

3.3. Storage Layer

Data generated by the perception layer is stored here. Preliminary processes such as filtering and feature extraction will be performed before transfer to the smart learning platform, which will learn and classify each of the different activities. Ambulatory pattern data is collected and stored; this includes but is not limited to slow ambulation, extreme slowness in walking, walking and stopping which might be as a result of tiredness, arm shaking, and vibrations. Adequate learning of this pattern will be useful for the prediction of impeding ailments of the users.

3.4. Smart Learning Platform

This is an incessant learning environment which can learn based on individual’s daily ambulatory activities. If abnormal activities are detected, a soft or strong alert will be activated, and the intervention layers will be notified accordingly. A soft alert is activated if some unusual (but learnt norm for the said individual) activity is detected. For example, a person who frequently drops the cane and picks it up again within the stipulated time frame. A strong alert is activated if the behavior is completely alien to the individual.

4. Activities Simulation

The cane was activated, and different pattern was simulated by three individual. The data were gathered for further processing. Some of the activity demonstrated include tremor simulation of the hand, irregular arm swing, vibrating arm, rhythmic wrist movements, normal walking and slow walking.

4.1. Filtering and Noise Removal

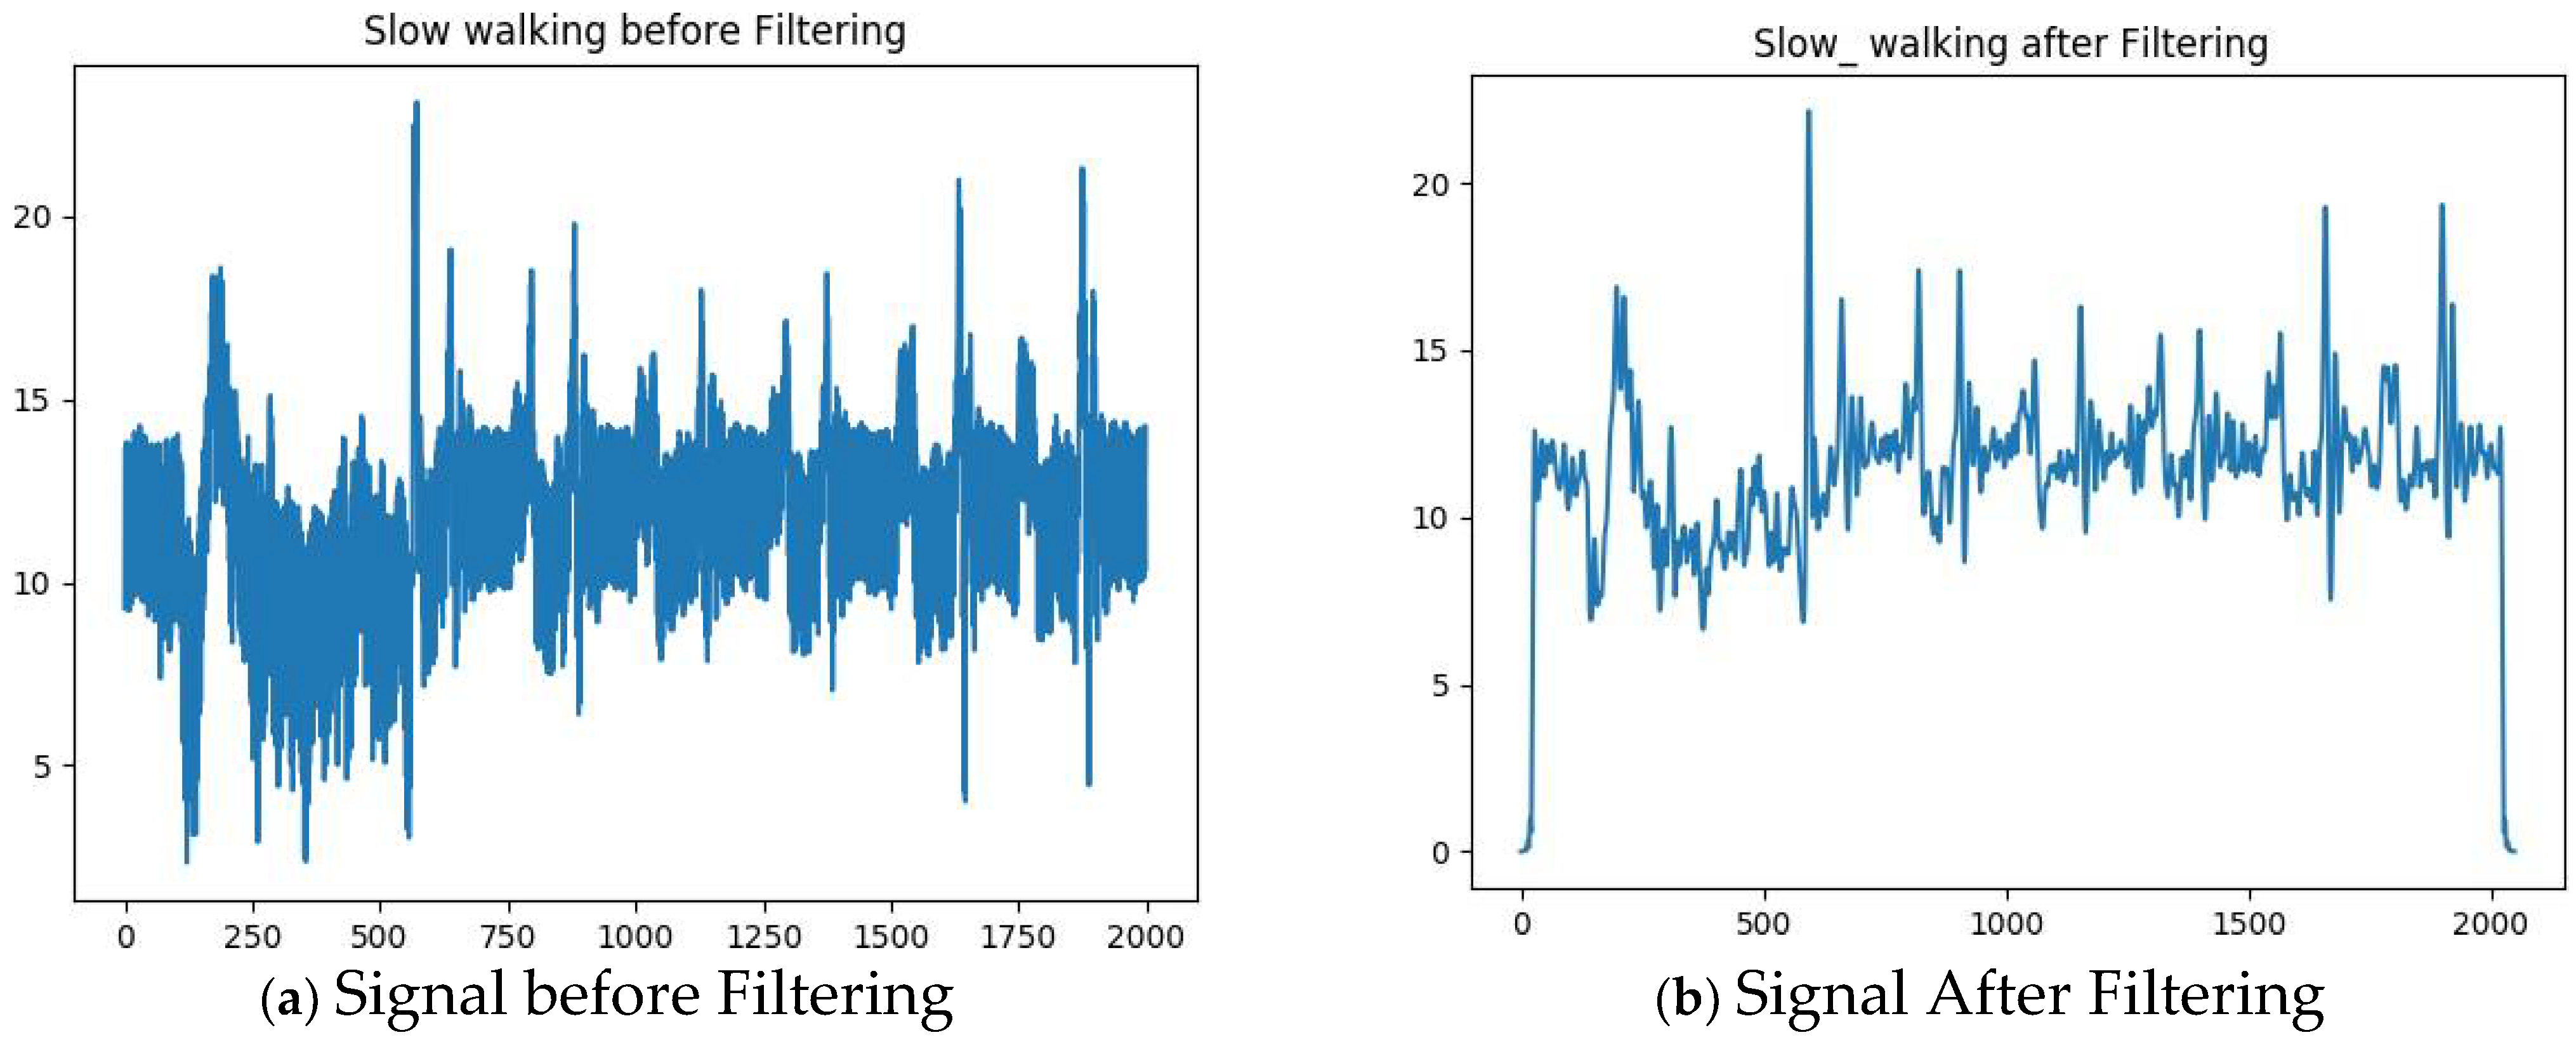
Filtering and noise elimination is a fundamental part of this work. Noise may interfere and corrupt the final results. A low-pass filter is used here due to its efficiency in removing small amounts of high-frequency noise and due to its computation simplicity. It passes low-frequency noise and reduces the amplitude of frequencies higher than the cutoff frequency. Figure 3a below show slow walking raw signal while Figure 3b shows the image after passing through low pass filtering.
y ( i ) = i = 1 n y i 1 ( x i y i )
0 < < 1

4.2. Feature Extraction

Signal Magnitude Area (SMA) can be used as a measure for differentiating between static and dynamic activities with the use of all three axes in the accelerometer signals. We achieve this by computing the sum of the vector magnitudes of the three axes.
S M A = i = 1 n ( | X ( i ) | ) + ( | Y ( i ) | ) + ( | Z ( i ) | )

4.3. Energy Feature

The set of features extracted here are used to discriminate between different types of activities such as walking, pausing, and shaking. It can also be used to identify the rate of velocity during ambulation such as fast walking, slow walking and extreme slowness in ambulation. We compute the short time Fourier transform (STFT) using the energy absorption.
X i [ k ] = n = N 2 N 2 1 w [ n ] X [ n + l H ] e j 2 π ( k n N )
w = a n a l y s i s w i n d o w
l = f r a m e n u m b e r
H = h o p

4.4. Dimension Reduction with PCA

Selecting the best feature and reducing the dimensionality to forestall the possibility of overfitting is a very important aspect of learning. Principal component analysis (PCA) is a very popular and effective method for achieving dimension reduction. In addition to this, PCA can help in speeding up the learning rate of a classifier. Let x be a vector of random variable r such that transpose of x is denoted by x T ; therefore, we can have x = [ x 1 , x 2 , , x r ] T .
Now we need to find the linear function of x that can maximize the variance 1 T x where α 1 is a vector of r constant α 11 , α 12 , , α 1 r , and 1 T x becomes:
1 T x = α 11 x 1 + α 12 x 2 , + + α 11 x r = j = 1 r α 1 j x j

4.5. Classification Using LDA

Linear Discriminant Analysis (LDA) is mainly commonly used as a dimensionality reduction procedure in the pre-processing step for pattern classification and machine learning applications. The objective is to project a dataset onto a lower-dimensional space with good class separability in order avoid overfitting (“curse of dimensionality”) and also reduce computational costs. LDA is a second-order statistical approach and a supervised classification approach that utilizes the class-specific information maximizing the ratio j ( w ) of the within and between class. Figure 4 shows the results of activity classification with linear discriminant analysis.
The daily habits of Normal Walking, Slow Walking, Vibrating Arm, Irregular Arm Swing, Resting, and Exhaustion were imitated by three people between the ages of 30 and 50. The participants had to carry out the various behavior actions that were provided, and each behavior was recorded three times for each category; then, in addition, regular (normal) walking was carried out by each individual thrice daily for 5 days. The sample information was gathered. Consequently, 99 imitated sample data were gathered and split into two groups. Our proposed algorithm employed one group (80%) for training and the other group (20%) for testing. Table 1 shows the level of accuracy for all investigated activity using Linear Discriminant Analysis (LDA).
j ( w ) = w T S b w w T S w w
where S b and S w are the between and the within class, respectively. They are computed as follows:
S b = k = 1 k ( m k m ) N k ( m k m ) T
S w = k = 1 k n = 1 N k ( X n k m k ) N k ( X n k m k ) T
where N k is the number of example in k-class; X n k is the n th data in k th class; m is the mean of the entire set; and m k is the mean kth class.
Note that we can compute the Lagrangian Dual and KKT by maximizing j , and then we have
S w 1 S b w = λ w

5. Anomaly Detection in Gait Ambulation

After successfully classifying the different the behaviors above, we proceed to the second part of this experiment, which is detecting anomaly associated with ambulation. Since data are an integral part of this study and accurate data collection is required to guarantee the integrity and cohesion of this device, the step count was gathered from the ambulation data of three individuals who simulate and mimic the movement of the elderly using the device as a walking aid. Subsequently, feature engineering and analysis was carried out on the said data. The following data were gathered from the cane.
Activities Data: This is a set of activities that are triggered when the user takes the cane. It stops when the user puts the cane down. Data in this category include:
  • Activity begin time;
  • Activity end time;
  • Number of steps.
Pauses: This refers to a sub-activity that happens when no step has been detected for 15 s. It automatically stops when a step is detected. Data in this category include:
  • Pause begin time;
  • Pause end time.
Alerts: this may be trigged by the occurrence of an accidental fall. When this occurs, the cane vibrates and the user has up to 15 s to cancel it by picking it up, else it will be reported as a fall. Data in this category include:
  • Fall time;
  • Fall alert (false when cancel otherwise true).

Data Description

Data description and documentation are necessary to ensure that the researcher, and others who may need to use the data, can make sense of the data and understand the processes that have been followed in the collection, processing, and analysis of the data. Below is the description of each column and how they are computed.
  • Date: This represents the day column and the day the activity was carried out;
  • Step count: The total number of steps taken by the user on a particular day;
  • Pause duration: The total duration of a pause by the user during activity, represented in seconds;
  • Mood: This is a heuristic feature that intends to express the user’s feeling on a particular day. Although this is assumed not to be 100 percent accurate, it might be interesting to estimate the user’s daily mood. It turns out that an average person has a step of approximately 2.1 to 2.5 feet. Therefore, it takes approximately 2200 steps to walk one mile, and a step count of 1000 will cover about 762 m, so if an aged person (who is mentally stable) can take about 3000 steps on a particular day, which is more than a one-mile walk, then he/she is assumed to be in a great shape and excellent mood. It is computed based on the following algorithm;
    • walk_duration = []
    • for i in range (0, len(walk_duration)):
    • if walk_duration >= 3000:
    • mood is ’Excellent Mood’
    • elif walk_duration >= 1000:
    • mood is ’Very good mood’ else:
    • mood is ’moody’
      Mood is represented in binary as follows:
      100 = moody, 200 = Very good mood, and 300 = Excellent Mood.
  • Activity length: This is the beginning of a daily activity literately when the cane is picked up.
  • Activity end: This is the end of a daily activity literately when the cane is finally laid to rest and no activation is detected for the rest of the day.
  • Activity length: This is the length of total activity for the day. It is computed from the sum of the difference in the activity end time and activity begin time. It is then converted into second(s).
  • True falls: A true fall is detected when the cane loses its equilibrium, and balance is not regained within a 15 s interval.
  • Walk duration: This can be referred to as total active moments of the day because it represents the total duration of ambulation by the user. It is computed by taking the sum of activity length and subtracting the total pause duration.
  • Tiredness: This is the rate of exhaustion that maybe experienced by the user. Tiredness may be due to fatigue, or it may be a sign of physical weakness experienced as one grows older. It can also be an indicator of distress. It is computed by taking the ratio of pause duration to the walk duration. It may be noted that threshold can be set for this, and a distress alert can be generated if tiredness is greater than 1. This is not a good sign because it means the user pauses more often than doing the actual walking, although it may not be 100 percent accurate because the user may pause to talk to people or due to some other reasons.
  • Speed: This is the rate of change in distance of the user. We can estimate how fast the user moves, and this is computed by taking the ratio of step count to walk duration.
  • False falls: This is a trigger alert when the cane loses its equilibrium, but it is cancelled when the cane is picked up within a 15 s time frame.
  • True fall time: This is the time when true falls occur.
  • False fall time: This is the time when false falls occur.

6. Anomalies Detection with Isolation Forest and One-Class SVM

6.1. Detecting Anomaly with Isolation Forest (Liu and Ting, 2012)

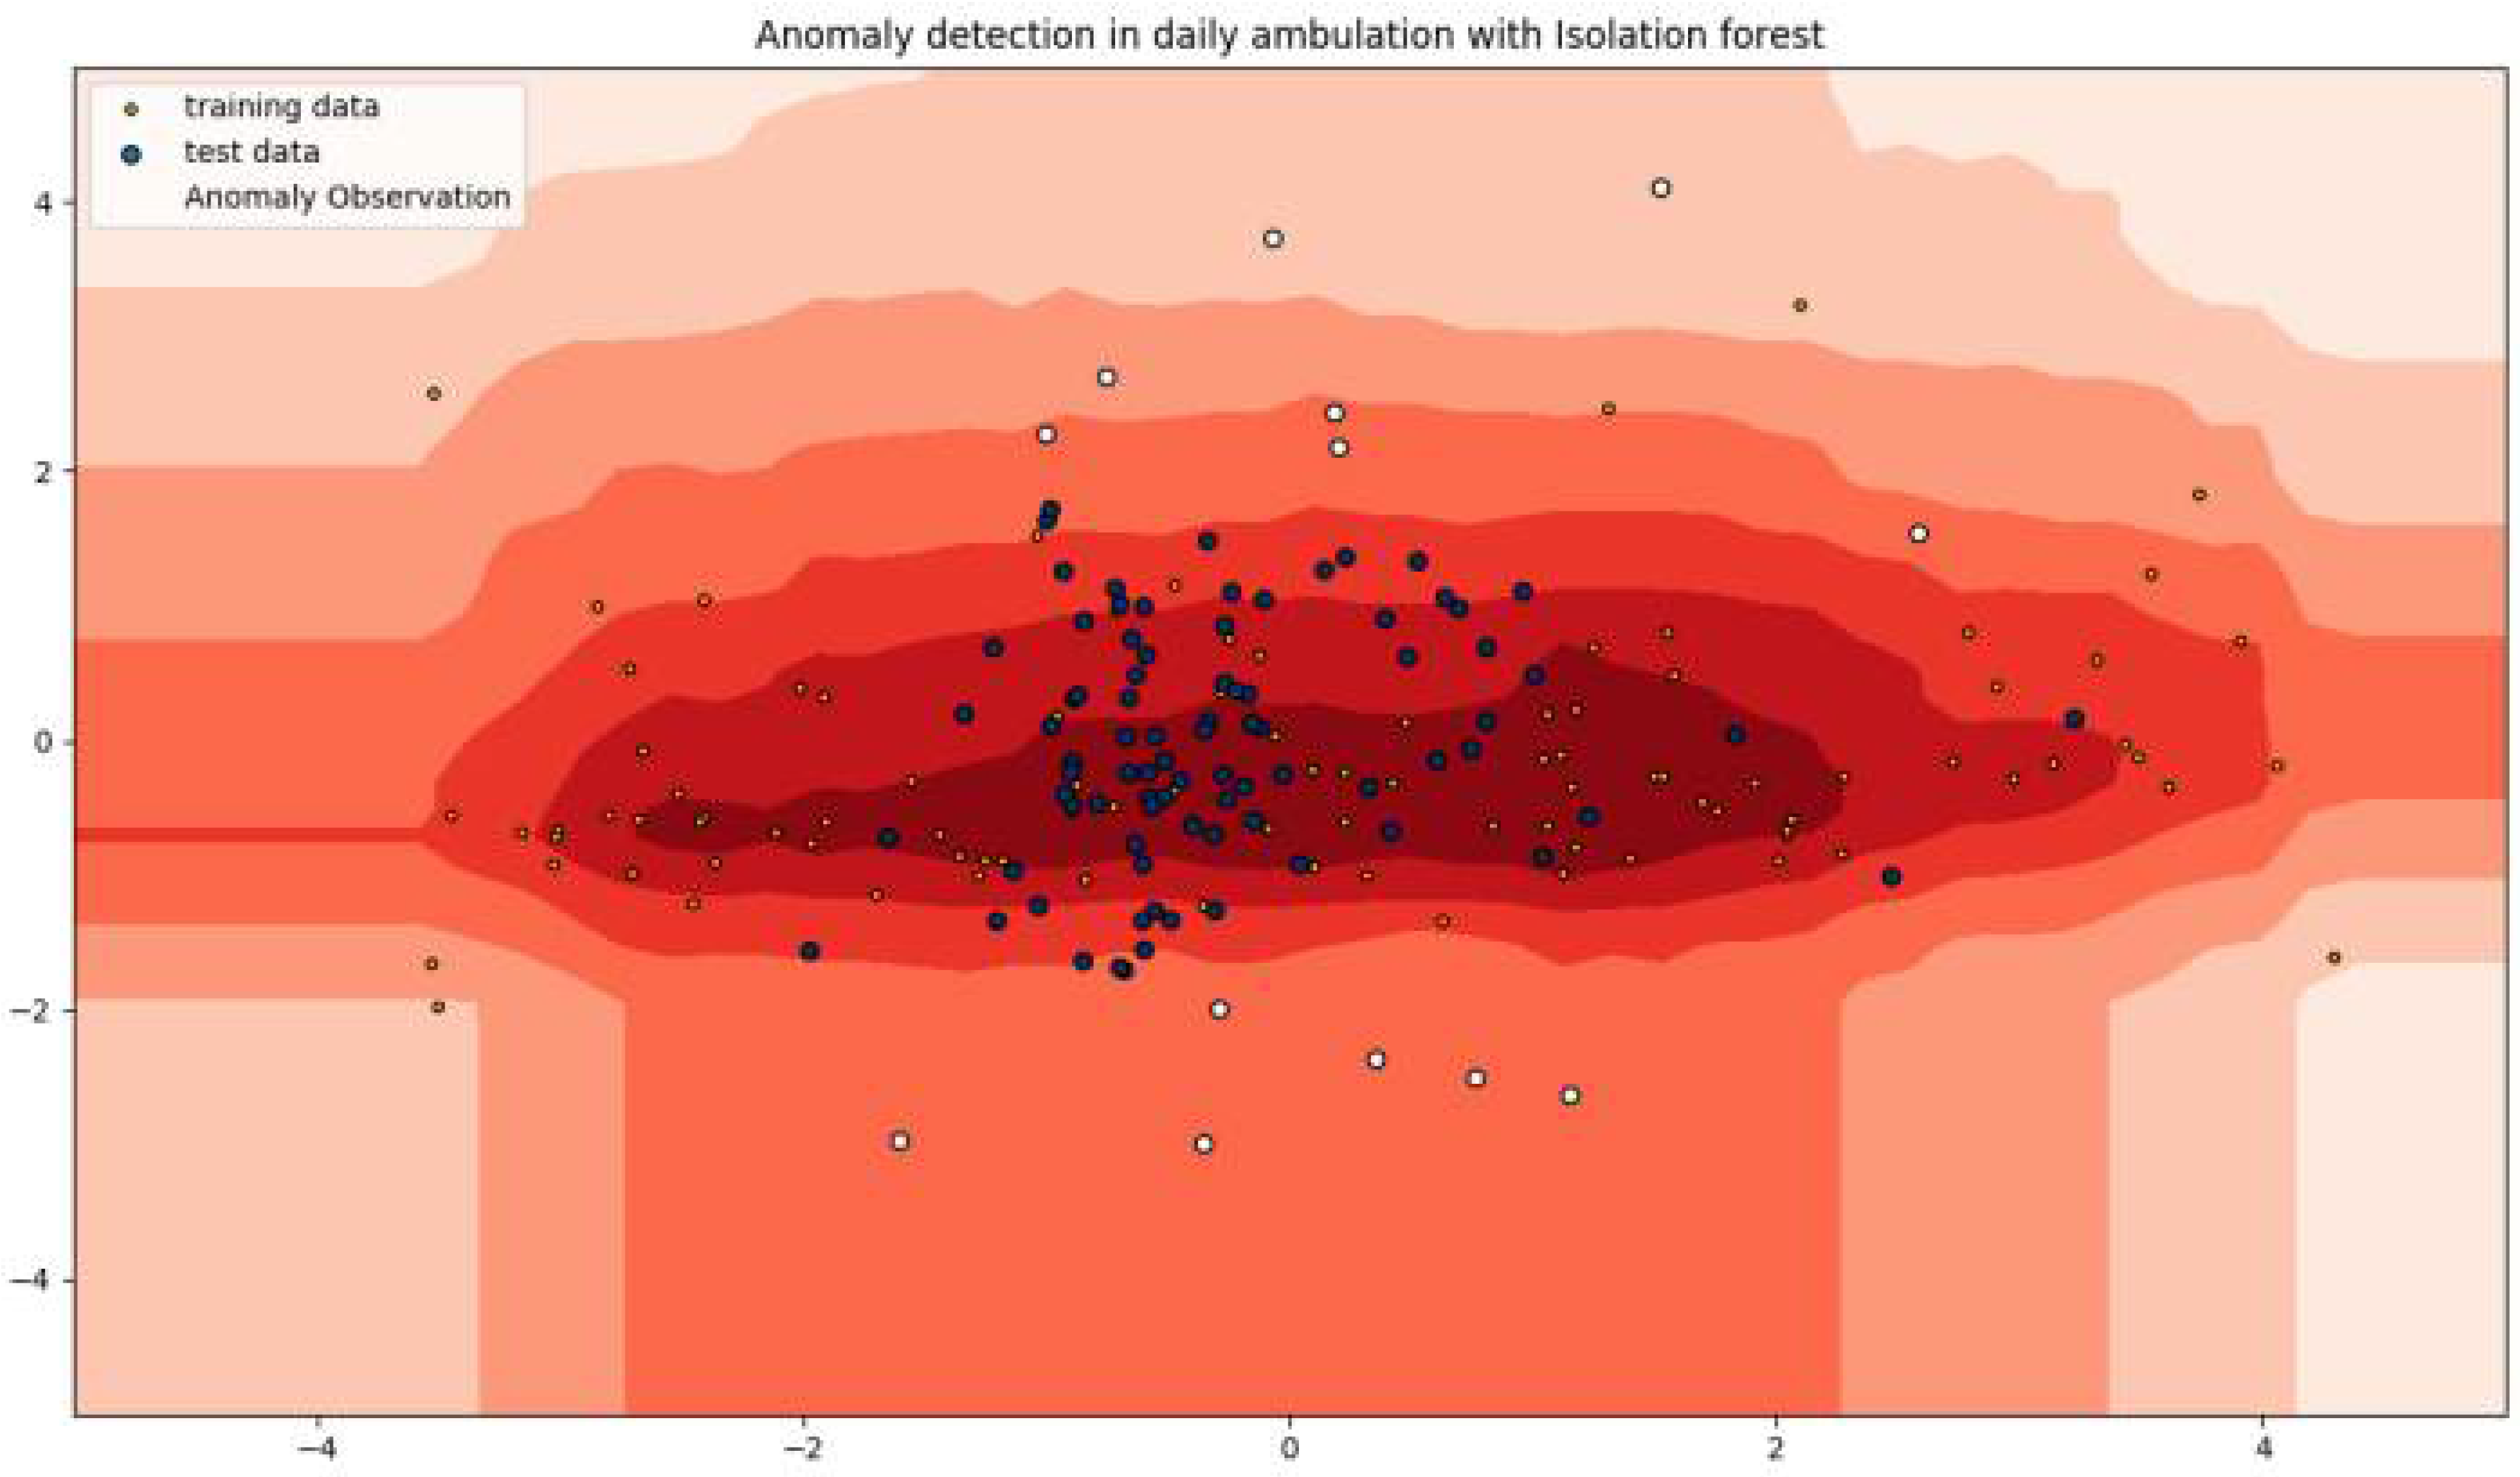
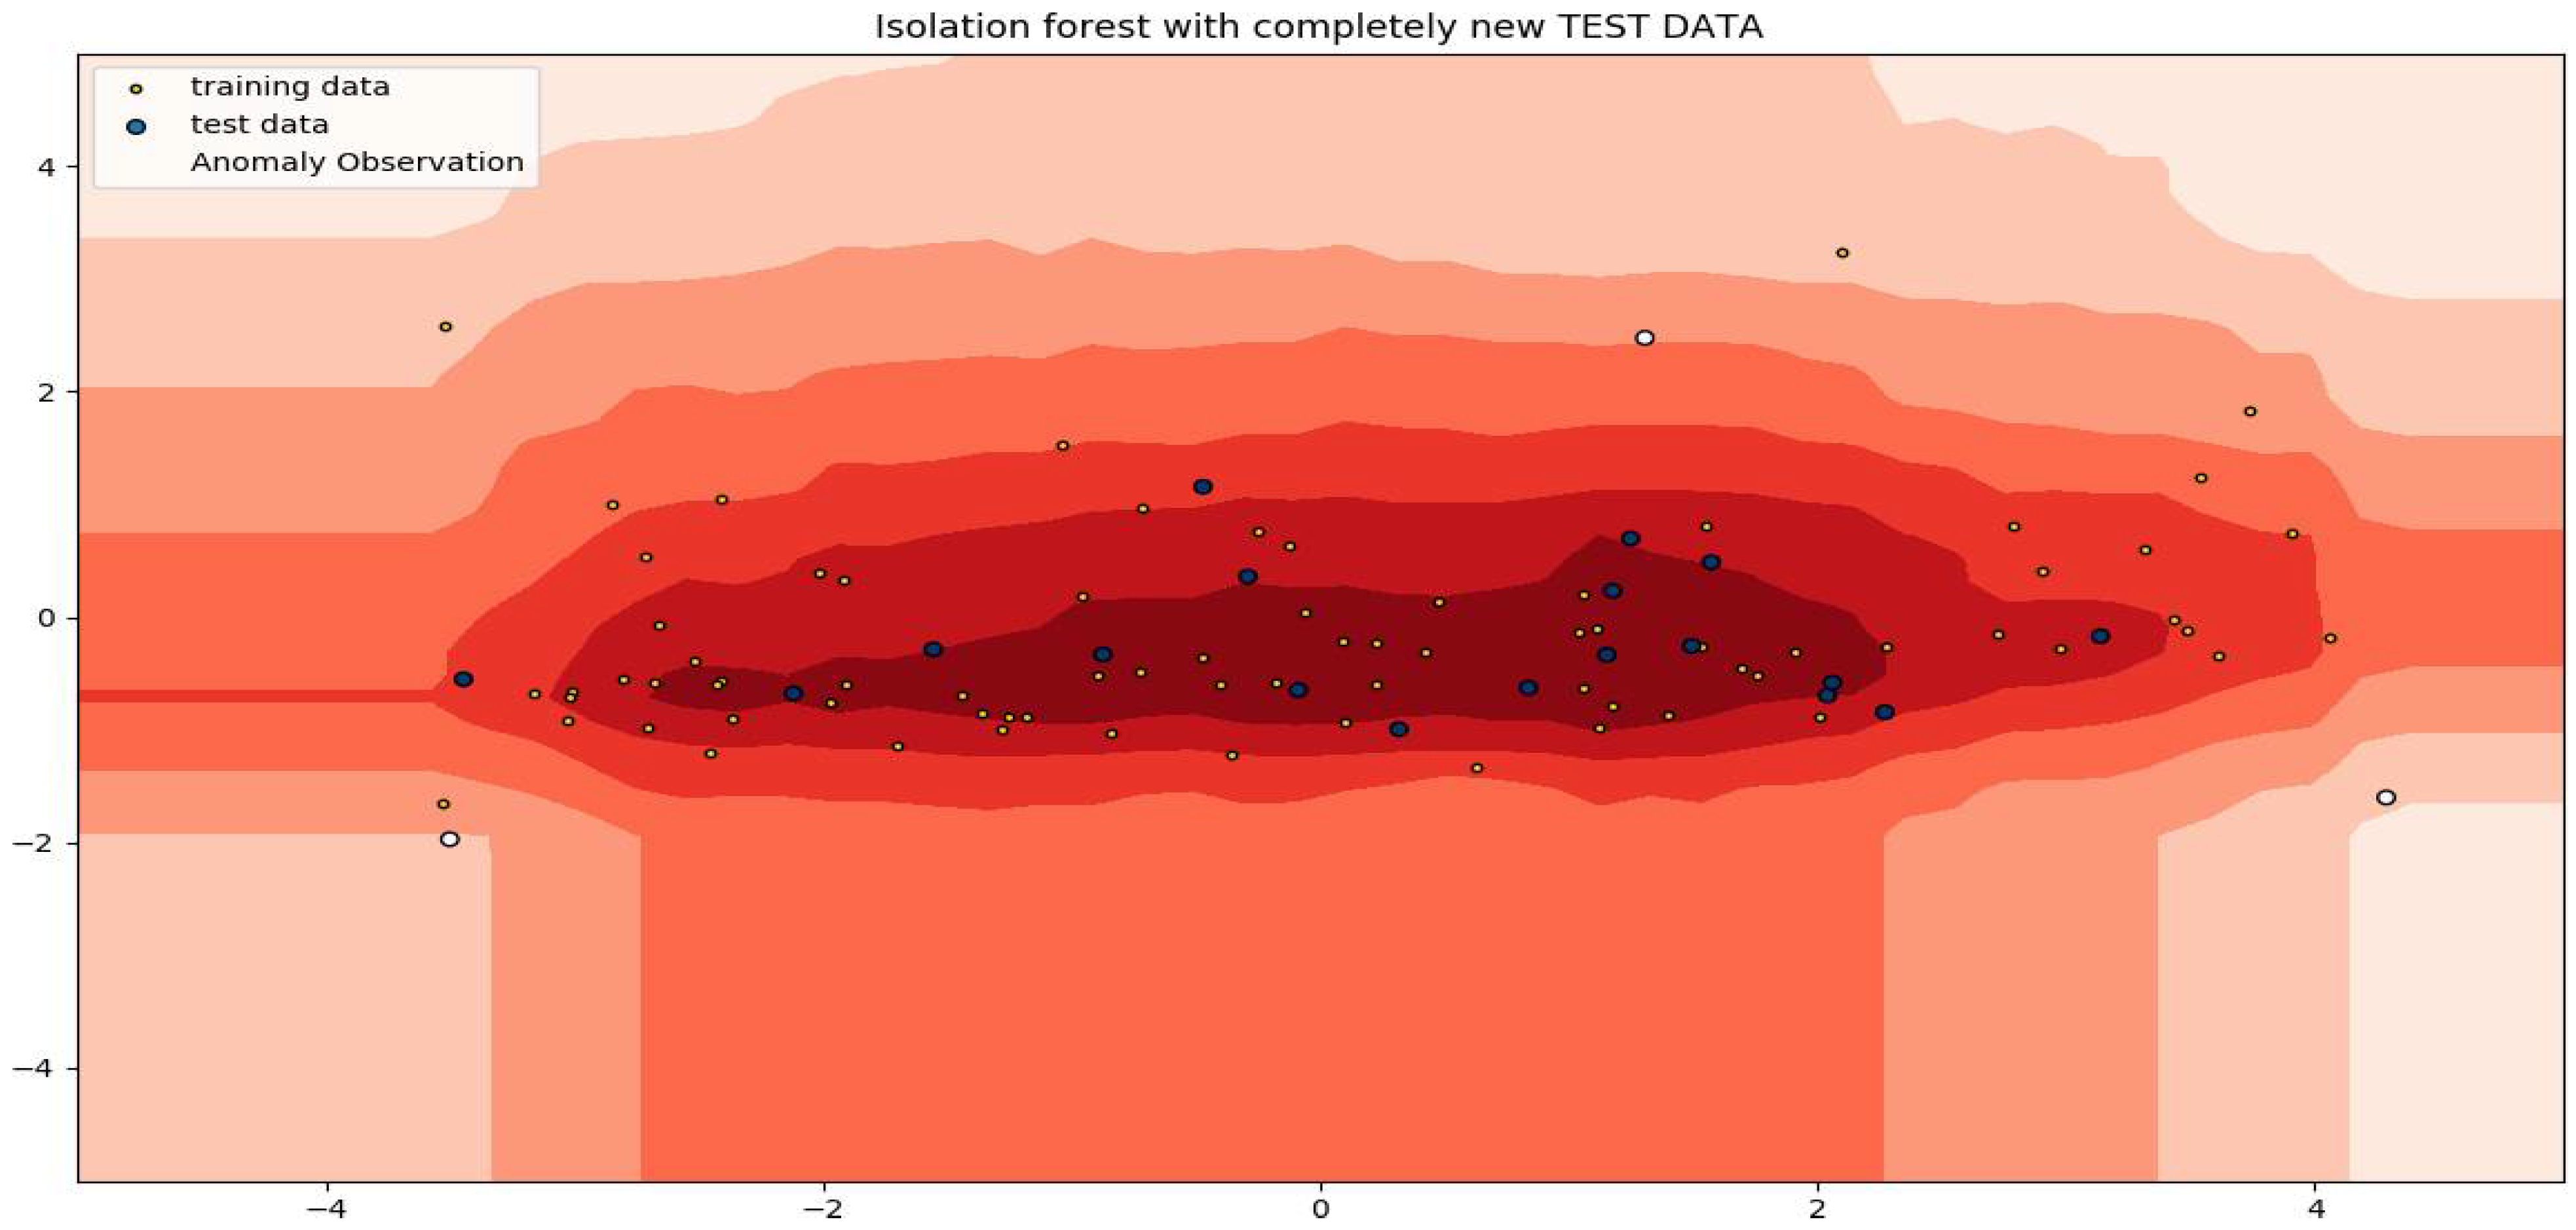
Isolation forest is a relatively new algorithm but is becoming more and more popular due to its simplicity and efficient usage of memory. The algorithm is based on the fact that anomalies are data points that are the minority, and unusual. They therefore can be secluded. This technique is a little bit different from the traditional way of isolating anomalies which are mostly based on distance to their neighbors and sometimes density difference. One big advantage of this method is the computation efficiency and low memory usage. The algorithm has a linear time complexity, which makes it suitable if we decide to implement it directly on the cane. Figure 5 shows anomaly detection with I-forest, and Figure 6 shows anomaly detection in a completely new test set.
The foundation of IsolationForests is the idea that anomalies are the “few and different” data items. Randomly subsampled data are processed in an isolation forest using a tree structure based on randomly chosen attributes. Since it takes more cuts to isolate the samples that traveled further into the tree, they are less likely to be abnormalities.
The anomalies observed in the tremor aspect are the abnormal arm movements during the cane usage; for example, an irregular or vibrating arm swing pattern was learned and classified, and slow walking was also regarded as an anomaly. Table 2 indicate the percentage of anomaly recorded by isolation forest in this experiment.

6.2. Detecting Anomaly with One-Class SVM

Another algorithm evaluated on our data is one-class SVM. This is a special case of a support vector machine (SVM) that learns a hyper plane by separating all the data points from the basis and constructs a smooth boundary around the majority of probability mass of data. It is an unsupervised algorithm that learns a decision function for uniqueness detection by classifying new data as similar or dissimilar to the training set. This makes it suitable for detecting anomaly. Given a dataset X , with an unknown label, and a ɸ ( X ) RKHS map (kernel Hilbert space) function from the input space to the feature space F , a decision function f ( X n ) in the feature space F is given as f ( X n ) = w T ɸ ( X n ) r , to separate as many as possible of the mapped vectors ɸ ( X n : ) , n : 1 , 2 , , N from the origin, where w is the norm perpendicular to the hyper-plane and r represents the bias of the hyper-plane, then we arrive at;
m i n ( w , r ) 1 2 | w | v 2 2 + 1 v . 1 N i = 1 n m a x ( 0 , r w , ɸ ( X n : ) ) r
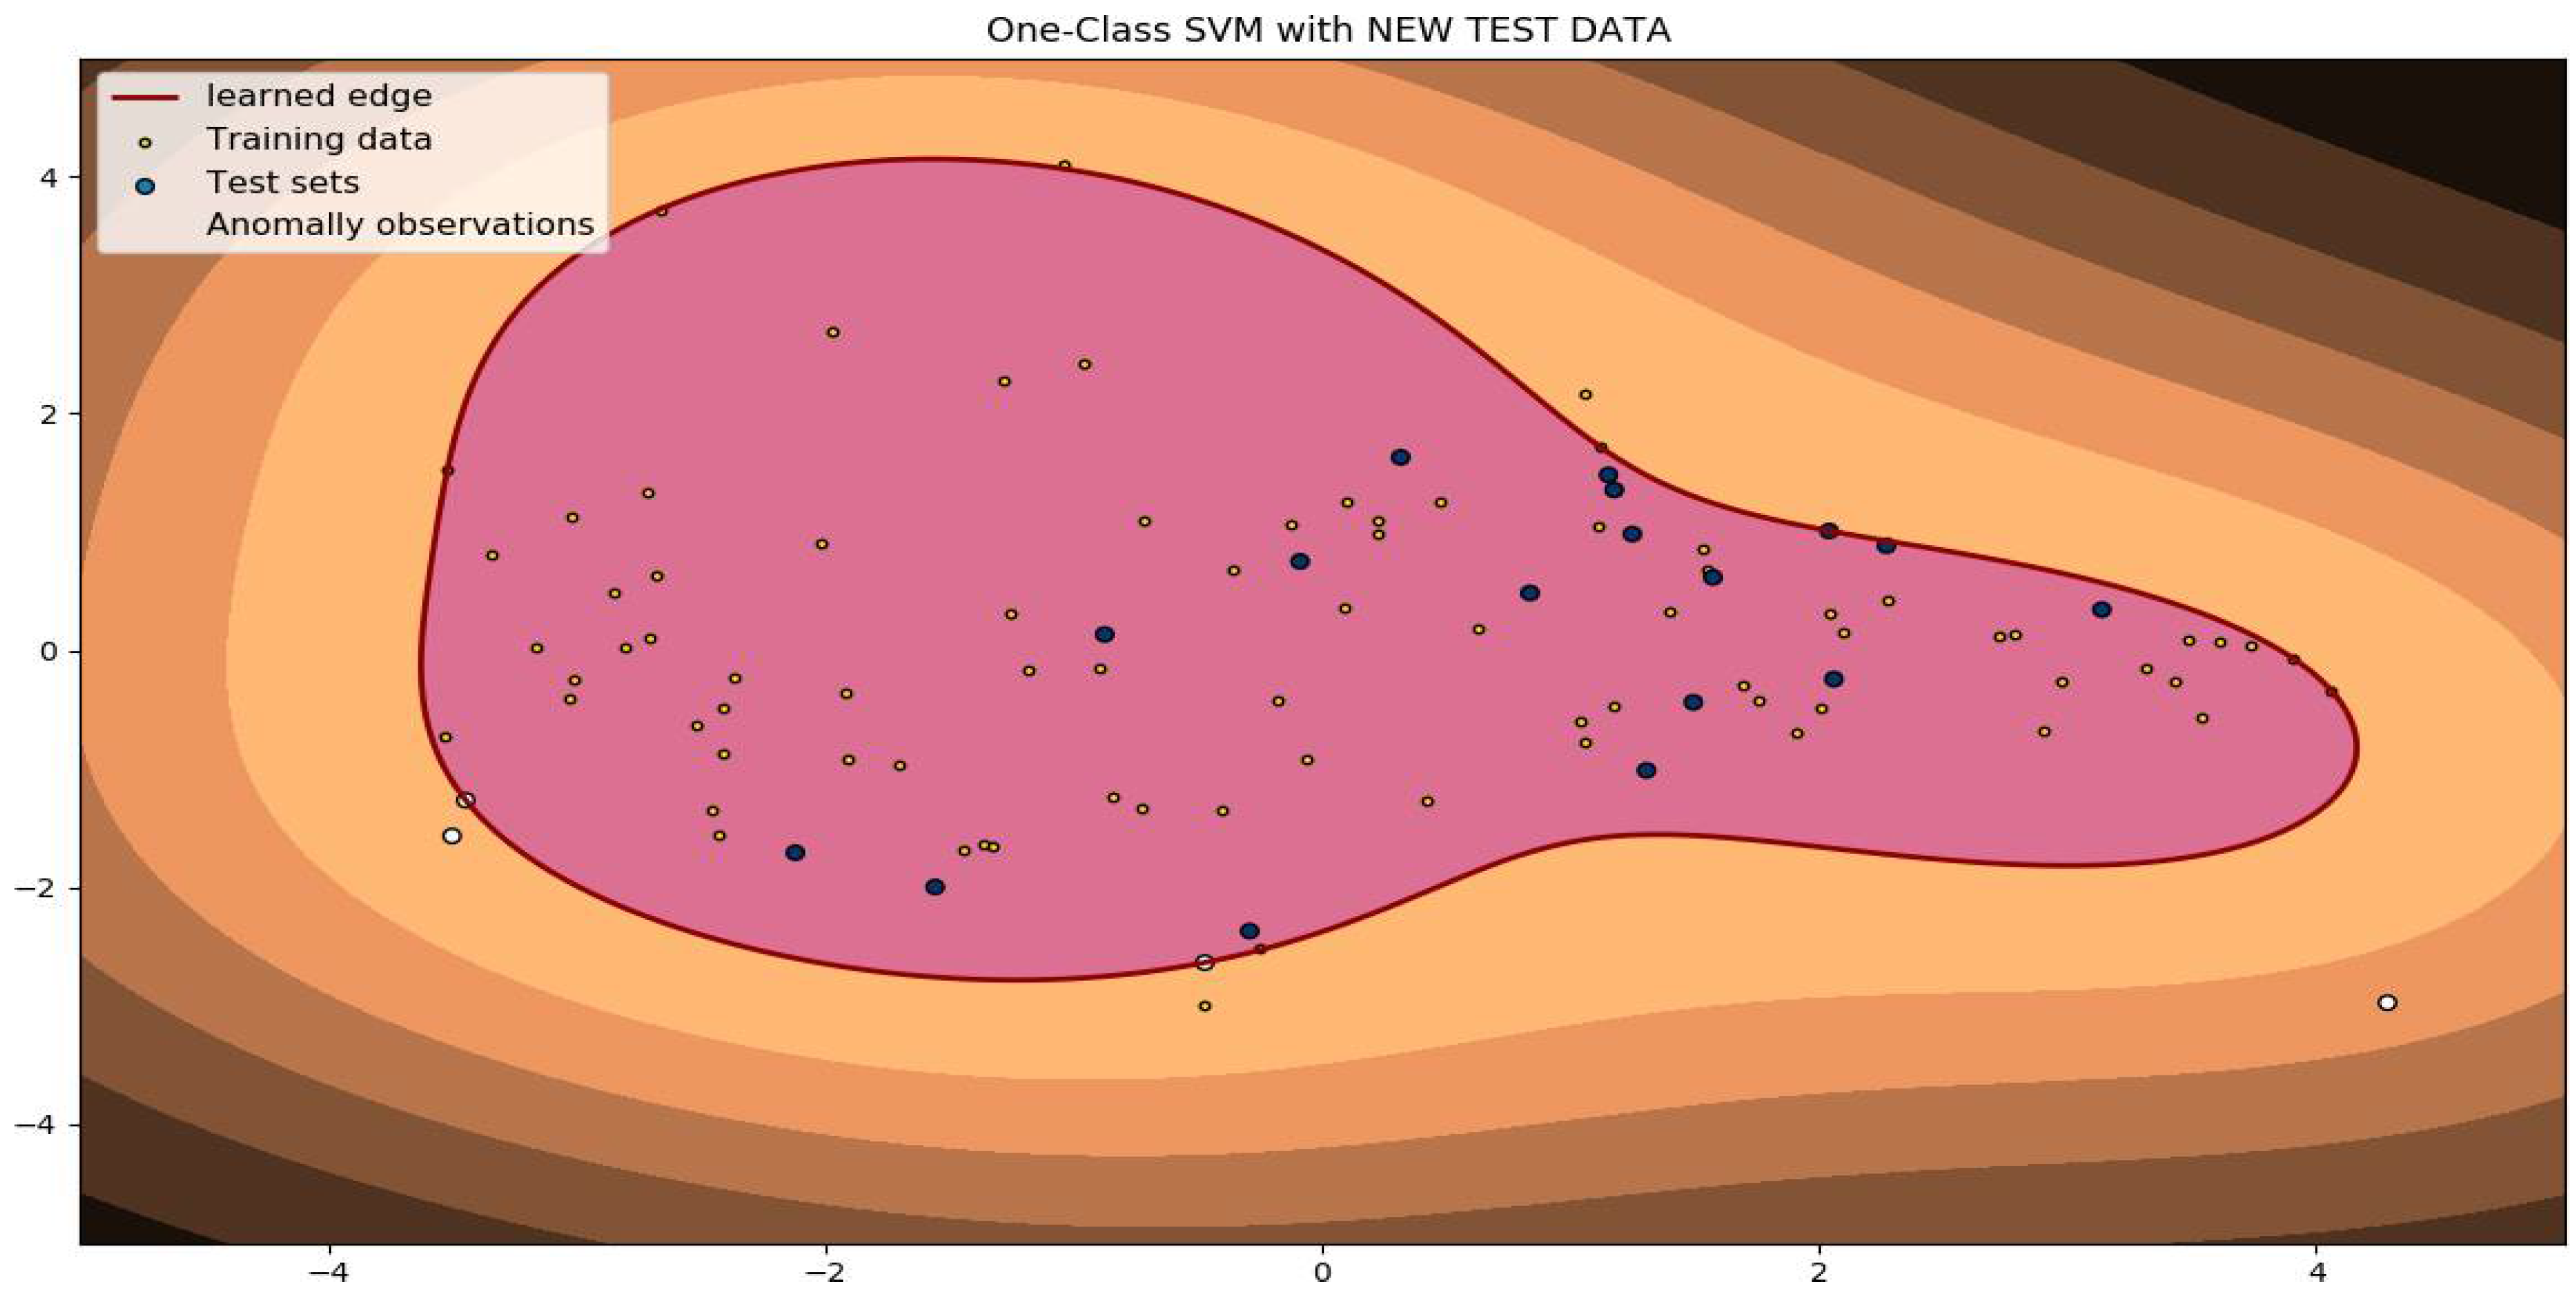
where v is the parameter that represents the balance between maximizing the hyper-plane and the total data-point permitted across the boundary and v ranges between (0, 1). Figure 7 and Figure 8 show anomaly detection with one-class SVM. The issue that one-class SVM attempts to solve is novelty detection, which is based on the estimation of the probability density for the data. The goal of novelty detection is to identify uncommon occurrences, or occurrences for which there are few samples available. In our case, one-class SVM was used to detect anomalies in every behavior, which may indicate a sign of disease in a user. Table 3 indicate the percentage of anomaly recorded by One-Class SVM in this experiment.

7. Discussion

In this paper, a novel approach for abnormal gait and tremor detection using a smart walking cane is introduced. Periodic muscle movement associated with Parkinson’s disease, such as arm shaking, vibrating arm, trembling fingers, rhythmic wrist movements, and normal and abnormal walking patterns, was learned and classified with linear discriminant analysis. We also demonstrated the simplicity and efficient usage of this technique to detect an ambulatory anomaly; we extract step counts, fall data and other valuable features from the cane, and we detect anomalies with the use of isolation forest and one-class SVM; falls are easily and naturally detected with the cane with different modes of alerting (a soft alert when the cane loses equilibrium and is picked up within 15 s, and a strong alert otherwise), which is a technique for the intervention system proposed to forestall and limit the possibility of a type 2 error. Young, healthy subjects were used in the experimentation for the proposed work to determine whether this approach could be applied to identify significant daily activities and ambulation.
Therefore, in order to assess the effectiveness of the same sensor arrangement, it is important to also test the system on senior individuals. Therefore, older people who may have physical impairment associated with neurodegenerative disorders such as Parkinson’s Disease will be used in future experiments. It is crucial to have technologies that integrate seamlessly into a person’s daily life and require minimum setup or training in order to make activity tracking a true part of daily living. These issues currently present academics with a real technical problem that they must solve. By using unsupervised algorithms, it is possible to get around problems with the need for labeled data, making it simpler to evaluate enormous amounts of data and moving closer to practical applications. With unsupervised techniques, the combination of sensors reported in this paper offers an excellent recognition rate. We compare the activity recognition rate of our methods with some state-of-the-art methods, and our method outperforms existing methods, although some activities which were evaluated by us were not evaluated in most of the existing studies. Table 4 below shows the comparison between different methods of activity classification and some state of the art methods.

8. Conclusions

The findings of this study indicate that it is quite feasible to detect anomalies in elderly ambulation behavior, and this can be applied to the aged care system. The smart cane approach has so many advantages over all other existing methods, such as: its non-intrusive nature; the fact that the cane has been used as an ambulatory aid for old, weak, and disabled people right from time immemorial; and the simplicity and adaptability to the user’s behavior, which can be learned in both supervised and unsupervised ways. In the first part of this study, we demonstrated the application of simple and computationally efficient algorithms such as LDA to detect and learn behavior. This led us to detect tremors by learning the pattern of ambulation of a user and the possibility of detecting the likelihood of disease before it reaches an advanced stage. This also makes an adequate recommendation for the patient to visit a physician. Ambulatory patterns such as slow ambulation, extreme slowness in walking, walking and stopping (which might be as a results of tiredness), arm shaking, and arm vibration were successfully learnt and classified. In the second part, we also demonstrated the simplicity and efficient usage of this technique. Based on our knowledge, there is no known technique that has explored the use of a smart cane proposed in this study to detect anomalies in ADL based on ambulation. Ambulatory anomalies were learnt and isolated with the usage of isolation forest and one-class SVM. Falls are easily and naturally detected with the cane. Different modes of alert (soft and strong) for the intervention system are proposed to forestall and limit the possibility of a type 2 error.

8.1. Limitations of the Proposed Approach

Although a cane or walking stick has been used as an assistive device to aid ambulating, especially in the elderly and disabled, this approach is prone to type 2 errors, especially if the fundamental aim is for it to be used as a fall detector; most cane or walking stick users tend to lay the their cane down horizontally when not in use, which might be seen and reported as a fall by the gyroscope.

8.2. Prospects for Future Research

A gyroscope is used in this research basically to measure orientation, which indicates the orientation of the stick; thus, an intermediate sensor can also be embedded to imitate the gyroscope in differentiating between when the cane is asleep or when an accidental fall occurs, which will help in reducing type 2 errors.

Author Contributions

S.A. conceptualize this research and wrote the manuscripts, M.O.A. and O.O. reviewed the final manuscript. All authors have read and agreed to the published version of the manuscript.

Funding

This research received no external funding.

Institutional Review Board Statement

Not applicable.

Informed Consent Statement

Not applicable.

Data Availability Statement

This study does not report any external data.

Acknowledgments

This work was supported by Novin, No 7 Rue Pablo Piccaso Siant-etinne, France, they provided the hardware (Walking Cane) used in this reseach and also made available thier laboratory for reseach.

Conflicts of Interest

The authors declare no conflict of interest.

References

  1. World Population Ageing; Technical Report; UN World Health Organization: Geneva, Switzerland, 2013; Volume 374, pp. 1–95.
  2. Medical News Today. Available online: https://www.medicalnewstoday.com/articles/320481.php (accessed on 10 October 2017).
  3. Nutt, J.G.; Marsden, C.D.; Thompson, P.D. Human walking and higher-level Gait disorders, particularly in the elderly. Neurology 1993, 43, 268–279. [Google Scholar] [CrossRef]
  4. Zolfaghari, S.; Keyvanpour, M.R. Smart Activity Recognition Framework in Ambient Assisted Living. In Proceedings of the 2016 Federated Conference on Computer Science and Information Systems, Gdansk, Poland, 11–14 September 2016. [Google Scholar] [CrossRef] [Green Version]
  5. Luo, J.; Tang, J.; Xiao, X. Abnormal Gait Behavior Detection for Elderly Based on Enhanced Wigner-Ville Analysis and Cloud Incremental SVM Learning. J. Sens. 2016, 2016, 5869238. [Google Scholar] [CrossRef] [Green Version]
  6. Sagawa, K.; Ishihara, T.; Ina, A.; Inooka, H. Classification of human moving patterns using air pressure and acceleration. Industrial Electronics Society, 1998. In Proceedings of the IECON ’98, 24th Annual Conference of the IEEE, Aachen, Germany, 31 August–4 September 1998; Volume 2, pp. 1214–1219. [Google Scholar]
  7. Yang, J.-Y.; Wang, J.-S.; Chen, Y.-P. Using acceleration measurements for activity recognition: An effective learning algorithm for constructing neural classifiers. Pattern Recognit. Lett. 2008, 29, 2213–2220. [Google Scholar] [CrossRef]
  8. Cheng, J.; Amft, O.; Lukowicz, P. Active Capacitive Sensing: Exploring a New Wearable Sensing Modality for Activity Recognition. In Proceedings of the International Conference on Pervasive Computing, Helsinki, Finland, 17–20 May 2010. [Google Scholar]
  9. Medrano, C.; Igual, R.; Plaza, I.; Castro, M. Detecting Falls as Novelties in Acceleration Patterns Acquired with Smartphones. PLoS ONE 2014, 9, e94811. [Google Scholar] [CrossRef] [Green Version]
  10. Mubashir, M.; Shao, L.; Seed, L. A survey on fall detection: Principles and approaches. Neurocomputing 2013, 100, 144–152. [Google Scholar] [CrossRef]
  11. Noury, N.; Herd, T.; Rialle, V.; Virone, G.; Mercier, E.; Morey, G.; Moro, A.; Porcheron, T. Monitoring Behaviour in Home Using a Smart Fall Sensor and Position Sensors. In Proceedings of the 1st Annual International Conference On Micro Technologies in Medicine and Biology, Lyon, France, 12–14 October 2000; pp. 607–610. [Google Scholar]
  12. Moschetti, A.; Fiorini, L.; Esposito, D. Toward an Unsupervised Approach for Daily Gesture Recognition in Assisted Living Applications. IEEE Sens. J. 2017, 17, 8395–8403. [Google Scholar] [CrossRef]
  13. Naranjo-Hernández, D.; Roa, L.M.; Reina-Tosina, J.; Estudillo-Valderrama, M.A. SoM: A smart sensor for human activitymonitoring and assisted healthy ageing. IEEE Trans. Onbiomedical Eng. 2012, 59, 3177–3184. [Google Scholar] [CrossRef]
  14. Pogorelc, B.; Bosnić, Z.; Gams, M. Automatic recognition of gait-related health problems in the elderly using machine learning. Multimed. Tools Appl. 2012, 58, 333–354. [Google Scholar] [CrossRef] [Green Version]
  15. Palmerini, L.; Bagalà, F.; Zanetti, A.; Klenk, J.; Becker, C.; Cappello, A. A wavelet-based approach to fall detection. Sensors 2015, 15, 11575–11586. [Google Scholar] [CrossRef]
  16. Xiang, T.; Gong, S. Incremental and adaptive abnormal behaviour detection. Comput. Vis. Image Underst. 2008, 111, 59–73. [Google Scholar] [CrossRef] [Green Version]
  17. Zhang, D.; Peng, H.; Haibin, Y.; Lu, Y. Crowd abnormal behavior detection based on machine learning. Inf. Technol. J. 2013, 12, 1199–1205. [Google Scholar] [CrossRef] [Green Version]
  18. Bauckhage, C.; Tsotsos, J.K.; Bunn, F.E. Automatic detection of abnormal gait. Image Vis. Comput. 2009, 27, 108–115. [Google Scholar] [CrossRef]
  19. Khan, Z.A.; Sohn, W. Abnormal human activity recognition system based on R-transform and kernel discriminant tech-nique for elderly home care. IEEE Trans. Consum. Electron. 2011, 57, 1843–1850. [Google Scholar] [CrossRef]
  20. Ma, X.; Wang, H.; Xue, B.; Zhou, M.; Ji, B.; Li, Y. Depthbased human fall detection via shape features and improved extreme learning machine. IEEE J. Biomed. Health Inform. 2014, 18, 1915–1922. [Google Scholar] [CrossRef]
  21. What Is Tremor? Available online: https://www.medicinenet.com/tremor/article.htm (accessed on 21 November 2017).
Figure 1. Image showing the block diagram of our approach.
Biomedinformatics 02 00033 g001
Figure 2. Image shows the cane with attached device.
Biomedinformatics 02 00033 g002
Figure 3. Image shows (a) raw signal before low-pass filtering and (b) signal after filtering.
Biomedinformatics 02 00033 g003
Figure 4. Behavior detection with LDA.
Biomedinformatics 02 00033 g004
Figure 5. Anomaly detection with I-forest (anomaly in white).
Biomedinformatics 02 00033 g005
Figure 6. Shows I-forest with new test data (anomaly in white).
Biomedinformatics 02 00033 g006
Figure 7. Anomaly detection with one-class SVM (anomaly in white).
Biomedinformatics 02 00033 g007
Figure 8. Shows one-class SVM with new test data (anomaly in white).
Biomedinformatics 02 00033 g008
Table 1. Recognition Accuracy for all investigated methods with Linear Discriminant Analysis.
Category DescriptionRecognition Accuracy (%)Algorithm
Irregular Arm SwingArm movements lacking continuity of occurrence 89.9 LDA
Resting In a relax state 97.6 LDA
Vibrating Arm Arm shaking vigorously 97.8 LDA
Exhausted Tired 98.1 LDA
Normal Walking Expected state of Walking 99.7 LDA
Slow Walking Less than expected state of walking
(An average person has a step of approximately 2.1 to 2.5 feet. Therefore, it takes approximately 2200 steps to walk one mile, also it takes 15 to 20 min to accomplish for an average individual according to the Centers of Disease Control and Prevention)
99.6 LDA
Table 2. Shows anomaly data point using Isolated Forest. The model catches 3% of the anomaly data points, according to its 3% recall values.
Activity Data PrecisionRecallF1-Score
Vibrating Arm 0 0.98 0.98 0.98
1 0.03 0.03 0.02
Accuracy 0.97
Micro Avg 0.89 0.89 0.89 0.99
Weighted Avg 0.96 0.95 0.97 0.97
Table 3. Shows anomaly data point using one-class SVM. The model catches 12% of the anomaly data points, according to its 12% recall values.
Activity Data PrecisionRecallF1-Score
Vibrating Arm 0 0.9 0.98 0.98
1 0.12 0.12 0.12
Accuracy 0.98
Micro Avg 0.88 0.89 0.89 0.99
Weighted Avg 0.98 0.99 0.98 0.97
Table 4. Comparison results of different methods for activity classification.
ActivityWagner Analysis [5]Noury et al. [11] Alessandra Moschetti et al. [12] Smart Cane Method
Normal Walking 100% 91% 90% 99.7%
Slow Walking Not Evaluated Not Evaluated Not Evaluated 99.6%
Exhausted Not Evaluated Not Evaluated Not Evaluated 98.1%
Vibrating Arm Not Evaluated Not Evaluated Not Evaluated 97.8%
Resting 91.6% 91.2% 87.8% 97.6%
Irregular Arm Swing Not Evaluated Not Evaluated Not Evaluated 89.9%
Publisher’s Note: MDPI stays neutral with regard to jurisdictional claims in published maps and institutional affiliations.