Article

Double Complex Salt [Co(NH3)6][Fe(CN)6] Plasma Treatment

1
Tananaev Institute of Chemistry—Subdivision of the Federal Research Centre «Kola Science Centre of the Russian Academy of Sciences» (ICT KSC RAS), Akademgorodok, 26a, Apatity 184209, Russia
2
A.V. Topchiev Institute of Petrochemical Synthesis, RAS, Leninsky Prospect, 29, Moscow 119991, Russia
*
Author to whom correspondence should be addressed.
Thermo 2025, 5(3), 36; https://doi.org/10.3390/thermo5030036
Submission received: 20 August 2025 / Revised: 16 September 2025 / Accepted: 18 September 2025 / Published: 22 September 2025
(This article belongs to the Topic Clean Energy Technologies and Assessment, 2nd Edition)

Abstract

The method of obtaining functional materials almost always influences the physicochemical properties of the resulting substances. The plasma treatment of solid materials is considered to be a more energy efficient method when compared with thermal destruction. Our work is the first to treat double complex salt (DCS) [Co(NH3)6][Fe(CN)6] with different plasma discharge modes. We have demonstrated the possibility of obtaining a single-phase spinel with a CoFe2O4 structure as a result of the calcination in air of the plasma destruction product. The crystallite sizes of the obtained spinel are 40 nm, with a lattice constant 8.38 Å.

1. Introduction

Double complex salt (DCS) [Co(NH3)6][Fe(CN)6] is formed by two complexing metals—cobalt (Co) and iron (Fe), with the complex cation and anion consisting of separate island complexes inside the DCS molecule [1,2]. Both the complex precursors and the DCS have simple and reproducible synthesis methods with quantitative yields. This makes DCS promising as a starting compound for various methods of obtaining functional materials.
DCS that contain Fe and/or Co are highly relevant in modern materials science. For example, DCS containing Fe and Co are discussed in [3,4]. The decomposition of DCS [Pt(NH3)5Cl][Me(C2O4)3]…nH2O, where Me includes Fe and Co, is discussed in [3]. Mixed ligand complexes with metal ions Co(II) and Fe(III)) of the type [ML1L2] (where L1 = indoline-2,3-dione and L2 = naphthalene-1,2-dione) were synthesized and characterized using a number of methods in [4].
Environmental applications of DCS for pollutant gas removal are proposed in [5], where the general formula is [Co1−3(LH)2], in which (LH2) is the vic-dioxime ligand. The authors of [6] report the synthesis, structure and characteristics of novel supramolecular salts with 1,10-phenanthroline 3D metal cations and similar malatostannate/germanate (IV) anions and 1,10-phenanthroline cations including Fe(II) and Co(II). Fe- and Co-containing DCS are observed in [7].
The compound [Co(NH3)6][Fe(CN)6] is well known [8]. The works [9,10,11,12,13] describe the physical and chemical properties and promising application areas of this DCS. Obtaining functional materials by DCS thermal decomposition has been proposed, whereby the ligands are removed completely and in a way that is almost completely harmless.
Catalysts containing Co and Fe are also highly required in different application areas. For example, in [14], a Fe-Co dual single-atom catalyst was prepared by one-step molten-salt-assisted high-temperature pyrolysis. Similar Fe-Co dual single-atom catalysts were prepared in [15] according to the following strategy: a porous carbon matrix with Fe-Co diatomic sites was synthesized by a co-adsorption-pyrolysis. Ref. [16] reports a Fe-Co catalyst that is active at very low temperatures (−73 °C) and that is suitable for CO removal.
In recent years, a transition from micro-sized to nano-sized catalysts has emerged in catalysis. Currently, there are many methods for synthesizing nanoparticles (NPs) consisting of atoms of only one type of metal [17,18]. The transition to the synthesis of two- and multi-component particles is associated with a number of difficulties associated with the need to maintain the required ratio of components and their distribution throughout the volume of particles. DCS of the [M′L′][M′′L′′] type, where M′ and M′′ are complexing metals and L′ and L′′ are ligands, are promising precursors in the synthesis of bimetallic NPs.
The metal atoms in the initial complex are mixed at the molecular level, which facilitates the formation of solid solutions of bimetals during the thermal decomposition of the precursor. Thermolysis temperatures are significantly lower than the melting temperatures of individual metals, which makes this process attractive. It is important to note that the ratio of metals in the resulting NPs is constant and is strictly determined by the stoichiometry of the initial complex salt.
The structure of the obtained NPs is of great importance in terms of their catalytic properties. In particular, many authors note the importance of the spinel-like structures of the active phase for the hydrogenation processes of carbon oxides [19,20]. When obtaining spinel structures by traditional methods—coprecipitation or impregnation with subsequent heat treatment—massive spinel-like structures of various compositions are formed, and some metals pass into a catalytically inactive state. In this regard, the formation of catalytically active spinel-like structures by the method of thermolysis of DCS is of great practical interest.
According to [21,22], thermal decomposition of binary complex compounds is a promising method for obtaining spinels, due to the strict stoichiometry of the DCS. The thermolysis conditions significantly influence the result; in particular, time and temperature determine the phase composition of the resulting material. Achieving a stable phase composition of the DCS thermolysis product is an urgent task when obtaining catalytically active phases. Plasma–chemical decomposition of DCS is a novel alternative method for this. We could not find any studies on the treatment of DCS using plasma discharge so this type of DCS processing is reported here for the first time.
The use of additional methods for DCS precursor processing (low-temperature plasma processing) can also contribute to a better yield of the target product with improved characteristics. Plasma is a partially ionized gas containing electrons, ions, molecules, radicals and other excited particles. All of the reactive plasma species can actively participate in the synthesis and modification of inorganic materials [23]. Plasma can be used to synthesize some compounds that cannot be easily obtained by traditional methods [24] and enables reactions that are thermodynamically difficult under normal conditions. For example, such compounds as sulfides, nitrides and phosphides are usually obtained at high temperatures, but they can be synthesized under mild conditions with the participation of plasma [25]. Plasma synthesis increases the stability, dispersion, and purity of metal-containing NPs and significantly reduces the synthesis time [26]. A successful plasma synthesis of CoFe2O4 spinels has been reported [27]. Furthermore, plasma is a versatile and convenient tool for reduction, oxidation, doping, etching, coating, processing, and surface cleaning [28].
Spinels with the composition CoFe2O4 are widely applied [29,30]. They can serve as semiconductor photocatalysts due to ferromagnetic behavior [31], as supercapacitors [32] or as high temperature gas sensor [33].
The CoFe2O4 structure can be obtained by a variety of methods, such as the following: ceramic [34], hydrothermal [35,36] or solvothermal [37] synthesis; sol-gel [38,39,40]; hydroxide coprecipitation [29,39,41,42]; the microemulsion method [39]; microwave treatment [40,43,44]; the thermal decomposition of complexes [39,45]; and gel burning [42,46]. The methods listed above either require long-term high-temperature processing, high energy costs, or expensive equipment. Furthermore, almost all of these mentioned methods pollute the environment with salt decomposition products [47].
The production of a solid product with the spinel structure CoFe2O4 by thermal decomposition of [Co(NH3)6][Fe(CN)6] is free from these disadvantages, as the target product is obtained at relatively low thermolysis temperatures [48,49,50]. Variations in the coordinated ligands change the surface structure of the thermolysis products and the size of the resulting particles [49,51]. For example, the use of urea as one of the reagents in the synthesis of spinels is very convenient [49,52,53,54] as it decomposes at low temperatures. In an air atmosphere, urea decomposes from 152 °C [55], while in a nitrogen environment it decomposes from 158 °C [56]. A large volume of gaseous non-toxic products release at this range, meaning that there is no contamination of the products.
Obtaining a single-phase target product with the CoFe2O4 structure is an important technological task. This work applies a complex of physical and chemical processes to solve the problem. The complex includes plasma treatment of DCS [Co(NH3)6][Fe(CN)6] followed by thermal treatment (thermolysis) under various conditions. Thermal treatment after plasma is due to the need to obtain a single-phase target product with a CoFe spinel structure.
The main objective of our work is to study the effect of plasma treatment of DCS [Co(NH3)6][Fe(CN)6] on the composition and properties of solid thermolysis products.

2. Materials and Methods

2.1. Obtaining DCS

The salt [Co(NH3)6]Cl3 was purchased from Vekton, Russia, Saint Petersburg and the salt K3[Fe(CN)6] was obtained from NevaReaktiv, Russia, Saint Petersburg. DCS was obtained by mixing stoichiometric amounts of solutions [Co(NH3)6]Cl3 and K3[Fe(CN)6. This article will only consider the DCS with the composition [Co(NH3)6][Fe(CN)6], thus we will later refer to it as ‘DCS.’

2.2. Treatment of DCS with Plasma

The DCS plasma processing was carried out in a dielectric barrier discharge (DBD) installation with planar electrodes (Figure 1). The configuration of the reactor with planar electrodes was chosen as it is more suitable for the treatment of the solid materials. The DCS powder can be distributed and treated more uniformly on the surface of the plate and thus be more efficiently decomposed. In each experiment, 300 to 500 mg of DCS were placed in the reactor.
The reactor consisted of two parallel electrodes (steel plates) made of stainless steel with a diameter of 50 mm. Two quartz plates (100 × 100 × 2 mm) placed between the electrodes served as a dielectric barrier. The distance between the plates was 3.5 mm and the discharge gap was 7.5 mm. Cylindrical aluminum radiators 50 mm in diameter and 55 mm high dissipated the generated heat. A 500 mg DCS was placed between quartz plates. Argon from a cylinder (99.9999%, ITC Promekservis, Russia, Moscow) was supplied between the quartz plates using an RRG-20 regulator (Eltochpribor, Russia, Moscow, 2023). The Ar flow rate was 70 mL/min. The whole set-up was placed under a glass dome (Figure 1b) to ensure the Ar flow did not mix with the air. The high voltage power supply generated a sine wave signal with a frequency of 23 kHz. The registration of current and voltage signals, as well as Lissajous curves, was carried out using a TDS 2012B oscilloscope (Tektronix, USA, Beaverton, OR, 2010). Based on the area of the Lissajous curves, the absorbed plasma power was calculated using the following equation:
P = f W = f C n A
where Cn is the capacitance of the capacitor connected in series with the reactor, f is the frequency of the applied voltage, and A is the area of the Lissajous curve.
The DCS was processed from 10 to 30 min in a periodic mode at different discharge powers. The sample was mixed between the processing steps. Each experiment was conducted three times. The paper contains averaged values.
The temperature of the plasma catalytic reaction zone was measured in a tubular DBD reactor using MLG 225 Laborant optical pyrometer (Metrologica LLC, Russia, Moscow, 2015). The glass dome of the DBD reactor did not allow one to estimate the temperature near the reaction zone so a different reactor configuration was chosen to accomplish the temperature measurement. Figure 2 presents the DBD reactor. The reactor comprised a quartz tube (25 mm outer diameter, 2 mm wall thickness, 160 mm length) serving as the dielectric barrier. A steel rod (8 mm diameter) with the threading functioning as the ground electrode inside the reactor, while a steel mesh (0.5 mm mesh size, 80 mm length) wrapped around the outside wall acted as the high-voltage electrode. The discharge gap was 8.5 mm. A DCS sample was placed within the reactor and fixed with ceramic wool (Al2O3 + SiO2 > 97%, BERD LLC, Khimki, Russia).

2.3. Research Methods

IR spectra were recorded on a Nicolet 6700 FT-IR spectrometer (Thermo Fisher Scientific Inc., Hillsboro, OR, USA, 2010) in the 4000–400 cm−1 range (KBr tablets).
X-ray phase analysis was performed for the products of DCS thermal decomposition. For each sample the analysis was undertaken twice in the range of 5–90° on a Shimadzu XRD 6000 powder diffractometer (Kyoto, Japan, 2008) equipped with a Cu-Ka source (λ = 1.5418 Å) and graphite monochromator for the diffracted beam. Recording mode was undertaken with a step of 0.1° and an exposure of 3 s. Qualitative analysis was performed using the powder diffraction database PDF-4 2021 (International Center for Diffraction Data (ICDD), Philadelphia, PA, USA).
Synchronous thermal analysis (STA) was made using HQT-4 Henven (Beijing Henven Experimental Equipment, China, Beijing, 2022). Experiments were performed in an air atmosphere. The heating rate was 10 °C/min and the temperature range was 30–1000 °C. This analysis was carried out in an Al2O3 crucible without a lid. STA included thermogravimetry (TG) and differential scanning calorimetry (DSC) analyses.
Static experiments on thermal decomposition were carried out in a muffle furnace SNOL 6.7/1300 (Snol, Narkūnai, Lithuania, 2004) in the temperature range of 300–1000 °C for 1 h in an Al2O3 crucible. The heating rate was 10 °C/min.
The carbon content of the samples was determined using an ELTRA CS-2000 analyzer (Alpha Resources, LLC, Stevensville, MI, USA, 2004). Plasma treated samples were studied by this method.
CHN elemental analysis was performed on a EuroVector EA3000 (Italy, Pavia, 2008) elemental analyzer at a temperature of up to 1000 °C. Plasma + temperature-treated samples were studied using this method.
Scanning electron microscopy (SEM) images were taken using a Tescan Amber GMH (Brno, Czech Republic, 2021) scanning electron microscope. Images were obtained using an Everhart–Thornley SE detector at ×1000–300,000 magnification and at an accelerating voltage of 1 kV.
The surface of the catalyst samples was studied by X-ray photoelectron spectroscopy (XPS) using a spectrometer EA15 (Prevac, Rogow, Poland 2021). An AlKα X-ray tube (1486.6 eV) served as the source of ionizing radiation. Before loading into the spectrometer, the samples were ground in an agate mortar and applied to a conductive carbon tape. An electron-ion charge compensation system was used to neutralize the sample charge during the experiments. All peaks were calibrated against the C 1s peak at 284.8 eV. The background type was determined according to Shirley, and the deconvolution was performed assuming that the overall peak was a sum of Gaussian curves.

3. Results and Discussion

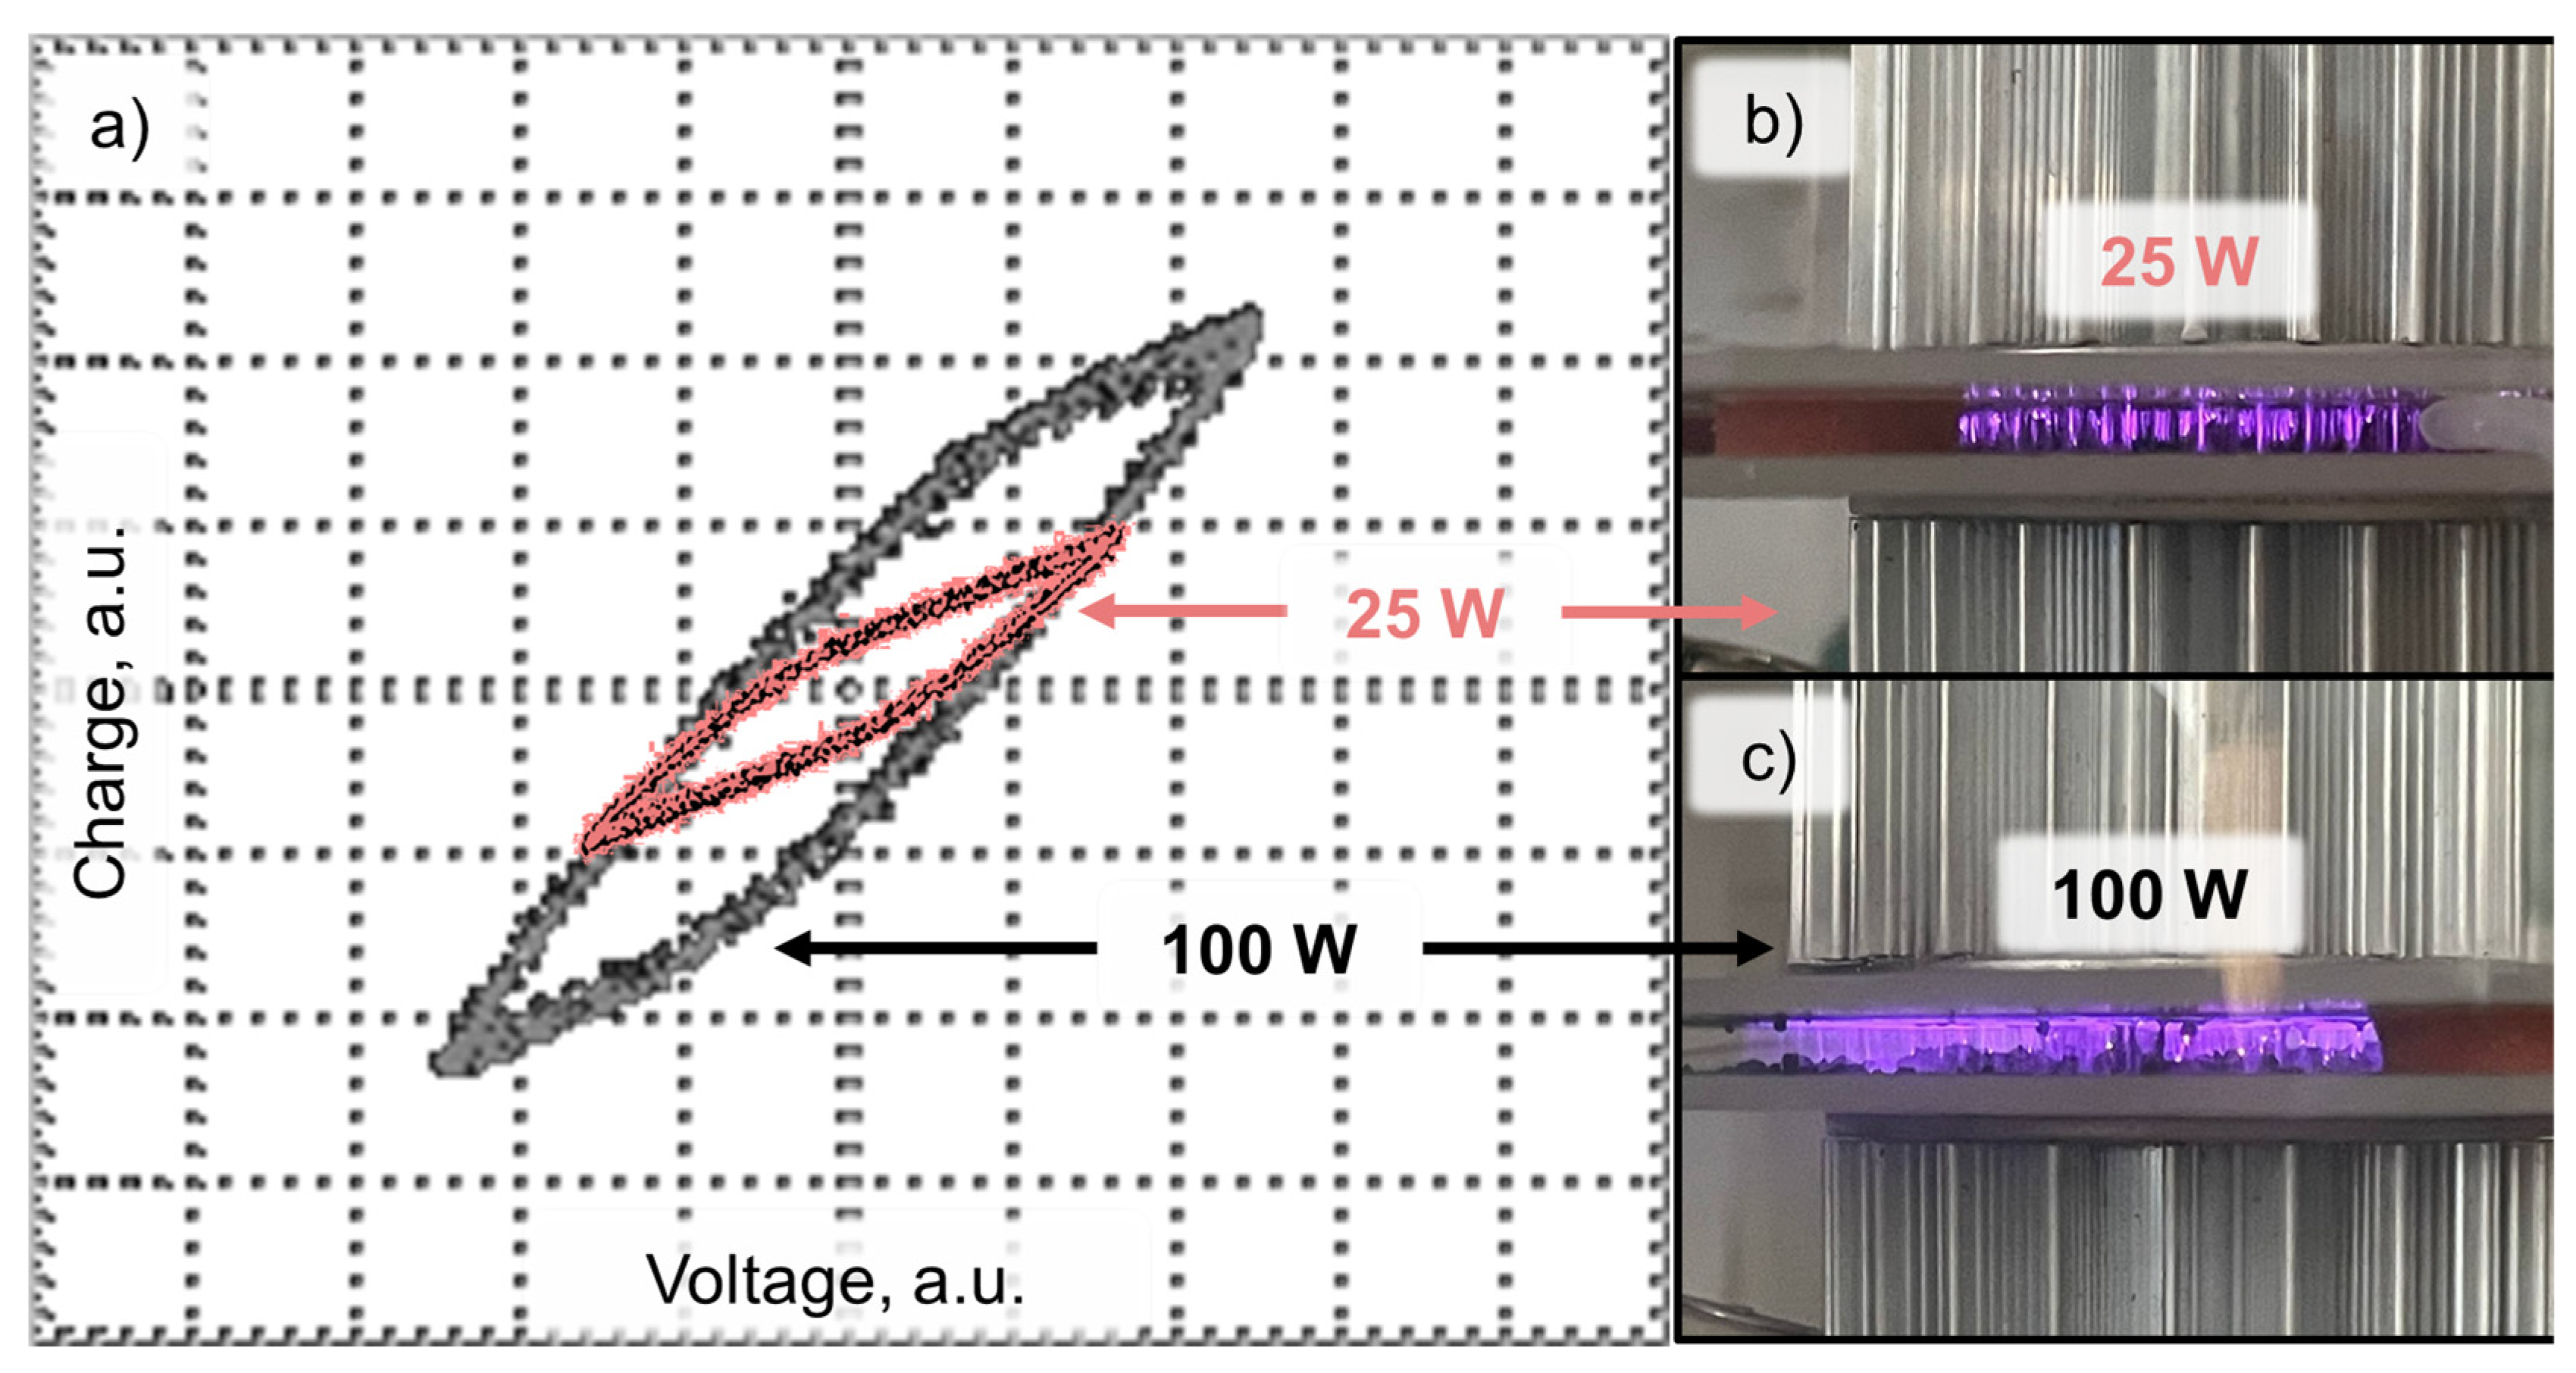
The processing (treatment) of DCS samples in plasma was carried out under various conditions to study the degree of DCS decomposition. Two modes were applied to understand the discharge power influence on the DCS decomposition. Figure 3a shows the Lissajous curves recorded at different discharge power levels. As can be seen, the curve is a parallelogram. This is typical for a barrier discharge [57]. Comparison of Figure 3b,c, shows that the voltage values along the abscissa axis are almost similar in two different modes. The main difference is observed in the magnitude of the charge (stretching of the phenomena observed in Figure 3b,c along the ordinate axis). Increasing the current increases the power and, therefore, increases the number of microdischarges between the electrodes (Figure 3b,c).
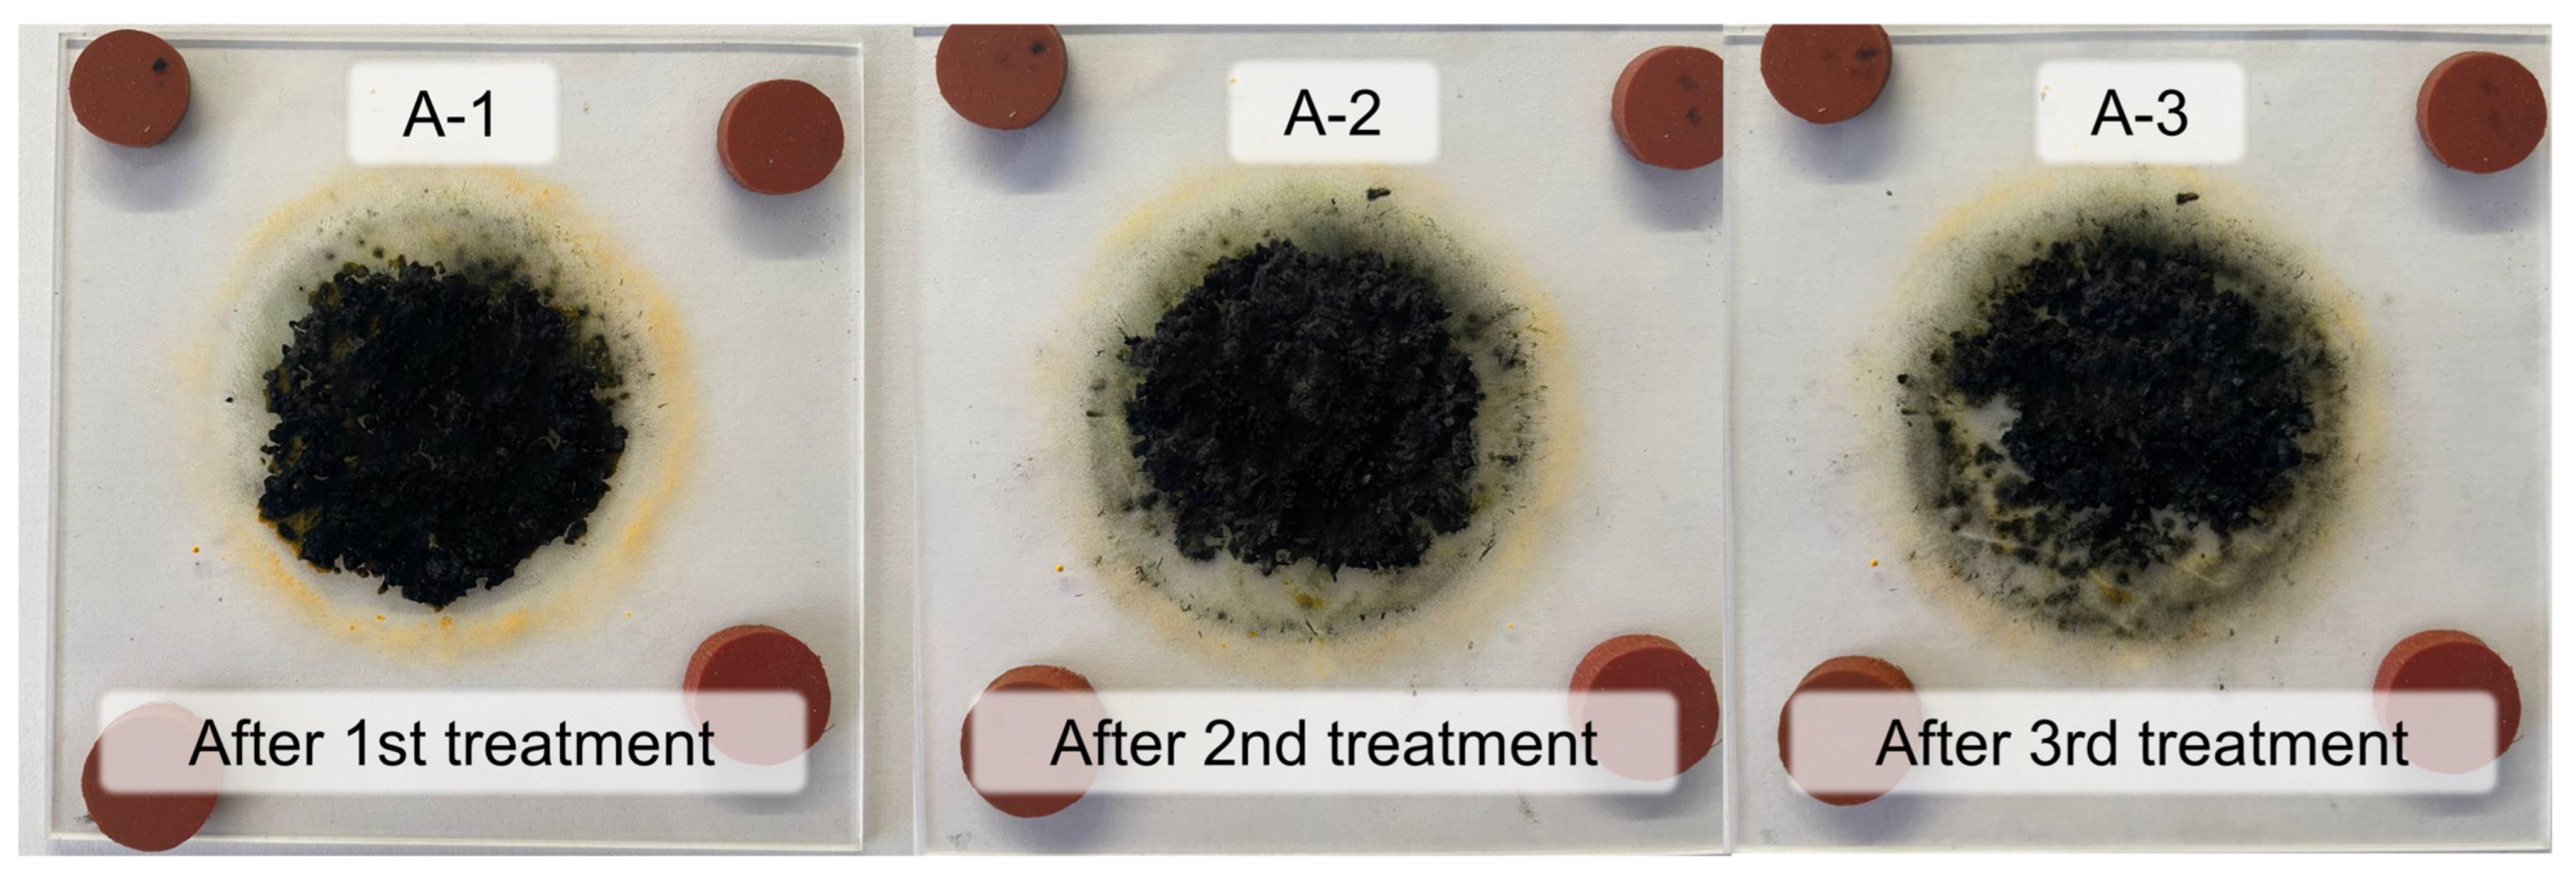
The original orange-colored DCS powder underwent changes after plasma processing (treatment) at a power of 25 W. However, the presence of the original DCS powder on the surface of the lower quartz plate and around the treatment area was visually observed after the first treatment for 10 min, along with the reacting black DCS particles (Figure 4). The obtained mixture was designated as sample A-1 (see Table 1 for the sample designation details). Later, we found that an additional treatment is required to accomplish the DCS decomposition. The amount of the original powder decreased after mixing and treating for a second time (A-2 sample). However, particles of the original DCS powder were present in the product even after the third stage of treatment (A-3 sample). The relative mass of the sample was 61.6 ± 0.4% of the original after the third treatment. The same results were obtained even after increasing the duration of the treatment cycle up to 15 min (A-4 sample). It was then concluded that the input power of 25 W was insufficient to reach the complete decomposition of the parent DCS.
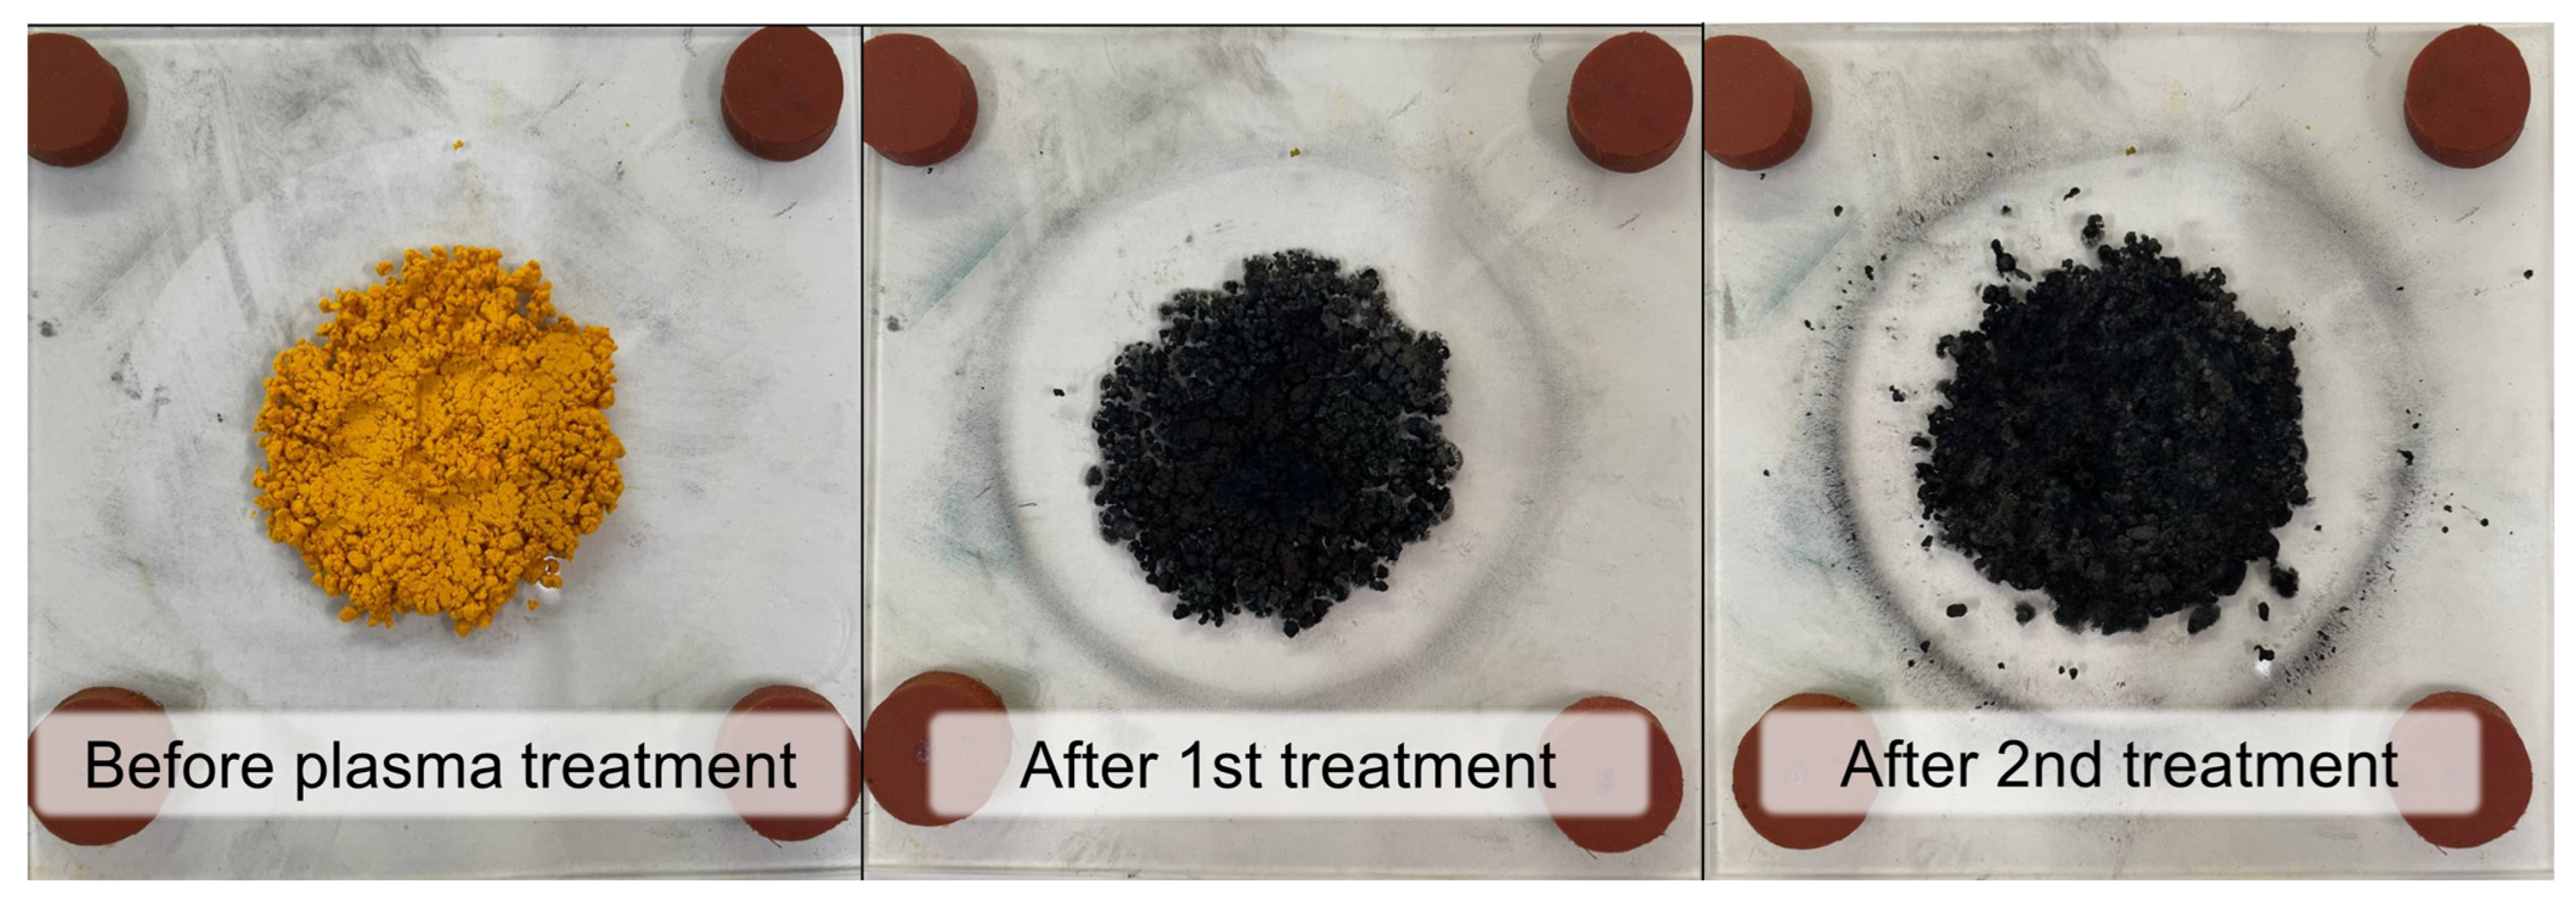
When the power was increased to 100 W, the original orange-colored DCS powder was not observed, and the color of the processed powder became dark gray at the edges with a color transition to dark green in the center of the disk (Figure 5)—sample A-5. The relative mass of the sample was 57.0 ± 0.4% of the initial weight. This indicated incomplete conversion of the DCS in the plasma and the need to conduct the second cycle of the plasma treatment.
The sample mass decreased to 47 ± 0.2% of the original after mixing the sample and reprocessing (re-treating) for 10 min (A-6 sample). The original sample was processed twice to obtain sample A-6, as in Figure 6.
The mass of the sample did not change during the subsequent iteration of mixing and treatment (the third stage of treatment). This indicated the completeness of the treatment after the second cycle at a given power. The samples, which were further analyzed, and their treatment conditions are summarized in Table 1.
When measuring the temperature, the optical pyrometer was aimed at the outer electrode in the area in which the DCS was placed. Figure 7 demonstrates the temperature dependence plot within the reaction time. At the beginning of the plasma treatment (Figure 7a) the DCS sample is stable until the temperature grows rapidly to the value of ~125 °C, and then after ~5 min starts to grow to the value of 230 °C. At this stage, the DCS sample starts to decompose with a combustion-like behavior (Figure 7b). Apparently, the observed effect is related with exothermic stage of the DCS decomposition at ~230 °C.
The paper [58] demonstrates similar behavior at a [Co(NH3)6][Fe(CN)6] thermolysis in an nitrogen flow. Thermal decomposition at ~230 °C is accompanied by intensive release of NH3 and HCN. Gases formed during DCS decomposition are not ionized under plasma treatment conditions.
In Figure 7c, no plasma is generated on the right side of the discharge zone. After these gases were eliminated from the discharge zone, only Ar was present in the reactor and the plasma continued to be generated (Figure 7d). Meanwhile, the temperature decreased to the value of ~125 °C and did not increase further. After the reactor was cooled to room temperature, the second treatment was conducted without any additional manipulations with the DCS sample. Figure 7 demonstrates that, just as in the first treatment, the temperature started to increase rapidly to ~125 °C, but that no exothermic effect was observed. Thus, the steady-state reactor temperature during the plasma treatment was approximately 125 °C, with an increase to 230 °C at the DCS exothermic decomposition stage.
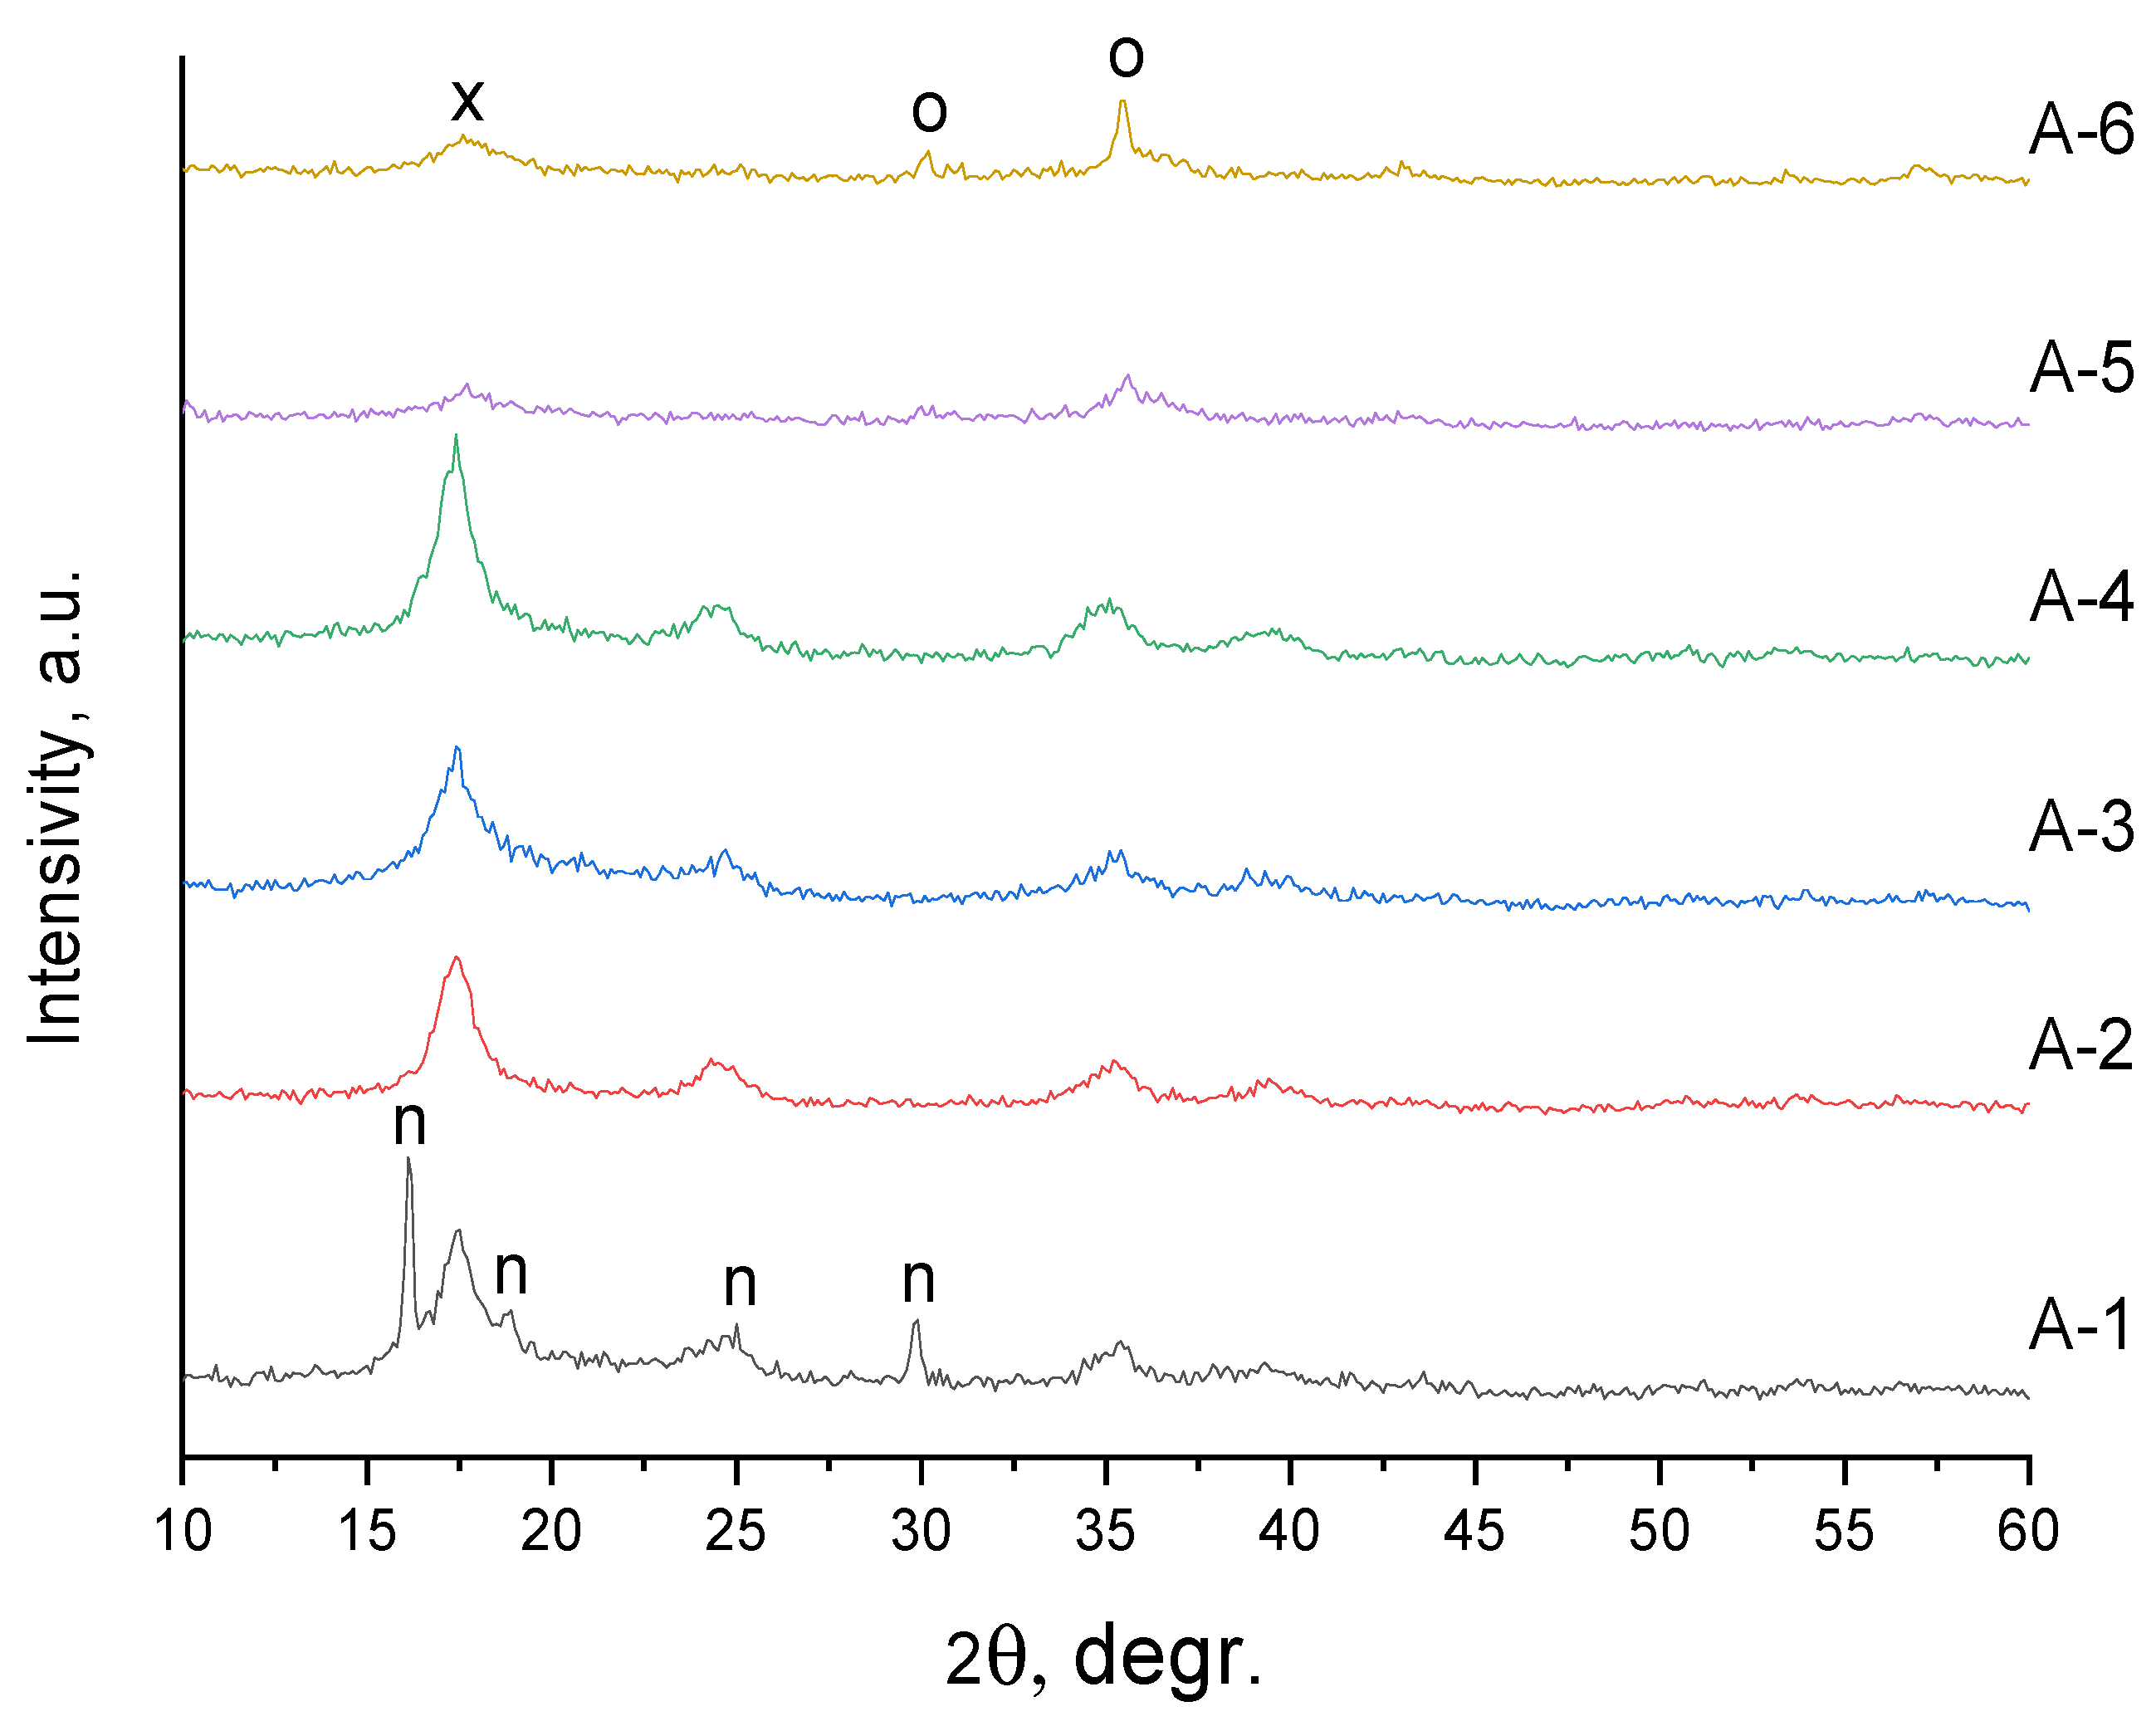
Figure 8 demonstrates XRD patterns of DCS samples after plasma treatment, but before additional thermal decomposition. The basis of sample A-1 is Co(NH3)6·Fe(CN)6 of the rhombohedral modification. For samples A-2–A-4 the basis is a mixture of crystalline hydrate forms of iron and/or cobalt cyanides of cubic modification Fe4[Fe(CN)6]3·14H2O (PDF Card—01-073-0689), Co3[Co(CN)6]2·xH2O (PDF Card—00-022-0215), and Fe0.667Co(CN)4·4H2O (PDF Card—04-013-6956). In samples A-5 and A-6 the cubic structure of magnetite is reliably identified, in which iron atoms are known to be replaced by cobalt (Co0.22Fe0.78)(Co0.98Fe1.02)O3.965 (PDF Card—01-083-6174). The highly broadened reflection at 17.51° (5.061 Å) is probably due to the presence of precursor residues in the form of iron and/or cobalt cyanides.
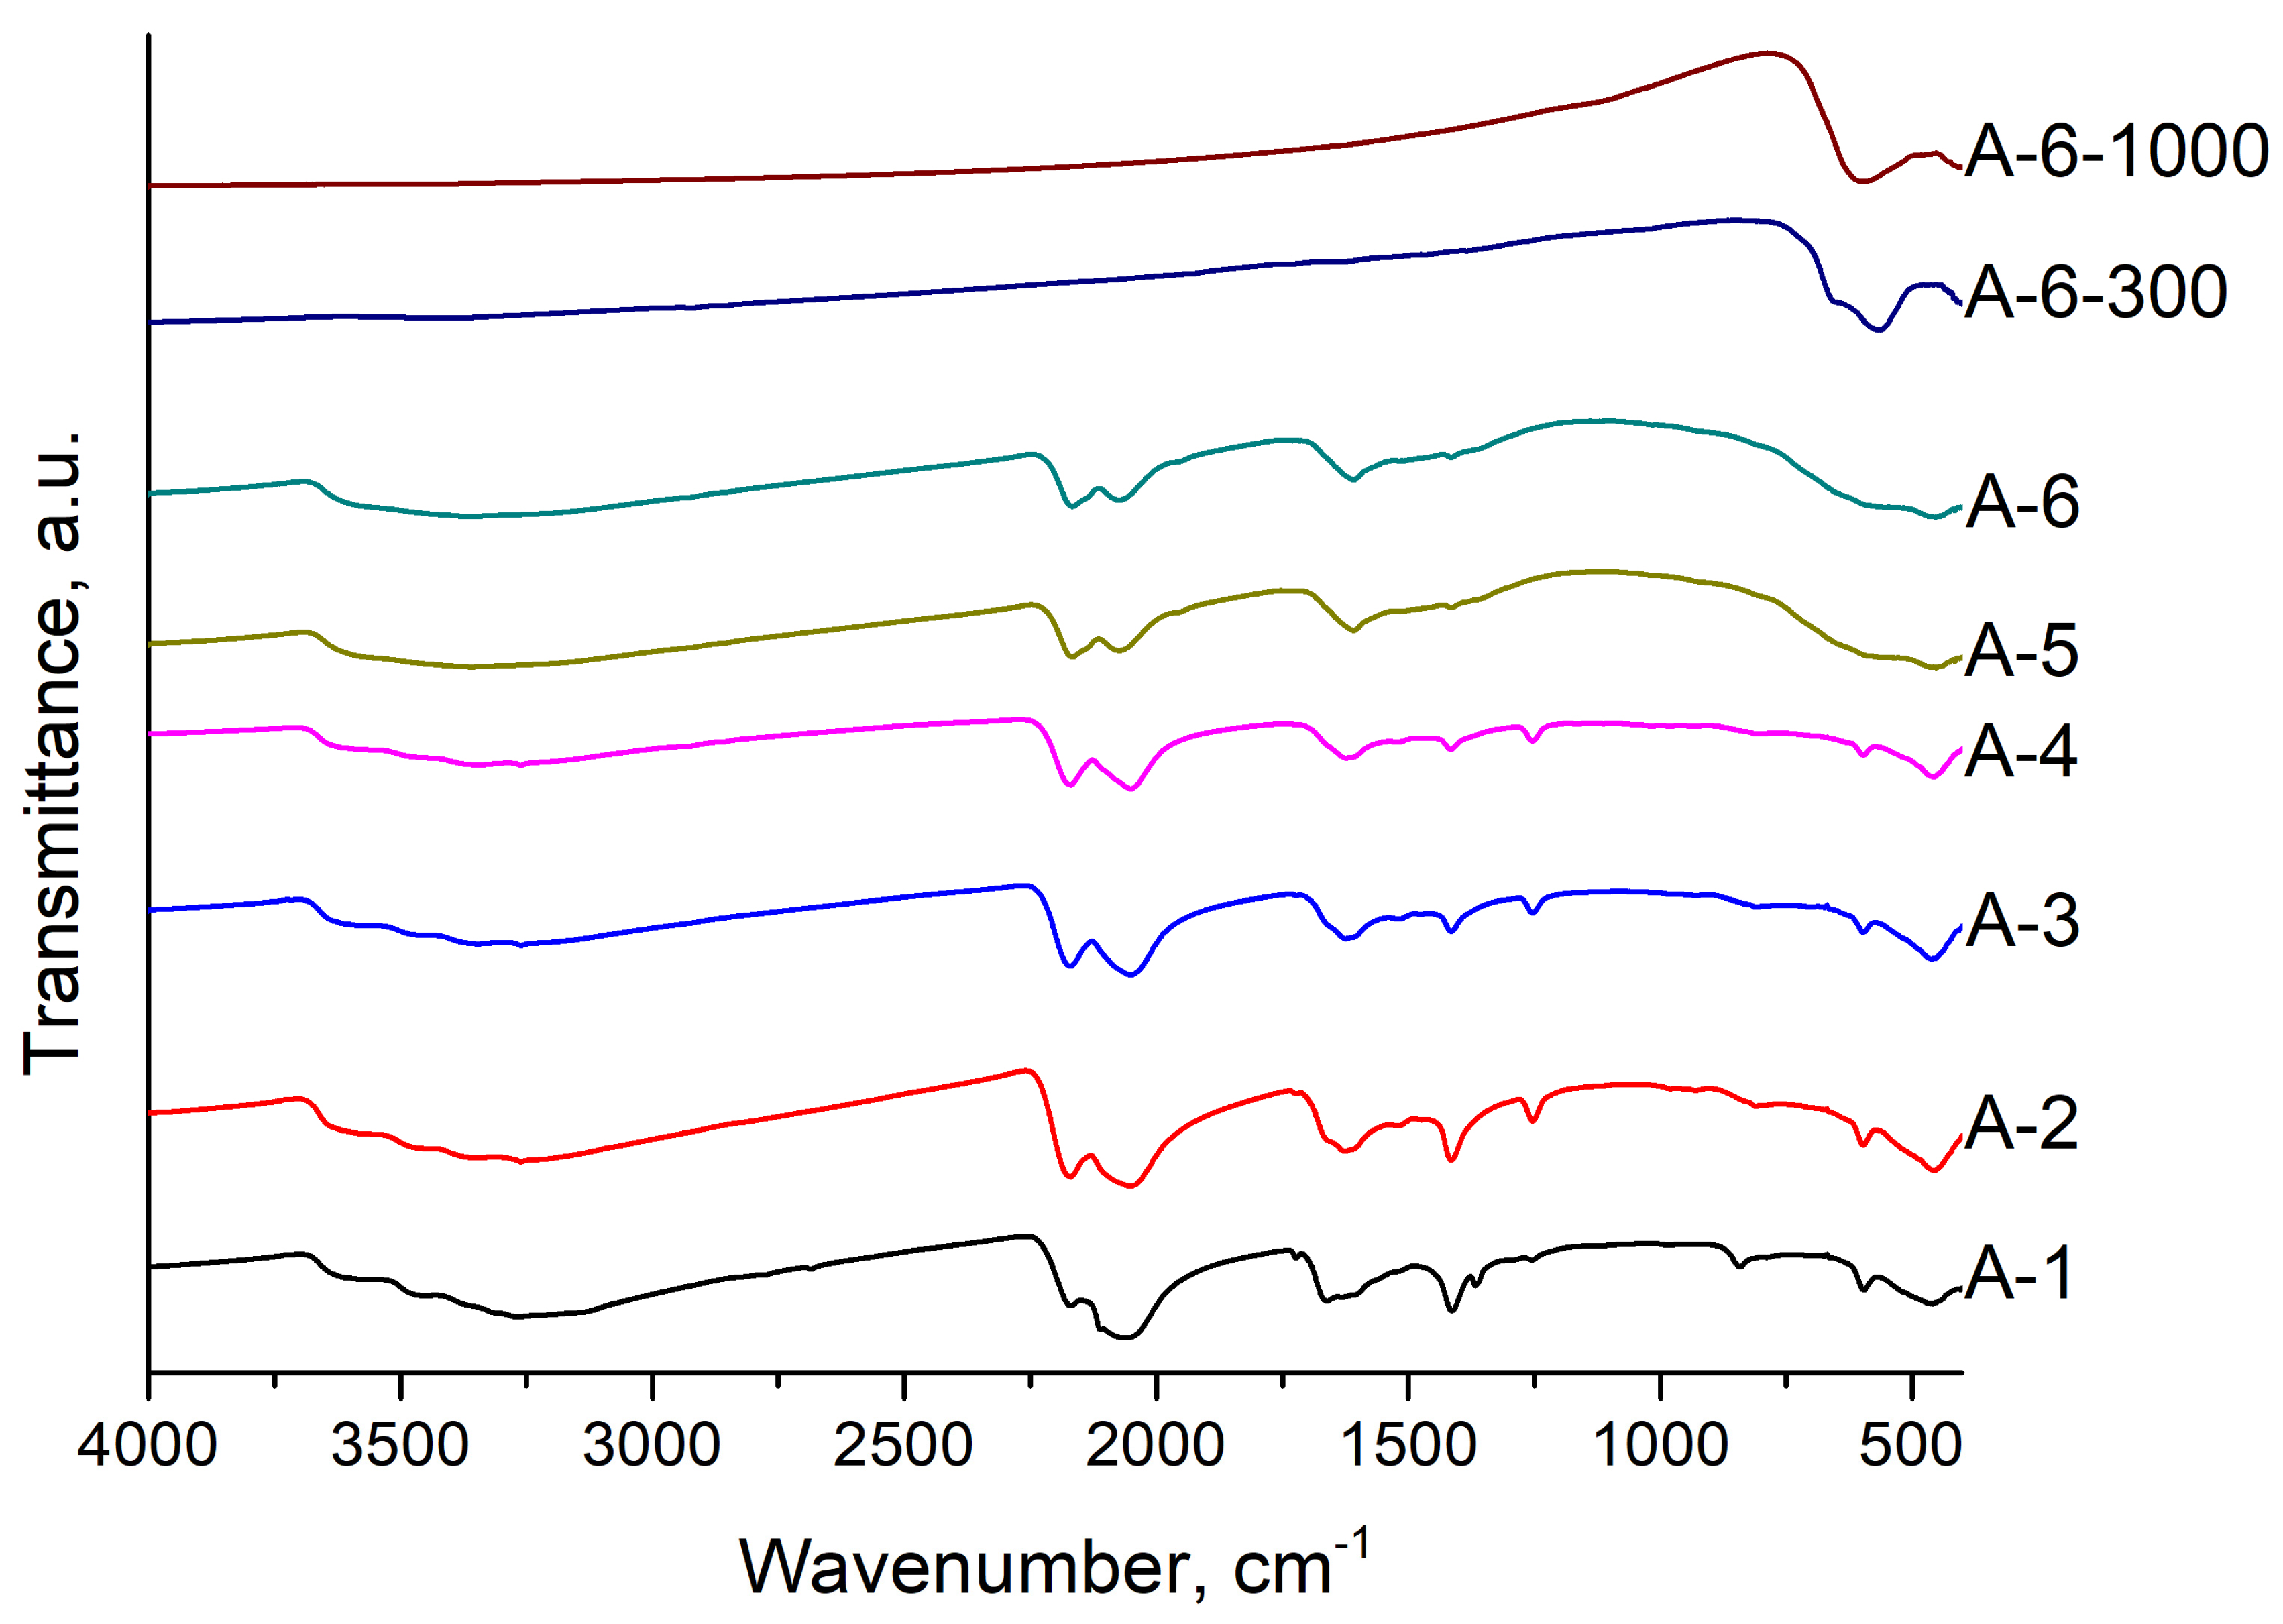
Figure 9 demonstrates IR spectra of DCS samples under different treatment modes.
There is a band at 2114 cm−1 on the IR spectra, which is characteristic of Fe(III)-CN. In samples before the thermal treatment, Fe(III) content is insignificant (inflection at 2138 cm−1) and the main part of the iron is in the form of Fe(II)-CN (2078 cm−1) and bridge Fe (2170 cm−1) [59].
XRD (Figure 8) and IR (Figure 9) data revealed that the A-6 sample is the most optimal one due to it having the lowest ferrocyanide content and the greatest (Co0.22Fe0.78)(Co0.98Fe1.02)O3.965 content (the sharpest and narrowest peaks on the XRD pattern, respectively). Thus, we selected A-6 for further study of the processes occurring during thermolysis of DCS after plasma treatment. The optimal mode for plasma treatment of the DCS is as follows: a power of 100 W and a two-fold treatment for 10 min.
Elemental analysis showed the carbon content in A-6 at the level of 8.2 wt%, while the content in the untreated initial DCS was 19.3 wt%. Thus, during the plasma treatment, at least 2/3 of the coordinated carbon was removed.
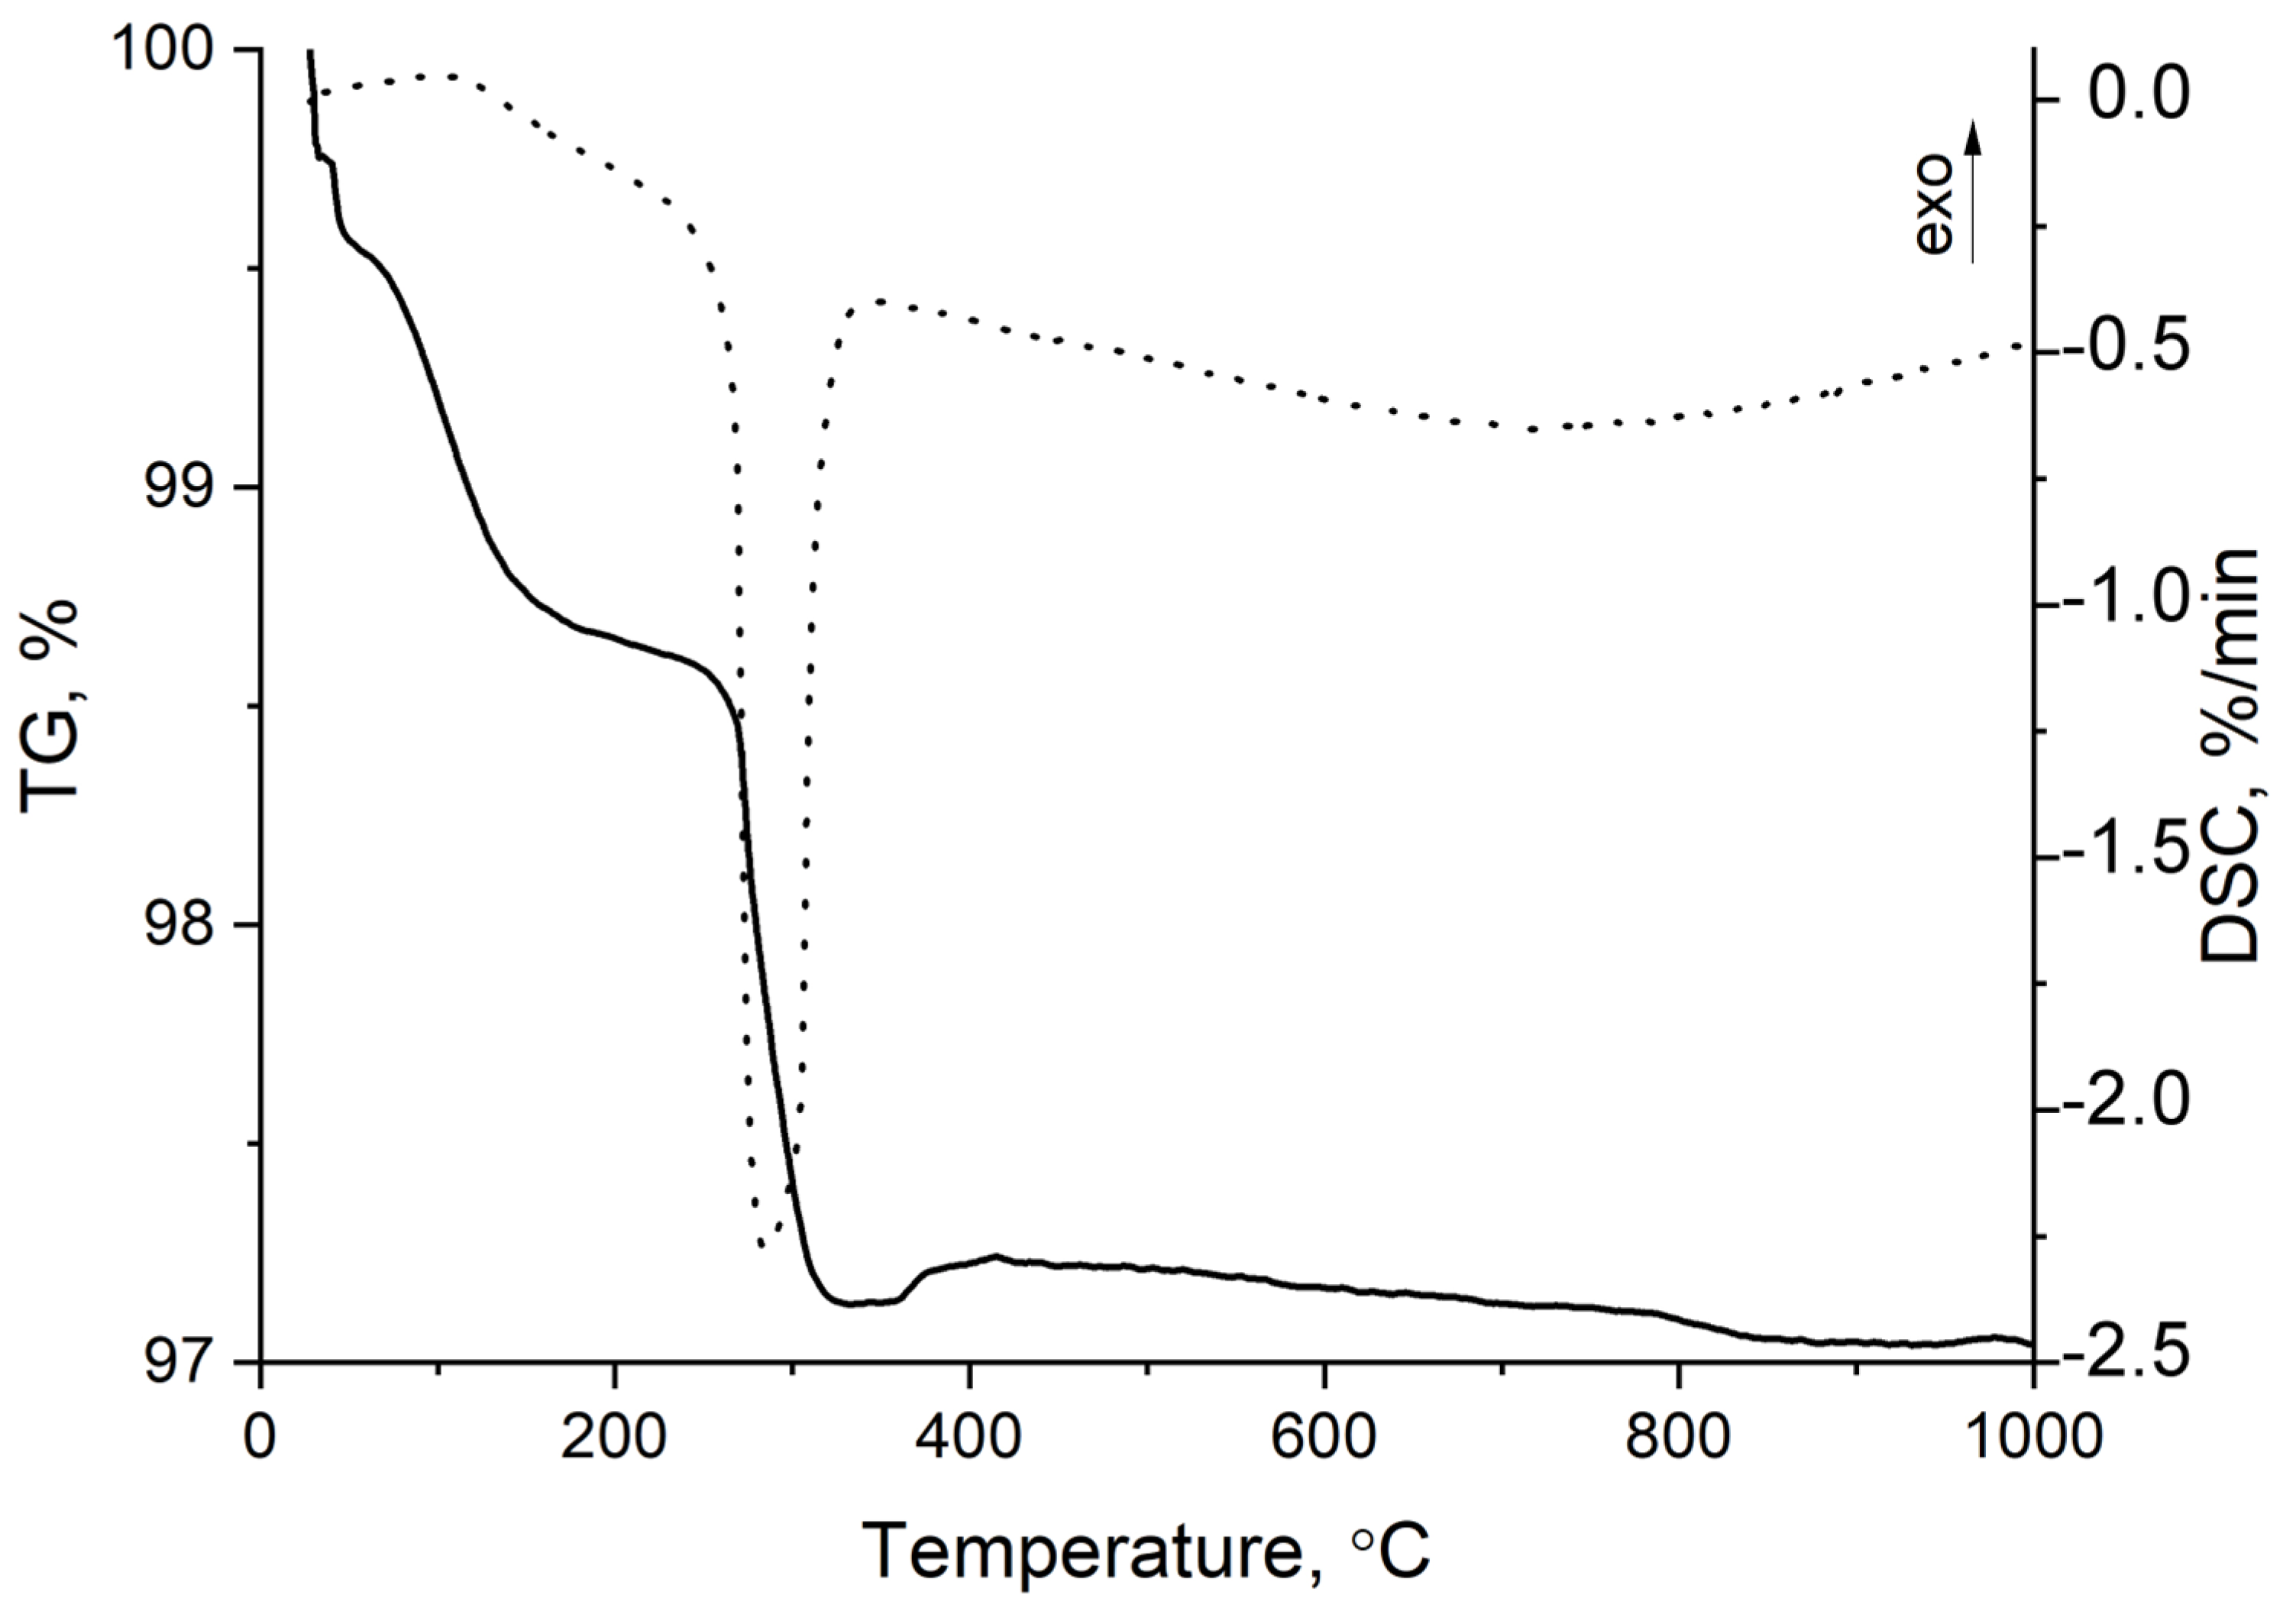
The graph (Figure 10) demonstrates curves of STA in air for DCS sample A-6 after plasma treatment. A sharp peak of weight loss on the TG is observed in the range of 250–300 °C, accompanied by a sharp exoeffect on the on the DSC curve.
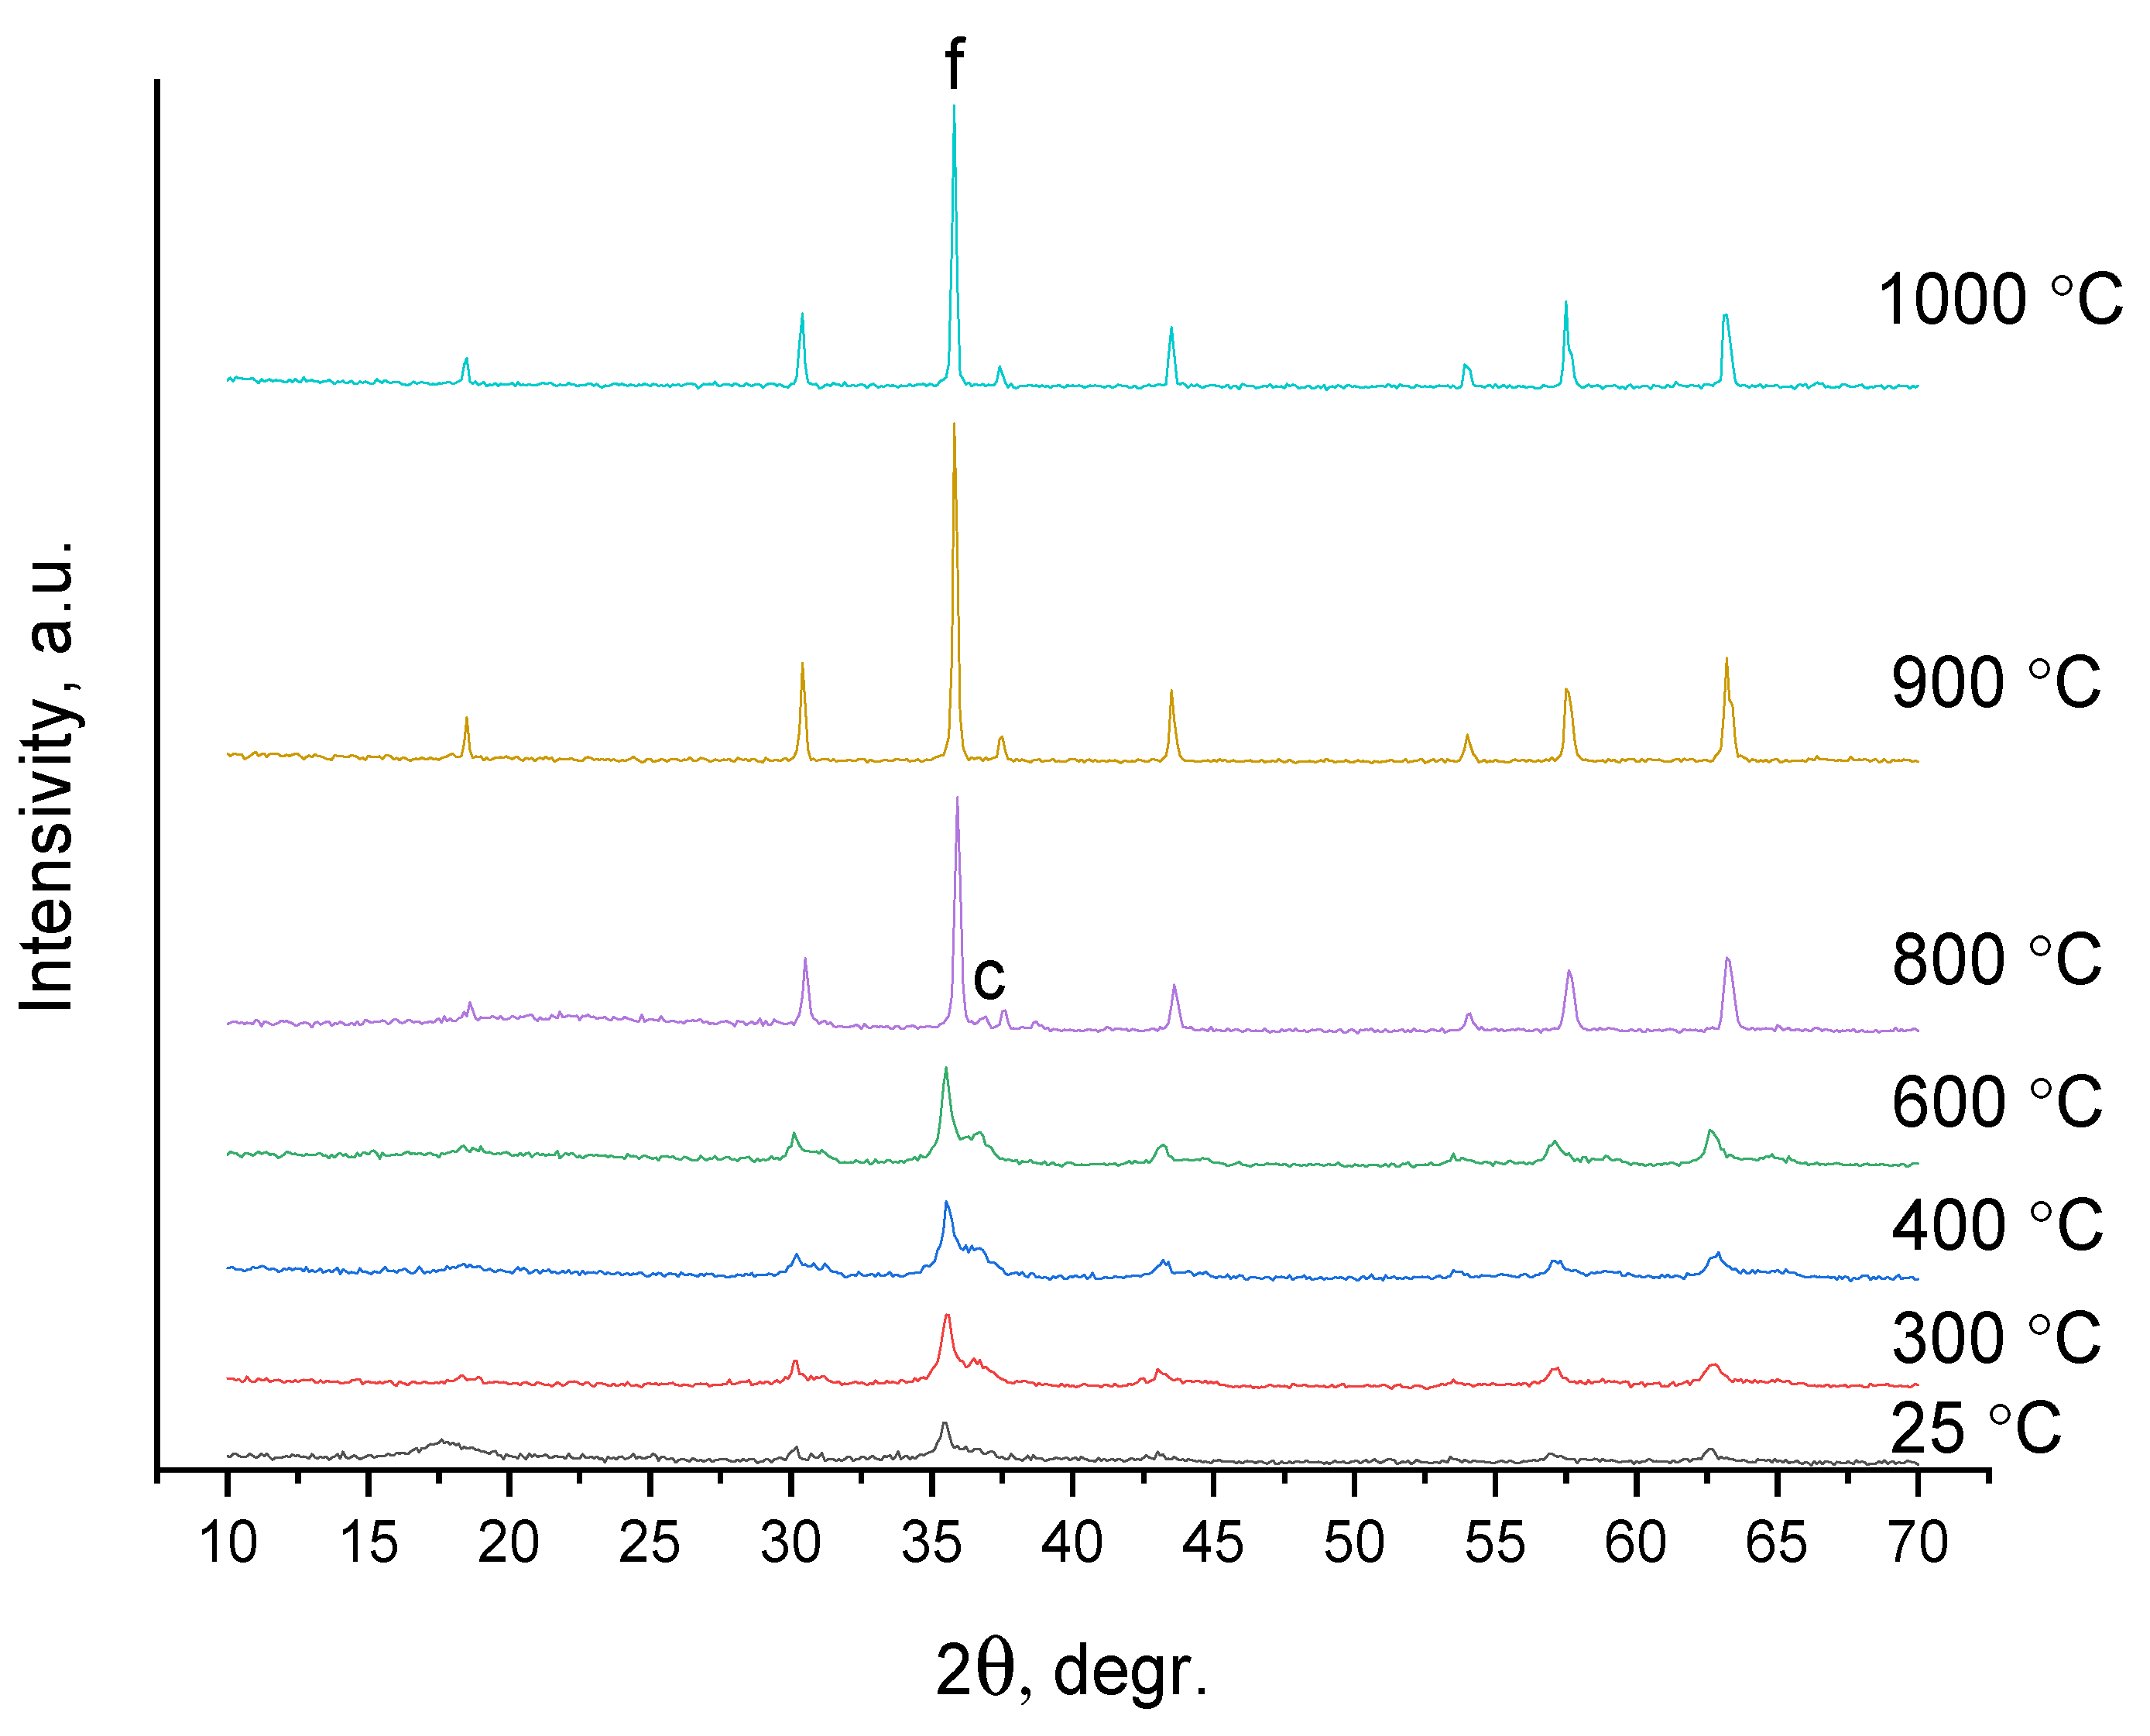
After plasma treatment, sample A-6 was annealed at temperatures from 300 to 1000 °C. IR analysis of the sample calcined at 300 °C (curve A-6-300) shows the absence of vibrations in the region 2000–2200 cm−1 (Figure 9), thus the sample does not contain ferrocyanide ions. Consequently, we determine that the oxidation of the remains of organic ligands (burnout of cyanoligands) in air occurs in the region of 250–300 °C. Thus we did not measure the IR spectra of plasma + temperature-treated A-6 sample for T = 400–900 °C because it is clear that ferrocyanide ions almost certainly burned out. The maximum temperature of 1000 °C was chosen based on XRD data (Figure 11) because a single-phase decomposition product with the structure of spinel CoFe2O4 was obtained.
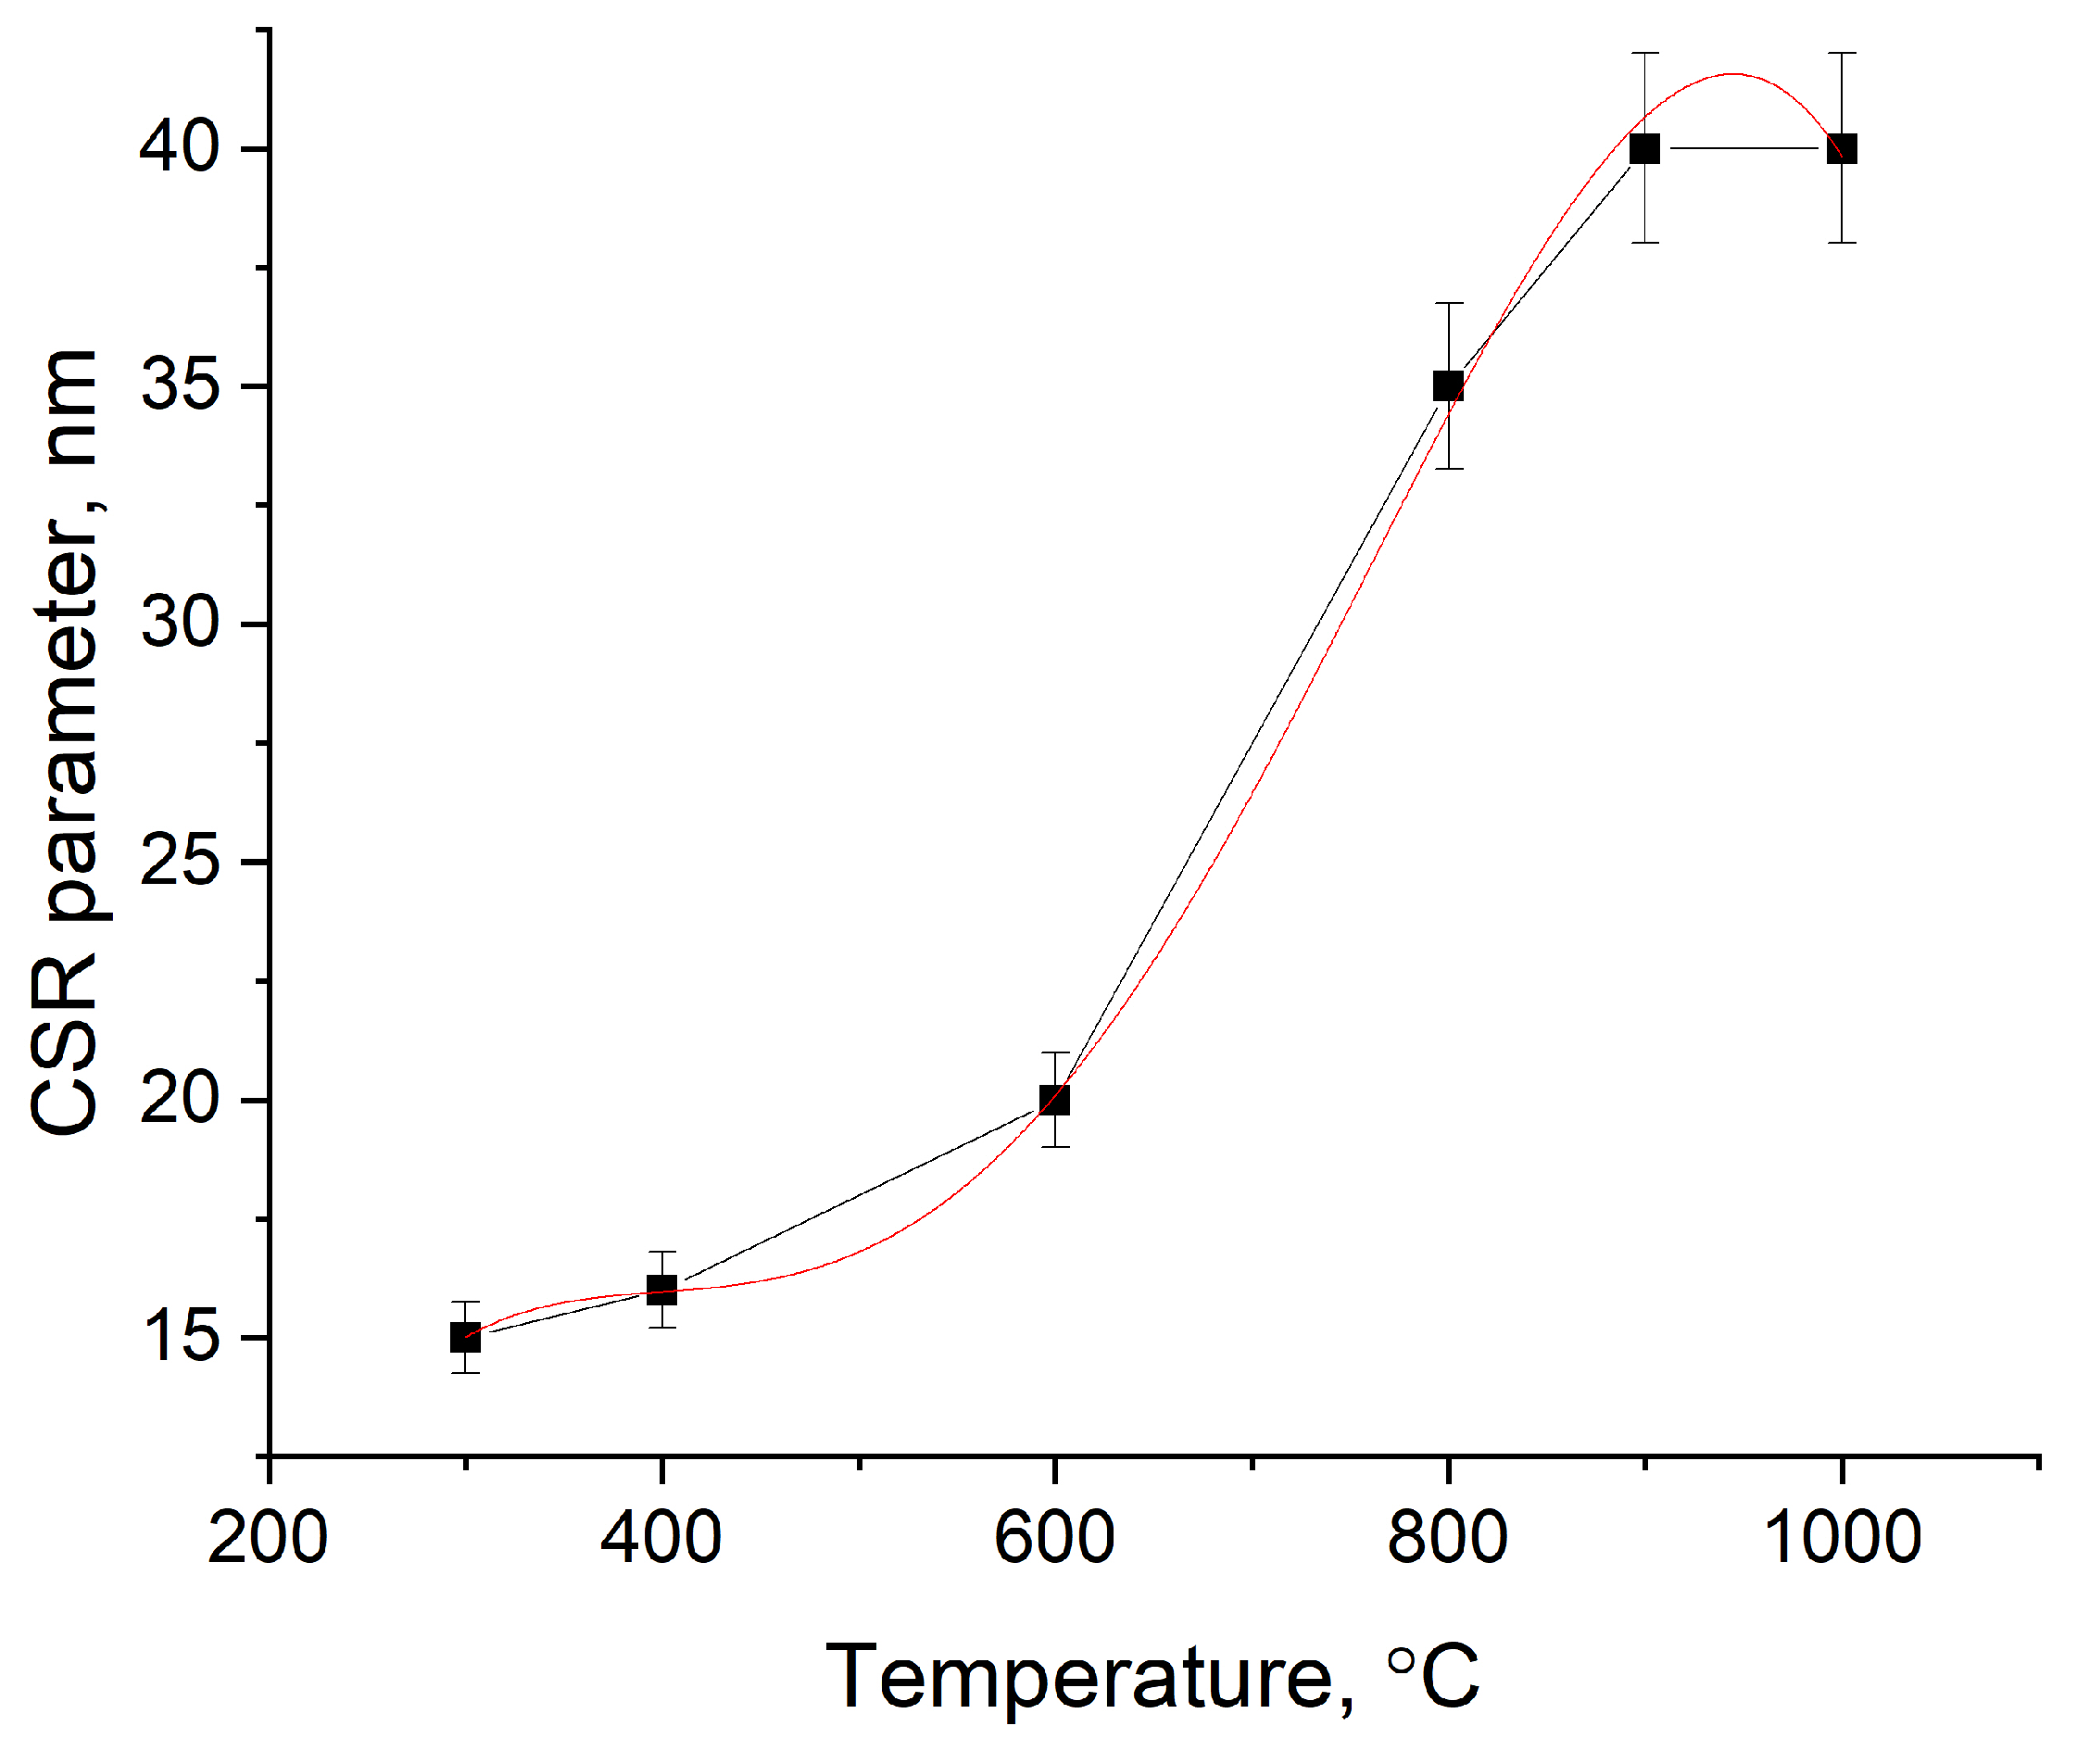
XRD data (Figure 11) reveal the A-6-300 sample cubic spinel structure CoFe2O4 (PDF Card—04-016-3954), with a lattice constant of ~8.38 Å and a yield ~30%. Partially overlapping low intensity reflections (splitting) in the region of 31.18° (2.866 Å), 36.52° (2.459 Å), 44.52° (2.034 Å) are probably caused by the presence of a similar structure. The structure is cobalt oxide Co3O4 (PDF Card—04-008-2376) with a smaller lattice constant (~8.11 Å). Increasing the temperature to 800–900 °C results in a strictly single-phase CoFe2O4 structure. Figure 12 demonstrates the change in the parameters of the coherent scattering region (CSR) depending on the temperature of the heat treatment of the DCS. CSR is calculated using the Scherrer equation, D = 0.941λ/βcos θ, where D is the CSR or average crystallite size, λ is the X-ray wavelength (CuKα = 1.5405929 Å), and θ and β are the diffraction angle and the full width at half maximum (FWHM) of the observed peaks, respectively. As with any calculated values, this one has its particularities.
The CSR curves in Figure 12 indicate that the particle sizes of the solid product with the structure of spinel CoFe2O4 vary from 15 to 40 nm in the temperature range of 300–1000 °C and that the size of the lattice constant is ~8.38 Å. An increase in particle size with increasing heat treatment temperature of DCS was previously observed in [60]. When using other methods (for example, combustion, precipitation and coprecipitation) of synthesizing single-phase spinel CoFe2O4 in the same temperature range, the crystallite sizes are 34–70 nm, with a lattice constant ~8.34–8.37 Å [42]. Spinel obtained by DCS treated by plasma + thermolysis at 1000 °C has a crystallite size two times smaller than that of earlier studies.
The nonlinear regression that fits the experimental data (red curve on Figure 12) was calculated according to the data in Table 2. The approximation fits the experimental data very well, as the R2 at these parameters are almost equal to 1. We see that significant members stand for members up to x2.
As a single-phase spinel is formed at a temperature of 1000 °C, the sample obtained at this temperature was examined in more detail.
Elemental analysis showed the absence of nitrogen and hydrogen in the composition of sample A-6-1000; therefore, coordinated ammonia was completely removed as a result of plasma + thermolysis treatment. The carbon content is 0.9 ± 0.1 wt%, which indicates that 4.7% of the original carbon content, which is part of the cyano groups, remained in the calcination residue in the DCS. The IR spectrum of the A6-1000 sample (Figure 7) showed the absence of absorption bands characteristic of ferrocyanides.
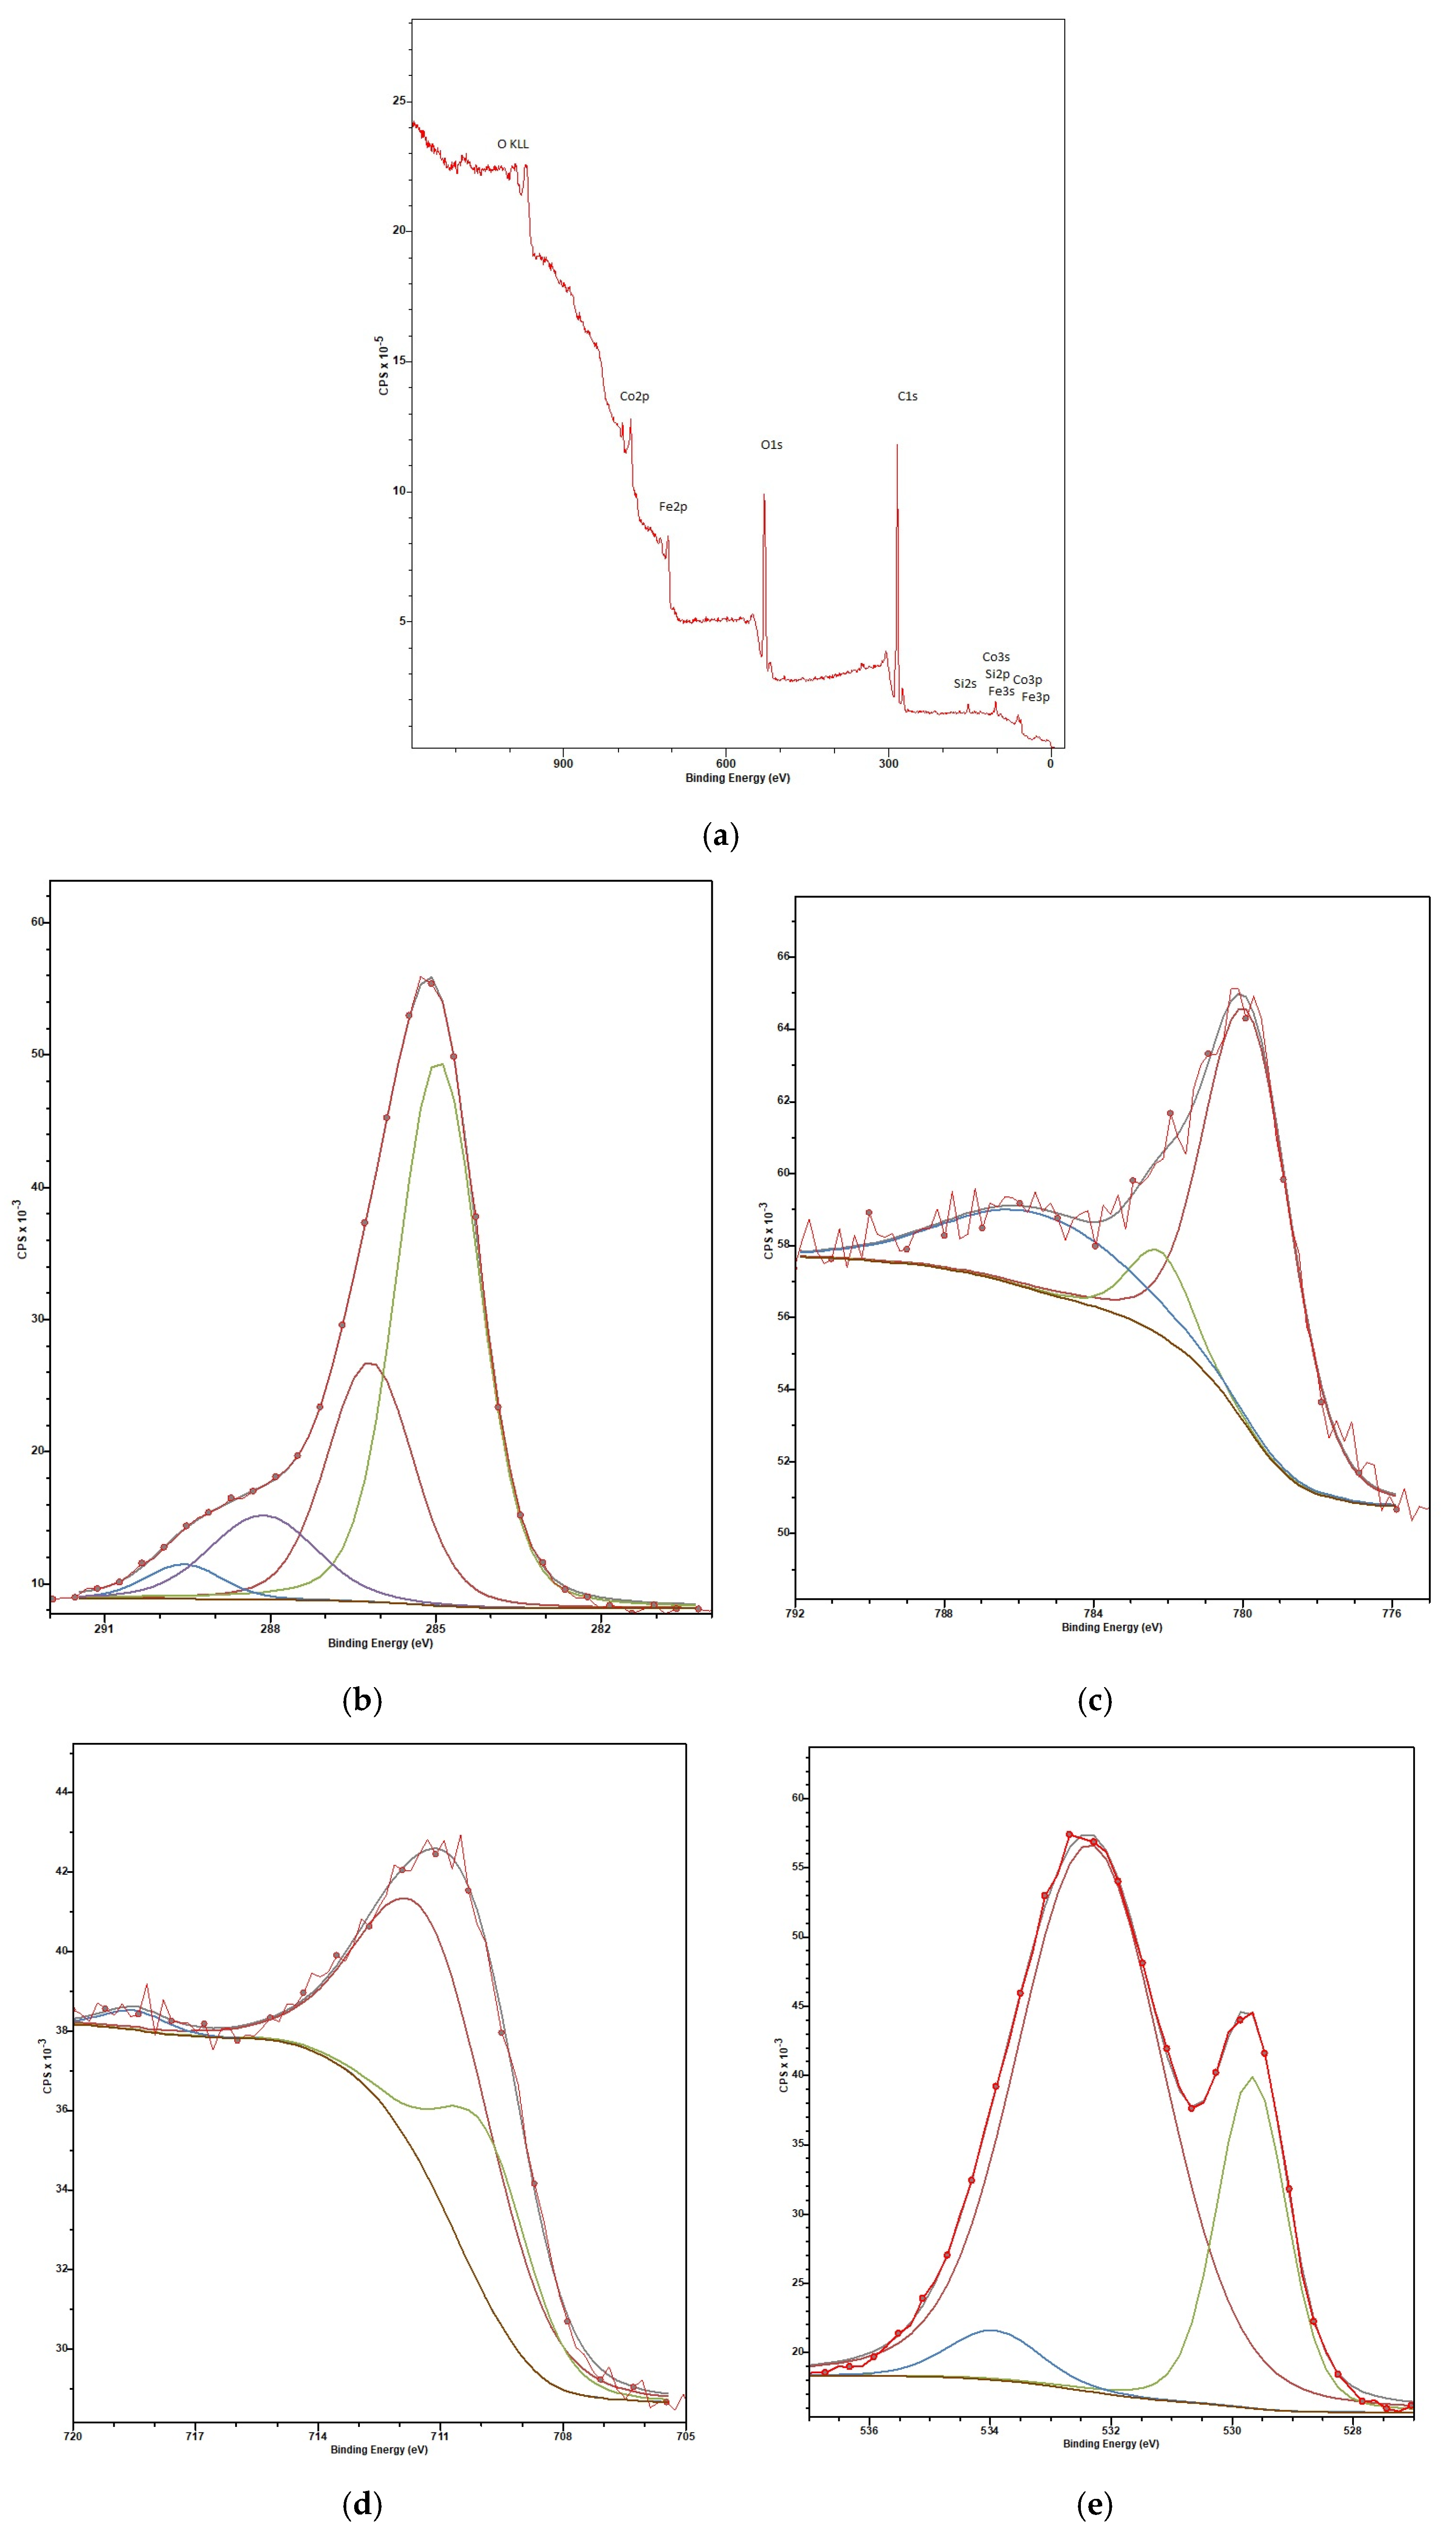
The composition of the sample surface was studied using the XPS method (Figure 13). The surface of the sample is predominantly composed of carbon, oxygen, iron and cobalt (Table 3).
XPS allows one to obtain information on the composition of the surface 5–10 nm [61]. Thus, the surface itself of the sample is enriched with carbon and silicon, while iron and cobalt are predominantly concentrated deeper in the material. Figure 13b demonstrates that carbon is represented by four types of bonds: C-C in sp3 hybridization (BE = 284.9 eV, FWHM = 1.77, 58.4%), C-O-C/C-OH bonds (BE = 286.2 eV, FWHM = 1.83, 26.6%), -C = O bonds (BE = 288.1 eV, FWHM = 2.27, 11.6%) and -C(O)-O- bonds (BE = 289.6 eV, FWHM = 1.62, 3.4%) [62,63]. Deconvolution of the O1s spectrum (Figure 13e) suggests that oxygen on the surface is represented by three types of atoms: adsorbed oxygen (BE = 532.4 eV, FWHM = 2.848, 75.0%), crystal lattice oxygen (Me-O) (BE = 529.7 eV, FWHM = 1.369, 21.9%) and oxygen bound to carbon -C(O)-O- (BE = 533.9 eV, FWHM = 1.511, 3.1%) [64,65,66]. Cobalt on the surface is represented by Co2+ in an octahedral environment (BE = 779.8 eV, FWHM = 2.742, 64.9%) and Co2+ in a tetrahedral environment (BE = 782.2 eV, FWHM = 1.949, 9.3%). The peak at 785.4 eV can be correlated with the satellite peaks of cobalt (II) and the Auger line of FeLMM. Iron is a mixture of Fe(II) (BE = 532.4 eV, FWHM = 2.848, 75.0%) and Fe(III) (BE = 532.4 eV, FWHM = 2.848, 75.0%), the peak at 718.5 eV is a satellite peak of Fe and of the Auger line of CoLMM [65,66,67,68,69].
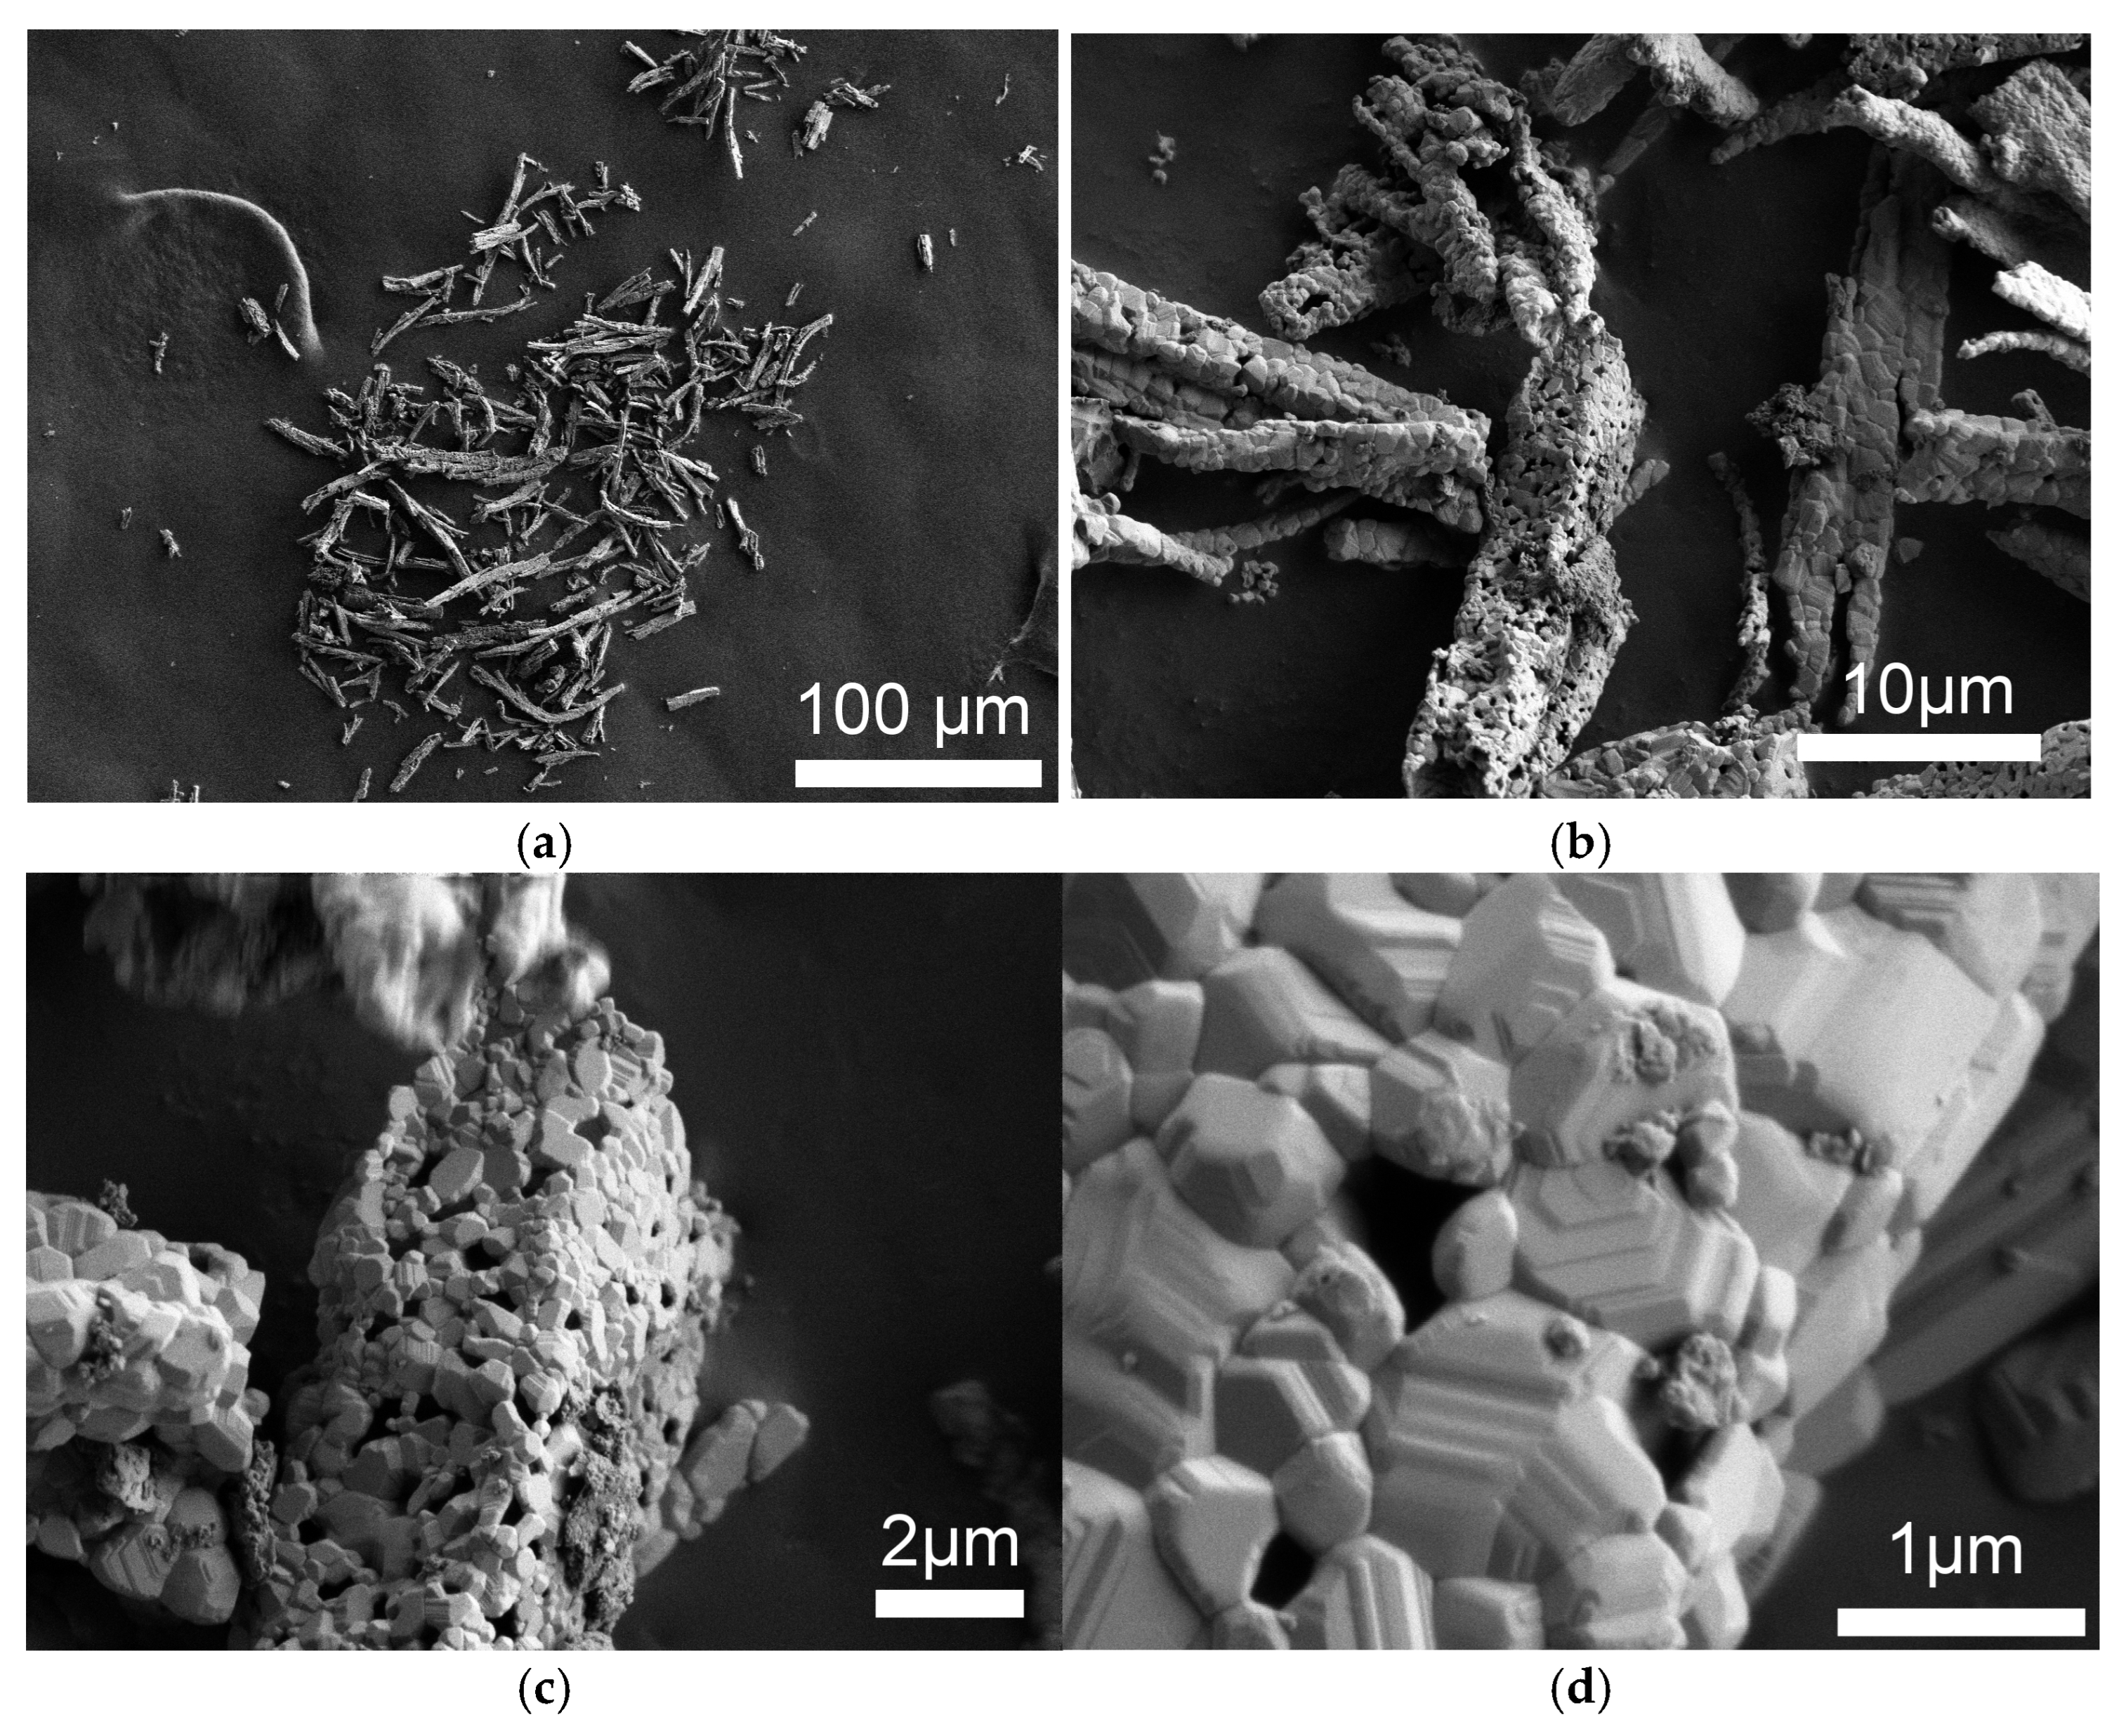
It should be noted that the CSR size is usually lower than the SEM grain size determination, as the CSR corresponds to the internal structurally ordered region of the grain and does not include strongly structurally distorted grain boundaries. The discrepancy between the CSR and the real crystallite size was observed in [70] with the example of (Gd0.96Eu0.01Sm0.01Tb0.01Er0.01)NbO4 ceramic solid solutions. Indeed, SEM showed that the crystal size was about 200 nm, Figure 14.
We observe a rather unusual morphology of the substance: at different scales the shape has a different structure. This seems to be a manifestation of self-organization: at the scale level of 100 μm this manifests as long rods of 20–100 μm in size (Figure 14a), with the rods consisting of individual sintered crystallites of a faceted, regular shape, but of very different sizes and with the crystallites having sizes from 200 nm to 1 μm (Figure 14b,c). At the same time, the surface of the crystallites also has a stepped structure (Figure 13d). Thus, three levels of organization of the substance are clearly traced, which is most likely a consequence of energy dissipation under highly nonequilibrium conditions. It is worth assuming that the rods are the result of plasma sintering, and that the precipitation of crystallites inside them is the result of the next stage of processing, thermal decomposition. However, such effective dissipation of different types of energy leads to the fact that the grains are highly heterogeneous inside and the internal structurally ordered regions do not exceed 40 nm (see Figure 11).

4. Conclusions

For the first time, the [Co(NH3)6][Fe(CN)6] DCS was processed by a plasma discharge. A higher applied power makes decomposition more effective, as evidenced by the XRD and IR spectrometric analyses. The optimal processing mode is as follows: double processing for 10 min at 100 W with intermediate mixing. A single-phase sample of spinel with the CoFe2O4 structure was obtained by step-by-step processing of the [Co(NH3)6][Fe(CN)6] DCS. The production of the main phase of CoFe2O4 begins at 300 °C. The highest yield (100%) is achieved with heat treatment at 900–1000 °C, and at 1000 °C CSRs have a size of 40 nm, while the crystallites have sizes from 200 nm to 1 μm. This is explained by self-organization at three scale levels during two types of DCS treatment. Coordinated ammonia was completely removed as a result of plasma + thermolysis treatment. The surface of the sample is predominantly composed of carbon, oxygen, iron and cobalt.

Author Contributions

Conceptualization, A.G. (Alevtina Gosteva) and M.K.; methodology, A.G. (Alevtina Gosteva) and O.G.; validation, A.G. (Alena Grabchak), V.V. and A.G. (Alevtina Gosteva).; formal analysis, A.G. (Alena Grabchak); investigation, A.G. (Alevtina Gosteva), V.V., O.G., S.S., A.G. (Alena Grabchak) and M.I.; resources, A.G. (Alevtina Gosteva), M.I.; data curation, A.G. and V.V.; writing—original draft preparation, A.G. (Alevtina Gosteva), V.V., O.G., S.S., D.M. and M.I.; writing—review and editing, A.G. (Alevtina Gosteva), V.V., M.K. and D.M.; visualization, V.V. and O.G.; supervision, A.G. (Alevtina Gosteva); project administration, A.G. (Alevtina Gosteva) and M.K.; funding acquisition, A.G. (Alevtina Gosteva). All authors have read and agreed to the published version of the manuscript.

Funding

This research was funded by Russian Science Foundation project 24-29-20076 (A.Gost.).

Data Availability Statement

The raw data required to reproduce these findings are available from the authors upon reasonable request.

Acknowledgments

The analysis of the composition (E.V. Fatushina) and structure of the materials (M.A. Teplonogova) obtained was carried out using the equipment of the JRC PMR IGIC RAS.

Conflicts of Interest

The authors declare no conflicts of interest.

Abbreviations

The following abbreviations are used in this manuscript:
DCSDouble complex salt
STASynchronous thermal analysis
LDLinear dichroism
TGThermogravimetry
DSCDifferential scanning calorimetry
XRDX-ray diffraction
CSRCoherent scattering region
SEMScanning electron microscopy
FWHMFull width at half maximum
XPSX-ray photoelectron spectroscopy
NPsNanoparticles

References

  1. Seitz, K.; Peschel, S.; Babel, D. Über die Kristallstrukturen der Cyanokomplexe [Co(NH3)6][Fe(CN)6], [Co(NH3)6]2[Ni(CN)4]3·2H2O und [Cu(en)2][Ni(CN)4]. Z. Für Anorg. Und Allg. Chem. 2001, 627, 929–934. Available online: https://onlinelibrary.wiley.com/doi/10.1002/1521-3749%28200105%29627%3A5%3C929%3A%3AAID-ZAAC929%3E3.0.CO%3B2-7 (accessed on 17 September 2025). (In German). [CrossRef]
  2. Pechenyuk, S.I.; Domonov, D.P.; Gosteva, A.N.; Semushina, Y.P.; Shimkin, A.A. Thermal behavior of double complexes [Co(NH3)6][Fe(CN)6] and [CO(en)3][Fe(CN)6]·2H2O. Izv. Vyss. Uchebnykh Zaved. Khimiya I Khimicheskaya Tekhnologiya 2018, 61, 49. (In Russian) [Google Scholar] [CrossRef]
  3. Potemkin, D.I.; Saparbaev, E.S.; Zadesenets, A.V.; Filatov, E.Y.; Snytnikov, P.V.; Sobyanin, V.A. Preferential CO Oxidation on Bimetallic Pt0.5M0.5 Catalysts (M = Fe, Co, Ni) Prepared from Double Complex Salts. Catal. Ind. 2018, 10, 62–67. [Google Scholar] [CrossRef]
  4. Zayed, E.M.; Mohamed, G.G.; El Salam, H.A.A. Ni(II), Co(II), Fe(III), and Zn(II) mixed ligand complexes of indoline-dione and naphthalene-dione: Synthesis, characterization, thermal, antimicrobial, and molecular modeling studies. Inorg. Chem. Comm. 2023, 147, 110276. [Google Scholar] [CrossRef]
  5. Kilic, A.; Alhafez, A.; Aytar, E.; Soylemez, R. The sustainable catalytic conversion of CO2 into value-added chemicals by using cobaloxime-based double complex salts as efficient and solvent-free catalysts. Inorg. Chim. Acta 2023, 554, 121547. [Google Scholar] [CrossRef]
  6. Afanasenko, E.; Seifullina, I.; Martsinko, E.; Dyakonenko, V.; Shishkina, S.; Gudzenko, O.; Varbanets, L. Supramolecular organization and enzyme-effector properties of double coordination salts with malatostannate/germanate(IV) anions and Fe(II), Co(II), Ni(II), Cu(II) 1,10-phenanthroline cations. J. Molec. Struct. 2023, 1271, 133996. [Google Scholar] [CrossRef]
  7. Rudneva, Y.V.; Korenev, S.V. Dispersed Metal Alloys: Synthesis Methods and Catalytic Properties (Review). Žurnal Neorganičeskoj Him. 2024, 69, 1181–1200. (In Russian) [Google Scholar] [CrossRef]
  8. Khalil, L.H.; Mousssa, N.A.; Mikhail, S. Thermal, structural and textural studies on the double complex salt [Co(NH3)6][Fe(CN)6] and on its silica-supported catalysts. J. Mater. Sci. 1992, 27, 557–568. [Google Scholar] [CrossRef]
  9. Khassin, A.A.; Pechenyuk, S.I.; Domonov, D.P.; Minyukova, T.P.; Chermashentseva, G.K.; Kustova, G.N.; Plysova, L.M. Catalytic Properties of Bimetallic Catalysts Based on Binary Complexes of Transition Metals in Fischer-Tropsch Synthesis. Chem. Sustain. Dev. 2007, 15, 673–683. [Google Scholar]
  10. Pechenyuk, S.I.; Domonov, D.P.; Rogachev, D.L.; Belyavskii, A.T. Anion Effect on the Thermolysis of Double Complexes [Co(NH3)6][Fe(CN)6] and [Co(NH3)6]4[Fe(CN)6]3. Rus. J. Inorg. Chem. 2007, 52, 1033–1038. [Google Scholar] [CrossRef]
  11. Gosteva, A.N.; Kulikova, M.V.; Semushina, Y.P.; Chudakova, M.V.; Tsvetov, N.S.; Semushin, V.V. Catalytic Activity of Thermolyzed [Co(NH3)6][Fe(CN)6] in CO Hydrogenation Reaction. Molecules 2021, 26, 3782. [Google Scholar] [CrossRef]
  12. Gosteva, A.N.; Kulikova, M.V.; Ivantsov, M.I.; Grabchak, A.A.; Semushina, Y.P.; Lapuk, S.E.; Gerasimov, A.V.; Tsvetov, N.S. CO2 Hydrogenation over Fe-Co Bimetallic Catalyst Derived from the Thermolysis of [Co(NH3)6][Fe(CN)6]. Catalysts 2023, 13, 1475. [Google Scholar] [CrossRef]
  13. Pechenyuk, S.I.; Semushina, Y.P.; Kadyrova, G.I.; Rogachev, D.L.; Kuz'mich, L.F.; Domonov, D.P.; Kalinnikov, V.T. Synthesis and Properties of Double Complex Salts Containing the Cation [Co(NH3)6]3+. Russ. J Coord. Chem. 2005, 31, 866–871. [Google Scholar] [CrossRef]
  14. Huang, C.; Li, M.; Wang, P.; Song, S.; Chai, B.; Zhang, M.; Hu, X.; Cai, J.; Wu, S.; He, Q. Tetracycline degradation by persulfate activated with nitrogen magnetic graphene oxide confined Fe/Co dual single-atom catalyst: Performance and degradation mechanism. J. Environ. Chem. Eng. 2023, 11, 109704. [Google Scholar] [CrossRef]
  15. Zhu, C.; Cun, F.; Fan, Z.; Nie, Y.; Du, Q.; Liu, F.; Yang, W.; Li, A. Heterogeneous Fe-Co dual-atom catalyst outdistances the homogeneous counterpart for peroxymonosulfate-assisted water decontamination: New surface collision oxidation path and diatomic synergy. Water Res. 2023, 241, 120164. [Google Scholar] [CrossRef]
  16. Wang, J.; You, R.; Zhao, C.; Zhang, W.; Liu, W.; Fu, X.P.; Li, Y.Y.; Zhou, F.Y.; Zheng, X.S.; Xu, Q.; et al. N-Coordinated Dual-Metal Single-Site Catalyst for Low-Temperature CO Oxidation. ACS Catal. 2020, 10, 2754–2761. [Google Scholar] [CrossRef]
  17. Rybinskaya, A.A.; Plyusnin, P.E.; Bykova, E.A.; Gromilov, S.A.; Shubin, Y.V.; Korenev, S.V. Double complex salts [Pd(NH3)4]3[Rh(NO2)6]2,[Pd(NH3)4]3[Rh(NO2)6]2⋅H2O as promising precursors to prepare Pd–Rh nanoalloys. J. Struct. Chem. 2012, 53, 527–533. [Google Scholar] [CrossRef]
  18. Metal Nanoclusters in Catalysis and Materials Science: The Issue of Size Control; Toshima, N., Yang, H., Shiraishi, Y., Eds.; Elsevier: Amsterdam, The Netherlands, 2008; 459p. [Google Scholar] [CrossRef]
  19. Song, H.T.; Fazeli, A.; Kim, H.D.; Eslami, A.A.; Noh, Y.S.; Saeidabad, N.G.; Moon, D.J. Effect of lanthanum group promoters on Cu/(mixture of ZnO and Zn-Al-spinnel-oxides) catalyst for methanol synthesis by hydrogenation of CO and CO2 mixtures. Fuel 2021, 283, 118987. [Google Scholar] [CrossRef]
  20. Kang, J.S.; Awate, S.V.; Lee, Y.J.; Kim, S.J.; Park, M.J.; Lee, S.D.; Hong, S.-I.; Moon, D.J. Nano-Sized Cobalt Based Fischer-Tropsch Catalysts for Gas-to-Liquid Process Applications. J. Nanosci. Nanotechnol. 2010, 10, 3700–3704. [Google Scholar] [CrossRef]
  21. Ilie, I.; Patron, L.; Brezeanu, M.; Segal, E.; Filoti, G. Synthesis of nickel ferrite from polynuclear coordination compounds. J. Mater. Sci. Lett. 1987, 6, 932–935. [Google Scholar] [CrossRef]
  22. Pechenyuk, S.I.; Gosteva, A.N. The complexes [Nia(Pn)b]x[Fe(CN)6]y (Pn = 1.3-diaminopropane): Synthesis and thermolysis. Russ. J. Coord. Chem. 2014, 40, 547–557. [Google Scholar] [CrossRef]
  23. Carreon, M.L. Plasma catalysis: A brief tutorial. Plasma Res. Express 2019, 1, 043001. [Google Scholar] [CrossRef]
  24. Wang, Z.; Zhang, Y.; Neyts, E.C.; Cao, X.; Zhang, X.; Jang, B.W.-L.; Liu, C. Catalyst Preparation with Plasmas: How Does It Work? ACS Catal. 2018, 8, 2093–2110. [Google Scholar] [CrossRef]
  25. Xu, Q.; Zheng, Y.; Wang, S.; Fu, Q.; Guo, X.; Li, Y.; Ren, J.; Cao, Z.; Li, R.; Zhao, L.; et al. Plasma synthesis of K-doped amorphous carbon nitride with passivated trap states for enhanced photocatalytic H2O2 production. J. Alloys Compd. 2023, 947, 169663. [Google Scholar] [CrossRef]
  26. Heng, Y.; Yu, L.; Chen, Y.; Chen, X.; Wang, W. Plasma-Assisted Material Preparation Strategies and Property Optimization. Phys. Status Solidi A 2024, 222, 2400702. [Google Scholar] [CrossRef]
  27. Mohan, H.; Mohandoss, S.; Prakash, A.; Balasubramaniyan, N.; Loganathan, S.; Assadi, A.A.; Khacef, A. Cold plasma assisted synthesis of spinel-CoFe2O4 nanoparticle with narrow bandgap and high magnetic activity. Inorg. Chem. Commun. 2024, 167, 112754. [Google Scholar] [CrossRef]
  28. Witvrouwen, T.; Paulussen, S.; Sels, B. The Use of Non-Equilibrium Plasmas for the Synthesis of Heterogeneous Catalysts. Plasma Process. Polym. 2012, 9, 750–760. [Google Scholar] [CrossRef]
  29. MhaskeSujit, S.; KakadeSandip, B.; Thorat Sopan, M.; Kalange Ashok, E. Synthesis, Structural and Magnetic Properties of Cobalt Ferrite (CoFe2O4) Nanoparticles by Simple Co-precipitation Technique. Int. Res. J. Sci. Eng. 2023, A12, 11–14. [Google Scholar] [CrossRef]
  30. Sharifianjazi, F.; Moradi, M.; Parvin, N.; Nemati, A.; Rad, A.J.; Sheysi, N.; Abouchenari, A.; Mohammadi, A.; Karbasi, S.; Ahmadi, Z.; et al. Magnetic CoFe2O4 nanoparticles doped with metal ions: A review. Ceram. Inter. 2020, 46, 18391–18412. [Google Scholar] [CrossRef]
  31. Sonu; Dutta, V.; Sharma, S.; Raizada, P.; Hosseini-Bandegharaei, A.; Gupta, V.K.; Singh, P. Review on augmentation in photocatalytic activity of CoFe2O4 via heterojunction formation for photocatalysis of organic pollutants in water. J. Saudi Chem. Soc. 2019, 23, 1119–1136. [Google Scholar] [CrossRef]
  32. Kumbhar, V.S.; Jagadale, A.D.; Shinde, N.M.; Lokhande, C.D. Chemical synthesis of spinel cobalt ferrite (CoFe2O4) nano-flakes for supercapacitor application. Appl. Surf. Sci. 2012, 259, 39–43. [Google Scholar] [CrossRef]
  33. Sandu, I.; Presmanes, L.; Alphonse, P.; Tailhades, P. Nanostructured cobalt manganese ferrite thin films for gas sensor application. Thin Sol. Films. 2006, 495, 130–133. [Google Scholar] [CrossRef]
  34. Venturini, J.; Wermuth, T.B.; Machado, M.C.; Arcaro, S.; Alves, A.K.; da Cas Viegas, A.; Bergmann, C.P. The influence of solvent composition in the sol-gel synthesis of cobalt ferrite (CoFe2O4): A route to tuning its magnetic and mechanical properties. J. Eur. Ceram. Soc. 2019, 39, 3442–3449. [Google Scholar] [CrossRef]
  35. Cote, L.J.; Teja, A.S.; Wilkinson, A.P.; Zhang, Z.J. Continuous hydrothermal synthesis of CoFe2O4 nanoparticles. Fluid Phase Eq. 2003, 210, 307–317. [Google Scholar] [CrossRef]
  36. Gan, L.; Shang, S.; Yuen, C.W.M.; Jiang, S.-X.; Hu, E. Hydrothermal synthesis of magnetic CoFe2O4/grapheme nanocomposites with improved photocatalytic activity. Appl. Surf. Sci. 2015, 351, 140–147. [Google Scholar] [CrossRef]
  37. Lavorato, G.; Alzamora, M.; Contreras, C.; Burlandy, G.; Litterst, F.J.; Baggio-Saitovitch, E. Internal Structure and Magnetic Properties in Cobalt Ferrite Nanoparticles: Influence of the Synthesis Method. Part. Part. Syst. Charact. 2019, 36, 1900061. [Google Scholar] [CrossRef]
  38. Pancotti, A.; Santos, D.P.; Morais, D.O.; de Barros Souza, M.V.; Lima, D.R.; Vulcani, V.A.S.; Martins, A.; Landers, R.; Braoios, A. Synthesis, characterization and in vitro cytotoxicity study of Co and Ni ferrite nanoparticles prepared by sol-gel method. SN Appl. Sci. 2021, 3, 716. [Google Scholar] [CrossRef]
  39. Sinkó, K.; Manek, E.; Meiszterics, A.; Havancsák, K.; Vainio, U.; Peterlik, H. Liquid-phase syntheses of cobalt ferrite nanoparticles. J. Nanopart. Res. 2012, 14, 894. [Google Scholar] [CrossRef]
  40. Naik, M.M.; Naik, H.S.B.; Kottam, N.; Vinuth, M.; Nagaraju, G.; Prabhakara, M.C. Multifunctional properties of microwave-assisted bioengineered nickel doped cobalt ferrite nanoparticles. J. Sol-Gel Sci. Technol. 2019, 91, 578–595. [Google Scholar] [CrossRef]
  41. Vadivel, M.; Ramesh Babu, R.; Ramamurthi, K.; Arivanandhan, M. Effect of PVP concentrations on the structural, morphological, dielectric and magnetic properties of CoFe2O4 magnetic nanoparticles. Nano-Struct. Nano-Obj. 2017, 11, 112–123. [Google Scholar] [CrossRef]
  42. Houshiar, M.; Zebhi, F.; Jafari Razi, Z.; Alidoust, A.; Askari, Z. Synthesis of cobalt ferrite (CoFe2O4) nanoparticles using combustion, coprecipitation, and precipitation methods: A comparison study of size, structural, and magnetic properties. J. Magn. Magn. Mat. 2014, 371, 43–48. [Google Scholar] [CrossRef]
  43. Al-Yaqoob, K.; Bououdina, M.; Akhter, M.S.; Al-Najar, B.; Vijaya Judith, J. Selectivity and efficient Pb and Cd ions removal by magnetic MFe2O4 (M = Co, Ni, Cu and Zn) nanoparticles. Mater. Chem. Phys. 2019, 232, 254–256. [Google Scholar] [CrossRef]
  44. Karbasi, M.; Maghazeii, F.; Ghanbari, D. Magnetic investigation of microwave synthesized and thermal stable poly vinyl alcohol-cobalt ferrite nanocomposites. J. Nanostruct. 2019, 9, 365–375. [Google Scholar] [CrossRef]
  45. Sartori, K.; Choueikani, F.; Gloter, A.; Begin-Colin, S.; Taverna, D.; Pichon, B.P. Room Temperature Blocked Magnetic Nanoparticles Based on Ferrite Promoted by a Three-Step Thermal Decomposition Process. J. Am. Chem. Soc. 2019, 141, 9783–9787. [Google Scholar] [CrossRef]
  46. Patankar, K.K.; Ghone, D.M.; Mathe, V.L.; Kaushik, S.D. Structural and physical property study of sol–gel synthesized CoFe2−xHoxO4 nano ferrites. J. Magn. Magn. Mat. 2018, 454, 71–77. [Google Scholar] [CrossRef]
  47. Mullick, S.; Rana, G.; Kumar, A.; Sharma, G.; Naushad, M. “Ferrites”: Synthesis, Structure, Properties and Applications. Mat. Res. Found. 2021, 112, 1–61. [Google Scholar] [CrossRef]
  48. Travnicek, Z.; Zboril, R.; Matikova-Mal’arova, M.; Drahos, B.; Cernak, J. Thermal decomposition of [Co(en)3][Fe(CN)6]·2H2O: Topotactic dehydration process, valence and spin exchange mechanism elucidation. Chem. Cent. J. 2013, 7, 1–18. [Google Scholar] [CrossRef]
  49. Semushina, Y.P.; Pechenyuk, S.I.; Ivanov, Y.V.; Plyusnin, P.E.; Shubin, Y.V. Thermal decomposition of [Co(NH3)6][Fe(C2O4)3]·3H2O in inert and reductive atmospheres. Russ. Chem. Bull. 2015, 64, 1963–1966. [Google Scholar] [CrossRef]
  50. Hashemi, M.; Mohandes, F.; Salavati-Niasari, M. Application of [M(en)3]3[Fe(ox)3]2 (M = Zn, Cd, Ni) complexes as new precursor for the synthesis of ferrite micro/nanostructures. Adv. Pow. Technol. 2016, 27, 388–394. [Google Scholar] [CrossRef]
  51. Asanova, T.; Asanov, I.; Zadesenets, A.; Filatov, E.; Plyusnin, P.; Gerasimov, E.; Korenev, S. Study on thermal decomposition of double complex salt [Pd(NH3)4][PtCl6]. J. Therm. Anal. Calorim. 2016, 123, 1183–1195. [Google Scholar] [CrossRef]
  52. Chen, X.Y.; Ma, C.; Zhang, Z.J.; Wang, B.N. Ultrafine gahnite (ZnAl2O4) nanocrystals: Hydrothermal synthesis and photoluminescent properties. Mater. Sci. Eng. B. 2008, 151, 224–230. [Google Scholar] [CrossRef]
  53. Gilabert, J.; Palacios, M.D.; Sanz, V.; Mestre, S. Characteristics reproducibility of (Fe, Co)(Cr, Al)2O4 pigments obtained by solution combustion synthesis. Ceram. Int. 2016, 42, 12880. [Google Scholar] [CrossRef][Green Version]
  54. Carp, O.; Patron, L.; Reller, A. Coordination compounds containing urea as precursors for oxides—A new route of obtaining nanosized CoFe2O4. Mater. Chem. Phys. 2007, 101, 142–147. [Google Scholar] [CrossRef]
  55. Schaber, P.M.; Colson, J.; Higgins, S.; Thielen, D.; Anspach, B.; Brauer, J. Thermal decomposition (pyrolysis) of urea in an open reaction vessel. Thermochim. Acta 2004, 424, 131–142. [Google Scholar] [CrossRef]
  56. Brack, W.; Heine, B.; Birkhold, F.; Kruse, M.; Schoch, G.; Tischer, S.; Deutschmann, O. Kinetic modeling of urea decomposition based on systematic thermogravimetric analyses of urea and its most important by-products. Chem. Eng. Sci. 2014, 106, 1–8. [Google Scholar] [CrossRef]
  57. Biganzoli, I.; Barni, R.; Gurioli, A.; Pertile, R.; Riccardi, C. Experimental Investigation of Lissajous Figure Shapes in Planar and Surface Dielectric Barrier Discharges. J. Phys. Conf. Ser. 2014, 550, 012039. [Google Scholar] [CrossRef]
  58. Pechenyuk, S.I.; Domonov, D.P.; Shimkin, A.A.; Semushina, Y.P.; Ivanov, Y.V. Thermal Behavior of Binary Complex Compounds Containing the Hexacyanoferrate Anion. Russ. J. General Chem. 2017, 87, 2212–2223. [Google Scholar] [CrossRef]
  59. Matiková-Mal’arová, M.; Černák, J.; Massa, W.; Varret, F. Three Co(III)–Fe(II) complexes based on hexacyanoferrates: Syntheses, spectroscopic and structural characterizations. Inorg. Chim. Acta 2009, 362, 443–448. [Google Scholar] [CrossRef]
  60. Filatov, E.Y.; Semushina, Y.P.; Gosteva, A.N. Obtaining and catalytic properties investigation of the products of double-complex salts [Cr(ur)6][M(L)6] thermal oxidation (M = Co, Fe; L = CN, 1/2C2O2−4). J. Therm. Anal. Calorim. 2018, 134, 355–361. [Google Scholar] [CrossRef]
  61. Thermo Fisher Scientific. X-Ray Photoelectron Spectroscopy and Related Techniques for Surface Analysis. Available online: https://www.thermofisher.com/ru/ru/home/electron-microscopy/products/xps-instruments.html#:~:text=XPS%20is%20extremely%20surface%20sensitive,extremely%20useful%20for%20materials%20analysis (accessed on 10 September 2025).
  62. Wang, Y.H.; Dai, Z.; Zhang, C.Y.; Sun, G.W.; Lu, Z.W.; Gao, X.P.; Sun, G.Z.; Lan, W.; Zhang, Z.X.; Pan, X.J.; et al. Investigation into performance enhancements of Li–S batteries via oxygen-containing functional groups on activated multi-walled carbon nanotubes using Fourier transform infrared spectroscopy. Current Appl. Phys. 2020, 20, 1049–1057. [Google Scholar] [CrossRef]
  63. Rabchinskii, M.K.; Shnitov, V.V.; Brzhezinskaya, M.; Baidakova, M.V.; Stolyarova, D.Y.; Ryzhkov, S.A.; Saveliev, S.D.; Shvidchenko, A.V.; Nefedov, D.Y.; Antonenko, A.O.; et al. Manifesting Epoxide and Hydroxyl Groups in XPS Spectra and Valence Band of Graphene Derivatives. Nanomaterials 2023, 13, 23. [Google Scholar] [CrossRef]
  64. Shchukarev, A.; Gojkovic, Z.; Funk, C.; Ramstedt, M. Cryo-XPS analysis reveals surface composition of microalgae. Appl. Surf. Sci. 2020, 526, 146538. [Google Scholar] [CrossRef]
  65. Arman, M.M.; El-Dek, S.I. Structural, Surface, Magnetic Study and Application of Nanoparticles CoFe2O4, ZnO and its Nanocomposite. J. Supercond. Nov. Magn. 2023, 36, 1913–1925. [Google Scholar] [CrossRef]
  66. Chen, X.; Wu, C.; Guo, Z. Synthesis of Efficient Cu/CoFe2O4 Catalysts for Low Temperature CO Oxidation. Catal. Lett. 2019, 149, 399–409. [Google Scholar] [CrossRef]
  67. Anjana, P.; Raj, R.S.A.; Jose, R.; Kumari, M.; Sarun, P.M.; Sajan, D.; Joy, L.K. Highly enhanced dielectric permittivity in CoFe2O4 by the Gd substitution in the octahedral sites. J. All. Comp. 2021, 854, 155758. [Google Scholar] [CrossRef]
  68. Fettkenhauer, C.; Wang, X.; Kailasam, K.; Antoniettia, M.; Dontsova, D. Synthesis of efficient photocatalysts for water oxidation and dye degradation reactions using CoCl2 eutectics. J. Mater. Chem. A 2015, 3, 21227–21232. [Google Scholar] [CrossRef]
  69. Einert, M.; Waheed, A.; Lauterbach, S.; Melin, M.; Rohnke, M.; Wagner, L.Q.; Chuanmu, T.; Smarsly, B.M.; Jaegermann, W.; Schlaad, H.; et al. Sol-gel-derived Ordered Mesoporous High Entropy Spinel Ferrites and Assessment of their Photoelectrochemical and Electrocatalytic Water Splitting Performance. ChemRxiv 2022. [Google Scholar] [CrossRef] [PubMed]
  70. Palatnikov, M.N.; Shcherbina, O.B.; Smirnov, M.V.; Deyneko, D.V.; Masloboeva, S.M. Luminescence and mechanical properties of GdNbO4 ceramic phosphors doped by Eu3+, Sm3+, Tb3+, Er3+. J. All. Comp. 2025, 1037, 182432. [Google Scholar] [CrossRef]
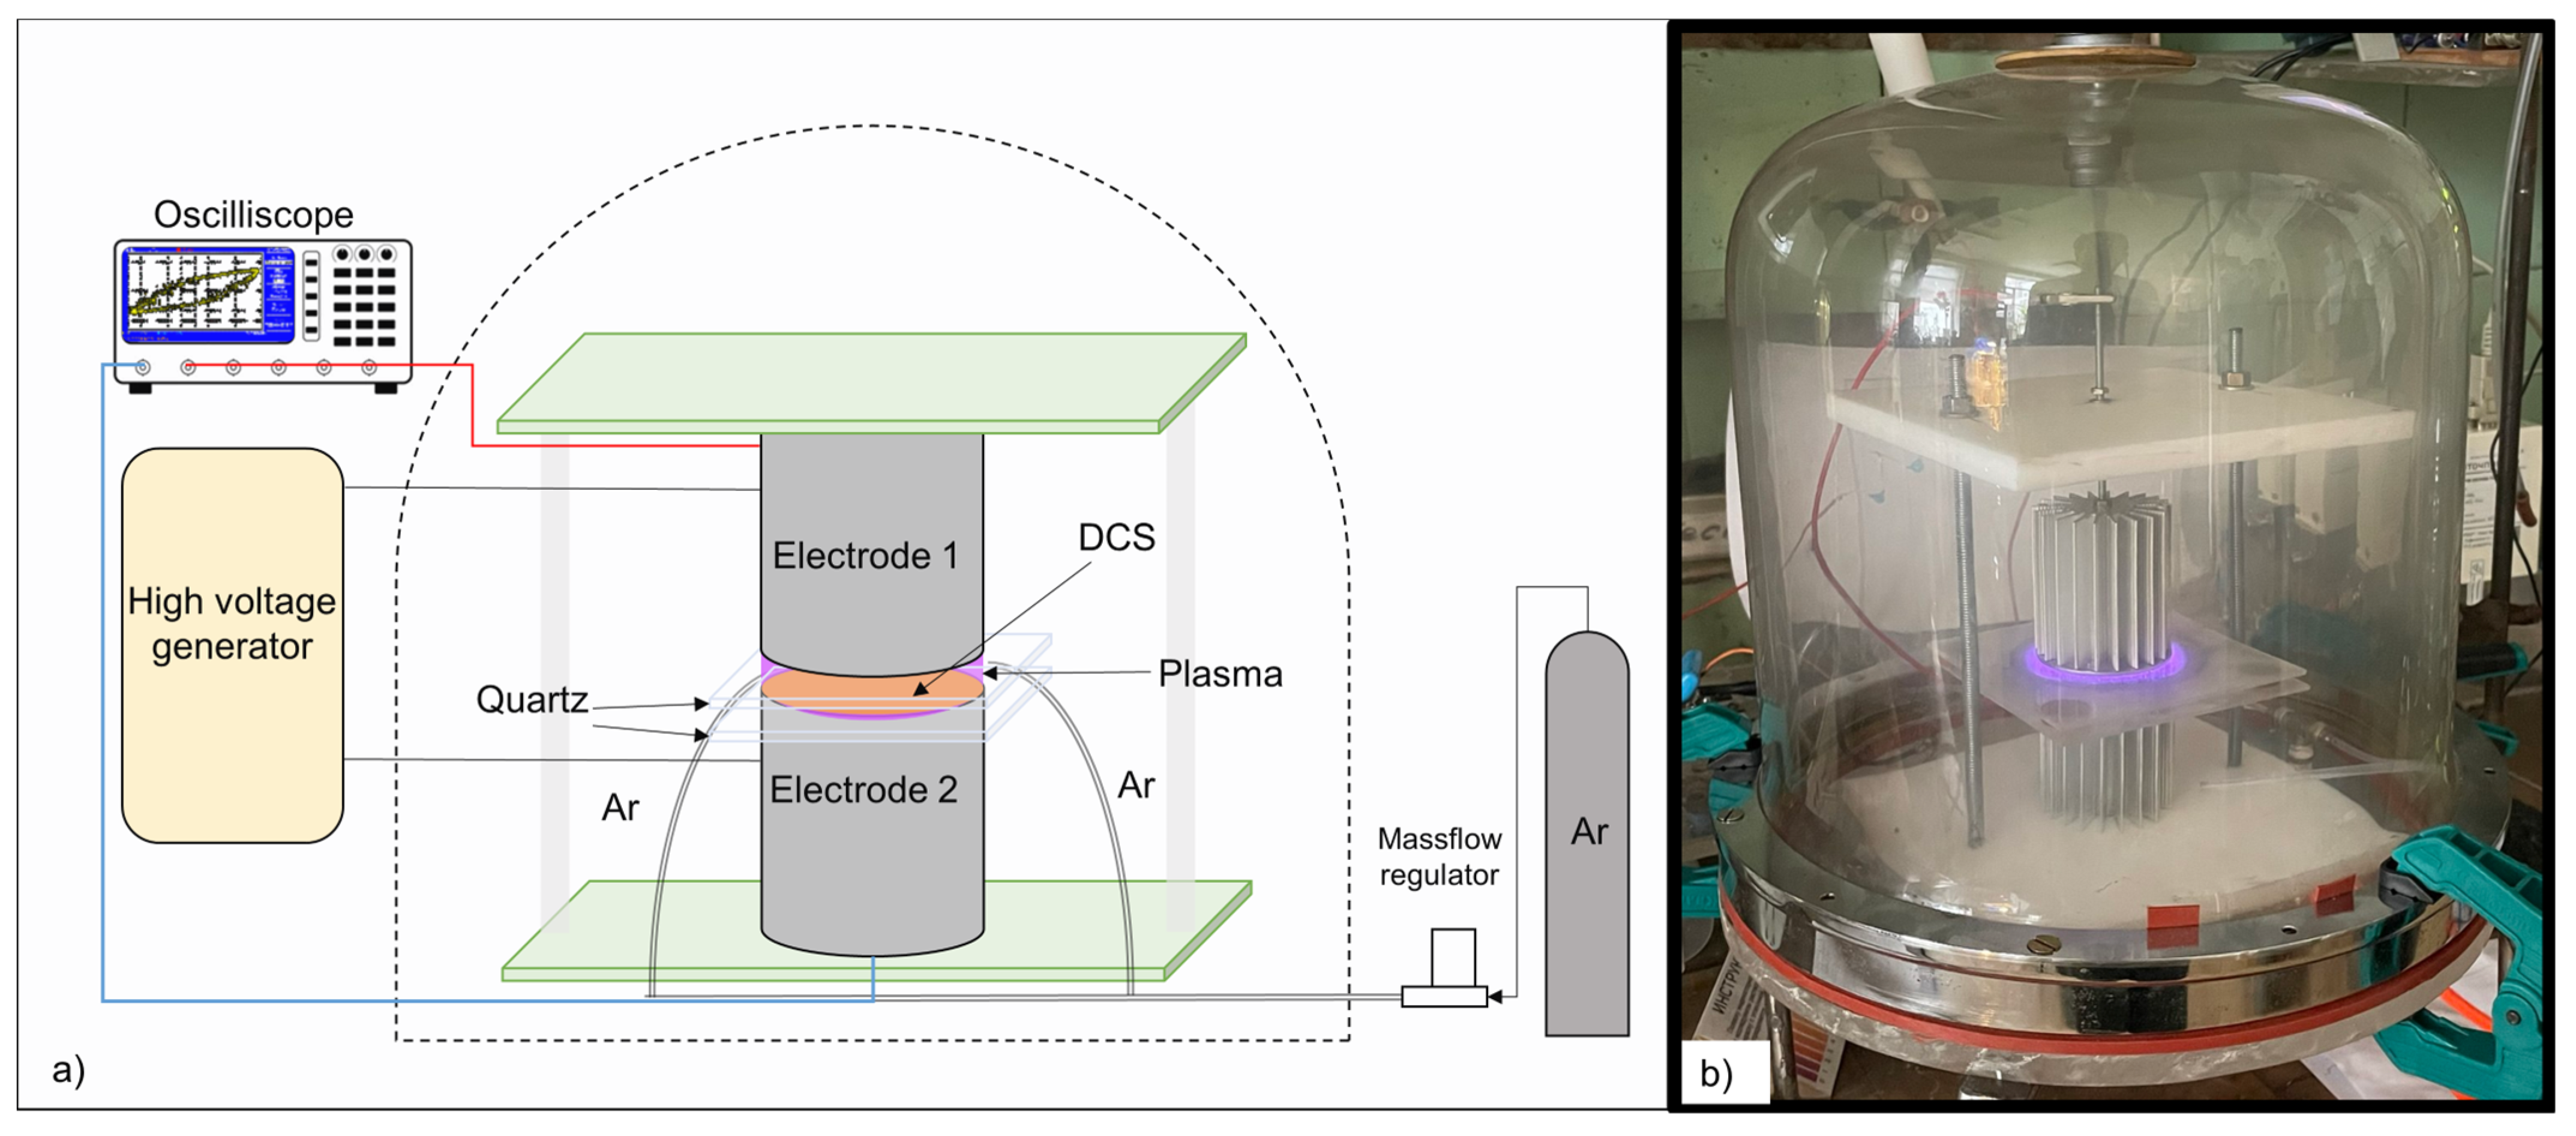
Figure 1. Diagram (a) and photo (b) of the DBD installation with flat electrodes.
Thermo 05 00036 g001
Figure 2. The scheme of the tubular DBD reactor used for the reaction temperature measurement.
Thermo 05 00036 g002
Figure 3. Lissajous curves recorded at different discharge powers (a) and photographs of the discharge at a power of 25 W (b) and 100 W (c).
Thermo 05 00036 g003
Figure 4. Photographs of a DCS samples (A-1–A-3) after three consecutive treatments for 10 min in a barrier discharge plasma at a power of 25 W.
Thermo 05 00036 g004
Figure 5. Photograph of a DCS sample after a single treatment for 10 min at 100 W. Sample A-5.
Thermo 05 00036 g005
Figure 6. Photograph of a DCS sample (A-6) after two treatments for 10 min at 100 W with intermediate mixing of the sample.
Thermo 05 00036 g006
Figure 7. Temperature measurement and photographs of the DCS plasma treatment reaction: (a) The start of the plasma treatment, (b) start of the decomposition and the exothermic affect, (c) the end of the exothermic effect, and (d) steady-state mode.
Thermo 05 00036 g007
Figure 8. XRD patterns of DCS samples after plasma treatment but before thermal treatment. Phases notation: o—(Co0.22Fe0.78)(Co0.98Fe1.02)O3.965 (PDF Card—01-083-6174), n—Co(NH3)6·Fe(CN)6 (PDFCard—01-080-8908), and x—a mixture of Fe4(Fe(CN)6)3·14H2O (PDF Card—01-073-0689), Co3(Co(CN)6)2·xH2O (PDF Card—00-022-0215) and Fe0.667Co(CN)4·4H2O (PDF Card—04-013-6956).
Thermo 05 00036 g008
Figure 9. IR spectra of DCS samples after plasma treatment at different treatment conditions (A-1–A-6) and an IR spectra of DCS sample A-6 treated with plasma + temperature 300 °C (A-6-300) and plasma + temperature 1000 °C (A-6-1000).
Thermo 05 00036 g009
Figure 10. STA (TG + DSC) in air for DCS A-6 after plasma treatment. TG—solid line, DSC—dashed line.
Thermo 05 00036 g010
Figure 11. XRD patterns of DCS samples calcined at different temperatures. Phase designations: f—CoFe2O4 (PDF Card—04-016-3954), and c—Co3O4 (PDF Card—04-008-2376). An XRD pattern denoted as ‘25 °C’ corresponds to the initial compound (sample A-6).
Thermo 05 00036 g011
Figure 12. CSR parameter for DCS calcined at different temperatures. Black curve—experimental data. Red curve—a fitting curve. The fitting curve parameters are given in the text.
Thermo 05 00036 g012
Figure 13. Spectroscopic studies of the sample surface: (a) Survey spectrum of the sample surface obtained by XPS and detailed spectra of (b) C1s, (c) Co 2p1/2, (d) Fe 2p1/2, and (e) O1s. (be)—red line is an original spectrum, black line is a smoothed original spectrum, curves of other colors are the results of the spectrum decomposition into Gaussian components.
Thermo 05 00036 g013
Figure 14. SEM images of the studied DCS thermal decomposition products with a spinel structure on a different scale: (a) 100 μm, (b) 10 μm, (c) 2 μm, (d) 1 μm.
Thermo 05 00036 g014
Table 1. The plasma treatment conditions of the DCS samples.
SampleInput Power, WPlasma Treatment DurationRemaining Mass After Treatment (%)
A-1251 cycle of 10 min67.4 ± 0.2%
A-2252 cycles of 10 min each63.2 ± 0.4%
A-3253 cycles of 10 min each61.6 ± 0.4%
A-4253 cycles of 15 min each62.1 ± 0.5%
A-51001 cycle of 15 min57.0 ± 0.4%
A-61002 cycles of 10 min each47 ± 0.2%
Table 2. Fitting parameters for the approximation of the theoretical data on CSR; y = CSR, x = T.
ModelPoly 4
Equationy = A0 + A1 × x + A2 × x2 + A3 × x3 + A4 × x4
A0−43.73 ± 16.54
A10.49 ± 0.12
A2−0.0015 ± 0.0003
A30.00019 ± 0.00003
A4−0.000000082 ± 0.000000001
Reduced Chi-Sqr0.24
R20.999
Adjusted R20.996
Table 3. Sample surface composition according to XPS data.
ElementCOSi *FeCo
At %70.923.44.30.70.7
Wt %59.726.38.42.72.9
* Silicon was added when grinding the sample in an agate mortar.
Disclaimer/Publisher’s Note: The statements, opinions and data contained in all publications are solely those of the individual author(s) and contributor(s) and not of MDPI and/or the editor(s). MDPI and/or the editor(s) disclaim responsibility for any injury to people or property resulting from any ideas, methods, instructions or products referred to in the content.