Abstract
Energy transition is a challenge for remote northern communities mainly relying on diesel for electricity generation and space heating. Solar-assisted ground-coupled heat pump (SAGCHP) systems represent an alternative that was investigated in this study for the Kuujjuaq Forum, a multi-activity facility in Nunavik, Canada. The energy requirements of community buildings facing a subarctic climate are poorly known. Based on energy bills, technical documents, and site visits, this study provided an opportunity to better document the energy consumption of such building, especially considering the recent solar photovoltaic (PV) system installed on part of the roof. A comprehensive model was developed to analyze the building’s heating demand and simulate the performance of a ground-source heat pump (GSHP) coupled with PV panels. The air preheating load, accounting for 268,200 kWh and 47% of the total heating demand, was identified as an interesting and realistic load that could be met by SAGCHP. The GSHP system would require a total length of at least 8000 m, with boreholes at depths between 170 and 200 m to meet this demand. Additional PV panels covering the entire roof could supply 30% of the heat pump’s annual energy demand on average, with seasonal variations from 22% in winter to 53% in spring. Economic and environmental analysis suggest potential annual savings of CAD 164,960 and 176.7 tCO2eq emissions reduction, including benefits from exporting solar energy surplus to the local grid. This study provides valuable insights on non-residential building energy consumption in subarctic conditions and demonstrates the technical viability of SAGCHP systems for large-scale applications in remote communities.
1. Introduction
Indigenous remote communities relying on microgrids are common among the Arctic regions [1], especially in Canada, Alaska (United States), Russia, and Greenland (Denmark). Due to the harsh climate, buildings in these regions show high electricity and heat demand, while their remoteness increases energy vulnerability and dependence on fossil fuels. Energy transition in remote Arctic communities is becoming increasingly important, and is at the core of economic, environmental and social considerations for local governments [2,3,4,5,6]. The main objectives are reducing building energy demand, decarbonizing heating systems, and developing clean electricity generation. Nunavik is a geographically isolated region in Northern Quebec, home to about 14,000 inhabitants [7], mostly Inuit and Cree, living in 14 remote communities. These villages are disconnected from the country’s main road and energy networks. They mostly rely on local diesel power plants for electricity generation and most buildings are heated with oil furnaces. The dependence on fossil energy results in significant expenses for power generation. The cost of diesel in Nunavik for the 2023–2024 season was CAD 2.12/L before subsidy, substantially higher than the Quebec average of CAD 1.61/L [8]. In 2024, Makivvik Corporation announced a direct subsidy to stabilize diesel cost at CAD 1.84/L [9].
Renewable energy technologies, such as wind, solar, and geothermal, offer promising solutions for sustainable power and heat generation. Transitioning to these alternative sources could allow communities to reduce their carbon footprint, lower energy cost, and enhance energy security and resilience. Geothermal systems in particular hold significant potential for heating buildings in Arctic and subarctic regions, presenting advantages like utilization of an on-site resource for energy, a high-capacity factor, long lifetime, low operational cost, and load flexibility [10]. However, due to high capital cost, very few projects and installations are running, and little feedback has been provided. Shallow geothermal systems have been the subject to limited field investigation in the high north. In Fairbanks (Alaska) [11], a horizontal ground loop system, digging down to 2.75 m to install the pipes, was connected to a 465 m2 building in 2013. Designed for a 17.6 kW heating load, the system demonstrated interesting performance, generating 20,000 to 30,000 kWh of annual heat and avoiding 2650 L of fuel oil annually. Over the first 8-year operational period, the system maintained a COP averaging 3.0 [12]. The maintenance cost amounts to USD 300 every other year and the geothermal system allowed to stabilize electricity consumption cost to USD 0.24/kWh. A review by Garber-Slaght and Stevens [13] examined 13 GSHP installations in Fairbanks, including horizontal loops and vertical wells (41 to 76 m), with capacities between 14 and 35 kW. These systems supplied diverse building typologies, covering residential dwellings from 93 to 465 m2 surface area, multi-unit condominiums, offices, and educational facility make-up air system. While the study generated useful guidelines for decision-making, the authors emphasized the need for long-term performance data for future system design implementation.
Research over the past decades has demonstrated the viability of shallow and deep geothermal potential in Canadian remote northern communities [14,15,16]. In Nunavik, where the ground temperature is near the freezing point of water throughout the year, vertical closed loop systems that circulate antifreeze mixtures are the most effective ground heat exchanger (GHE).
Several studies have assessed the feasibility and benefits of geothermal and hybrid systems in Nunavik. Belzile et al. [17] simulated an absorption ground-coupled heat pump (GCHP) with a horizontal exchanger in Kangiqsualujjuaq and demonstrated it could reduce heating oil consumption by 40% compared to conventional systems powered by diesel-generated electricity. Giordano and Raymond [14] showed that a borehole thermal energy system (BTES) assisted with solar thermal panels to heat the drinking water of the Kuujjuaq pumping station could achieve 13% annual oil savings and reduce CO2 equivalent emissions by 19 tons within three years of operation. In Whapmagoostui-Kuujjuarapik (WK), Maranghi et al. [18] found that solar-assisted GCHP (SAGCHP) with a compression system reduced fuel consumption by 38%, which could be increased to a 59% reduction with the addition of batteries. Also in WK, Langevin et al. [19] identified scenarios with compression SAGCHP that could reach 61% greenhouse gas (GHG) savings. Moreno [20] and Moreno et al. [21] highlighted hybrid alternatives, like SAGCHP combined with biomass or oil furnace, as promising options that could achieve a reduction of 50% to 99% of GHG emissions. All studies agreed that SAGCHP remains the most suitable option for reducing carbon emissions in Nunavik and enhancing communities’ energy sovereignty. With a diesel power plant efficiency of approximately 30% and a heat pump COP which can be assumed around 3.0 in northern conditions, we obtain a 90% efficiency for the whole system, that can achieve similar performance as conventional oil furnace or boiler. Hence, assistance from renewable energy is mandatory to partly provide clean electricity to the heat pump compressor if we want to reduce GHG emission and have significant environmental gains.
Despite the promising results, renewable energy development in isolated Arctic regions is an economic challenge. For vertical geothermal systems in general, drilling cost can represent about 30 to 50% of the capital cost of a project [21]. In Nunavik, drilling equipment is already present in certain locations, such as Kuujjuaq, but is specialized in mineral exploration. Diamond drills used for mineral exploration are more compact than usual geothermal rigs, thus easier to transport, but the drilling diameter is narrower and less adapted for GHE. Considering a drilling cost between CAD 50 and 300/m, Gunawan et al. [15] emphasized that SAGCHP systems still can be economically more attractive than oil furnace heating as all the studied scenarios present a relatively fast payback between 3 and 12 years. Moreno et al. [21] identified a promising strategy of net metering, obtaining credits for injecting surplus electricity from solar panels into the grid, to reduce cost and make systems even more economically competitive.
Meyer et al. [4] and Garber-Slaght and Stevens [13] emphasizes the importance of accurate GSHP sizing, highlighting the need for full data on operational buildings in arctic and subarctic regions. However, a significant literature gap exists regarding northern building performance. Rouleau and Gosselin [22] monitored ten dwellings, limited to a single building typology (semi-detached), reporting heat demands ranging from 180 to 350 kWh per m2 of surface area and a daily electricity consumption between 6.21 and 29.20 kWh. One-year monitoring studies of high-performance demonstration house were conducted in Iqaluit (Nunavut, Canada) [23], Sisimiut (Greenland) [24], and Kiruna (Sweden) [25,26], but these dwellings were mostly unoccupied, necessitating further research that includes the impact of occupant behavior. Furthermore, data on non-residential buildings—such as grocery stores, healthcare facilities, and recreational centers—which are found in most northern communities, remain even scarcer, accounting for the critical gap in current scientific understanding.
The present work focuses on the Kuujjuaq Forum, an important activity center in Kuujjuaq, which is an Inuit community of 2700 inhabitants [7] located on the 58° parallel in Nunavik. The climate is characterized by harsh winters, with low temperatures, strong winds, and short days. Average annual temperature is −5.4 °C [27], with 8523 heating degree days below 18 (HDD18) [28]. Recent geothermal tests in Kuujjuaq revealed promising thermal properties, with an average ground temperature of 1.8 °C between 15 and 145 m depth and thermal conductivity of 2.67 ± 0.25 W m−1K−1 [29,30]. In Nunavik, the annual average heating demand for a typical dwelling is 310 kWh/m2 [1], compared to 145 kWh/m2 in southern Quebec [31]. The Forum is also equipped with a monitored PV system, reducing reliance on the local diesel-powered microgrid.
In this context and in collaboration with the building’s owner, Kuujjuamiut Society, this project was initiated to evaluate the potential of SAGCHP system for space heating in the Kuujjuaq Forum. This study gathers field data on the Kuujjuaq Forum’s heating and electrical demand, alongside its PV panels’ electricity generation, to assess the feasibility of integrating a SAGCHP system. The objective of the study is to propose sustainable energy solutions for the building, leveraging both geothermal and solar energy to reduce reliance on diesel. Oil bills and technical documents were analyzed to assess the energy consumption of this operating building and develop an energy model. The results were used to size and model a GCHP system to meet part of the heat demand. The potential of a new, larger PV system to assist heat pumps was evaluated. Finally, a quick environmental and economic analysis was carried out. By presenting field data and addressing the technical, environmental, and economic challenges of sustainable energy transition in Nunavik, the present work contributes to fill the data gap of energy consumption for non-residential buildings and solar PV electricity generation in Arctic to subarctic regions. We believe this represents a significant scientific contribution as there is little information available in the literature about operating buildings in such climate. Results are discussed in the energy transition context to provide guidelines for other remote communities living in similar climatic conditions and facing similar challenges to decrease their fossil fuel consumption.
2. Case Study and Field Data
The studied building is an existing infrastructure in Kuujjuaq, known as Kuujjuaq Forum. Figure 1 is a photograph of the Forum. All the information gathered comes from direct exchanges with the owner, on-site observations, documentation, and an audit carried out in 2022 [32]. The building is run by Kuujjuamiut Society and was built in 1992. The eastern part of the building was added a few years after. It includes offices, a conference room and sports facilities, such as an arena, a gymnasium, and a fitness center. Changing rooms and showers are also available.
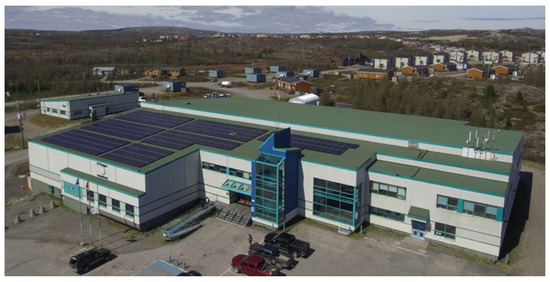
Figure 1.
Photography of Kuujjuaq Forum (Societe Kuujjuamiut Inc.).
2.1. Building Use
The building total surface area is about 6000 m2. It can welcome up to 200 to 300 people per day on most busy days, mainly for sport activities, according to on-site verbal reports. The occupation is important during hockey season and decreases during summer. Kuujjuamiut Society offices are also located in the building, with about 15 people coming to work from Monday to Friday. Kuujjuaq Forum is open seven days a week, all year long, except for the Christmas holiday. The ice rink runs from 1 September to 30 April. In summer, the arena is used for an annual multiday festival.
Heating oil is delivered to the building by Nunavik Petro Inc. between one to four times a month, depending on the time of year and heating requirements. The heating demand presented in this study is based on four years of bills, from 2020 to 2023. We assume that the quantity of oil delivered corresponds to the quantity consumed by the building since the previous delivery. Oil is used for both space heating and domestic hot water in this building. Figure 2 shows the monthly oil consumption profile averaged over the four years and converted into heating energy consumption in kWh. The conversion factor used for oil is 10.77 kWh/L [33] and a conventional combustion efficiency of 0.8 for the oil boiler is assumed. Table 1 sums the building’s annual oil consumption converted into heating consumption in kWh, alongside the annual HDD18 and the heating consumption per HDD18. From 2020 to 2023, an average of 66,510 L of oil was delivered annually, corresponding to an average energy consumption of 573,180 kWh/yr. Oil delivery in 2022 (52,230 L) is notably lower than other years (ranging from 67,190 to 76,420 L). Without 2022, the average annual oil delivery goes from 66,510 to 71,270 L and the average energy consumption directly used by the building goes from 573,180 to 614,200 kWh/yr. The number of HDD18 in 2022 is not particularly lower than other years, suggesting that 2022 was not notably warmer, which might have explained the lower consumption. However, building energy consumption tends to vary a lot due to operational changes, maintenance interventions, or occupancy patterns. There could also be uncertainties in the invoices (delivery date, missing bills, etc.) analyzed in this study. For the previous reasons and with only four annual values, classifying 2022’s value as an outlier can be methodologically challenging. We estimate that the value remains within reasonable bounds. Excluding a whole year of data could omit significant information for our analysis. Therefore, we retain 2022 data for our analysis, while being aware of the potential impact this could have on results.
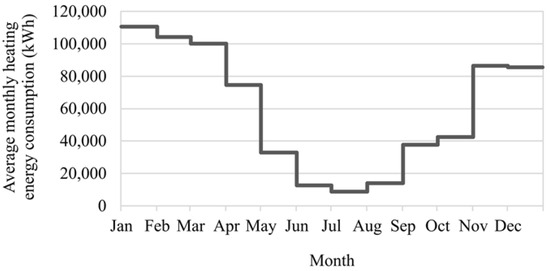
Figure 2.
Kuujjuaq Forum’s average monthly heating consumption (heating and domestic hot water—DHW) over the period 2020–2023, estimated from oil bills and after applying boiler efficiency coefficient.

Table 1.
Forum’s annual oil delivery, converted into heating consumption (after applying boiler efficiency coefficient), heating degree days (HDD18), and Forum’s heating consumption per HDD18, from 2020 to 2023.
2.2. HVAC System
Two boilers of 268 kW each are located in the building’s mechanical room. They run from 1 September to 30 June and supply heating for radiators and ventilation. Radiators work 24 h per day and ventilation is on from 7:30 to 23:00. Several air handling systems supply the different spaces (gymnasium, changing rooms, washrooms, hall and offices, etc.). Air handlers in the old part of the building do not have exhaust ducts. Hence, incoming fresh air is balanced by conditioned air leaving the building via leakage or exhaust fans without energy recovery. In the building’s additional section, air handlers have an intake, an exhaust, and a mixing damper. All air handlers have an outdoor air intake. The building is not equipped with central air conditioning. Few window-mounted units are installed and removed seasonally. Two 190 L oil-fired tank heaters supply domestic hot water. The ice rink chiller system includes two 48 kW compressors and two 15 kW brine pumps. Heat rejected by the chiller system is used to heat the arena’s ventilation system. Air flows in the main ducts were estimated from commissioning documents and audit [31] and are given in Table 2. With these values, the outdoor air (OA) ratio for ducts 1 (gymnasium), 2 (first floor), and 4 (second floor, entrance hall, and first floor office) are, respectively, 16%, 14%, and 15%. We also know that air flow rates are sometimes adjusted manually during the year for comfort purposes.

Table 2.
Return air, outdoor air (OA), and exhaust air flows measured in Kuujjuaq Forum’s HVAC system [32].
2.3. Existing Solar PV System
As seen in Figure 1, the case study building is equipped with a PV system that was installed and commissioned in 2021 and has been running at its full capacity since May 2023. The installation is composed of six inverters (four at 17.5 kWp and two at 15 kWp maximum power), each one connected to four series of 16 modules (335 Wp; Canadian Solar CS1H-335MS [34]), giving a maximal power of 128.6 kWp without considering the inverters and 100 kWp with the inverters. The total PV surface is about 648 m2, and electricity generation can be either directly use by the building or sent to the local microgrid. Electrical use is monitored, and daily reports can be accessed with data on the building’s electricity consumption, the electricity generation from PV system that is used by the building, the PV electricity generation that is exported to the local grid, and the building’s electricity consumption from the grid. To study the Forum’s average electricity energy balance over one year, we treated the data as follows; values from 1 January to 30 April are taken from 2024’s data, as the system was not running at its full capacity during this period in 2023; from 1 May to 21 October are the mean of 2023 and 2024’s data; and from 22 October to 31 December are based on 2023’s data, as 2024’s data were not yet available. Figure 3 displays the annual profiles obtained with Forum’s total daily electricity consumption, the electricity generated daily by the PV system that is directly used by the building, and the PV system’s daily electricity generation sent to the local grid. A clear demarcation of electricity use is visible between the summer and winter periods, corresponding to the operation of the ice rink and heating system. On average, the Forum’s electricity demand amounts to 2296 kWh/day in winter and 851 kWh/day in summer. Reports provide daily data where we can see that, on some days, PV electricity generation was both used by the building and exported to the grid. During those days, electricity was exported to the grid when PV electricity generation exceeded building’s needs. On average, Kuujjuaq’s Forum total annual electricity needs amount to 626,090 kWh, of which 80,320 kWh were provided by the PV system and the rest were provided by the grid. The PV system produced on average a total of 99,760 kWh annually, of which 19,440 kWh were sent to the grid. In total, 81% of the renewable energy produced by solar panels was used instantly on site and this production enabled the building to be self-sufficient for 13% of its total electricity needs. With a maximum installed power of 128.6 kWp, we obtain an annual yield of about 776 kWh/kWp for the Forum’s location, which includes system loss.
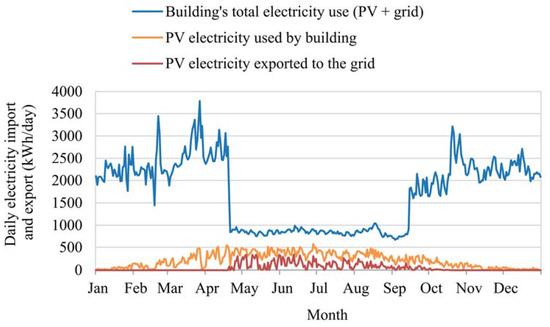
Figure 3.
Kuujjuaq Forum’s average daily electricity energy balance over one year.
A PV system is subject to various losses between the electricity produced by the panels and the electricity delivered to the building or the grid. These losses are caused by several factors: cables, power inverters, dirt or snow accumulation, power degradation over panel’s lifetime, etc. These losses are generally approximately 14% [35,36]. With the web application PV-GIS for Kuujjuaq location and the existing PV system (128.6 kWp capacity, 10° slope, and 30° azimuth), we estimate the system loss to be around 20% to match the observed yield of 776 kWh/kWp. The literature shows that snow accumulation can generate losses between 0.2 and 20% [37].
3. Methods
3.1. Heating Load Estimation for Domestic Hot Water
Consumption data obtained from oil bills includes space heating and DHW. As ground-source heat pumps can hardly supply 100% of a building’s thermal load, this study focuses on space heating, and the energy demand associated with DHW has been estimated and subtracted from the heating load profile.
In the Forum, DHW is used for washrooms and showers, and for ice rink surfacing. For washrooms and showers, we estimate 40 users per day, who would each use the shower once and the sink for hand-washing twice, consuming respectively 26.5 L and 1 L of hot water, i.e., 1140 L per day. Assuming 20 days per year when the building is closed (holidays) or at very low attendance rate and that the building occupancy is reduced by half outside the hockey season, the energy demand for showers and washrooms is estimated to be 23,950 kWh per year. One ice rink resurfacing consumes approximately 375 L, and we assume five resurfacings per day during the hockey season, lasting from September to April. Hence, the energy demand for ice rink resurfacing would be 26,350 kWh per year. The total energy demand for DHW is estimated to be 49,300 kWh per year, i.e., 9% of the total energy use for heating. Then, the estimation of monthly heating load for DHW was subtracted from the Forum’s monthly heating consumption based on oil bills. The results are shown in Figure 4.
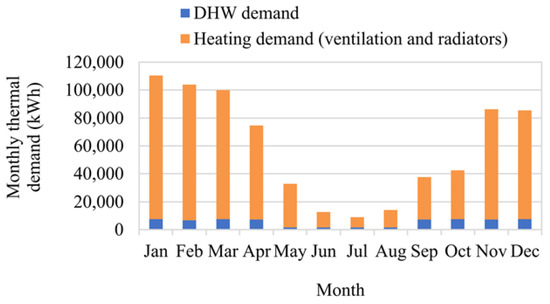
Figure 4.
Forum’s monthly heating consumption, including estimated load for DHW (blue) and remaining load for radiators and ventilation (orange).
3.2. Building Model and Heating Load Profiles
Five distinct thermal zones were created using Google Sketchup 8 design software (version 3.0.14354): arena (ARENA); gymnasium (GYM); 1st floor facilities (OFF1) including offices, changing rooms, washrooms, and shower; 2nd floor facilities (OFF2) including offices, conference rooms, and washrooms; and basement (BSMT), where the electrical and mechanical rooms are located. The building shape was simplified, respecting the window-to-wall ratio (WWR) for each orientation. Building’s windows are low-E double-glazed, except for the eastern part where they are low-E triple glazed, giving a ratio of 17/83 between double and triple glazing, respectively. The total surface floor area is 5892 m2. The structure was imported in the building energy software TRNSYS 18 (version 18.00.015) using the plugin TRNSYS 3D and Type56 unit. Figure 5 and Figure 6 show the 3D views and footprint of the building model, respectively. The annual heating load was modeled using known building characteristics (Table 3). As on-site meteorological measurements for the period 2020–2023 were not available, Meteonorm database from the Kuujjuaq airport meteorological station was used as a typical meteorological year. The HDD18 value for one year in Kuujjuaq, using Meteonorm data, is 8575. A TRNSYS simulation year is therefore overall colder than the observed years from 2020 to 2023, with HDD18 ranging between 7197 and 8176. Kuujjuaq is a remote location and access to quality weather data can be challenging in such location.

Figure 5.
3D Views of Forum’s Sketchup simplified model.
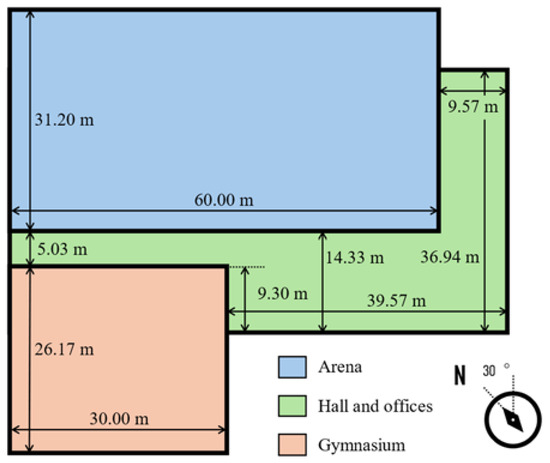
Figure 6.
Sketchup simplified building’s first floor footprint, dimensions, and orientation (second floor footprint is identical).

Table 3.
Forum’s thermal envelope and HVAC system characteristics.
The maximum capacity of the heating system was set to 536 kW, equivalent to the two boilers of 268 kW each already installed in the building. Schedules were defined for occupation, ventilation, lighting, equipment, and heating. Data from the electrical room provided us information on the daily average electricity consumption, which was around 2255 kWh/day during the 2023 to 2024’s winter and 988 kWh/day for 2023 summer. These electrical loads include the electricity used for ventilation and heating equipment, such as fans and pumps. Thus, these values were used to calculate internal loads from lighting and equipment. Electric loads were distributed proportionally between thermal zones, based on floor area, zone type (office, sport center, mechanical room), and standard values for internal load taken from Chapter I.1 of the Quebec Construction Code.
In the present project, we focused our model design and our analysis on the heat demand from the ventilation system. The arena has its own air heating system supplied by waste heat from the ice rink compressors and it is not taken into account in our analysis. Hence, we only considered heating demand for GYM, OFF1, OFF2, and BSMT’s ventilation systems. Supply air flow rates from Table 2 were used as input. Air flow n°8 that serves building’s east addition was evenly split and added to OFF1 and OFF2’s air flow. Table 4 sums the supply air flow rates for each TRNSYS zone. The ratio of outdoor air to the total air supply and the infiltration rate was used as adjustment variables to match the real data from oil delivery bills.

Table 4.
Forum air handlers’ characteristics: spaces delivered and air flow rate supplies.
The ventilation model is divided into two parts: preheating system and terminal heating system. The aim of this system is to bring air at room temperature, i.e., 20 °C. The air heating system is modeled with Type 670 “Heating coil with hot-side bypass to keep air-side outlet below setpoint”. The preheating setpoint temperature is 5 °C. Then, preheated air is mixed with air return from the thermal zones and the terminal temperature setpoint is fixed to 20 °C for all zones, except the basement at 14 °C. In this configuration, the heat generation source does not need to be specified in the software. The entire heating capacity, within the imposed 536 kW limit, is used to reach the 20 °C setpoint. Figure 7 shows a diagram of the TRNSYS model with the various heating loads and setpoint temperatures.
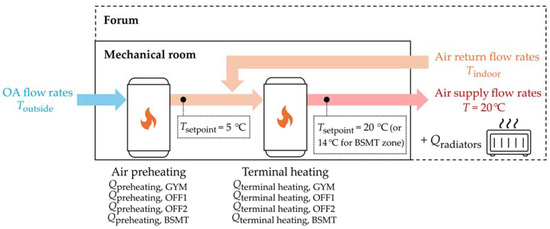
Figure 7.
Diagram of TRNSYS building model with various heat loads calculations and temperature setpoints.
3.3. Geothermal Heat Pump (GHP) Sizing and Modeling
Different load profiles for ventilation heating were then used to size the borefield made of closed-loop GHEs: total ventilation heating load (preheating and terminal heating), preheating load only (about 70% of the total air heating load), and terminal heating only (about 30% of the total air heating load). For the last two scenarios, we assume that the remaining heating demand is met by the existing oil boiler system. Borehole sizing was made with Versa GLD [38], an internal cross-platform software for quick comparison analysis of GCHP exchanger system. This software uses Bernier [39] equation to estimate the total length of the borefield:
where L (m) is the total borehole length; Qg,h, Qg,m, and Qg,y (W) are the peak hourly ground load, the highest monthly ground load, and the yearly average ground load (heating), respectively; Rb (m °C W−1) is the effective borehole thermal resistance, calculated according to the multipole model [40]; R10y, R1m, and R6h (m °C W−1) are the effective ground thermal resistance corresponding to 10 years, one month, and six hours ground loads, respectively, calculated according to the finite line source equation [41]; Tm and Tg (°C) are the mean temperature of fluid in the borehole and the undisturbed ground temperature, respectively; and Tp (°C) is the temperature penalty for the interference of adjacent bores. The spatial superposition principle is used with the finite line source equation to evaluate the thermal interference caused by adjacent GHEs and calculate the temperature penalty given in Equation (1).
Different parameters like heat load, borehole design, heat pump inlet maximum temperature, and number of boreholes were assessed to study the impact on the borehole depth. Space between two boreholes was set to six meters. Table 5 summarizes the different scenarios tested. Borehole designs were based on drill rigs commercially available in Kuujjuaq. A heat pump with a working range adapted to the cold temperature of the North was used. ASHRAE’s Geothermal Heating and Cooling guide [42] recommends a source-side entering fluid temperature (EFT) between 6 °C to 11 °C below average ground temperature. Knowing that conventional heat pumps operate down to approximately −7 °C, we choose two different operating scenarios to stay in a conservative approach: −3 °C and −5 °C as a limit for EFT. The same three different heat load scenarios as before were also tested: total ventilation heating load, only air preheating load, and only air terminal heating load. The building loads Qb,h, Qb,m, and Qb,y (W) for each scenario were calculated according to simulation results and are detailed in Section 4.1. Qb,h, Qb,m, Qb,y are the peak hourly heating load, the highest monthly heating load, and the yearly average heating load of the building, respectively. Versa GLD uses these values as input, with HP’s COP and minimum HP inlet temperature, to estimate ground loads in Equation (1).

Table 5.
Scenarios for borehole sizing [16].
The obtained borefield length estimations were then used as an input value for the GHP system model in TRNSYS 18 (Type 557a). Table 6 describes the input parameters for the geothermal system. The “high efficiency” design from Table 5 was used for borehole dimensions. A scaling factor SF is used to simulate several heat pumps connected in parallel. In this model, the scaling factor at each time step is calculated according to the following equation:
where is the mass flow rate of the heat carrier fluid of the building side (kg s−1), is the fluid heat capacity (J kg−1 K−1), and (°C) are the entering and leaving fluid temperature on building side, respectively, and (W) is the rated capacity of the heat pump.

Table 6.
GSHE system main input parameters in TRNSYS 18.
The maximum SF value over the simulation time indicates the minimum number of heat pumps in parallel required to fulfill heating demand. This factor can be reduced if the used heat pumps have a higher rated heating capacity.
3.4. SAGCHP System Sizing and Modeling
As mentioned earlier, increasing buildings’ electrical load with heat pumps powered by diesel power plant can be counterproductive. The use of geothermal heat pumps in northern Canada is only worthwhile if they are at least partly powered by a renewable energy source, like solar energy. When designing a SAGCHP in a remote subarctic region relying on diesel for electricity generation, it is important to determine the project’s viability by evaluating the potential of meeting the electricity demand of the heat pumps with the PV system. As detailed in Section 2.3, Kuujjuaq Forum is already equipped with a PV system of approximately 776 kWh/kWp, installed on a part of the roof, designated Zone 1 (Z1) in Figure 8. The average annual electricity generation profile from Z1 PV system was presented in Section 2.3, and is the sum of the profiles “PV electricity used by building” and “PV electricity exported to the grid” in Figure 3. Our model assumes that the current PV electricity generation from the existing system in Z1 remains dedicated to the building’s existing electrical consumption and is not allocated to the GCHP. To increase the renewable energy available for powering a GCHP system, we considered installing additional PV panels on the unused roof area, designated as Zone 2 (Z2). The current used area Z1 is approximately 1110 m2, with a panel occupation ratio of 0.58. Based on this ratio, we estimated that unused area Z2, which represents around 2370 m2, could accommodate an additional 1385 m2 of PV panels, approximately 2.14 times the currently installed area. Z2 system maximum power capacity, thus, goes up to 275 kWp. Using the power intensity (kWh m−2 generated) of the existing system Z1 in 2023 and 2024, we can calculate the estimated electricity generation profile for the additional panels on Z2 for the same period, as represented in Figure 9 “Additional PV panels” profile. These profiles are based on monitoring reports and have a daily time step that neglects potential mismatch during the day, as we saw in Section 2.3 (Figure 3). PV electricity generation at peak during midday may exceed HP needs but fail to meet HP requirements during evening or night. To address this, we simulated the system in TRNSYS, allowing for finer time step and better accounting for these mismatches. Table 7 details the parameter input used in Type 103 unit “Photovoltaic Array”. The simulated PV electricity generation from TRNSYS model has been calibrated on Figure 9’s “Z2 theoretical PV generation (based on Z1 data)” profile and adjusted to reach the lowest root mean square error (RMSE). The results are plotted in Figure 9, under “Z2 theoretical PV generation (based on TRNSYS model)” label. As these profiles are all derived from real data observed for system Z1, it is important to mention that they already include the system losses (cables, inverters, snow, etc.) which were estimated to account for 20% in Section 2.3. The final aim is to use the TRNSYS model profile to evaluate the solar energy penetration, or solar energy coverage, of the additional system Z2. The penetration P represents the fraction or percentage of energy demand of a building covered by solar energy. In this case, the energy demand considered is the ventilation preheating load.
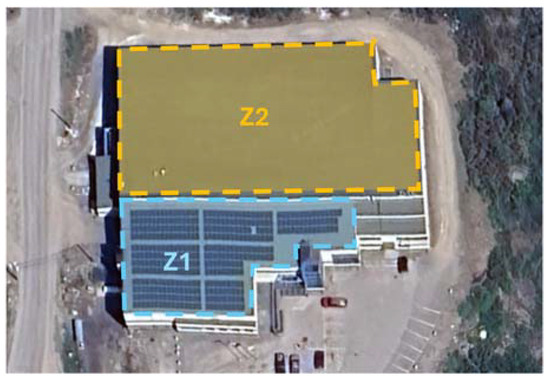
Figure 8.
Aerial photograph of Kuujjuaq Forum. Z1 is dedicated zone for current solar panels system and Z2 is remaining available roof surface.
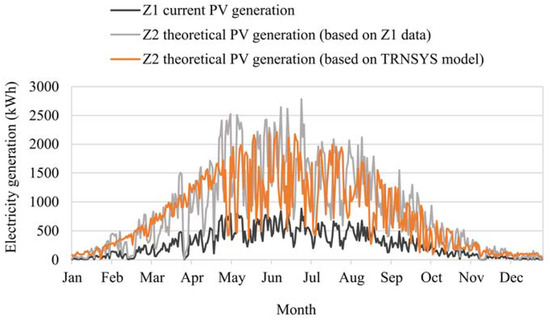
Figure 9.
Energy generation profiles for current PV system (Z1), theoretical additional PV system (Z2), and TRNSYS PV system model.

Table 7.
PV system main input parameters in TRNSYS 18.
3.5. GHG Emissions and Costs Analysis
Ultimately, we wanted to study the impact of such a new SAGCHP system, and compare the amount of emissions emitted, in tons of CO2 equivalent (tCO2eq), and the cost for two cases. The first scenario (Case 1) is the current real-life state which is the building with solar panels (Z1), and the second scenario (Case 2) is the proposed SAGCHP system with additional solar panels on the entire roof (Z2). We assume an efficiency of 80% for Forum’s oil boiler, 30% for power plant generators, and the COP for the heat pumps obtained from the simulations. For GHG emissions analysis, an emission factor of 2.65 kgCO2e/L was chosen for oil used by space heating and by the local power plant [33]. For economic analysis, we followed the approach of Moreno et al. [21] and Gunawan et al. [15] by calculating the Net Present Cost (NPC). The NPC represents the current value of all future costs from a project over its lifetime, and it was chosen to evaluate and compare the different scenarios over a period of 25 years. Considering the initial investment costs and the annual cashflow with recurrent and operational costs, it is calculated as follows:
where N (years) is the analysis time period, n (year) is a time point during the time period, Ct,n (CAD) is the net cashflow at the end of the nth year, and r is the discount rate (6% [43]).
In this article, the cashflow only considers cost expenses, so the result will be a negative value that highlights the least expensive scenario. Energy costs considered for the study are the unsubsidized rates, meaning that it does not represent an individual cost to consumers, but rather a general societal cost. Electricity real generation costs in Kuujjuaq are approximately CAD 0.86/kWh before subsidy [44], and heating oil unsubsidized cost was considered CAD 2.13/L [8]. For the capital cost, we assume that the purchase of equipment includes new equipment as well as the replacement of old equipment. Table 8 summarizes the lifetime and the purchase cost for each equipment. For shipping, we applied the rates of NEAS cargo shipping company of approximately CAD 572.25/ton [45]. The weights considered were: 127 kg for an oil tank [46], 225 kg for a heating oil boiler [47], 300 kg for GSHP [21], and a weight ratio of 15 kg/m2 was assumed for solar panels. The installation costs were calculated considering the installation time of each equipment and the average hourly wage for a technician in Kuujjuaq (CAD 36.87/h [48]). Installation time on site is estimated to be 8 h for the oil tank, 16 h for the heating oil boiler, and 16 h for the heat pump. The installation price for PV panels is included in the purchase cost of the equipment. The price of drilling in Canada’s North is subject to many uncertainties, so we first considered a worst-case scenario with a cost of CAD 300/m [15,21], including labor and heat exchanger pipes. For solar panels price and installation costs, values vary from CAD 2.65 to 3.42/W in Quebec [49]. We considered a higher price of CAD 5/W for Kuujjuaq, due to the remoteness [21]. The aim is to assess the price point at which drilling or solar panels would become economically attractive. Maintenance cost is assumed to be CAD 4.4/m2/year of the building for the heating oil boiler [50], CAD 1.34/m2/year of the building for the GCHP [50], and CAD 200/year for the solar panels.

Table 8.
Price and lifetime of equipment used in economic analysis.
4. Results
4.1. Building’s Heating Demand Profiles
The TRNSYS 18 energy simulation of the building gives an annual load of 518,827 kWh for space heating only (ventilation and radiators, excluding DHW), corresponding to an energy intensity of 129 kWh/m2. The area considered includes spaces heated with boilers only and the arena area which is heated by heat recovery is excluded. Adding the estimate energy consumption for DHW (Section 3.1), the total annual heat load amounts to 574,286 kWh (143 kWh/m2), close to the real mean observed of 573,182 kWh. The value of 143 kWh per m2 of heated surface area is lower than other values from previous studies showing a heating demand between 180 kWh/m2 and 350 kWh/m2 in Nunavik [22,23]. This discrepancy may be due to uncertainties over actual Forum consumption (possible missing bills), and to the fact that the literature values relate to a different building typology, semi-detached residential buildings. Figure 10 overlays the annual profile generated by the model onto the actual annual profile obtained with oil bills. Parameters like the infiltration rate or flow rate of outdoor air intakes were used to adjust the heating load profile in order to get closer to the observed data. Optimal fitting is obtained with an infiltration rate of 0.4 air change per hour and outdoor air ratio of 18% for GYM, 16% for OFF1, 16% for OFF2, and 10% for BSMT. Again, remaining gaps may be caused by uncertainties in invoices (delivery date, missing bills, etc.) and operational changes.
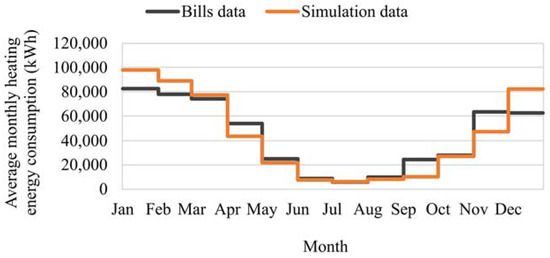
Figure 10.
Forum’s average monthly energy consumption for space heating (ventilation and radiators) from bills’ data and model’s simulation.
Table 9 presents the energy consumption for each step of ventilation heating and for each thermal zone. Figure 11 details the heating demand month by month over the year. We can observe that the heating load from air preheating is significantly higher than the load from terminal heating, particularly in winter. The gymnasium is the zone that requires the most heating, as it has the highest air flow rate. For the basement, the preheating and mixing with the hot return air is enough to bring air temperature to the set point of 14 °C. Thus, terminal heating for this thermal zone is negligible.

Table 9.
Total air heating, preheating, and terminal heating loads for each thermal zone of building for one year simulation.
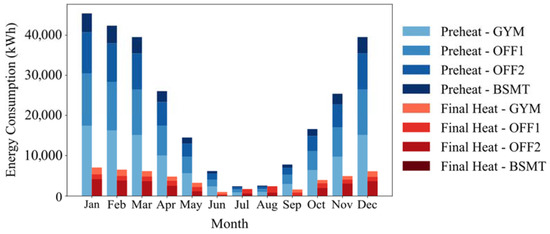
Figure 11.
Energy consumption by thermal zone for air preheating and terminal heating.
Table 10 presents Kuujjuaq’s Forum loads for air heating, with the peak hourly heat load Qb,h, the highest monthly heat load Qb,m, and the yearly average heat load Qb,y. These values are extracted from the air heating profile and are used as input in Versa GLD to size the borefield. Air preheating load and terminal heating load account for approximately 70% and 30%, respectively, of the total air heating load. In the next section, the three following heat loads are considered for GHE sizing: the total ventilation load, only air preheating, and only air terminal heating.

Table 10.
Peak hourly building load Qb,h, highest monthly building load Qb,m, and yearly average building load Qb,y for each heat load scenarios.
4.2. GHP Sizing and Performance
Figure 12 illustrates the required borehole depth to meet the ventilation heat demand, according to the number of boreholes, the fraction of heat load covered, the borehole design, and the maximum ground fluid temperature accepted in the heat pump. As a reminder, the “−5 °C inlet temperature” scenarios are close to the lower operational limit or conventional heat pumps, while the “−3 °C inlet temperature” scenarios provide a more conservative approach. Sizing solutions were generated using Versa GLD, with target depths between 150 and 200 m. The results indicate that the borehole design has a minor impact on the required depth, whereas the inlet fluid temperature significantly influences the borehole depth needed to meet the loads.
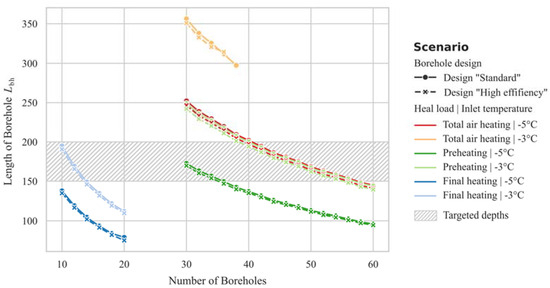
Figure 12.
Borehole depth according to number of boreholes, heating load covered, borehole design, and maximum heat pump inlet temperature accepted.
Results for the different heat load scenarios are:
- Air preheating load: System with more than 40 boreholes and a minimum depth of 200 m can meet the load, regardless of the inlet fluid temperature. With 40 boreholes of 200 m, the total borehole length represents 8000 m.
- Terminal air heating: A smaller borefield with fewer than 20 boreholes of 200 m or less is sufficient. In these conditions, the total borehole length does not exceed 4000 m.
- Total air heating: Meeting the load requires significantly deeper boreholes if we choose an inlet temperature limit of “−3 °C”. Pushing the system to a limit of “−5 °C” allows having a borehole depth closer to feasible levels while meeting the heat demand. A minimum of 40 boreholes is required not to exceed 200 m depth.
Considering a 6 m space between boreholes, the borefield area remains compact and under 2000 m2 in all scenarios (except “Total air heating|−3 °C”) and would fit within the parking lot area in front of the building.
For the next stage of analysis, the more realistic scenario was considered: the GCHP system supplies the air preheating demand, accounting for approximately 70% of the ventilation total heating load and 47% of the total heat demand (ventilation, radiators and DHW). We assume that the terminal heat demand is met with the oil boiler. TRNSYS 18 was used to evaluate GCHP operation over a 25-year dynamic simulation. In Figure 13, different borefield sizes are compared to evaluate the viability of the system. For 150 m-depth with 40 to 80 boreholes, EFT drops below the temperature limit after 10 to 14 years of operation. For higher depth, ranging from 170 to 200 m, a minimum of 8000 m of total system length is required for viable operations, ensuring that the EFT remains above the operational limit of −7 °C for conventional heat pump. For all size scenarios, the heat pump system can generate the 268,200 kWh of annual heat required to meet the air preheating load. This reduction in heating load on the oil boiler could save 31,128 L of fuel per year, representing a 53% reduction on the observed average (Table 1). The GCHP shows an annual energy consumption of 77,980 kWh, with a mean COP of 3.44 ± 0.09 and reaches a total capacity of 88.30 kW. On Figure 14, we can see that the heat transfer from GCHP system still matches the air preheating load over the 25th year of simulation, and for every 30 min simulation time step, the load is fully met.
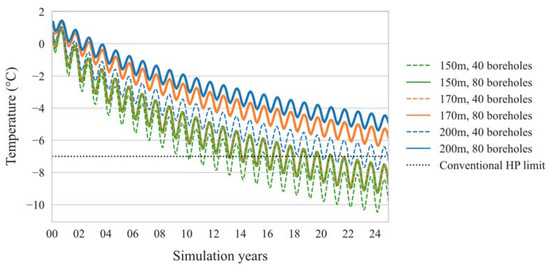
Figure 13.
Evolution of entering fluid temperature (EFT) when supplying preheating load and considering different GHE size. “150 m, 80 boreholes” and “170 m, 40 boreholes” lines overlap.
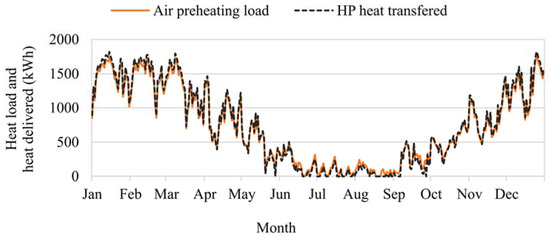
Figure 14.
Geothermal heat pump heat transfer (24-h time step) and air preheating loads over last year of 25-year simulation, from building and SAGCHP model.
4.3. SAGCHP System Sizing and Performance
Results from the previous section demonstrate that preheating air with a suitably sized GCHP system can be a viable option for the Forum. The next step is to assess if the heat pump electrical demand can be met by the proposed PV system addition, in Z2 (Figure 8). As explained in Section 3.3, this study assumes that the current building’s own consumption from the PV system remains the same, and only the new Z2 theoretical panel area is used to meet the GCHP electricity demand. The simulation time step was set to 30 min. Figure 15 exposes the result of the simulation, with the GCHP system daily energy consumption and the PV system daily electricity generation. As expected, there is a gap between the heat pump needs and the solar energy generation during the winter period. On the other hand, in summertime, PV electricity generation largely exceeds the heat pump needs. This production–demand mismatch is common at high latitudes and has already been mentioned in previous papers [51]. During one simulated year, the modeled Z2 PV system of 275 kWp generates 192,940 kWh of electricity, giving a yield of 702 kWh/kWp, similar to the one observed for Z1 existing system. Of that generated electricity, 23,770 kWh can be used to supply the GCHP. We assume that when the solar electricity generation exceeds HP needs, energy is sent to the local grid. Thus, a total of 169,170 kWh would be transferred to the local grid annually. For each 30 min time step simulation, the penetration rate, i.e., the fraction of PV electricity used directly by GCHP, is calculated. Mean monthly penetration values above 50% can be observed from April to July, with a peak value of 60% in May. Table 11 presents the results for Z2 PV model’s electricity generation, GCHP model’s electricity demand, and the mean penetration, for annual and seasonal period. Overall, the results show a penetration of 22% during winter (December to February), 52% during early spring (March to May), 58% during spring (June), 45% during summer (July to September), and 29% during fall (October and November; seasons were defined according to Itulu [52]). Even during wintertime when the heat load is the highest, but the solar irradiance is at its lowest, the PV system is still capable of meeting a significant fraction of the GCHP electricity demand. Adding these values to Z1 PV system average data reported in Section 2.3, we obtain a PV system (Z1 and Z2) that can generate around 292,700 kWh annually, as seen on Figure 16. Increasing the solar power on the roof comes with an increase of exceeding energy going from 19,440 kWh surplus in the current Z1 system’s real operation to 188,600 kWh in the proposed scenario with Z1 and Z2 systems. The issue of the mismatch between renewable energy generation and energy demand in buildings is a real challenge in the North and is discussed in Section 5. The literature shows that various proposed solutions are being studied, including battery storage and re-injection into the local grid [14,18,19,20,21].
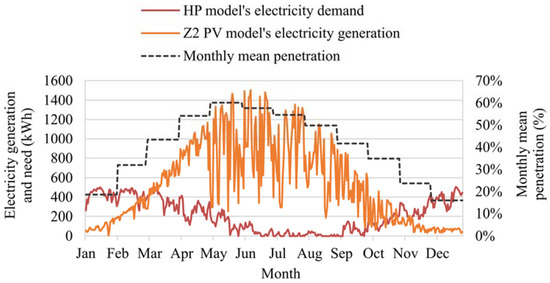
Figure 15.
GCHP model’s daily energy demand and Z2 PV panels model’s daily electricity generation, alongside monthly mean penetration.

Table 11.
Annual and seasonal values for total solar energy generation of theoretical Z2 PV system, GCHP energy requirements, and mean penetration.
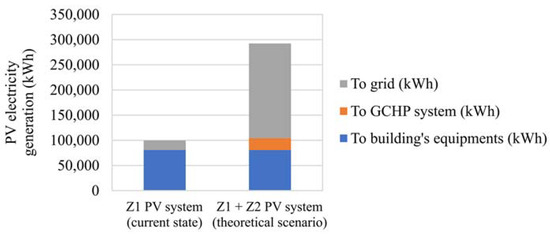
Figure 16.
PV panels electricity generation distribution for current state (Z1 system only) and proposed SAGCHP system (Z1 and Z2 systems).
4.4. GHG Emissions and Cost Analysis
Finally, we want to study the impact of such a new SAGCHP system, and compare the amount of emissions emitted, in tons of CO2 equivalent (tCO2eq), and have an estimation of the project’s cost through NPC. Table 12 summarizes and compares the costs, the energy use and the GHG emissions for both scenarios, current real-life state and proposed SAGCHP system. At the building scale, the use of a SAGCHP reduces the annual heating load provided by the boiler by 268,200 kWh, but also increases the annual electricity demand of the building by 53,910 kWh as the solar energy does not meet the entire energy demand of the heat pump. Regarding heating and electricity consumption, results show that implementing a SAGCHP system still reduces the GHG emissions by 38.3 tCO2eq (6% decrease) each year and decreases the annual energy cost by CAD 19,930 (3% decrease). When expanding the analysis to the community scale, the solar energy surplus exported to the grid increases GHG emissions reductions to 176.7 tCO2eq (28% decrease) and energy cost savings to CAD 164,960 (27% decrease), assuming the same credit for injecting surplus as the real electricity cost of CAD 0.86/kWh in Kuujjuaq [44]. This highlights the environmental and economic benefits of grid integration.

Table 12.
Summary of costs for 25-year economic analysis, annual heating loads according to energy source (boiler or geothermal), and GHG emissions for Case 1 and Case 2 scenarios.
For the NPC calculation, we first considered the scenarios at building scale, i.e., without considering the solar energy surplus that could be exported to the grid. With a drilling cost of CAD 300/m and a PV system cost of CAD 5/W, the 25-years financial analysis on the SAGCHP scenario (Case 2) shows an NPC of CAD −12,065,060 which is higher than the NPC of CAD −8,119,790 for the current oil boiler and PV system (Case 1). This means that Case 2 scenario would be less economically viable. To go further, several combinations of PV and drilling costs and their impact on NPC were analyzed, at both building and community scale. Tested PV costs ranged from CAD 1 to 6/W installed and drilling costs from CAD 60 to 360/m. Results show that no matter the PV or drilling cost, the SAGCHP project does not achieve a competitive NPC compared with the current scenario. Then, looking at the community scale, the project profitability is more interesting, as we also include the benefits of transferring solar energy surplus to the grid. Figure 17 presents the percentage of return on investment (ROI) that is achieved after the 25-year analysis. The dashed lines mark the project’s profitability boundary: Case 2’s scenarios to the left of the line are more attractive than business as usual (Case 1) with a lower NPC and a positive percentage of ROI achieved; Case 2’s scenarios to the right of the line are less attractive than business as usual, with a higher NPC and no ROI. With a drilling cost of CAD 300/m, Case 2’s NPC cannot be competitive with Case 1. If we consider reducing the PV cost to Quebec’s average value of CAD 3/W, the drilling cost should not exceed about CAD 130/m to make the project attractive. The drilling cost appears to be to have the most influence on the capital cost, and thus on the project viability.
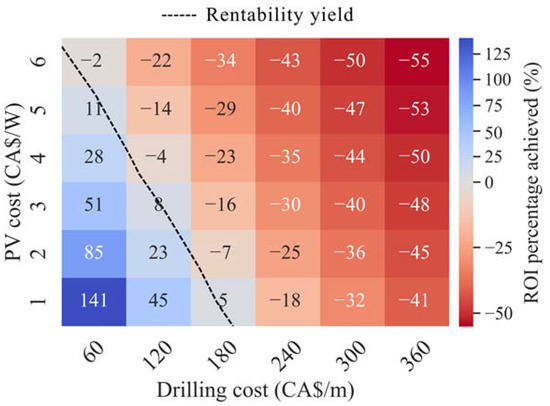
Figure 17.
Percentage of return on investment (ROI) achieved at community scale for different combinations of drilling and PV systems costs.
However, the economic challenge of such a project in Northern Quebec is known and the financial metrics calculated here need to be put in perspective. Additional factors can strengthen the option in favor of a sustainable energy transition. First, the project aligns with growing policy support for clean energy initiatives in northern communities and could surely qualify for government incentives and grants that could significantly improve the financial viability. Second, as carbon prices fluctuate over time in Canada, a SAGCHP system enables the building to increase its energy self-sufficiency and to withstand future carbon tax increases. And, most importantly in Nunavik context, the SAGCHP system as well as other sources of local renewable energy can enhance building’s energy security by reducing dependence on oil deliveries and price increases. The environmental and social benefits, combined with potential for additional policy support, make it a worthwhile investment for the building’s long-term sustainability and operational stability.
5. Discussion
The implementation of SAGCHP system in northern remote communities present both promising opportunities and significant challenges that warrant careful consideration. This discussion examines the key findings of our study while considering limitations and future research directions.
Regarding the simulation methodology, some limitations should be considered when interpreting the results. The use of Meteonorm weather data from TRNSYS 18 documentation provides a standardized basis for analysis but may not fully capture the actual 2020–2024 climate conditions in Kuujjuaq. Also, the Arctic region is highly sensitive to climate change and Nunavik is expected to experience significant changes in weather conditions in the coming years [27,53,54]. Future studies would benefit from using real-year weather data or climate prediction models to enhance the reliability of the building’s simulation results. The model’s accuracy can also be influenced by uncertainties in building operation parameters, including occupation fluctuations, occupants’ behavior, manual settings, ventilation flows, real heat consumption patterns, and other values that can deviate from theoretical assumptions. This gap between model’s predictions and building’s real energy use is known as energy gap and is the subject of numerous research projects aimed at reducing it [55,56,57].
Due to Nunavik’s extreme climate conditions, the severe imbalance between ground heat extraction and injection periods is identified as a substantial challenge in implementing a GCHP system [18,19]. This imbalance affects the long-term stability of ground temperatures and system performance. Seasonal thermal storage strategies emerge as a potential solution to address this thermal imbalance, as well as the characteristic mismatch between energy demand and solar energy generation in northern regions. One recommended solution for maintaining a balanced soil temperature could be to use the heat from the ambient air during the hottest periods of summer to inject it into the soil. That aspect has not been simulated in this study as we choose to analyze the viability of the system under the most demanding conditions, without heat reinjection. A robust GHE system was designed and assessed to provide operational temperatures above or close to the minimum allowed for conventional heat pumps throughout the system’s lifetime. For the solar PV system, the module’s power degradation over its lifetime and its impact on annual yield has not been considered in our 25-year analysis. A large analytical review [58] found that PV panels lose about 0.5% of power capacity per year of operation. Thus, in a 25-year analysis, PV modules’ performance would go down to about 88.5% of the original power, with an average of 94% performance over the 25 years period. This consideration could be added in further studies.
Previous research confirmed that ventilation heating and in-floor heat delivery are the most relevant way to use geothermal energy, as they can function with low temperatures around 30–50 °C, unlike baseboard heat emitters that requires fluid temperatures of 60–80 °C [10,13].
The management of excess solar energy generation presents other options:
- Utilizing excess energy from the additional PV system for auxiliary building’s electricity loads, and thereby reducing grid dependency.
- Adding battery storage systems for time-shifting solar energy use, especially during non-daylight hours. However, the associated costs of batteries remain an important consideration despite the ongoing improvements and price reductions of the technologies. At a community scale, Moreno [20] analyzed several scenarios and showed that adding batteries and increasing their capacity does not significantly increase the GSHP independence but represent a large increase in NPC for systems in Nunavik. From additional simulations, he concluded that obtaining credit form injecting surplus electricity into the grid seems a more cost-effective strategy than battery storage. It is important to mention that these conclusions are specific to the context of a remote northern community where electricity from the grid is powered with a diesel plant.
The most interesting solution, therefore, is to adopt a community-wide vision by exporting excess power back to the local grid, creating mutual beneficial arrangements between building owners, local grid operators and community users. While biomass represents one of the most attractive techno-economic alternatives to diesel [59], communities remain dependent on imports, unlike geothermal energy which increases energy independence. Moreno [20] showed that an energy mix supply, like a combination of geothermal, photovoltaic, and biomass systems, is the most interesting option to ensure reliability and carbon emission reduction. During 2024, in Fairbanks, the Alaska campus was running one third on their horizontal ground loop system, one third on a biomass boiler, and the final third on a diesel boiler [11]. Other studies demonstrate that the rentability of a GSHP system significantly varies according to fuel oil prices [12,60]: when oil costs are high, GSHP systems allow for more savings compared to a conventional oil boiler. Hence, an optimal solution can be found using thoughtful energy mix to significantly reduce GHG emissions: solar and geothermal energy to benefit from local renewable energy and increase sovereignty, and biomass energy to support and fill the gaps left by the first two. This study aims to fill the gap in knowledge regarding arctic and subarctic building’s energy consumption, solar PV system electricity generation, and shallow geothermal heat pump systems. Deep geothermal systems were not discussed here but are also promising solutions for sustainable energy in the North, and several pilot projects are underway in Canada [61,62].
Over the past decades, melting sea ice in the Canadian Arctic and development of northern communities has led to an increase of fuel consumption and shipping, and the risk of oil spills has multiplied. Whether they occur offshore or on land, these oil spills have catastrophic consequences for ecosystems, societies and the economy, and they are recognized as serious issues by governments of USA, Canada, and Russia [63,64,65,66]. Reducing oil consumption in communities by developing local and renewable energy sources is the first step to tackle this problem.
The results of this study can be applied to other regions presenting similar climate conditions. Data on building’s heat loads are useful for areas presenting similar temperature normal (−5.4 °C [27]), HDD18 (8523 [28]); data on PV panels electricity generation can be applied for communities located around the same latitudes (58°); while results on GCHP design would be mostly appropriate in sporadic and discontinuous permafrost areas like Kuujjuaq [67]. This is the case of other subarctic regions found in Canada and within the Yukon and Northwest Territories. Conclusions on GCHP performance might not be relevant for regions facing more severe arctic climate and continuous permafrost, like in Nunavut (Canada), for example. The type of heat and power distribution network is also important. Results and conclusions of this study will be useful for remote communities that rely on integrated and local energy system, like in Canada, Alaska, Greenland, and part of Russia. Scandinavian countries, Iceland, and some areas in Russia are typically connected to a national grid, hence, the strategies for decarbonization might be different.
Eventually, as mentioned earlier, the economic viability of SAGCHP system in remote northern communities must be evaluated within the context of rising energy costs, carbon pricing policy, environmental benefits, social benefits of local energy generation, and increased energy independence.
6. Conclusions
This study addresses an important knowledge gap regarding building energy consumption and renewable energy integration in Nunavik, which can be applicable to other remote arctic to subarctic regions. The article focuses on analyzing the heating demand of the Kuujjuaq’s Forum (Nunavik, Québec). A building model was developed to investigate and quantify the heating demand profiles, with a particular emphasis on ventilation requirements. These profiles were used as input values to size a ground-source heat pump system. Then, a dynamic model of the vertical geothermal heat exchanger was built in TRNSYS 18 and coupled with heat pumps to supply air preheating loads. Eventually, heat pump energy demand was compared to the energy generation of additional PV panels that would cover the entire roof of the building. The findings demonstrate the potential of SAGCHP systems for the Kuujjuaq Forum, with several key outcomes:
- The Forum’s real heating consumption averages 573,180 kWh/year, including radiators, ventilation and domestic hot water. The building model reached similar results with an annual heat demand of 574,290 kWh, corresponding to an energy use of about 143 kWh/m2. Ventilation heating accounts for 381,230 kWh of this load, with preheating (268,200 kWh) and terminal heating (113,030 kWh).
- Analysis confirms that GCHP could be a viable option to manage a significant portion of the ventilation heating load, particularly the air preheating which accounts for 70% of the total air heating demand and 47% of the total heat demand (ventilation, radiators and DHW). The system design indicates that a minimum of 60 boreholes with a borehole depth between 160 and 200 m, corresponding to 9600 to 12,000 linear meters of heat exchangers, would be required to ensure reliable operation within the heat pump’s operational parameters, considering the average ground temperature of 1.8 °C.
- The proposed GCHP system can generate the 268,200 kWh of annual heating to meet the air preheating demand, avoiding 31,128 L of fuel annually. The system demonstrates an average COP of 3.44 and shows a maximum capacity of 88.30 kW to meet the requirements. Of the 77,980 annual kilowatt-hours of electricity required by the heat pump, approximately 23,773 kWh could be supplied by an additional PV system of around 1380 m2 and 275 kWp. This system’s annual penetration averages 37%. Seasonal analysis reveals average solar energy coverage of 22% during winter and a peak average penetration reaching 53% during early spring.
- Despite an important investment cost, the economic and environmental analysis suggests that the SAGCHP could enable CAD 19,940 and 38 tCO2eq savings per year at building scale. The yearly benefits go up to 177 tCO2eq and CAD 164,960 savings if the analysis is extended to the community scale, taking into account solar energy exports from the PV system to the grid.
Assumptions about the proposed additional panels on the total surface of the roof were made. However, the building may have structural constraints that prevent the installation of more panels. If this is the case, another surface should be considered to increase the number of solar panels and therefore the system’s capacity to power GCHP installation.
To conclude, this research provides unprecedented data and contributes to the understanding of heating and electricity consumption patterns in subarctic non-residential buildings, while also providing valuable insight on integrated PV systems performance. The results indicate that SAGCHP system can be technically viable for large-scale applications in Nunavik, like Kuujjuaq Forum, but still question the economic viability. While the economic challenges of implementing SAGCHP systems in Northern Quebec and other subarctic regions are significant, the combination of several factors such as potential government incentives, protection against rising carbon prices, and enhanced energy security can make it a strategic investment for long-term sustainability and operational stability. Such a project still offers meaningful reductions in both GHG emissions, operational costs, and oil dependence. A forthcoming pilot project, involving the installation of a small-scale GHE connected to the Forum, will provide crucial empirical data to validate the present findings and inform decisions for a full-scale system implementation.
Author Contributions
Conceptualization, A.C. and J.R. (Jasmin Raymond); methodology, A.C.; software, A.C. and J.R. (Jean Rouleau); validation, A.C., J.R. (Jasmin Raymond) and L.G.; formal analysis, A.C.; investigation, A.C.; writing—original draft preparation, A.C.; writing—review and editing, A.C., J.R. (Jasmin Raymond), L.G., A.H.-F. and J.R. (Jean Rouleau); visualization, A.C.; supervision, J.R. (Jasmin Raymond) and L.G.; project administration, J.R. (Jasmin Raymond); funding acquisition, J.R. (Jasmin Raymond). All authors have read and agreed to the published version of the manuscript.
Funding
Preparation of this article was made possible by the INQ Research Chair on Northern Geothermal Potential and the CORMICHAN project. This research was funded by the Institut nordique du Québec (INQ), the Fonds de recherche du Québec—Nature et technologies, and Sentinelle Nord.
Data Availability Statement
The original data presented in the study are openly available in the Borealis database at https://doi.org/10.5683/SP3/GW4LSV (accessed on 29 April 2025).
Acknowledgments
The authors would like to thank the Societe Kuujjuamiut Inc. and Jason Aitchison for their generous hospitality and invaluable assistance throughout our field investigation, providing us with both access to their facilities and continuous support for our research project. Acknowledgments are extended to Mafalda Miranda for support during the field campaign.
Conflicts of Interest
The authors declare no conflicts of interest.
Abbreviations
The following abbreviations are used in this manuscript:
| BTES | Borehole thermal energy system |
| COP | Coefficient of performance |
| DHW | Domestic hot water |
| EFT | Entering fluid temperature |
| GCHP | Ground-coupled heat pump |
| GHE | Ground heat exchanger |
| GHG | Greenhouse gas |
| GSHP | Ground-source heat pump |
| NPC | Net present cost |
| OA | Outdoor air |
| PV | Photovoltaic |
| RSI | Resistance in international units |
| SAGCHP | Solar-assisted ground-coupled heat pump |
| SF | Scale factor |
| WK | Whapmagoostui-Kuujjuarapik |
| WWR | Window-to-wall ratio |
The following variables are used in this manuscript:
| ARENA | TRNSYS thermal zone associated with Kuujjuaq Forum’s arena |
| BSMT | TRNSYS thermal zone associated with Kuujjuaq Forum’s basement |
| Ct,n | Net cashflow at the end of the nth year of the study period |
| GYM | TRNSYS thermal zone associated with Kuujjuaq Forum’s gymnasium |
| L | Total borehole length |
| N | Analysis time period |
| n | A time point during the analysis time period |
| OFF1 | TRNSYS thermal zone associated with Kuujjuaq Forum’s 1st floor facilities |
| OFF2 | TRNSYS thermal zone associated with Kuujjuaq Forum’s 2nd floor facilities |
| Qg,h | Peak hourly ground load (heating) |
| Qb,h | Peak hourly building load (heating) |
| Qg,m | Highest monthly ground load (heating) |
| Qb,m | Highest monthly building load (heating) |
| Qg,y | Yearly average ground load (heating) |
| Qb,y | Yearly average building load (heating) |
| r | Discount rate |
| Rb | Effective borehole thermal resistance |
| R6h | Effective ground thermal resistance corresponding to six hours |
| R1m | Effective ground thermal resistance corresponding to one month |
| R10y | Effective ground thermal resistance corresponding to ten years |
| Tm | Mean temperature of fluid in the borehole |
| Tg | Undisturbed ground temperature |
| Tp | Temperature penalty for the interference of adjacent bores |
| Z1 | Area labelled as “Z1” in Figure 8 |
| Z2 | Area labelled as “Z2” in Figure 8 |
References
- Arctic Council Sustainable Development Working Group (SDWG). Zero Arctic: Concepts for Carbon-Neutral Arctic Construction Based on Tradition; Arctic Council: Tromsø, Norway, 2020; Available online: https://oaarchive.arctic-council.org/handle/11374/2541 (accessed on 2 November 2021).
- Aquilina, E. Arctic Towns in Transition: Norway’s Commitment Towards a New Energy Solution on Svalbard; The Arctic Institute: Center for Circumpolar Security Studies; The Arctic Institute: Washington, DC, USA, 2022; Available online: https://www.thearcticinstitute.org/arctic-towns-transition-norway-commitment-towards-energy-solution-svalbard/ (accessed on 31 January 2025).
- Rud, J.N.; Hørmann, M.; Hammervold, V.; Ásmundsson, R.; Georgiev, I.; Dyer, G.; Brøndum Andersen, S.; Jessen, J.E.; Kvorning, P.; Brødsted, M.R. Energy in the West Nordics and the Arctic: Scenario Analysis; Collection 2018, no. 538, Volume TemaNord; The Nordic Council of Ministers: Copenhagen, Denmark, 2018; Available online: https://norden.diva-portal.org/smash/get/diva2:1250846/FULLTEXT01.pdf (accessed on 31 January 2025).
- Meyer, J.; Pride, D.; O’Toole, J.; Craven, C.; Spencer, V. Ground-Source Heat Pumps in Cold Climates: The Current State of the Alaska Industry, a Review of the Literature, a Preliminary Economic Assessment, and Recommendations for Research; Alaska Center for Energy and Power (ACEP) & Cold Climate Housing Research Center (CCHRC): Fairbanks, AK, USA, 2011. [Google Scholar]
- Natural Resources Canada. Clean Energy for Rural and Remote Communities Program; Government of Canada: Ottawa, ON, Canada, 2024. Available online: https://natural-resources.canada.ca/funding-partnerships/clean-energy-rural-remote-communities-program (accessed on 31 January 2025).
- Environment and Climate Change Canada. Pan-Canadian Framework on Clean Growth and Climate Change: Canada’s Plan to Address Climate Change and Grow the Economy; Government of Canada: Gatineau, QC, Canada, 2016. Available online: https://publications.gc.ca/site/eng/9.828774/publication.html (accessed on 15 October 2024).
- Statistics Canada. 2021 Census of Population—Nunavik Region, Quebec; Government of Canada: Ottawa, ON, Canada, 2022. Available online: https://www12.statcan.gc.ca/census-recensement/2021/dp-pd/prof/index.cfm?Lang=E (accessed on 14 June 2023).
- Régie de l’énergie. Relevé Hebdomadaire des Prix du Mazout Léger par Régions Administratives; Gouvernement du Québec: Quebec, QC, Canada, 2024. Available online: https://www.regie-energie.qc.ca/storage/app/media/consommateurs/informations-pratiques/prix-petrole/publications/Publications-hebdomadaires/releve-hebdomadaire-mazout/mazout.pdf (accessed on 2 July 2024).
- L’Administration Régionale Kativik et Makivvik Annoncent la Prolongation de la Subvention de vie Chère Afin de Stabiliser le Prix de L’essence, Pour les Consommateurs du Nunavik. KRG and Makivvik Corporation: Kuujjuaq, QC, Canada, 2024. Available online: https://www.krg.ca/fr-CA/assets/press-releases/2024/August/Media_Release_KRG_Makivvik_COL_Gas_Subsidy_F.pdf (accessed on 16 January 2025).
- Kolker, A.; Garber-Slaght, R.; Anderson, B.; Reber, T.; Zyatitsky, K.; Pauling, H. Geothermal Energy and Resilience in Arctic Countries; National Renewable Energy Laboratory: Golden, CO, USA, 2022. Available online: https://www.nrel.gov/docs/fy22osti/80928.pdf (accessed on 31 January 2025).
- Rettig, M. Geothermal Heat Pump Case Study: National Renewable Laboratory’s Alaska Campus; U.S. Department of Energy: Washington, DC, USA, 2025. Available online: https://www.energy.gov/sites/default/files/2024-09/geothermal-heat-pump-case-study-alaska-campus.pdf (accessed on 3 February 2025).
- Garber-Slaght, R. Ground Source Heat Pump Demonstration in Fairbanks, Alaska—2021 Update, 8th Year of Operation; Cold Climate Housing Research Center: Fairbanks, AK, USA, 2021. [Google Scholar]
- Garber-Slaght, R.; Stevens, V. Ground Source Heat Pumps in Interior Alaska: Lessons Learned from Installed Systems; Cold Climate Housing Research Center: Fairbanks, AK, USA, 2014; Available online: https://cchrc.org/wp-content/uploads/media/Ground-Source-Heat-Pumps-in-Interior-Alaska.pdf (accessed on 3 February 2025).
- Giordano, N.; Raymond, J. Alternative and sustainable heat production for drinking water needs in a subarctic climate (Nunavik, Canada): Borehole thermal energy storage to reduce fossil fuel dependency in off-grid communities. Appl. Energy 2019, 252, 113463. [Google Scholar] [CrossRef]
- Gunawan, E.; Giordano, N.; Jensson, P.; Newson, J.; Raymond, J. Alternative heating systems for northern remote communities: Techno-economic analysis of ground-coupled heat pumps in Kuujjuaq, Nunavik, Canada. Renew. Energy 2020, 147, 1540–1553. [Google Scholar] [CrossRef]
- Kanzari, I. Évaluation du potentiel des pompes à chaleur géothermique pour la communauté nordique de Kuujjuaq. Master’s Thesis, Université du Québec, Institut National de la Recherche Scientifique (INRS), Québec, QC, Canada, 2019. [Google Scholar]
- Belzile, P.; Comeau, F.-A.; Raymond, J.; Lamarche, L.; Carreau, M. Arctic climate horizontal ground-coupled heat pump. In Proceedings of the Geothermal Resources Council 41st Annual Meeting, Salt Lake City, AT, USA, 1–4 October 2017; pp. 1958–1978. [Google Scholar]
- Maranghi, F.; Gosselin, L.; Raymond, J.; Bourbonnais, M. Modeling of solar-assisted ground-coupled heat pumps with or without batteries in remote high north communities. Renew. Energy 2023, 207, 484–498. [Google Scholar] [CrossRef]
- Langevin, H.; Giordano, N.; Raymond, J.; Gosselin, L.; Bourbonnais, M. Geothermal heat pumps to reduce diesel consumption in an off-grid subarctic community: Comparison of solar assisted systems with optional underground energy storage. Geothermics 2024, 116, 102846. [Google Scholar] [CrossRef]
- Moreno, D. Alternative Heating Solutions for Remote Subarctic Communities: Techno-Economic Analysis of Hybrid Geothermal, Biomass, and Solar Heating Systems in Umiujaq, Nunavik, Canada. Master’s Thesis, Université du Québec, Institut National de la Recherche Scientifique (INRS), Québec, QC, Canada, 2023. [Google Scholar]
- Moreno, D.; Raymond, J.; Gosselin, L. Techno-economic analysis of hybrid solar-assisted geothermal and biomass heating systems in remote subarctic communities (Nunavik, Canada). Energy 2024, 313, 133898. [Google Scholar] [CrossRef]
- Rouleau, J.; Gosselin, L. (Department of Mechanical and Industrial Engineering, Université Laval, Quebec City, QC, Canada) Monitoring and analysis of energy consumption and indoor environment in arctic housing. 2024; (Manuscript in preparation). [Google Scholar]
- Banister, C.; Swinton, M.; Moore, T.; Krys, D.; Macdonald, I. Energy Consumption of an Energy Efficient Building Envelope in the Canadian Arctic. In Proceedings of the Cold Climate HVAC 2018: Sustainable Buildings in Cold Climates, Kiruna, Sweden, 12–15 March 2018; Johansson, D., Bagge, H., Wahlström, Å., Eds.; Springer: Cham, Switzerland, 2019; pp. 29–39. [Google Scholar] [CrossRef]
- Rode, C.; Kragh, J.; Borchersen, E.; Vladyková, P.; Furbo, S.; Dragsted, J. Performance of the Low-energy House in Sisimiut. In Proceedings of the 6th International Conference on Cold Climate—Heating, Ventilating and Air-Conditioning, Sisimiut, Greenland, 16–19 March 2009. [Google Scholar]
- Dehlin, S.; Heincke, C.; Koskinen, P. Passive House Construction Above the Arctic Circle. In Proceedings of the Cold Climate HVAC 2018: Sustainable Buildings in Cold Climates, Kiruna, Sweden, 12–15 March 2018; Johansson, D., Bagge, H., Wahlström, Å., Eds.; Springer: Cham, Switzerland, 2019; pp. 3–15. [Google Scholar] [CrossRef]
- Bhattacharjee, S.; Lidelow, S.; Schade, J. Performance Evaluation of a Passive House in Sub-arctic Climate. In Proceedings of the Cold Climate HVAC 2018: Sustainable Buildings in Cold Climates, Kiruna, Sweden, 12–15 March 2018; Johansson, D., Bagge, H., Wahlström, Å., Eds.; Springer: Cham, Switzerland, 2019; pp. 145–157. [Google Scholar] [CrossRef]
- Canadian Climate Normals 1981–2010 Station Data: Kuujjuaq, Quebec. Government of Canada, Canada. Available online: https://climate.weather.gc.ca/climate_normals/results_1981_2010_e.html?stnID=6095&autofwd=1 (accessed on 17 May 2024).
- Climate Atlas of Canada; Environment and Climate Change Canada: Ottawa, ON, Canada. Available online: https://climateatlas.ca/home-page (accessed on 8 August 2024).
- Langevin, H.; Giordano, N. Thermal Response Test and Assessment of the Shallow Geothermal Potential at the Kuujjuaq Forum; Nunavik, Québec, Deliverable 3—Final Report; Géotherma Solutions Inc.: Québec, QC, Canada, 2022. [Google Scholar]
- Miranda, M.M.; Raymond, J. Assessing Kuujjuaq’s (Nunavik, Canada) Deep Geothermal Energy Potential: Core Analysis, Thermal Properties Characterization and Surface Heat Flux Estimation of a 234 m Deep Geothermal Exploration Well; Report No.: Research report R2109; Institut National de la Recherche Scientifique (INRS): Québec, QC, Canada, 2022. [Google Scholar]
- Natural Ressources Canada. Energy Use Data Handbook 1990–2017; Government of Canada: Ottawa, ON, Canada, 2020. Available online: https://publications.gc.ca/collections/collection_2020/rncan-nrcan/M141-11-2017-fra.pdf (accessed on 2 September 2023).
- Kilborn, I. RETScreen Energy Modelling of Kuujjuaq Community Centre; Sustainable Kingston: Kingston, ON, Canada, 2022. [Google Scholar]
- Transition Energétique Québec. Facteurs d’émission et de Conversion; Government of Quebec: Quebec, QC, Canada, 2019. Available online: https://transitionenergetique.gouv.qc.ca/fileadmin/medias/pdf/FacteursEmission.pdf (accessed on 16 October 2024).
- Canadian Solar Inc. Canadian Solar Datasheet—CS1H-MS; Canadian Solar Inc.: Kitchener, ON, USA, 2020; Available online: https://www.canadiansolar.com/wp-content/uploads/2019/12/Canadian_Solar-Datasheet-HiDM_CS1H-MS_EN.pdf (accessed on 6 June 2024).
- PVGIS Data Sources & Calculation Methods. The Joint Research Centre: EU Science Hub. European Commission, European Union. Available online: https://joint-research-centre.ec.europa.eu/photovoltaic-geographical-information-system-pvgis/getting-started-pvgis/pvgis-data-sources-calculation-methods_en (accessed on 4 April 2025).
- Dobos, A.P. PVWatts Version 5 Manual; Technical Report No.: NREL/TP-6A20-62641; National Renewable Energy Laboratory (NREL): Golden, CO, USA, 2014. [CrossRef]
- Dahlioui, D.; Øgaard, M.B.; Imenes, A.G. Snow impact on PV performance: Assessing the zero-output challenge in cold areas. Renew. Sustain. Energy Rev. 2025, 213, 115468. [Google Scholar] [CrossRef]
- Gosselin, J.-S.; Raymond, J.; Gonthier, S.; Brousseau, M.; Lavoie, J.-F. Nanocomposite materials used for ground heat exchanger pipes. In Proceedings of the International Ground Source Heat Pump Association Conference and Expo, Denver, CO, USA, 14–16 March 2017; Spitler, J.D., Bernier, M., Fang, Z., Gehlin, S., Rees, S.J., Eds.; Open Research Oklahoma: Oklahoma City, OK, USA, 2017; pp. 373–383. [Google Scholar] [CrossRef][Green Version]
- Bernier, M. Closed-Loop Ground-Coupled Heat Pump Systems. Ashrae J. 2006, 48, 12–19. [Google Scholar]
- Claesson, J.; Hellström, G. Multipole method to calculate borehole thermal resistances in a borehole heat exchanger. HVACR Res. 2011, 17, 895–911. [Google Scholar] [CrossRef]
- Philippe, M.; Bernier, M.; Marchio, D. Validity ranges of three analytical solutions to heat transfer in the vicinity of single boreholes. Geothermics 2009, 38, 407–413. [Google Scholar] [CrossRef]
- Kavanaugh, S.; Rafferty, K. Geothermal Heating and Cooling: Design of Ground-source Heat Pump Systems; Report No.: RP-1674; ASHRAE: Atlanta, GA, USA, 2014. [Google Scholar]
- Freyman, T.; Tran, T. Renewable Energy Discount Rate Survey Results 2017; Grant Thornton and Clean Energy Pipeline; Grant Thornton: London, UK, 2018; Available online: https://www.grantthornton.ie/globalassets/1.-member-firms/ireland/insights/publications/grant-thornton---renewable-energy-discount-rate-survey-2017.pdf (accessed on 9 January 2025).
- Hydro-Québec. Plan d’approvisionnement 2014–2023 des Réseaux Autonomes—Annexes; Report No.: Demande R-3864-2013, Document 2; Hydro-Québec: Montréal, QC, Canada, 2013; Available online: www.regie-energie.qc.ca (accessed on 9 January 2025).
- Nunavik Sealift Rates for 2024 Season; NEAS: Montréal, QC, Canada, 2024. Available online: https://neas.ca/wp-content/uploads/NEAS-NUNAVIK-Rates-2024.pdf (accessed on 14 January 2025).
- Oil Tank. The Home Depot. 2020. Available online: https://www.homedepot.com/p/Vertical-275-Gal-Oil-Tank-275VOT/300636041 (accessed on 9 January 2025).
- Boilers. The Home Depot. 2020. Available online: https://www.homedepot.com/b/Heating-Venting-Cooling-Heaters-Boilers/Heating-Oil/N-5yc1vZc4m2Z1z0z70u (accessed on 9 January 2025).
- HVAC Technician Salary in Kuujjuaq, QC. Indeed. 2024. Available online: https://ca.indeed.com/career/hvac-technician/salaries/Kuujjuaq--QC?from=top_sb (accessed on 9 January 2025).
- Urban, R. Cost of Solar Power in Canada 2024; Energy Hub: Brooklyn, NY, USA, 2023. Available online: https://www.energyhub.org/cost-solar-power-canada/#watt (accessed on 9 January 2025).
- Bloomquist, R.G. Chapter 2.8: The economics of geothermal heat pump systems for commercial and institutional buildings. In International Summer School on Direct Application of Geothermal Energy; Washington State University: Washington, DC, USA, 2001. [Google Scholar]
- Dumas, D.; Gosselin, L. Optimizing photovoltaic systems to decarbonize residential arctic buildings considering real consumption data and temporal mismatch. Sol. Energy 2024, 275, 112560. [Google Scholar] [CrossRef]
- Itulu, J. The Inuit Year; Auyuittuq National Park: Nunavut, NU, Canada, 2018; Available online: https://travelnunavut.ca/wp-content/uploads/2018/01/NUN_11556_Infographic_Seasons.pdf (accessed on 9 November 2023).
- Schuur, E.A.; Abbott, B.W.; Commane, R.; Ernakovich, J.; Euskirchen, E.; Hugelius, G.; Grosse, G.; Jones, M.; Koven, C.; Leshyk, V.; et al. Permafrost and Climate Change: Carbon Cycle Feedbacks From the Warming Arctic. Annu. Rev. Environ. Resour. 2022, 47, 343–371. [Google Scholar] [CrossRef]
- Rantanen, M.; Karpechko, A.Y.; Lipponen, A.; Nordling, K.; Hyvärinen, O.; Ruosteenoja, K.; Vihma, T.; Laaksonen, A. The Arctic has warmed nearly four times faster than the globe since 1979. Commun. Earth Environ. 2022, 3, 168. [Google Scholar] [CrossRef]
- Gram-Hanssen, K.; Georg, S. Energy performance gaps: Promises, people, practices. Build. Res. Inf. 2018, 46, 1–9. [Google Scholar] [CrossRef]
- Thompson, D.; Burman, E.; Mumovic, D.; Davies, M. Managing the risk of the energy performance gap in non-domestic buildings. Build. Serv. Eng. Res. Technol. 2022, 43, 57–88. [Google Scholar] [CrossRef]
- Yan, D.; Hong, T.; Dong, B.; Mahdavi, A.; D’oca, S.; Gaetani, I.; Feng, X. IEA EBC Annex 66: Definition and simulation of occupant behavior in buildings. Energy Build. 2017, 156, 258–270. [Google Scholar] [CrossRef]
- Jordan, D.C.; Kurtz, S.R. Photovoltaic Degradation Rates—An Analytical review. Prog. Photovolt. Res. Appl. 2013, 21, 12–29. [Google Scholar] [CrossRef]
- Yan, C.; Rousse, D.; Glaus, M. Multi-criteria decision analysis ranking alternative heating systems for remote communities in Nunavik. J. Clean. Prod. 2019, 208, 1488–1497. [Google Scholar] [CrossRef]
- Pike, C.; Whitney, E. Heat pump technology: An Alaska case study. J. Renew. Sustain. Energy 2017, 9, 061706. [Google Scholar] [CrossRef]
- Indigenous Clean Energy Project Receives over $3.6 Million to Harness the Power of Geothermal Energy; Pacific Economic Development Canada: Terrace, BC, Canada, 2023; Available online: https://www.canada.ca/en/pacific-economic-development/news/2023/10/indigenous-clean-energy-project-receives-over-36-million-to-harness-the-power-of-geothermal-energy.html (accessed on 19 February 2025).
- Tu Deh-Kah Geothermal; Barkley Project Group: Nanaimo, BC, Canada. Available online: https://barkley.ca/project/tu-deh-kah-geothermal/ (accessed on 19 February 2025).
- Heshka, N.E.; Ridenour, C.; Saborimanesh, N.; Xin, Q.; Farooqi, H.; Brydie, J. A review of oil spill research in Canadian Arctic marine environments. Mar. Pollut. Bull. 2024, 209, 117275. [Google Scholar] [CrossRef]
- Afenyo, M.; Ng, A.K.Y.; Jiang, C. A Multiperiod Model for Assessing the Socioeconomic Impacts of Oil Spills during Arctic Shipping. Risk Anal. 2022, 42, 614–633. [Google Scholar] [CrossRef]
- Taillard, V.; Martel, R.; Pasquier, L.-C.; Blais, J.-F.; Gilbert, V.; Mercier, G. Diesel spills under stilted buildings in Canadian Arctic villages: What is the best remediation method? Polar Res. 2022, 41, 7724. [Google Scholar] [CrossRef]
- Filler, D.M.; Reynolds, C.M.; Snape, I.; Daugulis, A.J.; Barnes, D.L.; Williams, P.J. Advances in engineered remediation for use in the Arctic and Antarctica. Polar Rec. 2006, 42, 111–120. [Google Scholar] [CrossRef]
- Obu, J.; Westermann, S.; Bartsch, A.; Berdnikov, N.; Christiansen, H.H.; Dashtseren, A.; Delaloye, R.; Elberling, B.; Etzelmüller, B.; Kholodov, A.; et al. Northern Hemisphere permafrost map based on TTOP modelling for 2000–2016 at 1 km2 scale. Earth-Sci. Rev. 2019, 193, 299–316. [Google Scholar] [CrossRef]
Disclaimer/Publisher’s Note: The statements, opinions and data contained in all publications are solely those of the individual author(s) and contributor(s) and not of MDPI and/or the editor(s). MDPI and/or the editor(s) disclaim responsibility for any injury to people or property resulting from any ideas, methods, instructions or products referred to in the content. |
© 2025 by the authors. Licensee MDPI, Basel, Switzerland. This article is an open access article distributed under the terms and conditions of the Creative Commons Attribution (CC BY) license (https://creativecommons.org/licenses/by/4.0/).