Article

Selective and Mild Transcriptional Modulation of Lectin Genes in Soy Leaves Under Drought Stress

by
Vinicius J. S. Osterne
*,
Rafaela A. F. Leite
,
Benildo S. Cavada
and
Kyria S. Nascimento
*
BioMol-Lab, Department of Biochemistry and Molecular Biology, Federal University of Ceara, Fortaleza 60020-181, CE, Brazil
*
Authors to whom correspondence should be addressed.
Stresses 2025, 5(3), 54; https://doi.org/10.3390/stresses5030054 (registering DOI)
Submission received: 24 July 2025 / Revised: 18 August 2025 / Accepted: 22 August 2025 / Published: 25 August 2025
(This article belongs to the Collection Feature Papers in Plant and Photoautotrophic Stresses)

Abstract

Drought is the single largest abiotic threat to soybean yield, yet the lectin genes that mediate drought perception and signaling in this crop have never been systematically mapped. We reanalyzed the public RNA-seq dataset GSE237798 (Williams 82 leaves, 7-day water withdrawal) with an updated fastp–HISAT2–featureCounts–DESeq2 pipeline and a curated catalog of 359 soybean lectin loci. Of the 127 lectin transcripts showing any drought-dependent shift, only 15 were stringently differentially expressed with substantial fold changes: 7 were upregulated and 8 downregulated. These genes span four families, GNA, legume, LysM and Nictaba-related lectins, and are heavily biased toward lectin receptor-like kinases (11 of 15), pinpointing the plasma membrane as the main control node. Gene Ontology enrichment highlights protein autophosphorylation and signal-transduction terms, and the inspection of AlphaFold models together with established lectin knowledge indicates that G- and L-type lectin domains have largely lost canonical carbohydrate-binding residues, whereas LysM and Nictaba proteins retain conserved folds compatible with ligand binding. The data expose a focused, modular lectin program rather than the broad activation often assumed: most soybean lectins stay silent under drought conditions, and only a defined subset toggles their expression, albeit mildly.

1. Introduction

Soybean (Glycine max L. Merr.) is a cornerstone of global agriculture, recognized as the world’s leading oilseed crop and a top five cultivated food crop, with annual production figures estimated at between 349 and 353 million metric tons [1]. Its cultivation spans vast areas, and production is projected to increase this decade to meet rising global demand This demand is driven by soybean’s several applications: it is a crucial source of high-quality protein (beans containing ~40% protein) and edible oil for human consumption, a primary component in animal feed, and a resource for industrial products like biodiesel [2,3]. However, soybean productivity is significantly constrained by environmental factors, among which drought stress emerges as an important abiotic stress, limiting growth, development, and yield worldwide [4]. The agricultural and economic ramifications are substantial; for example, drought events in Brazil have historically led to average yield losses of 11.65%, equating to an estimated USD 152 billion in lost production over five decades based on 2022 prices [5], while projections for the United States suggest potential yield diminutions of up to 40% over the next 25 years due to extreme heat and drought [6].
Plants have evolved complex molecular and physiological mechanisms to perceive and respond to drought stress, aiming to maintain cellular homeostasis and ensure survival. These responses are polygenic and involve intricate signaling networks. Key adaptations include osmotic adjustment, the synthesis of protective proteins, and the activation of antioxidant defense systems to counteract reactive oxygen species (ROS) accumulation Hormonal regulation, particularly involving abscisic acid (ABA), is central to drought response, mediating processes such as stomatal closure to reduce water loss [7,8].
Among the diverse array of proteins involved in plant stress responses, lectins represent a ubiquitous and functionally versatile superfamily. Defined by their ability to specifically and reversibly bind carbohydrates [9], lectins participate in numerous biological processes, including plant defense against pathogens and herbivores, cell–cell communication, symbiotic interactions, and developmental regulation [10]. Notably, lectin receptor-like kinases (LecRLKs) often act as pattern recognition receptors (PRRs) on the cell surface, perceiving molecular patterns to initiate immune signaling [11]. There is growing evidence implicating various lectin families in mediating plant responses to abiotic stresses, including drought, salinity, and extreme temperatures [12,13], with studies in species like maize showing differential expression of LecRLK genes under such conditions [14]. These proteins, whether cell-surface LecRLKs or intracellular lectins, are thought to contribute to stress adaptation by perceiving external cues, modulating signaling cascades, or influencing gene expression [15]. In soybean, a substantial number of lectin and lectin-like genes have been identified (e.g., 309 genes by Van Holle et al. [16]), and some, like members of the GmWAK family, show responsiveness to abiotic stresses [17]. However, despite this, a detailed characterization of specific soybean lectin genes and their precise roles in drought tolerance mechanisms remains underexplored, with a notable gap regarding which particular lectin genes are differentially regulated under drought and their functional contributions to adaptation pathways.
The reanalysis of publicly available RNA sequencing (RNA-seq) datasets offers a cost-effective and powerful approach to generate novel hypotheses and extract deeper biological insights from existing information. For this study, we utilized the public RNA-seq dataset GSE237798 from the NCBI Gene Expression Omnibus. This dataset, detailed by Peláez-Vico et al. [18,19], investigated the transcriptomic responses of soybean genotype Williams 82 to drought, where plants at the V4 stage were subjected to water withholding for 7 days, with leaf tissues collected for RNA-seq from three biological replicates per condition. The choice of Williams 82, a reference genotype, and the focus on leaf tissue provide a valuable resource for identifying genes responsive to drought.
In this context, this study aims to identify lectin genes that are reproducibly modulated by drought in soybean leaves. While the magnitude of expression changes for some lectins may be modest, their consistent differential expression, coupled with functional and structural bioinformatics, can provide valuable candidates and contribute to a more nuanced understanding of the roles that lectins may play in soybean’s response to drought stress.

2. Results

2.1. Differential Expression and Family Distribution of Lectin Genes Under Drought in Soy

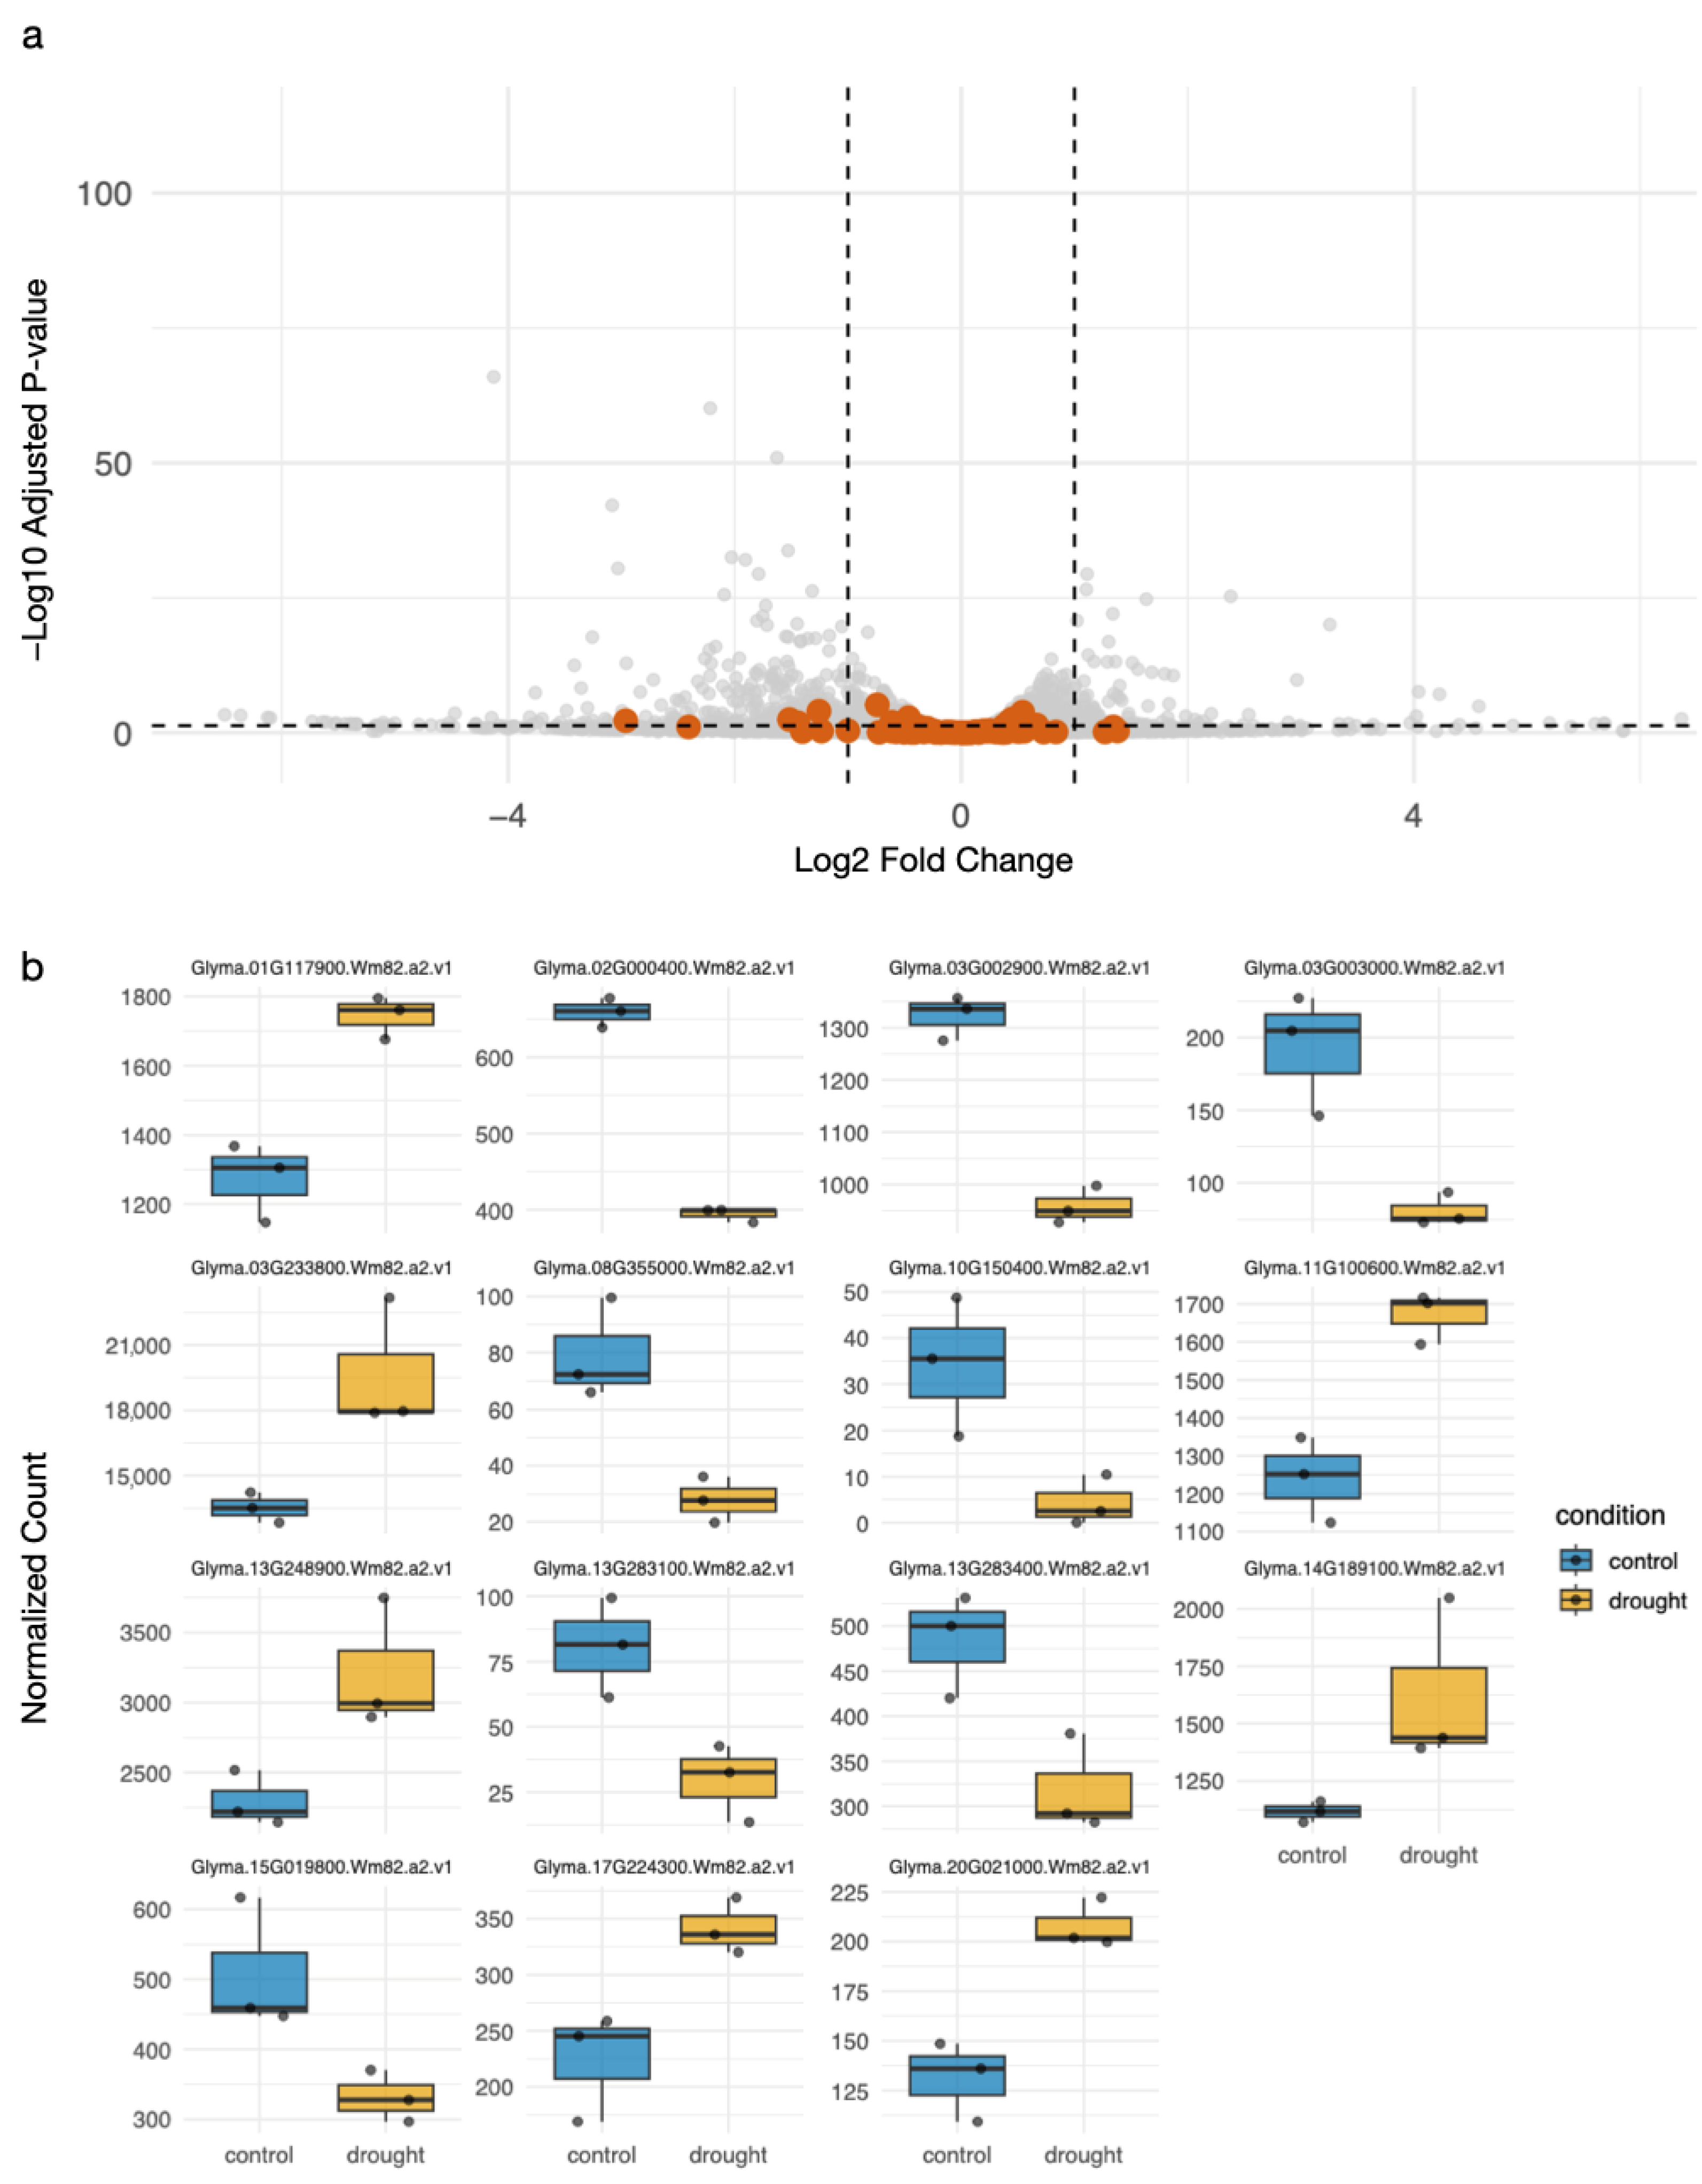
To study lectin gene family responses to drought stress, we first characterized the expression of all lectin genes in Glycine max leaf leaves. A total of 127 lectin genes showed measurable expression variation between conditions, distributed among eight main families: GNA, LysM, legume, Nictaba, CRA, Hevein, Jacalin, and Ricin B (Figure 1a). Subsequent differential expression analysis (adjusted p-value < 0.05) between drought and control conditions pinpointed 15 lectin genes as significantly responsive to drought (Figure 2a). These 15 DE lectins were primarily from the GNA, legume, LysM and Nictaba families.
Family-level analysis of significantly differentially expressed lectins, as depicted by Figure 1b,c, indicated that GNA-type lectins comprised a substantial portion of the DE lectins, followed by legume and Nictaba-related lectins. Among the DE GNA- and LysM-related lectins, more DE lectins were downregulated, while DE legume lectins members were predominantly upregulated under drought. Nictaba family members showed mixed responses with both up- and downregulated DE genes. Reflecting these trends, the average fold changes by family showed that GNA, LysM and Nictaba presented negative expression shifts, whereas legume lectins exhibited positive fold changes (Figure 1c).
The volcano plot highlighting the 15 significant DE lectin genes (Figure 2a) showed that the magnitude of these changes varied: the most pronounced upregulation corresponded to an approximate 5.6-fold increase (log2FC ≈ +2.5), while the most pronounced downregulation showed an approximate 4-fold decrease (log2FC ≈ −2.0). Other DE lectins displayed more moderate fold changes. Expression boxplots for all 15 DE lectins are presented in Figure 2b.
Expression boxplots for all 15 DE lectins (Figure 2b) generally showed clear replicate-level separation in normalized counts between control and drought conditions, indicating the differential expression signals. For instance, genes such as Glyma.01G117900 (GNA-related); Glyma.03G233800 (Nictaba-related); Glyma.11G100600 (LysM-related); Glyma.13G248900 (GNA-related); Glyma.14G189100 (legume); Glyma.17G224300 (legume) and Glyma.20G021000 (Nictaba-related) demonstrated clear drought-induced upregulation with substantially higher normalized counts in drought-stressed plants. Conversely, genes like Glyma.02G000400 (LysM-related); Glyma.03G002900 (GNA-related); Glyma.03G003000 (GNA-related); Glyma.08G355000 (GNA-related); Glyma.10G150400 (Nictaba-related); Glyma.13G283100 (GNA-related); Glyma.13G283400 (GNA-related) and Glyma.15G019800 (LysM-related) were distinctly downregulated under drought.
These results suggest that while a broad range of lectin gene family members are expressed in soybean leaves, only a few exhibit significant transcriptional sensitivity to drought. These responsive lectins are distributed across several families, some of which are known to include receptor-like kinases or proteins active in the apoplast, hinting at their potential roles in drought stress perception and response signaling.

2.2. Transcriptional Clustering Reveals Co-Expression Modules Among DE Lectins

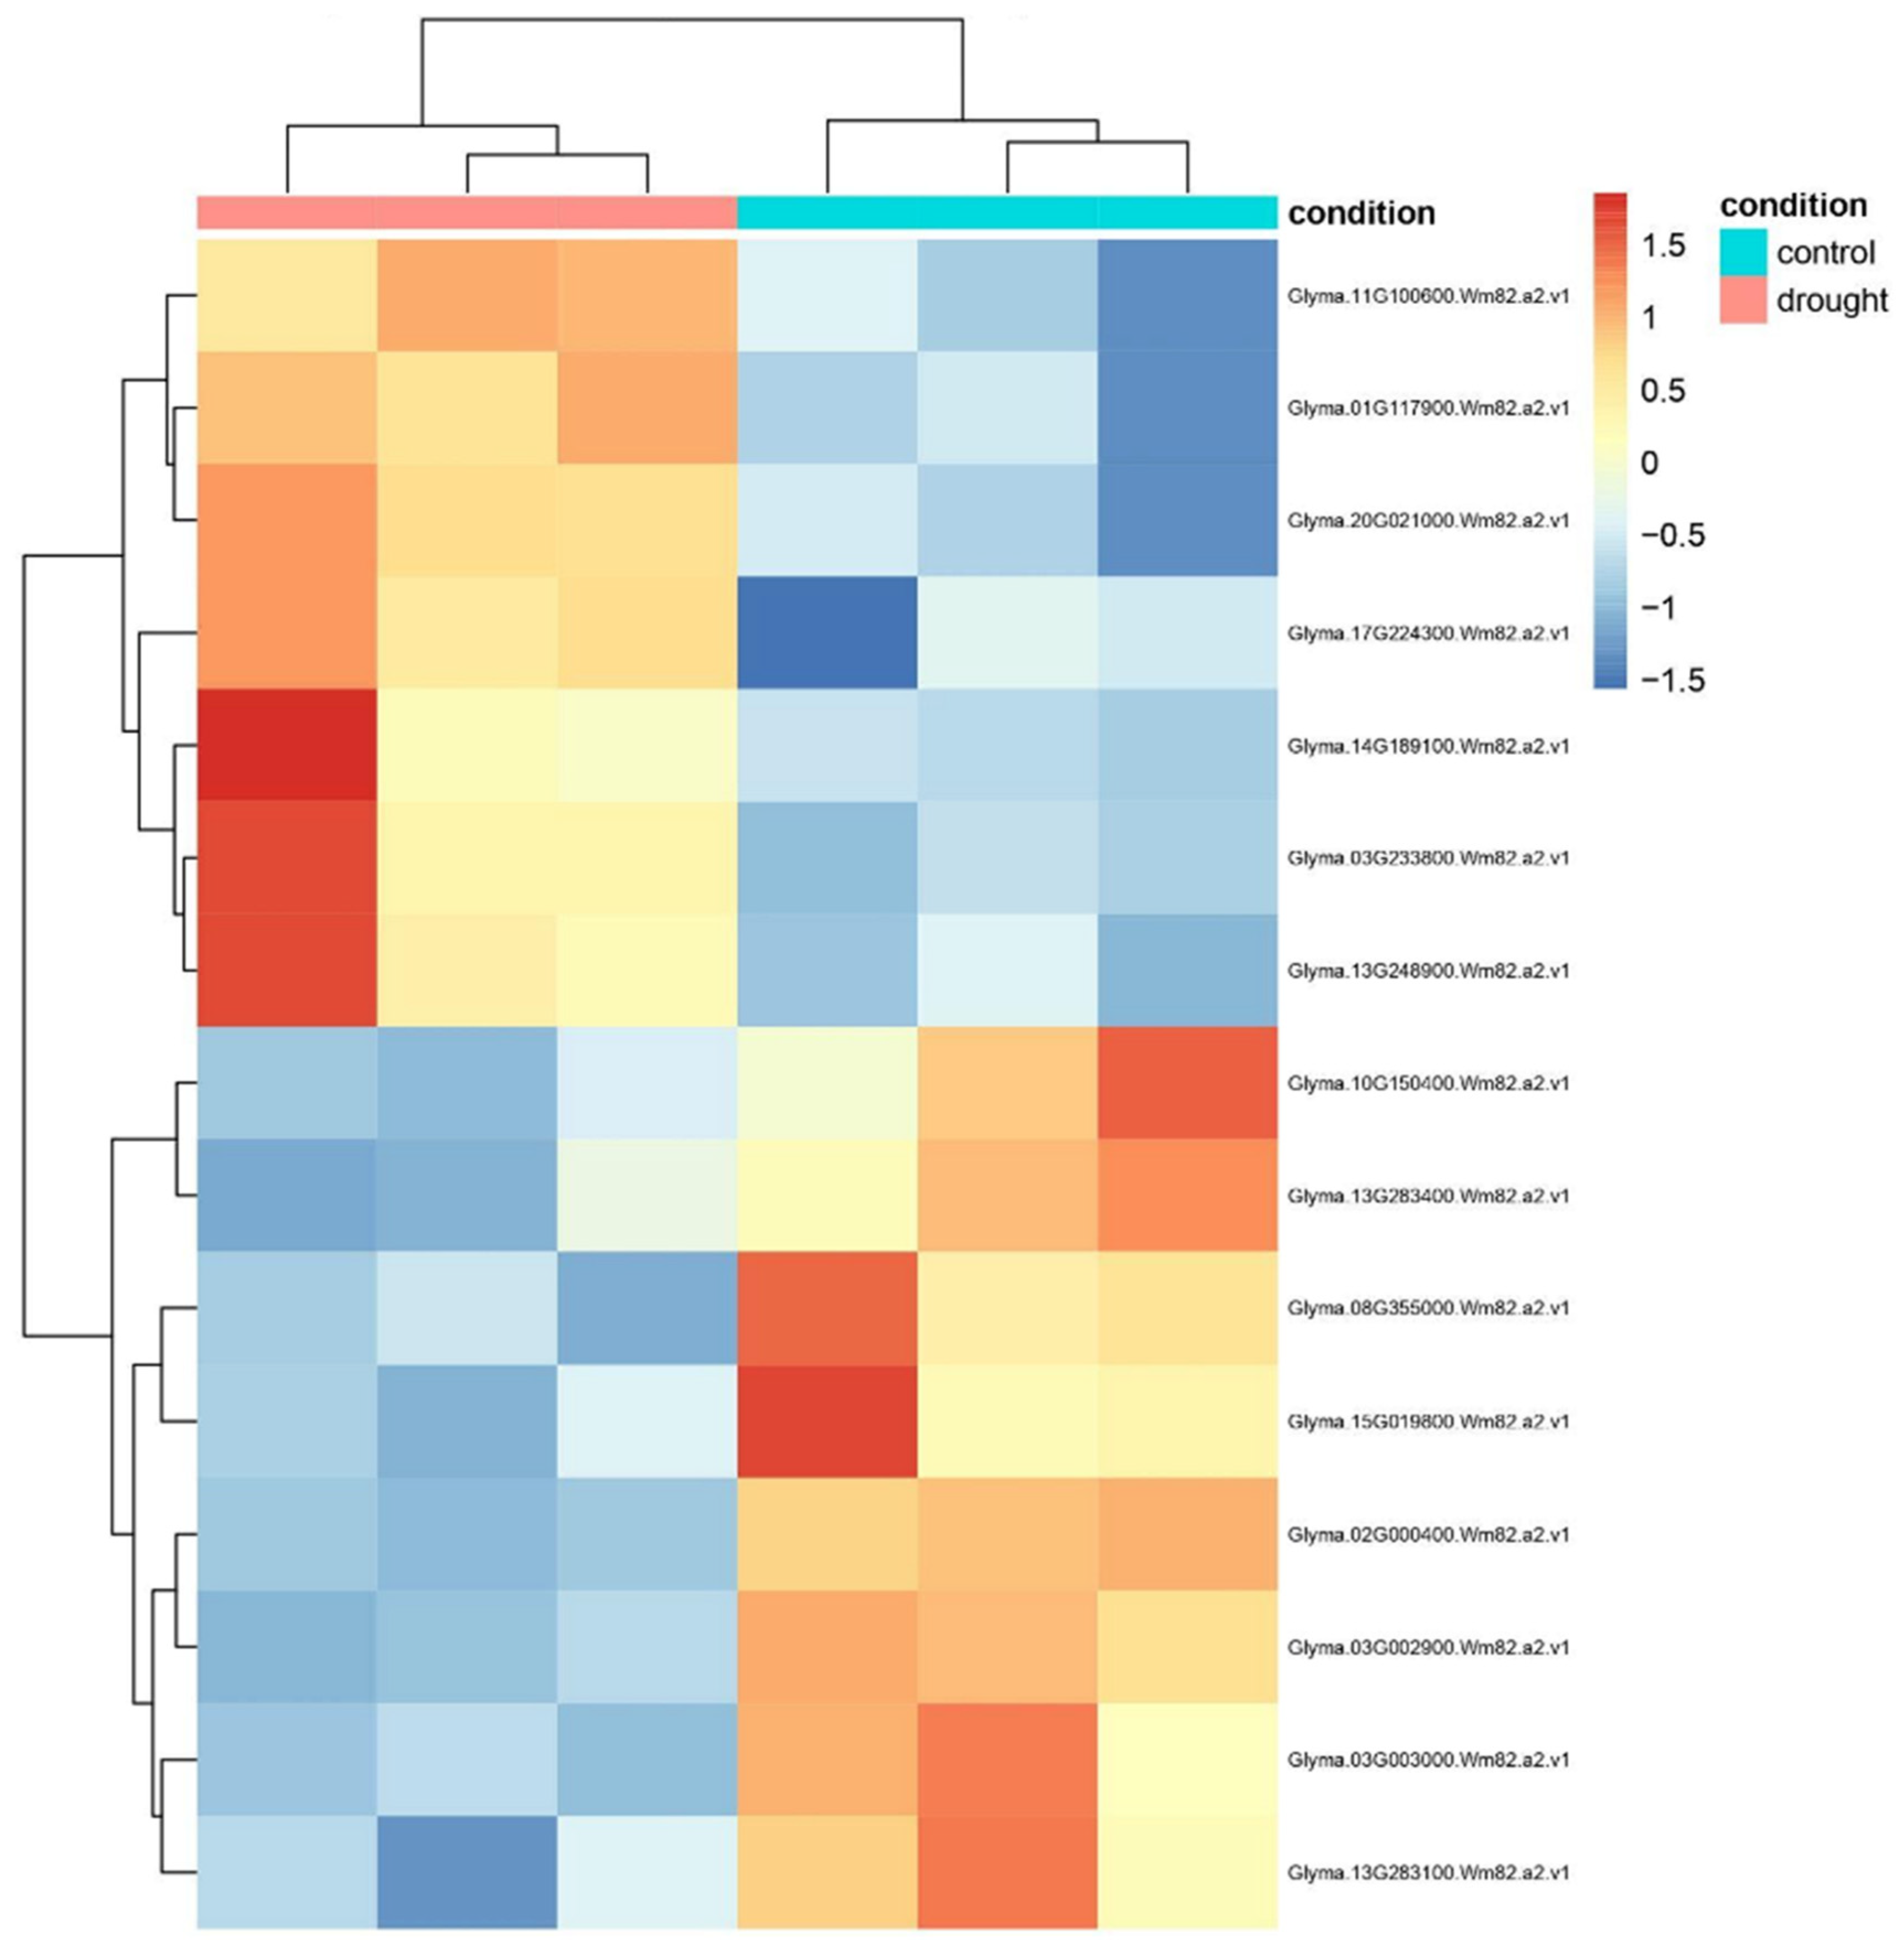
To examine whether differentially expressed lectins exhibit coordinated transcriptional behavior, we generated a heatmap based on Z-score transformed normalized counts across all samples (Figure 3). Sample clustering clearly separated drought-treated and control plants, confirming the consistency of the treatment effect on the lectin transcriptome.
Gene-level hierarchical clustering revealed two major co-expression modules. A cluster of seven lectins showed concerted upregulation under drought, while a larger group of eight lectins was consistently downregulated. This modular structure was not strictly family-specific; both up- and downregulated clusters included members from GNA, LysM, and Nictaba families. This suggests that lectin-mediated responses to drought are not uniform within families but rather driven by specific gene-level regulation.

2.3. Functional Enrichment of Differentially Expressed Lectins Suggests Roles in Signaling and Kinase Activity

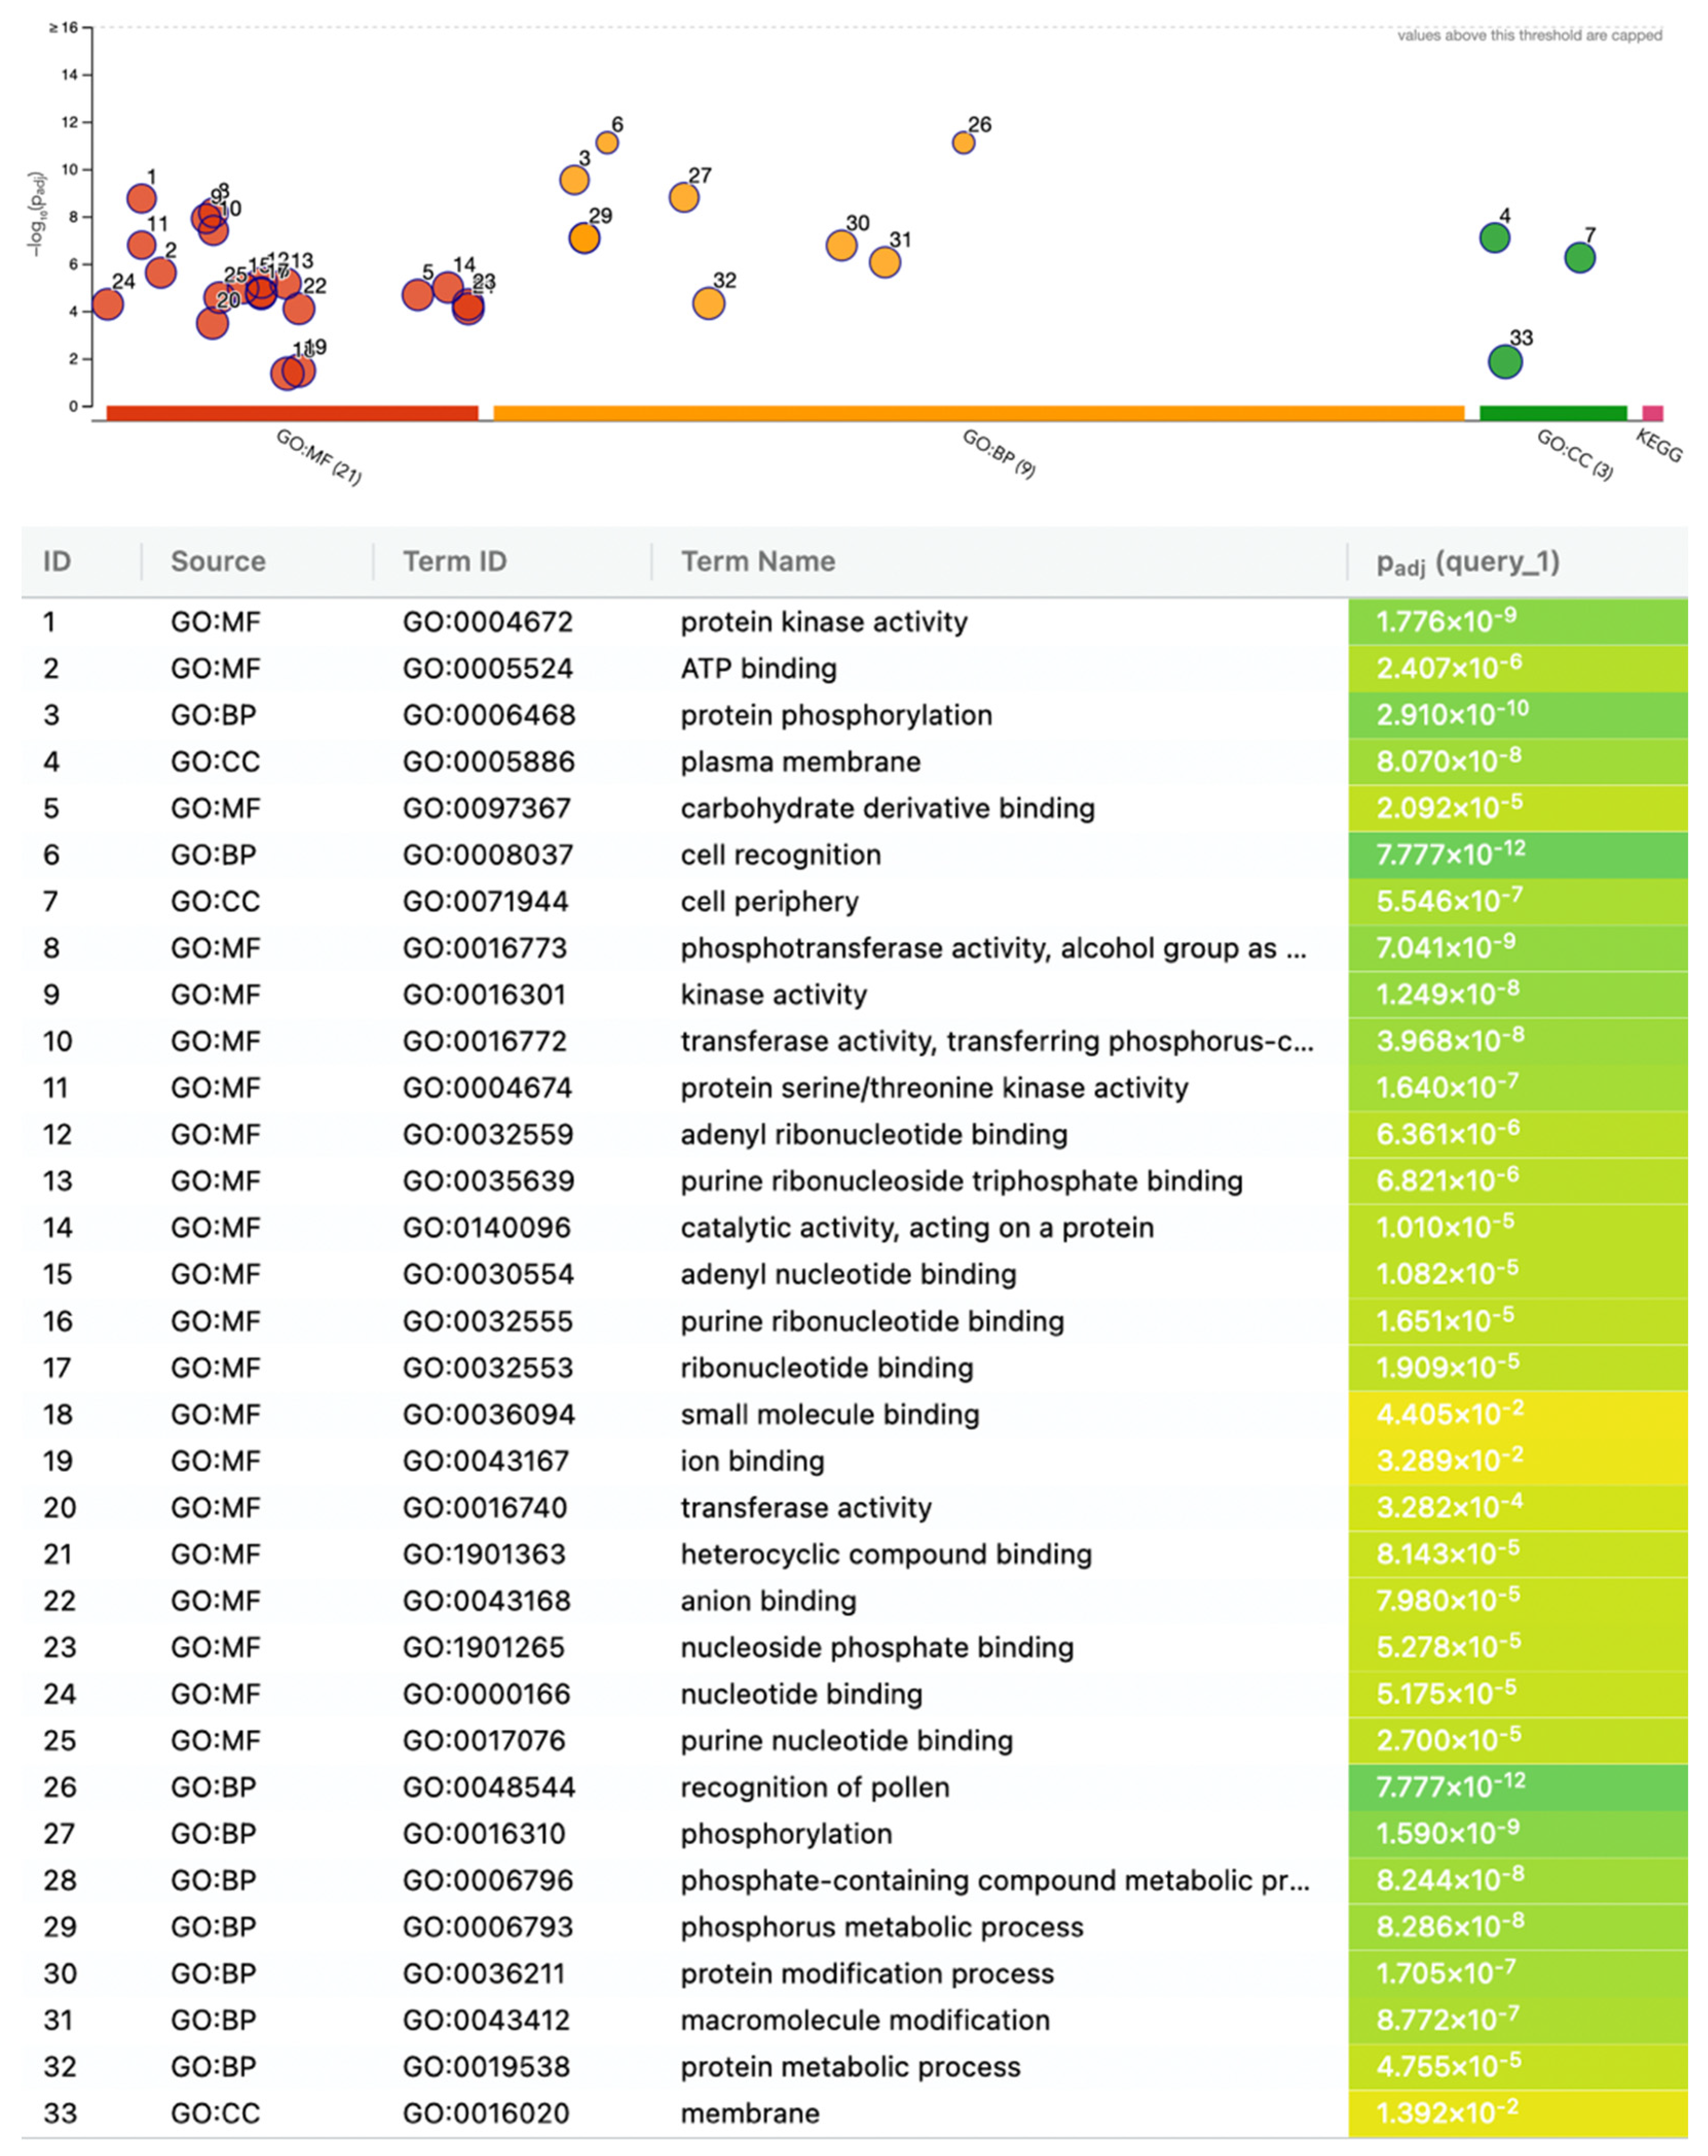
To gain insight into the potential functional roles of the differentially expressed lectin genes, we performed Gene Ontology (GO) enrichment analysis using the Biological Process category. Only the 15 significantly differentially expressed lectins were included in the analysis. Despite the limited gene set, several GO terms were significantly enriched at a false discovery rate (FDR) of <0.05 (Figure 4).

2.4. Domain Architecture, Localization, and Structural Modeling of Differentially Expressed Lectins

To further characterize the potential roles of drought-responsive lectins, we analyzed their domain organization, predicted subcellular localization, and three-dimensional structure. Based on InterPro domain annotations and transmembrane predictions, each gene was classified into one of 2 structural categories: lectin receptor-like kinases (LecRLKs) or soluble lectins (LecPs) (Table 1).
Most DE lectins (11 out of 15) were classified as LecRLKs, spanning G-type, L-type, and LysM-type subgroups. These proteins contain a lectin domain linked to an intracellular serine/threonine kinase via a single transmembrane segment. Three Nictaba-related lectins lacked both transmembrane and kinase domains and were thus classified as LecPs. Localization predictions using SUBA5 placed LecRLKs predominantly at the plasma membrane, while LecPs were predicted to localize to the cytosol, endoplasmic reticulum, or plastid, suggesting divergent roles in extracellular perception versus intracellular modulation.
To gain further structural insight, we generated AlphaFold3-predicted 3D models for the 15 DE lectins from each architectural class. Unsurprisingly, these models revealed folds typical of their respective lectin domains. Notably, most lectin domains of G- and L-type LecRLKs do not retain structurally conserved carbohydrate recognition sites, reinforcing the hypothesis that these proteins may not retain glycan-binding capabilities [9]. LysM-RLKs and LecPs, on the other hand, appear to retain the necessary residues for favorable carbohydrate-binding.

3. Discussion

The reanalysis of the publicly available RNA-seq dataset GSE237798 has identified a distinct set of 15 significantly differentially expressed lectin genes in soybean leaves (genotype Williams 82, V4 stage) subjected to drought stress. These include 7 upregulated and 8 downregulated genes, primarily belonging to the GNA, legume, LysM, and Nictaba lectin families (Figure 1b,c). This focused re-evaluation offers novel insights into the soybean lectin gene families’ response to this critical abiotic stressor. Lectins, a diverse group of carbohydrate-binding proteins, are increasingly recognized for their versatile roles in plant biology, extending beyond classical defense functions to encompass signaling and developmental regulation. Drought, in particular, poses a significant threat to agricultural productivity, with soybean often demonstrating high sensitivity. While soybean possesses a large complement of lectin genes (estimated around 359), this reanalysis indicates that a relatively small but specific subset shows significant transcriptional modulation in leaves under the studied drought conditions, suggesting their potentially integral involvement in soybean’s molecular response. The current study, by focusing on the lectin repertoire, identifies specific drought-responsive lectin candidates in soybean leaves that may not have been the primary focus of the original broader transcriptome survey by Peláez-Vico and colleagues. The differential expression of these 15 lectin genes points towards a targeted modulation within the soybean lectin arsenal as a component of the soy’s strategy to contend with water deficit, rather than a widespread, non-specific alteration across the entire lectin family.
The observed upregulation of 7 specific lectin genes in soybean leaves under drought stress strongly suggests an active defense and adaptation strategy. These induced lectins, comprising members from the legume, GNA, Nictaba, and LysM families, likely function in perceiving drought-induced signals and mediating subsequent protective responses. The structural analysis indicated that most DE lectins (11 of 15) are lectin receptor-like kinases (LecRLKs), consistent with roles in cell surface sensing.
Among the upregulated lectins, members of the legume family were predominant L-type LecRLKs, increasingly implicated in abiotic stress responses. For example, studies in tomato have shown L-type LecRLK expression changes during drought [18]. These lectins can recognize diverse ligands, including non-carbohydrate molecules like extracellular ATP, a known damage-associated molecular pattern (DAMP) released during stress [19]. The upregulation of such LecRLKs could therefore enhance the plant’s sensitivity to damage signals prevalent under drought and could signify a heightened state of surveillance at the cell surface.
Upregulation of a LysM-related lectin is also noteworthy. LysM domains are known for recognizing N-acetylglucosamine (GlcNAc)-containing compounds. While typically associated with biotic stress, drought-induced cell wall damage could release endogenous GlcNAc-containing oligosaccharides, potentially perceived by this upregulated LysM lectin, [20]. Furthermore, upregulated Nictaba-related lectins, classified as soluble LecPs, suggest intracellular roles. Nictaba-like lectins can be nucleocytoplasmic and have been linked to stress tolerance, possibly through chromatin-level regulation or interaction with nuclear proteins [21,22]. Their upregulation alongside membrane-bound LecRLKs would indicate a comprehensive response involving both extracellular perception and intracellular modulation.
The proposed mechanisms for these upregulated lectins include enhanced stress perception and signaling (particularly for the LecRLKs), potential modulation of hormonal pathways, and direct protective functions. The GO enrichment analysis for all 15 DE lectins highlighted supporting the involvement of these upregulated lectins, especially the LecRLKs, in signaling cascades crucial for drought response.
Conversely, this reanalysis identified 8 lectin genes that were significantly downregulated in soybean leaves under drought. These included members primarily from the GNA and LysM families, along with a Nictaba-related gene. Downregulation can represent adaptive mechanisms like fine-tuning stress pathways or energy conservation, or it could be a consequence of stress-induced cellular dysfunction.
The GNA family had the most downregulated members. Given that many G-type lectins are LecRLKs potentially involved in growth processes or biotic stress defense, their downregulation might reflect an adaptive response to conserve resources or restrict growth under water deficit [23,24]. Downregulation of LysM-related lectins and a Nictaba-related lectin also occurred. If these genes are involved in processes that are energetically costly or less critical during acute water scarcity, their suppression could be an adaptive strategy. For instance, some lectins might act as negative regulators of stress tolerance, and their downregulation could de-repress protective mechanisms [25,26]. Hormonal suppression, particularly by ethylene or shifts in the ABA balance, could also contribute to the downregulation of specific lectin genes. It is important to consider that severe drought can lead to metabolic slowdown. However, the clear separation in expression for these 15 DEGs between control and drought replicates (Figure 2b and Figure 3) suggests a regulated response rather than a general, non-specific decline for these particular genes.
The differential expression patterns observed across the GNA, legume, LysM, and Nictaba families indicate their functional diversification in drought response. The soybean lectin response is not uniform; rather, specific members within these families are distinctly modulated.
The GNA family, which contributed the most DEGs (many being downregulated LecRLKs like Glyma.03G002900 but also some upregulated like Glyma.01G117900), highlights functional divergence even within this large family. The legume lectin family members identified (e.g., Glyma.14G189100) were predominantly upregulated LecRLKs, suggesting a key role in sensing apoplastic cues. LysM-domain lectins showed both upregulation (e.g., Glyma.11G100600, an LecRLK) and downregulation (e.g., Glyma.02G000400, also an LecRLK), suggesting varied roles. The AlphaFold modeling indicated that LysM-RLKs are likely to retain carbohydrate-binding ability, which could be relevant for perceiving cell wall-derived DAMPs. Nictaba-like lectins also showed mixed responses, with upregulated (e.g., Glyma.03G233800) and downregulated (e.g., Glyma.10G150400) soluble LecPs. Their predicted cytoplasmic/nuclear localization points to roles in intracellular signaling or regulation, potentially involving chromatin modulation, differing from the plasma membrane-localized LecRLKs. These LecPs are also predicted to retain carbohydrate-binding functions.
The finding that 11 of the 15 DEGs are LecRLKs emphasizes the importance of cell-surface perception and signaling initiation. The GO enrichment for terms related to protein phosphorylation and kinase activity directly supports this. The structural prediction suggests that G- and L-type LecRLK lectin domains may not retain canonical carbohydrate binding sites, unlike LysM-RLKs and soluble LecPs. This observation suggests that some LecRLKs might function through protein–protein interactions or by recognizing non-glycan ligands, broadening their sensory capabilities beyond simple carbohydrate recognition [27]. The three Nictaba-related LecPs, predicted to retain carbohydrate binding, likely act downstream or in different cellular compartments. This diversity implies a sophisticated, multi-layered lectin-mediated response to drought involving both extracellular sensing and intracellular regulatory events.
The structural classifications (LecRLKs vs. LecPs) and predicted localizations (plasma membrane vs. intracellular) provide hypotheses for their mechanisms. For instance, targeting cell-surface LecRLKs could enhance initial stress perception, while modulating intracellular LecPs might affect downstream signaling or protective pathways. The insight from modeling that some LecRLKs may not primarily function via glycan binding while others (LysM-RLKs, LecPs) do, can guide more precise functional studies.

4. Materials and Methods

4.1. RNA-Seq Data Acquisition and Preprocessing

Publicly available RNA-sequencing data for Glycine max leaf tissue under drought and control conditions (n = 3 replicates per group) were obtained from the NCBI Gene Expression Omnibus (GEO) under accession number GSE237798 [17]. Raw paired-end RNA-seq reads were downloaded from the NCBI Sequence Read Archive (SRA) using the SRA Toolkit (v3.1.1) [28]. Initial quality assessment of raw reads was performed using FastQC (v0.12.1) [29]. Adapter trimming and quality filtering were conducted using fastp (v0.24; Chen et al. [30]), with default parameters. Specifically, reads with a Phred score < 20 and reads shorter than 36 bp after trimming were discarded. Adapter sequences were detected automatically by fastp. Summary quality reports were generated for all processed samples.

4.2. Read Alignment and Quantification

The processed high-quality reads were aligned to the Glycine max reference genome (Wm82.a4.v1) using HISAT2 (v2.2.1) [31] with default parameters. Gene-level read counts were generated from the alignment files (BAM format) using featureCounts (v2.0.4) [32]. Reads were assigned to gene features defined in the genome annotation file (GFF3 format; Glycine_max_Wm82.a4.v1.gene_exons.gff3). Only uniquely mapped, properly paired reads were counted. Reads overlapping multiple features were not counted.

4.3. Differential Gene Expression Analysis

Differential expression analysis between drought and control samples was performed using the DESeq2 package (v1.40.2) [33] in R (v4.4.0) [34]. Raw count data were imported into DESeq2. Size factor normalization was applied to account for differences in sequencing depth across libraries. Dispersion estimates were calculated per gene, and a negative binomial generalized linear model (GLM) was fitted to the counts for each gene, incorporating the experimental design (~condition). Wald tests were performed to identify genes differentially expressed between drought and control conditions.
Genes were considered significantly differentially expressed (DEGs) if they exhibited a Benjamini-Hochberg adjusted p-value (Padj) < 0.05. From this initial list of significant DEGs, a subset of genes considered to have high biological relevance, defined as those also exhibiting a|log2; fold change| ≥ 1, was selected for detailed functional analysis and visualization. Genes with low expression (total counts across all samples < 10) were excluded prior to DE analysis. To identify lectin-encoding genes within the Glycine max genome, the identifiers have been taken from [15].

4.4. Gene Ontology (GO) Enrichment Analysis

GO enrichment analysis of the 15 significantly DE lectin genes was performed using gProfiler (accessed in April 2025) [35]. The background gene set was defined as all lectin genes expressed in the dataset (based on normalized counts). Enrichment for GO terms (Biological Process, Molecular Function, and Cellular Component) was assessed using g:SCS multiple testing correction. GO terms with adjusted p-values (Padj) < 0.05 were considered significantly enriched.

4.5. Domain Architecture and Functional Classification of DE Lectins

The protein sequences were analyzed to determine their domain architecture and to classify them into functional categories such as lectin receptor-like kinases (LecRLKs) or soluble/secreted lectins (LecPs). Protein sequences were submitted to InterProScan [36] via the InterPro web server to identify conserved protein domains. The presence and organization of characteristic domains such as carbohydrate-binding lectin domains (e.g., Legume_lectin, GNA, Jacalin), transmembrane domains, and kinase domains were used to assign each DE lectin to an architectural class (e.g., LecRLK if containing lectin, transmembrane, and kinase domains).

4.6. Subcellular Localization Prediction of DE Lectins

The putative subcellular localization of the 15 DE lectin proteins was predicted to provide insights into their potential sites of action. Predictions were performed using SUBA5 [37], by identifying the closest Arabidopsis thaliana homologs (based on BLASTp against the TAIR10 proteome with an E-value cutoff of <1 × 10⁻¹⁰, minimum query coverage of 50%, and minimum sequence identity of 30%). and utilizing consensus experimental and predicted localization data. This homology-based inference relies on the conservation of protein sorting mechanisms between Arabidopsis and Glycine max for orthologous proteins. The presence of signal peptides, indicating entry into the secretory pathway, was additionally assessed using SignalP (v 6.0) [38] to aid localization interpretation.

4.7. Structural Modeling and Comparison

The protein sequences of the 15 DE lectin genes were modeled using AlphaFold2 [39] via the ColabFold implementation [40]. Predicted structures were selected using the pLDDT confidence metric. Structural imaging was performed using PyMol v.3.1.4.1 (Schrödinger, LLC, New York, NY, USA).

4.8. Data Visualization

All plots were generated in R (v4.1.2) using ggplot2 (v3.5.1) [41] for barplots, volcano plots, and boxplots, and pheatmap (v1.0.12) [42] for heatmaps. Structural figures were generated in PyMol.

5. Conclusions

This reanalysis of RNA-seq data from GSE237798pinpointed 15 differentially expressed lectin genes in soybean leaves under drought, with 7 upregulated and 8 downregulated. These genes span primarily the GNA, legume, LysM, and Nictaba families, with most DEGs (11 of 15) being classified as LecRLKs and 3 being identified as soluble Nictaba-related LecPs. The upregulation of certain lectins (e.g., legume, Nictaba, specific GNA and LysM members) likely contributes to stress sensing and protective pathways, revealed by GO enrichment for kinase activity and signal transduction. The downregulation of others (predominantly GNA and LysM members) may reflect adaptive resource management. Structural modeling suggests potential divergence in ligand binding capabilities among these lectins. These findings provide a refined list of candidate genes (e.g., upregulated Glyma.14G189100, Glyma.03G233800; downregulated Glyma.03G002900) for future functional genomics and biochemical investigations aimed at elucidating their precise roles in soybean drought resilience and for potential crop improvement strategies.

Author Contributions

Conceptualization, V.J.S.O.; methodology, V.J.S.O.; validation, V.J.S.O.; formal analysis, V.J.S.O.; investigation, V.J.S.O. and R.A.F.L.; data curation, V.J.S.O.; writing—original draft preparation, V.J.S.O.; writing—review and editing, V.J.S.O., R.A.F.L., B.S.C. and K.S.N.; visualization, V.J.S.O.; supervision, B.S.C. and K.S.N.; funding acquisition, B.S.C. and K.S.N. All authors have read and agreed to the published version of the manuscript.

Funding

This research was funded by Coordenação de Aperfeiçoamento de Pessoal de Nível Superior (CAPES), Fundação Cearense de Apoio ao Desenvolvimento Científico e Tecnológico (FUNCAP), and Conselho Nacional de Desenvolvimento Científico e Tecnológico (CNPq).

Data Availability Statement

The raw RNA-sequencing dataset reanalyzed in this study is openly available in the Gene Expression Omnibus (GEO) at https://www.ncbi.nlm.nih.gov/geo/ under accession number GSE237798 (accessed on 22 April 2025). All processed data generated during this study are available within the article or upon reasonable request to the corresponding authors.

Conflicts of Interest

The authors declare no conflicts of interest.

References

  1. Kumari, S.; Dambale, A.S.; Samantara, R.; Jincy, M.; Bains, G. Introduction, history, geographical distribution, importance, and uses of soybean (Glycine max L.). In Soybean Production Technology; Springer Nature: Singapore, 2025; pp. 1–17. [Google Scholar]
  2. Hamza, M.; Basit, A.W.; Shehzadi, I.; Tufail, U.; Hassan, A.; Hussain, T.; Siddique, M.U.; Hayat, H.M. Global impact of soybean production: A review. Asian J. Biochem. Genet. Mol. Biol. 2024, 16, 12–20. [Google Scholar] [CrossRef]
  3. Wei, Y.; Jin, J.; Jiang, S.; Ning, S.; Liu, L. Quantitative response of soybean development and yield to drought stress during different growth stages in the Huaibei Plain, China. Agronomy 2018, 8, 97. [Google Scholar] [CrossRef]
  4. Ferreira, R.C.; Sibaldelli, R.N.R.; Crusiol, L.G.T.; Neumaier, N.; Farias, J.R.B. Soybean yield losses related to drought events in Brazil: Spatial–temporal trends over five decades and management strategies. Agriculture 2024, 14, 2144. [Google Scholar] [CrossRef]
  5. Mourtzinis, S.; Specht, J.E.; Lindsey, L.E.; Wiebold, W.J.; Ross, J.; Nafziger, E.D.; Kandel, H.J.; Mueller, N.; Devillez, P.L.; Arriaga, F.J.; et al. Climate-induced reduction in US-wide soybean yields underpinned by region- and in-season-specific responses. Nat. Plants 2015, 1, 14026. [Google Scholar] [CrossRef]
  6. Osakabe, Y.; Osakabe, K.; Shinozaki, K.; Tran, L.-S.P. Response of plants to water stress. Front. Plant Sci. 2014, 5, 86. [Google Scholar] [CrossRef]
  7. Haghpanah, M.; Hashemipetroudi, S.; Arzani, A.; Araniti, F. Drought Tolerance in Plants: Physiological and Molecular Responses. Plants 2024, 13, 2962. [Google Scholar] [CrossRef]
  8. Peumans, W.J.; Van Damme, E.J. Lectins as plant defense proteins. Plant Physiol. 1995, 109, 347–352. [Google Scholar] [CrossRef] [PubMed]
  9. De Coninck, T.; Van Damme, E.J.M. Review: The multiple roles of plant lectins. Plant Sci. 2021, 313, 111096. [Google Scholar] [CrossRef] [PubMed]
  10. Wang, Y.; Cordewener, J.H.G.; America, A.H.P.; Shan, W.; Bouwmeester, K.; Govers, F. Arabidopsis Lectin Receptor Kinases LecRK-IX.1 and LecRK-IX.2 Are Functional Analogs in Regulating Phytophthora Resistance and Plant Cell Death. Mol. Plant Microbe Interact. 2015, 28, 1032–1048. [Google Scholar] [CrossRef]
  11. Jiang, S.-Y.; Ma, Z.; Ramachandran, S. Evolutionary history and stress regulation of the lectin superfamily in higher plants. BMC Evol. Biol. 2010, 10, 79. [Google Scholar] [CrossRef]
  12. Marothia, D.; Kaur, N.; Jhamat, C.; Sharma, I.; Pati, P.K. Plant lectins: Classical molecules with emerging roles in stress tolerance. Int. J. Biol. Macromol. 2023, 244, 125272. [Google Scholar] [CrossRef]
  13. Yang, X.; Chen, Z.; Lu, J.; Wei, X.; Yao, Y.; Lv, W.; Han, J.; Fei, J. Identification and Characterization of the Gene Family in Maize, and Its Role Under Biotic and Abiotic Stress. Biology 2024, 14, 20. [Google Scholar] [CrossRef]
  14. Bellande, K.; Bono, J.-J.; Savelli, B.; Jamet, E.; Canut, H. Plant Lectins and Lectin Receptor-Like Kinases: How Do They Sense the Outside? Int. J. Mol. Sci. 2017, 18, 1164. [Google Scholar] [CrossRef] [PubMed]
  15. Van Holle, S.; Van Damme, E.J.M. Distribution and evolution of the lectin family in soybean (Glycine max). Molecules 2015, 20, 2868–2891. [Google Scholar] [CrossRef]
  16. Li, X.; Qi, S.; Meng, L.; Su, P.; Sun, Y.; Li, N.; Wang, D.; Fan, Y.; Song, Y. Genome-wide identification of the wall-associated kinase gene family and their expression patterns under various abiotic stresses in soybean (Glycine max (L.) Merr). Front. Plant Sci. 2024, 15, 1511681. [Google Scholar] [CrossRef]
  17. Peláez-Vico, M.Á.; Sinha, R.; Induri, S.P.; Lyu, Z.; Venigalla, S.D.; Vasireddy, D.; Singh, P.; Immadi, M.S.; Pascual, L.S.; Shostak, B.; et al. The impact of multifactorial stress combination on reproductive tissues and grain yield of a crop plant. Plant J. 2024, 117, 1728–1745. [Google Scholar] [CrossRef] [PubMed]
  18. Osman, M.E.M.; Osman, R.S.H.; Elmubarak, S.A.A.; Ibrahim, M.A.; Abakar, H.B.M.; Dirar, A.I.; Konozy, E.H.E. In silico analysis of L- and G-type lectin receptor kinases in tomato: Evolution, diversity, and abiotic responses. BMC Genom. 2024, 25, 1143. [Google Scholar] [CrossRef]
  19. Balagué, C.; Gouget, A.; Bouchez, O.; Souriac, C.; Haget, N.; Boutet-Mercey, S.; Govers, F.; Roby, D.; Canut, H. The Arabidopsis thaliana lectin receptor kinase LecRK-I.9 is required for full resistance to Pseudomonas syringae and affects jasmonate signalling. Mol. Plant Pathol. 2017, 18, 937–948. [Google Scholar] [CrossRef]
  20. De Coninck, T.; Van Damme, E.J.M. Plant lectins: Handymen at the cell surface. Cell Surf. 2022, 8, 100091. [Google Scholar] [CrossRef]
  21. Schouppe, D.; Ghesquière, B.; Menschaert, G.; De Vos, W.H.; Bourque, S.; Trooskens, G.; Proost, P.; Gevaert, K.; Van Damme, E.J.M. Interaction of the tobacco lectin with histone proteins. Plant Physiol. 2011, 155, 1091–1102. [Google Scholar] [CrossRef]
  22. Eggermont, L.; Stefanowicz, K.; Van Damme, E.J.M. Nictaba Homologs from Arabidopsis thaliana Are Involved in Plant Stress Responses. Front. Plant Sci. 2017, 8, 2218. [Google Scholar] [CrossRef]
  23. Yao, X.; Humphries, J.; Johnson, K.L.; Chen, J.; Ma, Y. Function of WAKs in Regulating Cell Wall Development and Responses to Abiotic Stress. Plants 2025, 14, 343. [Google Scholar] [CrossRef]
  24. Pi, L.; Zhang, Y.; Wang, J.; Wang, N.; Yin, Z.; Dou, D. A G-type lectin receptor-like kinase in Nicotiana benthamiana enhances resistance to the fungal pathogen Sclerotinia sclerotiorum by complexing with CERK1/LYK4. Phytopathol. Res. 2023, 5, 27. [Google Scholar] [CrossRef]
  25. Xu, J.; Wang, C.; Wang, F.; Liu, Y.; Li, M.; Wang, H.; Zheng, Y.; Zhao, K.; Ji, Z. PWL1, a G-type lectin receptor-like kinase, positively regulates leaf senescence and heat tolerance but negatively regulates resistance to Xanthomonas oryzae in rice. Plant Biotechnol. J. 2023, 21, 2525–2545. [Google Scholar] [CrossRef] [PubMed]
  26. Guo, L.; Qi, Y.; Mu, Y.; Zhou, J.; Lu, W.; Tian, Z. Potato StLecRK-IV.1 negatively regulates late blight resistance by affecting the stability of a positive regulator StTET8. Hortic. Res. 2022, 9, uhac010. [Google Scholar] [CrossRef]
  27. Vaid, N.; Macovei, A.; Tuteja, N. Knights in action: Lectin receptor-like kinases in plant development and stress responses. Mol. Plant 2013, 6, 1405–1418. [Google Scholar] [CrossRef]
  28. Leinonen, R.; Sugawara, H.; Shumway, M.; International Nucleotide Sequence Database Collaboration. The sequence read archive. Nucleic Acids Res. 2011, 39, D19–D21. [Google Scholar] [CrossRef] [PubMed]
  29. FastQC. A Quality Control Tool for High Throughput Sequence Data. Available online: https://www.bioinformatics.babraham.ac.uk/projects/fastqc/ (accessed on 23 July 2025).
  30. Chen, S.; Zhou, Y.; Chen, Y.; Gu, J. fastp: An ultra-fast all-in-one FASTQ preprocessor. Bioinformatics 2018, 34, i884–i890. [Google Scholar] [CrossRef] [PubMed]
  31. Kim, D.; Paggi, J.M.; Park, C.; Bennett, C.; Salzberg, S.L. Graph-based genome alignment and genotyping with HISAT2 and HISAT-genotype. Nat. Biotechnol. 2019, 37, 907–915. [Google Scholar] [CrossRef]
  32. Liao, Y.; Smyth, G.K.; Shi, W. featureCounts: An efficient general purpose program for assigning sequence reads to genomic features. Bioinformatics 2014, 30, 923–930. [Google Scholar] [CrossRef]
  33. Love, M.I.; Huber, W.; Anders, S. Moderated estimation of fold change and dispersion for RNA-seq data with DESeq2. Genome Biol. 2014, 15, 550. [Google Scholar] [CrossRef]
  34. R Core Team. R: A Language and Environment for Statistical Computing; R Foundation for Statistical Computing: Vienna, Austria, 2021. [Google Scholar]
  35. Raudvere, U.; Kolberg, L.; Kuzmin, I.; Arak, T.; Adler, P.; Peterson, H.; Vilo, J. g: Profiler: A web server for functional enrichment analysis and conversions of gene lists (2019 update). Nucleic Acids Res. 2019, 47, W191–W198. [Google Scholar] [CrossRef] [PubMed]
  36. Jones, P.; Binns, D.; Chang, H.-Y.; Fraser, M.; Li, W.; McAnulla, C.; McWilliam, H.; Maslen, J.; Mitchell, A.; Nuka, G.; et al. InterProScan 5: Genome-scale protein function classification. Bioinformatics 2014, 30, 1236–1240. [Google Scholar] [CrossRef] [PubMed]
  37. Heazlewood, J.L.; Verboom, R.E.; Tonti-Filippini, J.; Small, I.; Millar, A.H. SUBA: The Arabidopsis Subcellular Database. Nucleic Acids Res. 2007, 35, D213–D218. [Google Scholar] [CrossRef] [PubMed]
  38. Teufel, F.; Almagro Armenteros, J.J.; Johansen, A.R.; Gíslason, M.H.; Pihl, S.I.; Tsirigos, K.D.; Winther, O.; Brunak, S.; von Heijne, G.; Nielsen, H. SignalP 6.0 predicts all five types of signal peptides using protein language models. Nat. Biotechnol. 2022, 40, 1023–1025. [Google Scholar] [CrossRef]
  39. Jumper, J.; Evans, R.; Pritzel, A.; Green, T.; Figurnov, M.; Ronneberger, O.; Tunyasuvunakool, K.; Bates, R.; Žídek, A.; Potapenko, A.; et al. Highly accurate protein structure prediction with AlphaFold. Nature 2021, 596, 583–589. [Google Scholar] [CrossRef]
  40. Mirdita, M.; Schütze, K.; Moriwaki, Y.; Heo, L.; Ovchinnikov, S.; Steinegger, M. ColabFold: Making protein folding accessible to all. Nat. Methods 2022, 19, 679–682. [Google Scholar] [CrossRef]
  41. Wickham, H. ggplot2: Elegant Graphics for Data Analysis; Springer Science & Business Media: New York, NY, USA, 2009. [Google Scholar]
  42. Kolde, R. pheatmap: Pretty Heatmaps, CRAN; The R Foundation: Vienna, Austria, 2010. [Google Scholar]
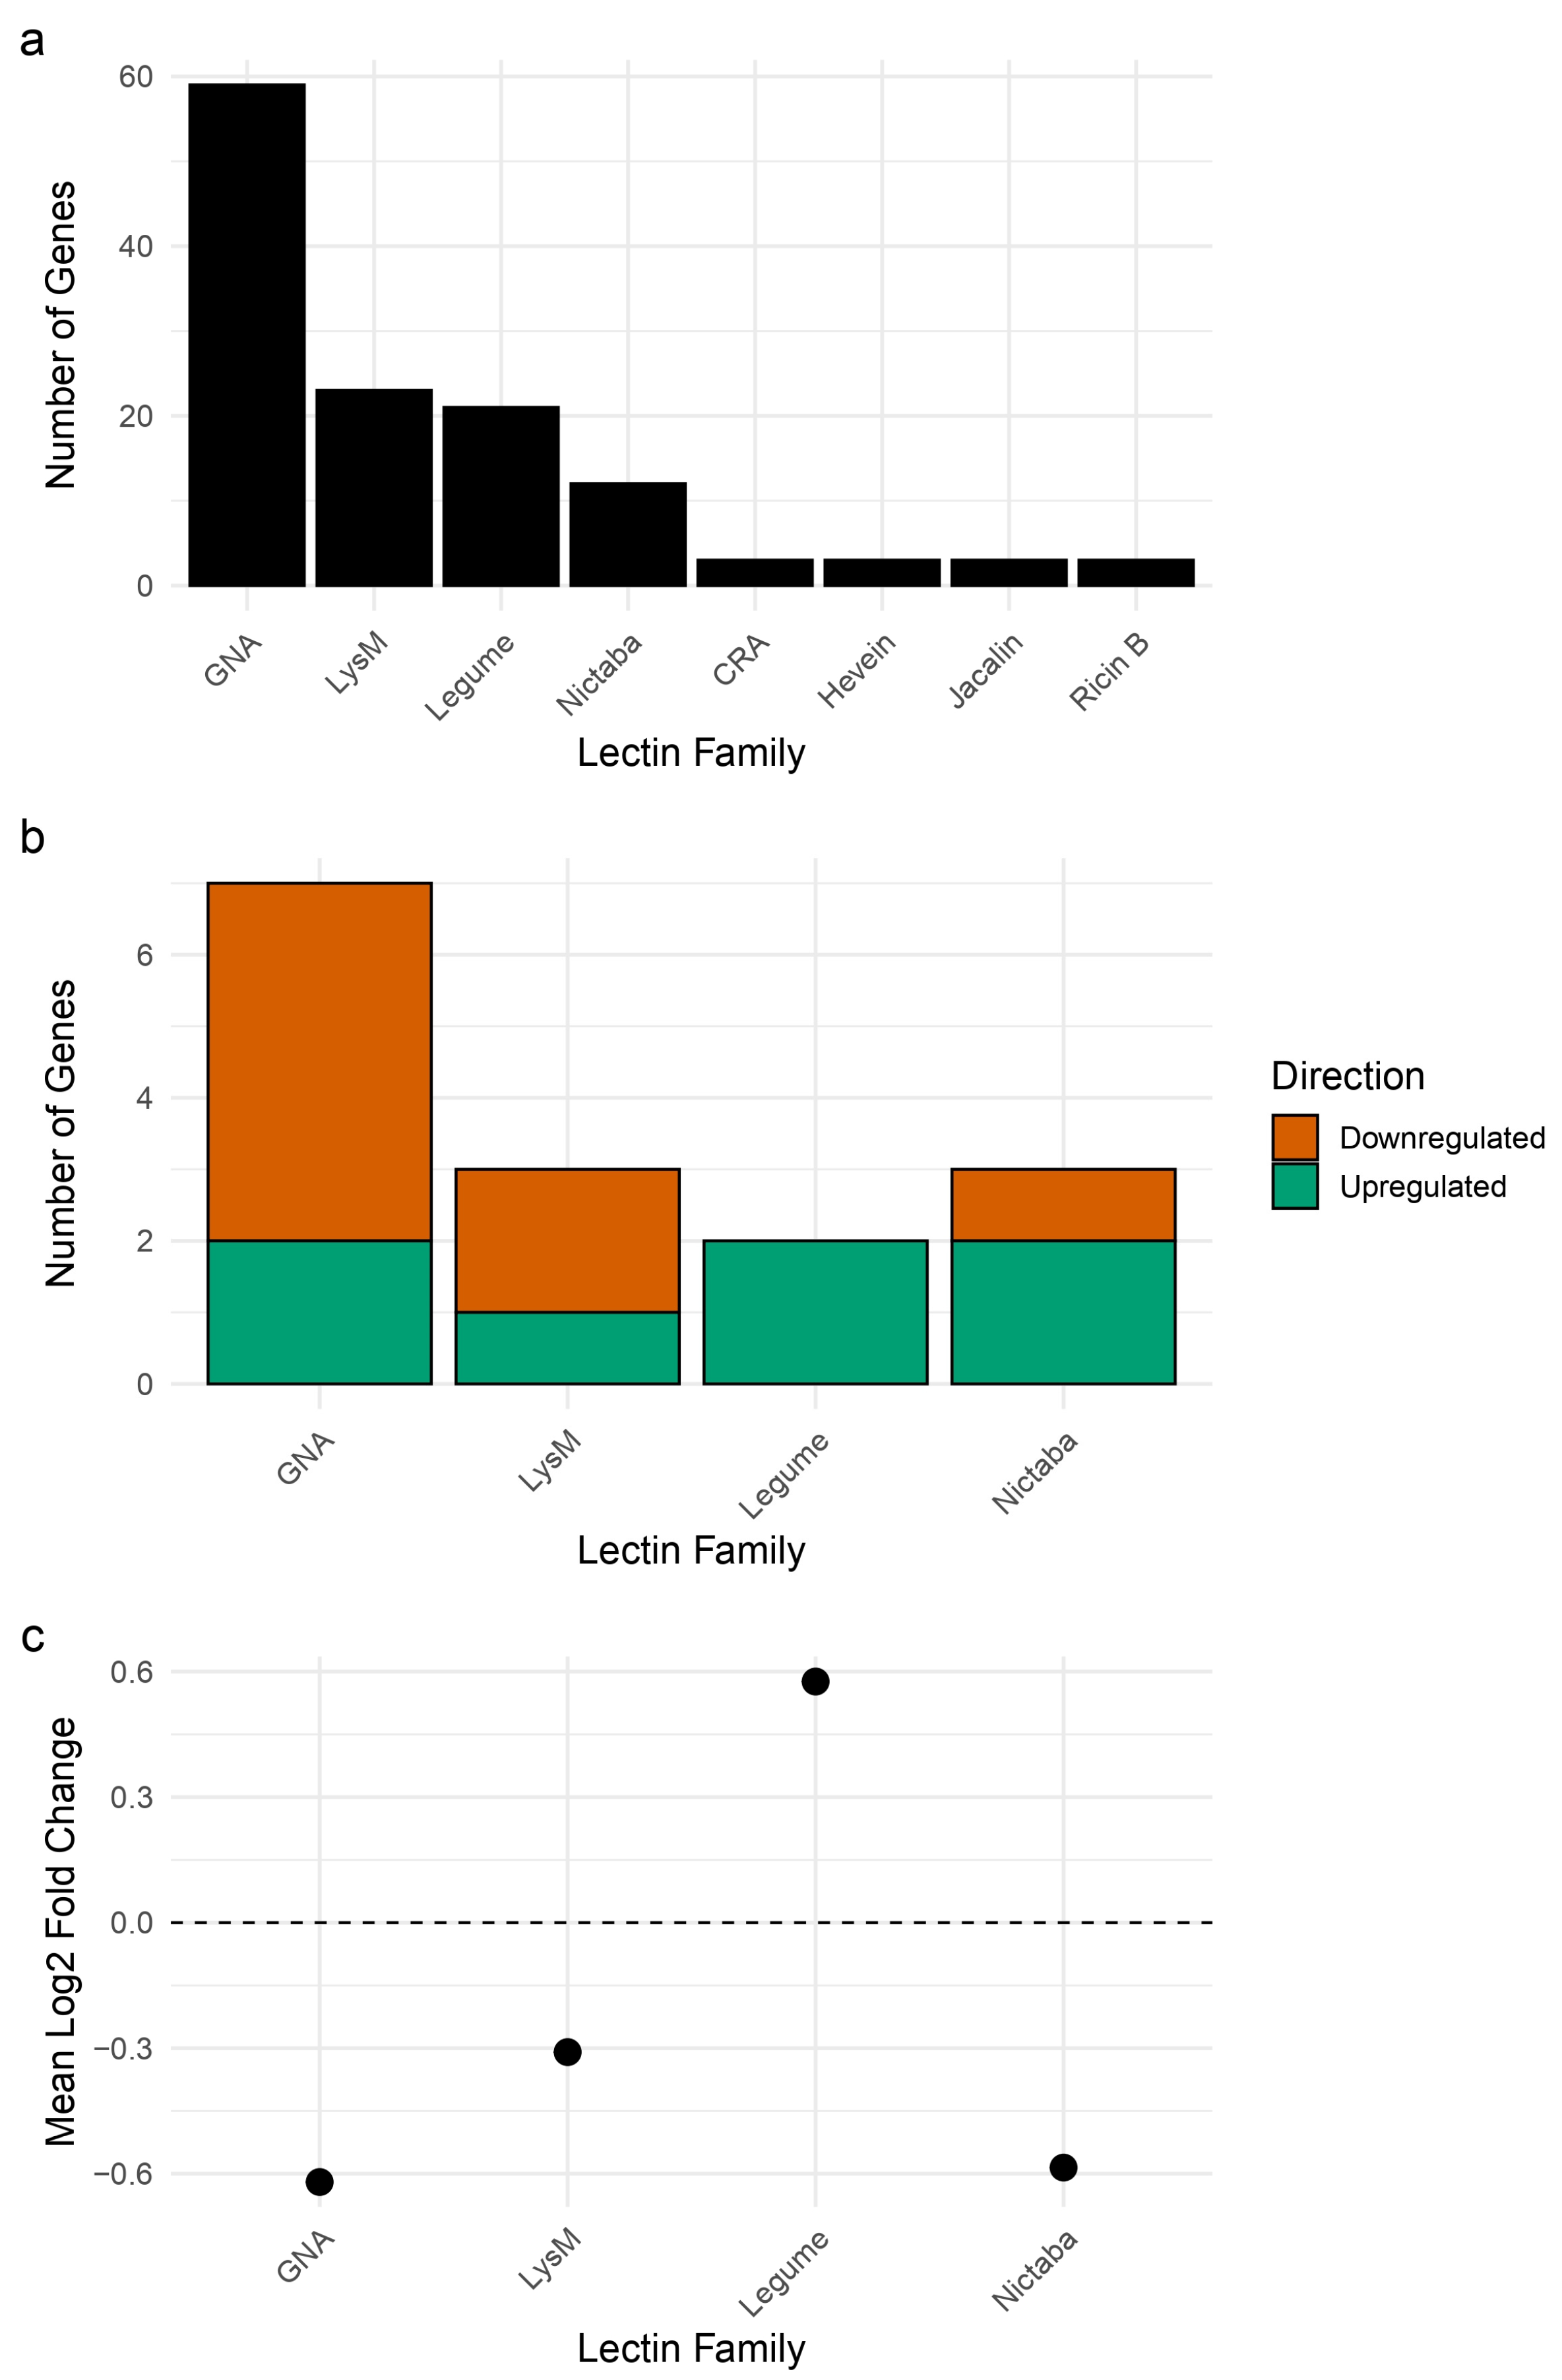
Figure 1. Lectin gene family expression and differential regulation under drought. (a) Total number of expressed lectin genes per family in soybean leaves under drought and control conditions. (b) Number of significantly upregulated (green) and downregulated (orange) lectin genes per family. (c) Mean log2 fold change of differentially expressed lectins by family, indicating average transcriptional response direction.
Stresses 05 00054 g001
Figure 2. Overview of differentially expressed lectin genes in soybean under drought. (a) Volcano plot showing log2 fold change versus −log10 adjusted p-value. Each dot represents a gene; all 127 lectin genes with statistically significant differential expression (adjusted p-value < 0.05) are highlighted in orange. Dashed vertical lines indicate ±1 log2 fold change, used as a threshold for biological relevance, and the horizontal dashed line marks the significance threshold. (b) Boxplots of normalized expression counts for the 15 lectin genes that were both statistically significant and showed a substantial expression change (|log2 fold change| ≥ 1), across control (blue) and drought (yellow) conditions. Each plot includes three biological replicates per condition.
Stresses 05 00054 g002
Figure 3. Heatmap of Z-score normalized expression values for the 15 differentially expressed lectin genes across six samples (three control, three drought). Columns represent individual replicates, and rows represent genes. Red and blue indicate expression values above or below the mean for each gene, respectively.
Stresses 05 00054 g003
Figure 4. Visualization of GO enrichment results from g:Profiler for differentially expressed lectin genes. The enriched terms were primarily related to protein phosphorylation, kinase activity regulation, and signal transduction, consistent with the architectural classification of most DE lectins as receptor-like kinases (LecRLKs). The enriched terms suggest that these lectins may participate in drought-responsive signaling pathways. However, canonical drought-related stress terms were not significantly enriched.
Stresses 05 00054 g004
Table 1. Domain architecture, predicted subcellular localization, and structural classification of drought-responsive lectin genes. TM = transmembrane.
Gene IDLectin FamilyDomain(s)
Detected
TMSubcellular
localization
Class
Glyma.03G003000GNA-relatedGNA; S-locus glycoprotein; kinaseYesPlasma membraneLecRLK
Glyma.03G002900GNA-relatedGNA; S-locus glycoprotein; kinaseYesPlasma membraneLecRLK
Glyma.01G117900GNA-relatedGNA; S-locus glycoprotein; PAN/AP; kinaseYesPlasma membraneLecRLK
Glyma.13G248900GNA-relatedGNA; S-locus glycoprotein; PAN/AP; kinaseYesPlasma membraneLecRLK
Glyma.08G355000GNA-relatedGNA; EGF-like; PAN/AP; kinaseYesPlasma membraneLecRLK
Glyma.13G283400GNA-relatedGNA; S-locus glycoprotein; PAN/AP; kinaseYesPlasma membraneLecRLK
Glyma.13G283100GNA-relatedGNA; S-locus glycoprotein; PAN/AP; kinaseYesPlasma membraneLecRLK
Glyma.14G189100LegumeLegume lectin; kinaseYesPlasma membraneLecRLK
Glyma.17G224300LegumeLegume lectin; kinaseYesPlasma membraneLecRLK
Glyma.02G000400LysM-relatedLysM; kinaseYesPlasma membraneLysM-RLK
Glyma.15G019800LysM-relatedLysM; kinaseYesPlasma membraneLysM-RLK
Glyma.11G100600LysM-relatedGNA; S-locus glycoprotein; PAN/AP; kinaseYesPlasma membraneLecRLK
Glyma.03G233800Nictaba-relatedF-box; NictabaNoCytosol; Endoplasmic reticulumLecP
Glyma.10G150400Nictaba-relatedF-box; NictabaNoCytosol; Endoplasmic reticulumLecP
Glyma.20G021000Nictaba-relatedNictabaNoPlastidLecP
Disclaimer/Publisher’s Note: The statements, opinions and data contained in all publications are solely those of the individual author(s) and contributor(s) and not of MDPI and/or the editor(s). MDPI and/or the editor(s) disclaim responsibility for any injury to people or property resulting from any ideas, methods, instructions or products referred to in the content.