1. Introduction
For nearly two decades, Unmanned Aerial Systems (UAS) have been operated by researchers, practitioners, and conservationists as a flexible and capable pathway to acquire high spatial resolution remotely sensed data. While UAS are not a novel technology with many authors recognizing a long history of military development throughout the 20th century, recent advances in computer hardware and software have provided an increasingly beneficial role for this platform in various natural resource disciplines [
1,
2,
3,
4]. UAS, which are also referred to as Unpiloted Aerial Vehicles (UAV), drones, Remotely Piloted Aircraft (RPA), and aerial robotics, combine a system of sensing, communication, and control components to offer end-users the ability to collect project-specific remotely sensed data [
1,
5,
6]. The combination of these technologies presents a broad niche for UAS as a steppingstone between field-based sampling and coarser resolution remote sensing platforms. UAS offer the ability to cover larger areas than many field-based sampling approaches, while avoiding the burdens of cost and resolution (temporal and spatial) experienced with collecting remotely sensed data using piloted aircraft or satellite sensors [
7,
8]. There is a critical need for local scale information in many natural resource settings, including forests, freshwater ecosystems, grasslands and shrublands, and croplands [
9,
10,
11,
12]. Remotely sensed data, especially those derived from UAS, can be used as a basis for spatial inferences at these local scales [
1,
13]. While UAS are not a total solution for such data needs, they offer a powerful tool for supplementing and/or complementing other sampling and analysis approaches. To maximize the benefits experienced by integrating UAS, it is important to follow the best practices for collecting and processing the associated remotely sensed data [
6,
14,
15]. However, for many UAS applications there is still a lack of established methods to follow. Despite the increasing rate of adoption and refinement of UAS that has occurred over the last decade, there remains a realized gap in the collective knowledge and reporting of successful methods for acquiring and processing UAS data for photogrammetric applications [
16,
17,
18].
The confluence of principles in remote sensing, computer vision, geodesy, and geographic information systems (GIS) have formed a powerful association between UAS and digital aerial photogrammetry (DAP). DAP has built upon conventional photogrammetric mapping by automatically matching and processing the geometry of scenes, even with uncalibrated imagery, over large areas and complex environments [
19,
20]. Mathematical workflows, including Structure-from-Motion (SfM) and multi-view stereo (MVS) algorithms, have been linked to create an assortment of ultra-high-resolution spatial data products including photogrammetric point clouds, digital surface models (DSM), and orthomosaics [
20,
21,
22]. Although SfM-MVS consists of several stages of internal and external parameter corrections, as well as stages for point cloud and surface reconstruction; here, we have grouped these processes under the umbrella of DAP as a way of discussing the full suite of two-dimensional (2D) and 3D spatial data products generated from this workflow [
16,
23,
24]. For a full description of the SfM-MVS workflow, we refer to Westoby et al. [
24], Ludwig et al. [
17], and Tinkham and Swayze [
18]. One of the main advantages of DAP over conventional digital photogrammetry is the lack of requirement for highly consistent levels of overlap, camera positions, and internal calibration for the collected imagery [
20,
22,
25]. The more flexible processing framework has made UAS an ideal tool for collecting the input data for DAP, thereby lowering both the costs and technical barriers for generating highly precise and detailed 2D and 3D models [
20,
22]. In addition to solely image-based UAS analysis, UAS-light detection and ranging (lidar) applications have also become a practical reality for some natural resource applications [
26,
27,
28]. Like other complex sensors (e.g., hyperspectral or thermal) UAS-lidar showcases a promising future for UAS applications in natural resources, as a means of meeting the needs of individual and local scale end-users.
Over the last five years, methods for monitoring and managing natural resources have become increasingly digital. The increased adoption of digital tools and technologies has allowed for new research questions to be raised and historical challenges to be met from a new perspective [
29,
30]. Several natural resource disciplines have exemplified the adoption of these novel technologies including forestry, freshwater ecosystems, grasslands and shrublands, and agriculture. Forestry research has historically been conducted using traditional field sampling techniques, satellite imagery, or with imagery acquired from piloted aircraft [
31,
32,
33]. However, as UAS technologies and DAP processing have improved in accuracy and precision, consumer and commercial grade solutions have become accessible, creating a larger subgenre of forestry applications. Grasslands and shrublands, including a variety of non-forested vegetation communities, represent some of the most extensive ecosystems on the planet, yet still experience substantial degradation and overutilization [
34,
35,
36,
37]. A historic difficulty in mapping grassland and shrubland communities and the lack of transferability of best practices have been major challenges [
38,
39]. Freshwater ecosystems, including streams, rivers, reservoirs, and lakes, represent another challenge for remote sensing historically. Observations and analyses by satellite and airborne sensor data have been restricted, due in part to the coarse spatial and temporal resolutions [
40,
41]. UAS have been used to successfully collect imagery of freshwater ecosystem at scales relevant to a variety of objectives. Additionally, UAS have provided a path for expanding the coverage of in situ sampling, whether the sites be difficult to access or too large to cover by traditional methods [
42]. Example applications of UAS in freshwater ecosystems include collecting and analyzing aquatic vegetation, water quality monitoring, and the detection and measurement of cyanobacteria [
43,
44,
45,
46]. A similar pattern for remote sensing technologies has emerged for applications in agriculture. The historic integration of satellite and aerial sensor data is now being supplemented, or in some cases replaced, by users willing to adopt near-range remote sensing platforms such as UAS [
47,
48,
49]. As global food systems are increasingly challenged by climate change, the adoption of novel technologies, such as UAS, will provide new and adaptable solutions for existing agriculture mechanisms [
2,
48].
As UAS are increasingly integrated into multi-source data solutions for solving complex problems in natural resources, it becomes increasingly imperative that their capabilities and limitations are fully established [
14,
17,
50,
51]. Two of the primary components influencing the success of integrating UAS to meet challenges in natural resource monitoring and management are the acquisition and processing of the resulting sensor data [
17]. Many studies in the past have voiced a need for quantitatively evaluating the operational practices of UAS [
1,
21,
52,
53]. Characteristics such as the flying height of the aircraft, the overlap of the flight lines, the sensor choice, and the processing parameter settings have each been found to influence the model performance and subsequent estimation accuracy [
20,
54,
55,
56]. Despite the long-standing need for specific UAS operational guidelines, many modern UAS applications still acknowledge a gap in their ability to provide conclusive and accessible workflows, which could generate consistently optimal results [
6,
15,
18,
42]. For this reason, this review paper provides a synthesis of the current practices and trends in UAS flight planning and sensor data processing across several natural resource disciplines and provides responses to the following questions:
What Unmanned Aerial System (UAS) hardware and software characteristics have been preferred by current applications in natural resources, and how widely are these characteristics discussed?
What capabilities and limitations have been discussed for UAS applications in natural resource monitoring and management?
What are the primary perspectives on future research for UAS applications in specific natural resource disciplines?
This review paper is structured as follows:
Section 2 contains a discussion of the literature review parameters, including keywords for each discipline and filters applied to the search criteria. Additional figures in this section provide a systematic analysis of the types of Unmanned Aircraft (UA or aircraft), sensors, and processing workflows used in each of the disciplines.
Section 3,
Section 4,
Section 5 and
Section 6 outline the findings for UAS applications in forestry, freshwater ecosystems, grasslands and shrublands, and agriculture, respectively. Finally,
Section 7 presents a discussion on the shared principles and future needs for UAS flight planning and sensor data processing throughout natural ecosystems.
2. Materials and Methods
For this review, all scientific articles were queried using the Web of Science [
57]. The literature searches for each natural resource topic, forests, freshwater ecosystems, grasslands and shrublands, and agriculture, were conducted by an independent natural resource professional with co-established instructions. These literature searches were conducted with the following parameters: (1) all searches were completed during the 2021 calendar year and were restricted to publication dates within only the five most recent years (i.e., 2016–January 2022); (2) keywords were field specific, as needed, and included references to both the designated natural resource field and UAS; and (3) search results were sorted by relevance. The keywords implemented in each of the four queries can be seen in
Table 1. Sorting the results by relevance minimized the occurrence of articles that did not focus on UAS applications as their main objective or articles that focused on UAS communications or piloting developments (i.e., contained no remote sensing or sampling analysis). Both primary application articles and review articles were collected during these queries. Each review article that was found prior to collecting a minimum of 30 application articles in a given discipline was also archived and reviewed here. The review article(s) most complementary to our study objectives for each of the four natural resource disciplines are also given in
Table 1. Once a minimum of 30 application articles for each specific discipline were saved and validated, the search was considered complete. In total, this literature search resulted in 150 scientific articles, including 126 UAS application articles and a combination of 24 background and literature review papers.
A systematic analysis of the methods for each of the primary application articles was completed to provide a discussion of the (1) types of unpiloted aircraft, (2) types of sensors, (3) thoroughness of the flight planning and data processing procedure details, and (4) processing framework used throughout each of the four disciplines. The results of this analysis are shown in
Figure 1,
Figure 2,
Figure 3 and
Figure 4. The first analysis of the literature (
Figure 1) was established to observe the configurations of unpiloted aircraft commonly used in natural resource applications. Both proprietary rotary-wing (“copter”) and fixed-wing aircraft were included in this analysis. These proprietary systems included copters from companies such as DJI (Shenzhen, China) and Microdrones (Siegen, Germany), as well as fixed-wing aircraft from companies such as SenseFly (Cheseaux-sur-Lausanne, Switzerland). Additionally, a ‘novel design’ category was included to consider the presence and abundance of applications that operated UAS specifically configured/built for their study or objective, and not provided as a complete kit from notable companies. Lastly, an ‘other’ category was included to recognize articles that did not specify the company or model type for their unpiloted aircraft.
A second analysis performed on the primary application articles conducted across all four of the natural resource disciplines evaluated the types of UAS sensors employed. Each of the four disciplines demonstrated the utility and necessity of including a diverse suite of remote sensing sensors (
Figure 2). For this analysis, seven categories were defined. These included first ‘natural color’ sensors sensing only Blue, Green, and Red (RGB) wavelengths and ‘multispectral’ sensors, which collected up to 20 spectral bands. Additional categories were defined for more specific or complex sensors, such as ‘hyperspectral’, ‘lidar’, and ‘thermal’ UAS applications. A ‘fusion’ category was included to denote applications which combined the data collected by multiple UAS sensors or with data collected from another remote sensing platform. Lastly, an ‘other’ category was included to define applications that focused analysis on UAS-based sampling or did not specify a sensor type. Articles that included the use of more than one UAS sensor type (either for comparison or for fusion) were counted for each respective sensor.
To establish the degree to which UAS applications among these four natural disciplines relied on specific and standardized methods for collecting and processing their sensor data, a third analysis of the articles was conducted (
Figure 3). During this assessment, articles were defined as being ‘complete’ in their discussion of flight planning and processing procedures based on the readers ability to replicate the study. If information regarding the flying height of the aircraft, image or flight line overlap, or weather conditions were not provided, the methods were considered ‘incomplete’. Additionally, in consideration of the processing workflow, the article must have provided clear details on the software or processing method (e.g., use of Agisoft PhotoScan (St. Petersburg, Russia) or specific Python package(s)), quality parameter settings, and filtering applied to the resulting spatial data models to be considered ‘complete’. A more fitting discussion of the flight planning and processing protocols was defined as ‘complete with references’ if it included citations and consideration of methodological choices. A final ‘other’ category was included here to denote applications that did not require either a full discussion of their flight planning or full discussion of their processing workflow based on their study design.
The methods available for processing the structural and spectral data provided by UAS sensors are numerous and diverse. While some paired or proprietary software solutions exist for specific UAS (such as SenseFly and Pix4D Mapper (Prilly, Switzerland)), a multitude of other open source or non-UAS specific tools are available to be used to fulfill either a complete or single stage of the processing and analysis workflow. In this final analysis of the literature for all four natural resource fields (
Figure 4), the number of articles completing their initial processing using a specific software or data processing solution was evaluated. The categories considered only the methods included following pre-processing, which were used to generate the spectral, structural, geometric, or textural data (i.e., 2D and 3D spatial data products such as an orthomosaic or photogrammetric point cloud). Proprietary software solutions such as ‘Pix4D’, ‘Agisoft MetaShape’ (previously ‘PhotoScan’), and Environmental Systems Research Institute (ESRI) ‘ArcGIS’ (Redlands, CA, USA) were defined as individual categories. An ‘other proprietary’ category was included to specify programs owned and managed by other commercial companies (e.g., DJI Terra). The open-source category, ‘open-source’, defined UAS applications which were completed using non-proprietary software or coding libraries. An ‘other’ category was included to distinguish articles that did not require digital image matching or spatial data modeling, such as those studies that performed their analysis on a singular image of the study site.
3. UAS Applications in Forestry
Forests are an important ecosystem that humans directly and indirectly rely on for services such as timber production, improving and supporting water quality, carbon sequestration, serving as a habitat for wildlife populations, recreation, and culturally significant locations [
63]. Management and stand practices must be employed to conserve and sustain forests, and to estimate conditions quantitatively or qualitatively. The forestry-specific applications represented a wide range of forest types, from boreal to tropical, regenerating to uneven aged, and mixed natural forests to well-managed plantations [
62,
64,
65,
66,
67,
68]. The surveyed articles integrated UAS for updating forest inventories, generating enhanced forest inventories (EFIs), estimating structural metrics, classifying tree species, assessing forest health, evaluating forest regeneration, or estimating damage from events such as wildfires and windthrow [
29,
69,
70]. The benefits experienced from using UAS-based sensor data for forestry applications included the reduction of resource requirements for traditional field work techniques. These resources included fewer time and financial costs, as well as a lowered reliance entirely on field-measured data [
6]. Additionally, the data and discussion generated from studies that used UAS were valuable for ensuring correct forest management plans were employed, based on the largest amount of relevant information. The benefits of integrating UAS are supported by the results of studies such as Moe et al. [
66,
71], whose research found that that tree spatial positions and diameter at breast height (DBH) values based on digital photogrammetry had comparable prediction accuracy to field-measured and lidar measured trees. The authors concluded that UAS could be used for assisting or entirely supporting foresters and land managers in searching for high-value timber trees and estimating tree size in large mixed-wood forests [
66]. In addition to articles that focused on establishing case studies on specific UAS-based analyses, environmental policy makers are exploring how to best translate UAS-based forestry data and results into actionable insights [
72].
3.1. Aircraft and Sensors
The UAS-based forestry applications synthesized in this review incorporated many configurations of UAS.
Figure 1 shows the higher degree of diversity in aircraft types, in comparison to the other natural resource disciplines. Many of the forestry articles used multiple UAS platforms during their operations to acquire, compare, and fuse data across multiple sensors. Common UAS manufacturers and models included DJI, specifically their phantom 3 and 4 models, and SenseFly, with their eBee models. The most common workflow included using a single UAS, sensor, and flight planning protocol. Novel designed UAS were engineered for some research studies. In Hillman et al.’s [
28] study, a custom built UAS (University of Tasmania, Australia) was utilized for lidar data acquisition, and a DJI Phantom 4 Pro for natural color imagery acquisition. In Goodbody et al. [
58], a military-grade quadcopter UAS was used for natural color imagery acquisition, while airborne lidar (ALS) data were acquired with a piloted Cessna aircraft as a source of reference data.
More than other natural resource disciplines, forestry-specific applications featured a high number of studies, which included more than one UAS or more than one sensor, and by association, multiple data acquisition flights [
28,
65,
73]. This is best exemplified in Webster et al. [
73]. An Optris PI450 Thermal Imager (Portsmouth, NH, USA), a Panasonic Lumix DMC-GH4 DSLR camera (RGB) (Osaka, Japan), and a Riegl LMS Q560 LiDAR sensor (Horn, Austria) were used in this study. Webster et al. [
73] successfully generated 3D point clouds from the natural color imagery, thermal imagery, and a lidar scan to characterize the structural and thermal data of vegetation in a heterogenous sub-alpine Eastern Swiss Alps Forest. In addition to using multiple sensors, the natural color and thermal imagery in this study were acquired with a UAS, while the lidar data were acquired from multiple piloted helicopter flights (i.e., ALS). This study is diverse with data acquisition methods, and merges DAP methods for natural color and thermal imagery data processing, while also integrating lidar data into their study for data validation [
73]. Such an emphasis on multi-source data acquisition and analysis is an impressive foreshadowing for the future of forestry remote sensing using UAS.
3.2. Flight Planning
Flight planning is often overlooked as a small detail in data acquisition using a UAS, as seen in the number of studies with incomplete flight parameter details (
Figure 3). Flying heights, altitudes, sensor systems, climatic factors, and imagery overlaps have conclusively shown impact on the UAS sensor data processing time, quality of results, and quality of outputs [
52,
53,
74]. If authors provided enough detail on the flight parameters, as well as the parameters selected to process the subsequent data, then they have ensured their results are relatable, reproducible, and confident. Many of the forestry-based studies provided flying heights, or altitudes, and overlaps. Nineteen of the reviewed studies were comprehensive in their flight plan details, including flying heights or altitudes, overlaps, and climatic conditions or weather for the data acquisition flights. Three of the thirty studies provided comprehensive flight parameters and externally referenced sources as to why and how their respective flight plans were chosen [
73,
74,
75]. The United States Federal Aviation Administration (FAA) has regulated the use of UAS, including their speed, operating hours, and flying heights within the United States. Flying heights are not to exceed approx. 122 m (400 feet) above ground level, per FAA regulation (Small Unmanned Aircraft Systems, 14 C.F.R. §107). All the reviewed studies conducted in the United States obeyed this regulation, while many international studies exhibited more freedom in their flying height selection. Some studies flew lower for lidar and normal color imagery acquisition, with some of the lowest flying heights documented at 30 m and 50 m, respectively [
11,
76]. In the other extreme, Liu et al. [
77] flew at 800 m above the ground for multispectral imagery acquisition. Swayze et al. [
56], similar to Fraser and Congalton [
6], found that a flying height closer to the 120 m threshold in the United States could provide an effective balance between resolution, efficiency, and accuracy for forest surveying. The other key component of flight planning is imagery overlap, which can be divided into forward and side overlap. Because all the studies stated an overlap to some degree, it was observed that the most common forward and side overlap was 80–90% [
67,
78,
79,
80]. Several of the reviewed studies on UAS applications in forestry included multiple remote sensing systems, and therefore, multiple flight plans. A common trend among these studies was to detail the flight parameters for one of the missions but provide no or few parameters for the other(s). Stating flight parameters should be considered an important detail in forestry studies, as the resulting sensor data estimates could potentially be adversely impacted.
3.3. Processing
Processing data can be divided into pre- and post-processing. For forestry applications, post-processing usually entails quantifying and calculating metrics, determining spatial positions, assessing accuracies from multiple models, estimating species and health, or calculating other silvicultural metrics. In many cases, UAS sensor data processing required additional processing and statistical software to be used beyond Agisoft, Pix4D, and ESRI ArcGIS. Many of the studies utilized a combination of proprietary SfM software, open source, custom code, or a third party for processing their data due to multiple types of sensor data being acquired [
81,
82,
83].
Figure 4 visually expresses the number of times software were used throughout the UAS applications in forestry. The most common type of model produced during these studies was the photogrammetric point clouds. As a result, the most common processing steps discussed within the reviewed literature came from the stages associated with generating such point clouds. Generating point clouds requires images to first be aligned [
22,
24,
84]. Within the image alignment stage comes choosing values for image alignment accuracy, keypoint selection, and minimum and maximum number of tie points. The studies reviewed for this section varied immensely with how much detail was provided for each of these parameters. In Krisanski et al. [
85], a table was provided that detailed the values chosen for the settings and stages of their point cloud generations in Agisoft. Photogrammetric processing parameters are key factors that control the products’ quality, accuracy, and replicability. Krisanski et al. [
85] stated their processing parameters in an easily readable, well-organized table that can be translated or replicated for similar research studies. Many of the UAS applications strived to use high accuracy and high-quality settings during their data processing, selecting ‘high’ or ‘ultra-high’ quality and ‘aggressive’ filtering during the photo alignment and dense point cloud generation steps [
76,
86]. Ramalho de Oliveria et al. [
76] referenced a United States Geological Survey (USGS) National UAS Project Office workflow to ensure the highest quality feature matches among their sets of photos in the generation of their dense-matching point cloud.
Many of the reviewed forestry applications sought to complete similar objectives to one another, such as measuring tree heights and DBH. Though these publications had similar objectives, the way in which each estimated these metrics was different. Iizuka et al. [
87] and Cao et al. [
88] estimated tree heights and DBH in their publications. Iizuka et al. [
87] used Agisoft to create their point cloud, as well as their DSM, orthomosaics, digital terrain models (DTM), and canopy height models (CHM). Cao et al. [
88] used Pix4D to generate their normal color imagery photogrammetric point cloud. These two publications show that even though studies share similar objectives for forestry applications, the data processing software and methodology may vary. Each of the forestry applications stated the processing parameters and workflows used in their methodology to some degree. In association with the use of more than one aircraft or sensor, some studies used two or more processing software packages to create their spatial data models perpetuating a trend in which the processing parameters of one dataset were detailed, while the other dataset(s) had minimal or no discussion [
28,
66,
80]. Graphical flowcharts were provided in some studies as a superb representation of these processing considerations. These visualizations depicted the processing and statistical analyses throughout the respective articles [
80,
89,
90]. Flowcharts are a valuable tool for readers to understand the steps and processing parameters, enhancing the replicability of the publication for continued research.
3.4. Qualitative and Quantitative Acheivements
The articles reviewed here produced results that contribute important findings on forestry applications which included UAS technologies. Forestry research is an increasingly important field of study as climate change, deforestation, human development, and other anthropogenically caused degradation threatens forests across the world [
9,
91,
92]. Many of the articles found during this literature review compared suites of metrics from DAP conducted using RGB imagery, UAS-lidar, ALS, terrestrial lidar, or field collected data to further understand the advantages and disadvantages of different data acquisition types, or to assess relative accuracies of metrics [
58,
88,
93,
94]. ALS data, acquired from a piloted aircraft, were used in many forestry focused applications. These applications included normalizing UAS-DAP point clouds, building digital terrain models (DTM
ALS), calculating structural metrics, assisting in the classification of ground vs. nonground surfaces, or for comparing UAS-DAP to the ALS-derived biophysical estimates [
93,
95,
96]. While ALS has been used as a primary source for forest inventory biometrics for decades, some studies are beginning to showcase UAS sensor data as a functional and effective alternative or supplement. Puliti et al. [
96] used UAS-DAP for estimating biophysical properties in forests under regeneration. Their results determined that the use of UAS data provided more accurate predictions than an ALS data or field assessment, with a reduction in their relative root-mean-square-error (RMSE) of 50% for stem density compared to ALS data [
96]. In addition to comparing different suites of metrics to another, some applications assessed the accuracy of individual models and metrics from certain data acquisition types. Tomaštík et al. [
83] assessed the accuracy of DAP point clouds in partially open forest canopies, concluding that the overall accuracy of DAP point clouds was high and reliable for applications which involve horizontal and vertical measurements. The findings of Puliti et al.’s [
96] comparative study and Tomaštík et al.’s [
83] accuracy assessment of photogrammetric point clouds contribute to understanding optimal practices for forestry research with UAS.
Biodiversity, biomass, regeneration, and health status are important characteristics of forest communities. These characteristics contextualize changes occurring on the species and growth of a forest, which allows humans to best understand how to conserve, sustain, or manage the ecosystem [
63]. UAS were used to assess biodiversity, regeneration, and health in three of the papers on different forest types, ranging from mixed broadleaf-conifer forests to boreal forests, and forest stands within the interior cedar-hemlock biogeoclimatic ecosystem zone [
65,
86,
97]. These applications were completed using varying UAS, sensors, flight parameters, and processing software. One important finding from the biodiversity assessment study by Saarinen et al. [
65] concluded that the most reliable biodiversity predictions, when assessed by structural variability or successional stage, came from the fusion of UAS natural color and hyperspectral point clouds in Boreal forests. In addition to assessing forest biodiversity, regeneration, and health, many of the reviewed studies used UAS-DAP to estimate wildfire severity [
28], biomass [
68,
75], tree growth [
81], tree detection [
79], windthrow [
95], and forest structural metrics, such as DBH, height, stem density, basal area, and volume [
66,
87,
88,
90,
96].
The UAS applications in forestry reviewed from the last five years each contributed significant findings to the global pool of forestry research acquired with UAS-DAP. Some projects introduced new methods, approaches, and modeling practices for UAS-based forestry data. Mohan et al. [
79] recognized their research as a pioneering study for automatic individual tree detection (ITD) in open canopy mixed conifer forests. The authors presented a simplified framework for automated ITD from DAP-derived CHM based on algorithms originally designed for lidar point clouds. The results demonstrated that CHMs generated from digital photogrammetry, coupled with a local-maxima algorithm, are capable of estimating tree counts with an acceptable accuracy (F-score > 0.80) in open canopy mixed conifer forests [
79]. Based on this accuracy, the authors propose that this ITD algorithm has the potential to also estimate aboveground biomass (AGB), stem volume, and forest monitoring activities [
79]. Aguilar et al. [
67] researched methodologies based on DAP to generate DTMs in leaf-off phenological conditions of a teak plantation in Ecuador. This study resulted in an average plot-level vertical error of −3.1 cm, with 86.3% of the 58 modeled-reference plots having a DTM mean vertical error less than 5 cm (absolute value). The authors credit their accuracies to modeling their study site in leaf-off conditions, achieving high accuracy photogrammetric bundle adjustments during the computing of internal and external camera orientation, and good performance of both the ground points filtering algorithm and the interpolation method applied during the final DTM generation [
67]. The methods provided in this article show potential for AGB modeling over similar study locations [
67]. These two publications produced excellent qualitative and quantitative results in an effort to find the most efficient remote sensing methodologies using UAS of forest ecosystems.
3.5. Current Limitations
Each of the UAS applications in forestry encountered some limitations during the analytical stage of the research. Many of the limitations were specific to the forest types being researched. One specific example is modeling ground area and terrain in forests with dense vegetation cover [
98]. Many of the reviewed applications compared the accuracy of a normalized, reference, or combined lidar DTM to DAP 3D models built by other sensors (e.g., natural color or multispectral) [
90]. This interjection of UAS-lidar or ALS could prove beneficial for generating excellent terrain models (i.e., reference data), but is a more costly technology to acquire, especially for large study areas [
75]. Additionally, ALS point densities used in forest inventorying (typically with a resolution of 1–5 points m
2) frequently misdetect small objects, such as young trees [
96]. Other limitations of UAS-DAP included the relatively short amount of time that a UAS can spend in flight, the need to fly during hours where the impacts of shadows would be minimal, and the potential for changes in wind direction or speed to impair the desired spacing between images [
74,
99,
100]. Computer processing of UAS sensor data can also be demanding and time consuming. Jayanthunga et al. [
68] could not implement an ‘ultra-high’ quality SfM workflow on their area of interest with Agisoft due to excessive processing time and computer power requirements. The authors had to work around this limitation by generating four separate dense point clouds for leaf-on imagery with alternate quality levels [
68]. The four separate dense point clouds included downscaled original images by factors of 4 (4, 16, 64, and 256). Though the authors were able to work around this limitation, data processing can be a hindrance for researchers processing data with computers that do not have ample hardware resources. Even with adequate computer configurations, processing can still take hours to days to complete [
68]. In another example, Iizuka et al. [
87] reported that it took 23 h to process approximately 27 hectares of data to generate the three-dimensional models in Agisoft [
87]. Though there are technological, physical, and digital limitations to DAP, the reviewed studies on forestry applications unanimously acknowledge the utility, reliability, accuracy, and cost-effectiveness of UAS as a whole [
58,
80].
3.6. Future Research
Discussion on future research in UAS applications in forestry usually called for expanding on specific research applications, objectives, or project-specific limitations. For instance, Krisanksi et al. [
85], who flew a UAS through a forest to photogrammetrically estimate tree diameters, stated that improved collision avoidance systems or reliable GNSS, which supported autonomous flight, would benefit future research in similar complex, unstructured environments. Another example of specific future research can be seen in Hillman et al.’s [
28] study on UAS-DAP and lidar mapping approaches for estimating fire severity. The discussion of this research stated that UAS sensor data models should be assessed to determine the capability of representing fine-fuel, as well as developing metrics that can represent the under-canopy vegetation change [
28]. The ultimate goal of UAS-DAP forestry research is to establish enough confidence in the technology for use in forestry management, conservation, and sustainability practices [
72,
74]. Such applications could include updating forest inventories, estimating structural metrics, classifying tree species, assessing forest health, evaluating forest regeneration, or estimating damage from events such as wildfires and windthrow. Puliti and Granhus [
72] researched ways to directly translate raw UAS imagery into actionable insights for assessing forest regeneration. The findings were encouraging, as DAP had a higher overall accuracy than ALS data. Additionally, this research was among the first study where the operational costs for silvicultural treatments are modeled using remotely sensed data [
72]. More evaluations of future applications in forestry should strive to include a discussion on the costs and achieved benefit from integrating UAS.
4. UAS Applications in Freshwater Ecosystems
High accuracy and high precision are difficult but imperative to achieve for successfully studying freshwater ecosystem using remote sensing. The water quality of freshwater lakes, rivers, and reservoirs are rapidly changing across the globe due to increased watershed development and climate change in addition to many region-specific occurrences [
101]. Developing methodologies for remotely studying freshwater ecosystems provides researchers and policy makers with data at greater temporal and spatial scales compared with complimentary in situ measurements. The most common remotely studied components of freshwater ecosystems are suspended sediment, submerged aquatic vegetation (SAV), chlorophyll-a, and algae. These are all considered optical parameters; parameter sensors can directly measure based on reflectance spectra. Non-optical parameters are those that are not directly visible to sensors and include nitrogen, phosphorus, dissolved oxygen, etc. Often, optical water quality parameters intended for the assessment of water quality—for designated uses of drinking water sources or primary contact recreation—contain very distinct thresholds for public safety. For example, the World Health Organization (WHO) has a created guidance thresholds of cyanobacteria for safe primary contact recreation and drinking water sources [
102]. The guidelines indicate 10 µg of chlorophyll-a/L when cyanobacteria are the dominant species (or 20,000 cyanobacterial cells/mL) creates a “relatively low probability of adverse health effects”, while a concentration of 50 µg/L (or 100,000 cyanobacterial cells/mL) indicates a moderate potential for short- and long-term illnesses, if consumed [
102]. Additionally, the US Environmental Protection Agency (EPA) has indicated that for children aged 6–10, the threshold for recommended recreation and swimming if microcystins (toxins associated with certain species of cyanobacteria) are present is 8 µg/L [
103]. Therefore, inaccurately measuring concentrations of optical parameters using remote sensing methodologies in this one example can lead to a cascade of societal impacts and possible misguided swimming advisories among many other impacts.
Remotely sensed data allow for timely data collection with significantly greater spatial resolution than in situ measurements. Traditional in situ measurements consist of collecting grab samples for laboratory analysis and field meter readings from specific locations, often only one to a few per waterbody per sampling event. Moreover, these few samples are expected to represent the full waterbody, including all coves and channels. A remote sensing approach can provide full waterbody or stream reach coverage, can be rapidly deployed when desired, and can yield a faster turnaround of results. Remote platforms can also access areas, which may be unsafe or inaccessible to the field scientist (e.g., shallow non-navigable streams, backcountry lakes without road access for boat launching, and extremely contaminated waterbodies where sampler safety is the upmost priority). Unmanned aerial systems are gaining traction in freshwater ecosystem studies with significant growth from 2016 through 2018, before exponentially growing through 2021. However, UAS studies are often coupled with traditional in situ measurements to account for accuracy, correlations, or model creations.
4.1. Aircraft and Sensors
The most commonly used aircraft for freshwater ecosystem studies are proprietary copters predominantly consisting of DJI Phantom and Inspire models. In freshwater ecosystems, DJI models have been used to study algae [
46,
104,
105,
106,
107], SAV [
43,
106], chlorophyll-a [
100], and suspended sediment [
45,
108,
109]. Other copters included the Tarot FY 680 (Wenzhou, China), DJI M600 Pro, and the 3D Robotics IRIS quadcopter (Berkeley, CA, USA). The Bergen RC copter (Bergen, WI, USA) was also used to monitor algae and SAV [
43,
110]. The most commonly used proprietary fixed-wing systems consisted of SenseFly models, particularly the Swinglet and eBee. SenseFly models were commonly used to study chlorophyll-a [
111,
112], SAV [
42], and suspended sediment [
44,
45,
113]. Novel UAS are commonly constructed for the use of aqueous sample collection [
114]. A few studies for monitoring algae incorporated novel copter designs [
46,
110,
115], while one used a Helikite UAS balloon (Hampshire, UK) to raise a sensor to the desired altitude [
40].
Sensors used for studying algae, chlorophyll-a, SAV, and suspended sediment include natural color sensors, multispectral sensors, and hyperspectral sensors. Additionally, lidar (particularly green lidar) and thermal imaging sensors have been used to measure water depth and temperature, respectively, but will not be further discussed here [
116,
117]. Canon (Tokyo, Japan), GoPro (San Mateo, CA, USA), and Sony (Tokyo, Japan) were found to be the top three RGB camera manufacturers used in the 30 papers reviewed here and span all four parameters, including algae [
46,
115], chlorophyll-a [
44,
112], SAV [
118,
119,
120], and suspended sediment [
41]. Contrary to the many aircraft models used, only three types of multispectral sensors were deployed in these studies: Parrot Sequoia (six times), MicaSense (CA, USA) RedEdge (three times), and Tetracam MCA-6 (Chatsworth, CA, USA) (one time). Additionally, the selection of hyperspectral sensors followed no trends across the four parameters and included a GER 1500 model by the Geophysical and Environmental Research corporation (Milbrook NY, USA) [
104] OceanOptics (now OceanInsite) (Florida, USA) [
43,
110], ASIA (Marina Bay, Singapore) [
121], Headwall (Bolton, MA, USA) [
122], Resonon (Bozeman, MT, USA) [
123], HyMap (Sydney, Australia) [
124], and MicroHIS (Rijswijk, The Netherlands) [
125]. Lastly, it was common for a few studies to modify RGB sensors to record Blue, Green, and NIR bands [
44,
111,
112].
Typically applied to satellite imagery, scientists have used images from the Sentinel-3 Ocean and Land Color Instrument (OLCI) and MERIS satellites to measure the cyanobacteria index (CI) to identify the presence and concentration of a photosynthetic pigment (i.e., chlorophyll-a or phycocyanin) [
107,
126]. Sharp et al. [
107] used multispectral imagery from Sentinel-3 and Medium Resolution Imaging Spectrometer (MERIS) (300 m resolution) with multispectral imagery from a MicaSense RedEdge sensor (~12 cm resolution) to study at which scales the CI is most accurate. Kupssinsku et al. [
112] created a methodology for predicting concentrations of chlorophyll-a and total suspended sediment using imagery from Sentinel 2 and a modified RGB sensor. Bands 2 (Blue), 3 (Green), and 8 (visible and near infrared, VNIR) were used from Sentinel 2, and Blue, Green, and NIR wavelengths from the modified RGB sensor and imported into a machine-learning algorithm that was then compared to in situ data interpolated maps.
The most technically demanding optical parameter discussed here is algae, particularly cyanobacteria. Douglas Greene et al. [
105] found that a MicaSense RedEdge multispectral camera was “insufficient for estimating pigment concentrations [of phycocyanin–the unique photosynthetic pigment in cyanobacteria] under most conditions”. This study inferred that hyperspectral sensors would likely produce more precise and accurate results. However, multispectral cameras were sufficient for quantifying chlorophyll-a with NDVIs to in situ sample correlations producing R
2 values of 0.88 [
127], and of 0.70 [
128], and with a successful 86% detection accuracy of the presence of cyanobacteria [
46]. Quantifying a cyanobacteria bloom through UAS imagery into transferrable units set by the WHO and US EPA remains difficult with multispectral sensors, although it has been achieved using imagery from the Sentinel-3 OLCI and MERIS satellites [
107,
129]. Larson et al. [
113] found higher accuracy when measuring spectral reflectance of a turbid river with a field hyperspectral spectroradiometer compared to the UAS attached multispectral MicaSense Sequoia sensor. Their linear and stepwise regression models favored the use of multiple bands and numerous band ratios compared to single bands, and the R
2adj values were higher for the field hyperspectral spectroradiometer than the MicaSense Sequoia data.
4.2. Flight Planning
Lyu et al. [
115] focused on the pre-processing technology and flight parameters to monitor cyanobacteria harmful algal blooms. The authors began with identifying the effective resolution needed to be lower than 5 cm. Tested flight planning methodologies included flight duration, speed, height, and necessary overlaps. Additional sensor parameters tested included tilt, blur, and calibrations. Where flying heights were provided (25 of the 30 of the reviewed studies on freshwater environments), all except three were at or below 170 m, with an average of 101 m. Image overlaps ranged from 50 to 86%, and ground sample distances were mostly less than 13 cm. It was a customary practice to use ground control points (GCPs) to aid in the georeferencing process (16 of 30). GCPs have been discussed as being extremely important during post-processing stage of image mosaicking and geoprocessing. Notes on weather during UAS missions varied across the board but were often not included. Some studies selected sunny and calm days to collect their data [
40,
100,
107], while others flew on cloudy to overcast days to minimize sun glint [
42,
105]. To avoid sun angle glint, Lyu et al. [
115] recommended that users aim for less than 30-degree sun angle [
115]. These tests led to their ability to achieve a “maximum information acquisition efficiency”, which allowed Lyu et al. [
115] to detect cyanobacteria prior to a bloom formation and identify cyanobacteria apart from background algae and submerged aquatic vegetation. The only standard consensus for weather conditions was to fly on days where wind speed was low.
4.3. Processing
Liu et al. [
100] provided their post-processing methodology in great detail as well and included pre-processing, geometric registration, and radiation calibration equations with each data processing step, but did not mention any software used in the analysis. The methodology included geometric registration, and selected wavelengths for radiation calibration before stitching the images together. Finally, water quality results were incorporated into the model to create a map portraying the spatial distribution of the water quality parameters [
100]. Using Agisoft, Corti Meneses et al. [
118,
119] described their very detailed image processing methodology and includes references to describe specific settings used in Agisoft to create their point clouds of aquatic vegetation. In their study of aquatic reed extent and classification, a range of quality and matching parameters were tested through a method of trial and error, due to their flights being conducted manually [
118]. Density was determined from hyperspectral data with RGB imagery using OPALS 2.2.0 software (software unique to this study), and the authors included a mention of every function used in the software for the analysis as well as additional equations. Detailed and complete processing functions and methodologies using Pix4D or Agisoft were not explained in any of the studies using these platforms for studies of freshwater ecosystem. Although there is no established workflow or methodology for analyzing optical parameters of freshwater ecosystems, the Pix4D software is commonly used in the orthorectifying process of digital image analysis (
Figure 4).
Regression and correlation algorithms were often employed to create links between in situ data—being water samples or field surveys—with UAS-derived reflectance. Spectral indices (SI or vegetation indices) were frequently used as well for chlorophyll-a, algae, and SAV studies. The most common methods for analyses include variations of NDVI and “mathematical algorithms”. NDVI typically consist of analyzing Red and NIR wavelengths [
105,
128]. Variations of the NDVI include a green to NIR analysis (e.g., NDWI) [
44,
45,
127], and are most commonly found within chlorophyll-a studies. Mathematical algorithms dominate in the analytical methodologies for algae and chlorophyll-a studies. Many SI have been mathematically modeled [
46,
104,
121], including the cyanobacteria index [
107,
110], and with the powers of machine learning classifiers such as random forests [
106,
112,
115,
122], they can be implemented concurrently.
Data analysis software most commonly used includes coding platforms, such as R [
43,
106,
107], Python [
105,
112,
125], and Matlab (Natick, MA, USA) [
108,
109,
130]. ArcGIS was also commonly used across studies for data analysis [
43,
106,
108,
109]. However, the most common data analysis software consists of a mix of other proprietary platforms including but not limited to Adobe Photoshop (San Jose, CA, USA) [
46] and eCognition (Sunnyvale, CA, USA) [
43]. Douglas Greene et al. [
105] were the only ones to use a Python script for their image geo-referencing using equations based on each image’s pixel dimensions and rotations. The authors include their Python script in a supplemental information document, a practice that is becoming more commonly emphasized in open science.
4.4. Qualitative and Quantitative Acheivements
Identifying the proper sensors to use are a function of available technology, and the study question at hand. Most studies monitoring the distribution of SAV found successful results with RGB cameras, and a few opted for modified RGB or multispectral sensors to include data in the NIR wavelengths. Others found the blue, green, and NIR portions of the electromagnetic spectrum particularly helpful, thus creating modified SI as blue and green light has better water penetration abilities than NIR. Modified SI include NDWI ((NIR − G/NIR + G)), BNDVI ((NIR − B/NIR + B)), NGBDI ((G − B/G + B)), and NGRDI ((G − R/G + R)) [
105,
127]. The more detailed algae and cyanobacteria studies focusing on a specific species of algae present turn toward hyperspectral sensors due to the numerous and narrow bands in which they sense.
Studies monitoring and or quantifying optical components of freshwater ecosystems often include comparisons from UAS-derived measurements to in situ data. Becker et al. [
110] found their UAS data had a higher accuracy when compared to the FieldSpec (Malvern, UK) spectral measurements (in situ reference data) (R
2 = 0.987, RMSE = 0.982) for areas of the lake where there was no surface accumulation of algal scum. Other studies found high levels of accuracy using UAS as well, including Qu et al. [
46], who produced a detection accuracy for cyanobacteria of 86% with false negative and false positive results, resulting in 6% and 8% of the error, respectively. Lastly, Douglas Greene et al. [
105] were able to predict the concentration of microcystin (a toxic component produced by certain species of cyanobacteria) within 33%. There was more variability in the accuracy of SI to measure chlorophyll-a; for example, Choo et al. [
128] (R
2 = 0.7031) and Kim et al. [
127] (R
2 = 0.88). Regression models and machine learning algorithms produced slightly greater accuracies for this application as found in Kupssinsku et al. [
112] (R
2 = 0.89) and Lu et al. [
122] (R
2 = 0.96).
SAV studies, comparing UAS-derived measurements to in situ data, often aimed to identify certain species of SAV from other present SAV. This analysis was performed primarily to differentiate an invasive species from native species. High accuracies can be obtained from supervised classification algorithms. A few great examples of SAV classification success include: (1) Chabot et al. [
42] with an overall accuracy of submerged features of 84%, (2) an overall accuracy between 90 and 92% depending on analytical method used in Corti Menses et al. [
119], and (3) an overall accuracy of 93% for Brazilian waterweed in Underwood et al. [
124]. Lastly, regression analyses and reflectance values for suspended sediment yielded high accuracies for total suspended sediment in Prior et al. [
108] (average TSS R
2 = 0.97) and Kwon et al. [
125] (R
2 = 0.90 using a support vector regression model).
4.5. Current Limitations
A common hindrance for UAS in studying freshwater ecosystems is the spectral resolutions of the sensors used. For certain applications, RGB or multispectral sensors are appropriate to use, such as suspended sediment and SAV, but for others, including more detailed studies of algae or non-optical parameters, hyperspectral sensors are suggested. The enhanced spectral resolution comes with additional costs and aircrafts in which they can communicate. Nonetheless, UAS for studying and monitoring freshwater ecosystems is a growing market and niche globally.
Traditionally, the process of creating an orthomosaic was created for non-aquatic ecosystems, such as forests or agricultural fields, where tie points can be used to facilitate the orthomosaic process. However, in aqueous studies, the surface of the water is often a homogenous structure, which decreases the number of tie points possible, thus making geoprocessing challenging [
131]. Many of the studies reviewed here identify this limitation. A common workaround is to include ground control points or ensure enough of the shoreline is present in each photo [
41,
44,
46,
104,
111,
120,
127]. Sharp et al. [
107] found the inconsistency of the surface of the water due to waves and the lack of reference points made it impossible for part of their dataset to be included in analyses. Kislik et al. [
106] used a single image analysis approach for part of their study to avoid the need for stitching images after identifying the challenges mosaicking images have when images are of a uniform surface.
Rather than focusing on the identification of tie points for image stitching, others turned to the geometric properties of each image. Using Python scripts, Kislik et al. [
106] used the metadata for each image (including centroids, footprints, ground sample distances, and altitude) to mosaic the images together. Douglas Greene et al. [
105] had a similar, yet novel approach using ERDAS Imagine software (Stockholm, Sweden) and Python. Extracted metadata for each image consisted of the two-dimensional coordinates, degree of rotation, and altitude using camera and flight specifications at the time of image capture and trigonometric functions in Python to georeference each image. The Python script used is provided in the supplementary information [
105].
As most aquatic parameters, including algae, chlorophyll-a, and suspended sediment, are components of the water column, they are not stationary objects and can occur in different concentrations at varying locations throughout a waterbody. For example, unlike measuring the DBH of a tree using a UAS where the UAS-derived measurements can be checked with reference data of the same exact tree in the same exact location, concentrations of aquatic parameters can change in a single spot from the time of UAS image capture to the time of in situ sampling. This is not as limiting for SAV, as rooted macrophytes are not suspended and moving vertically and horizontally within the water column. Only a few studies identified the possible temporal difference between their UAS data and in situ data. Most studies failed to address this discrepancy apart from those injecting known concentrations of suspended sediment in fabricated research flow paths [
108,
125]. Ehmann et al. [
45] noted the time lag between UAS image capture and sample collection (less than 10 min), whereas others did not. Additionally, Pyo et al. [
121] mentioned this discrepancy in temporal sampling could be a partial cause of error. Douglas Greene et al. [
105] and Becker et al. [
110] stated that their findings show a high level of variability of harmful algal bloom concentration on a one to two-day time scale.
The cost of certain technological components of UAS missions for studying freshwater ecosystems has been identified as a strong limitation in producing the most accurate results possible. Douglas Greene et al. [
105] explicitly stated that “a multispectral camera is insufficient for estimating pigment concentrations [of phycocyanin] under most conditions. As hyperspectral imaging becomes more affordable…more targeted predictions of cyanobacteria will be possible”. Becket et al. [
110] and Veronez et al. [
41] also noted the high, and therefore limiting, cost of hyperspectral imagers. Overall, 13 of the studies reviewed for the application of UAS in freshwater ecosystems mentioned that in general, UAS are a low-cost method to achieve a high spatial and temporal resolution when monitoring freshwater ecosystems.
4.6. Future Research
The intended end goal of any water quality study is to gain knowledge to assist in the improvement of water quality. Ideally, data gathered through a UAS would be acquired, processed, and synthesized as quickly as possible. In the case of harmful algal blooms, rapid acquisition of results is needed to guide actions taken by management agencies for public health protection. Qu et al. [
46] mentioned they had an extremely fast (less than two hours) turnaround of results for their study from the time of aerial mission through image and data analysis to results. Future research could streamline this process into a user-friendly methodology and be incorporated into risk management plans [
105]. Additionally, future research should incorporate additional site parameters, including bathymetry or water depth, as benthic substrate if visible from the surface is likely to influence suspended sediment reflectance values [
42,
109]. Many papers also mention the need for future studies to repeat their studies and a greater temporal coverage of the seasons, during different flow regimes, and with waterbodies in alternate regions [
60,
105,
109]. Due to the optical properties of water, scientists are intrigued with the blue band of multispectral sensors [
42]. Scientists have mentioned future research should include a BlueNDVI and studies of penetration depth of blue sensors dependent on ambient water quality [
105,
132] as well as directly compare multispectral imagery and hyperspectral imagery, which includes a blue band [
109]. Lastly, future research needs to focus on creating a universal workflow for image stitching across a uniform surface such as water.
5. UAS Applications in Grasslands and Shrublands
The conservation and greater understanding of grasslands and shrublands is becoming increasingly critical as climate change, the introduction of invasive species, and increased human disturbances continue to rapidly degrade these ecosystems [
26,
35,
133,
134]. Grassland and shrubland ecosystems support a considerable amount of biodiversity and play important roles in water conservation, hydrological regulation, and carbon storage. Still, these ecosystems are highly sensitive to disturbances [
37,
135,
136,
137]. In comparison to other ecosystems, grasslands and shrublands often have smaller and more heterogeneous vegetative structure. This diversity in structure and composition results in difficulties for using traditional remote sensing methods, such as satellite imagery, in conventional applications including plant species classification and aboveground biomass (AGB) estimations [
39,
138,
139]. Additionally, manual collection of field-based data is often time-intensive and expensive, or even inaccurate due to the often highly mixed nature of grasses and shrubs [
37]. UAS can be used to effectively and non-destructively monitor and map grassland and shrubland areas, as well as provide critical spectral information [
61,
135,
140]. UAS provide the spatial resolution that traditional remotely sensed data often cannot, which has allowed UAS to become an increasingly popular tool. The precision, resolution, and adaptability of UAS have allowed them to become an asset in understanding and effectively monitoring grassland and shrubland species composition, local scale biodiversity, AGB, fractional vegetation cover (FVC), and other quantitative aspects of these ecosystems [
136,
138,
141]. Technologies such as UAS-lidar serve as a primary example of this increase in capability, having been proven to create 3D models of study areas, which can aid the aforementioned estimations [
26,
142,
143].
Several of the reviewed papers specific to this discipline have discussed the apparent lack of grassland and shrubland representation in UAS research. As the use of UAS has increased in natural resource applications, grasslands and shrublands have been slower to adopt this technology, unlike other ecosystems, such as forests and croplands [
143,
144,
145]. Many of these same authors identified the need for additional future research to be conducted related to UAS monitoring of grasslands and shrublands. The increased adoption of UAS and similar precision technologies will assist in the determination of best management and conservation practices, especially in regard to the many disturbances that continue to degrade these natural systems [
34,
36,
146]. Most similar to this review of UAS applications in grasslands and shrublands is a study by Hernandez-Satin et al. [
61]. However, the focus of their analysis is on understory vegetation and not areas classified directly as grasslands and shrublands.
5.1. Aircraft and Sensors
A variety of UAS were employed for research of grasslands and shrublands, with studies often using more than one system for remotely sensed data collection [
35,
147]. By far the most commonly used UAS were aircrafts manufactured by DJI, including several variations of the Matrice, Phantom, and Inspire models [
35,
134,
148]. Among these applications, the DJI Phantom 4 Pro was the most ubiquitous, with applications ranging from fire predictions [
133], disturbance detection [
135], structure mapping [
144], and FVC estimations [
149], to AGB estimations [
38]. Of the studies using the Phantom 4 Pro, all used the integrated CMOS sensor rather than a custom sensor combination. Multiple studies featured a multi-source data analysis by integrating UAS sensor data with satellite imagery. For example, Rampant et al. [
133] utilized the DJI Phantom 4 Pro with Landsat 8 Operational Land Imager (OLI) imagery to study fire predictions. Lin et al. [
141] used Phantom 3 Pro with Landsat 8 OLI imagery to estimate FVC. Lastly, Ndyamboti et al. [
149] estimated FVC with UAS and used these data to upscale and validate previous Landsat 8 imagery.
While no singular sensor stood out among the rest, Sony [
136,
142,
150] and Parrot [
36,
135,
151] were the two most common brands. In grasslands and shrublands, the often highly heterogeneous nature of vegetation requires sensors with high spatial resolutions. Because of this, sensors were often chosen specifically for their spatial resolutions. For example, Ndyamboti et al. [
149] used a Reigl VZ 1000 scanner due to its ultra-high spatial resolution of <5 cm to develop high-accuracy FVC estimates. The median spatial resolution (pixel size or ground sampling distance (gsd)) throughout the UAS applications in grasslands and shrublands was 3.75 cm, exhibiting the necessity of ultra-high resolution in this discipline. Still, a wide variety of multispectral UAS sensors were utilized in grassland and shrubland analysis [
35,
39,
138,
151]. Studies that integrated multispectral sensors often focused on the Red-Edge and NIR wavelengths. One of the most commonly used sensors within the reviewed literature, the Parrot Sequoia, collects data in Green, Red, Red-Edge, and NIR bands. Dedicated multispectral sensors, especially ones using NIR, were able to accomplish a large variety of applications with high accuracies [
151,
152,
153]. As with other natural resource disciplines, more advanced sensors such as hyperspectral imagers were seldomly featured. Only four studies utilized hyperspectral imagery, perhaps due to the expensive nature of hyperspectral sensors [
135,
147,
153,
154].
5.2. Flight Planning
Unlike in some other natural resource disciplines, UAS flying heights were commonly provided within the grassland and shrubland application papers. Additionally, most papers also mentioned side and forward overlaps of images. Specific flight parameters beyond flying height and image overlap, however, were often lacking. Flying heights for grasslands and shrublands varied greatly from 5 m above ground to 120 m [
36,
149,
151]. The average flying height throughout all papers reviewed was approximately 60 m above ground, while the most common flying height was 30 m. Although few papers cited established methods, many mentioned that their flight parameters, including flying heights, were chosen to produce specific or desired spatial resolutions. Fraser et al. [
150] reported very specific flight details, mentioning that parameters were selected to ensure that the UAS “imaged each ground location with up to 60 photos at 3–15 mm resolution”, resulting in sub-centimeter pixel sizes for some SfM models. Interestingly, several UAS applications in grasslands and shrublands featured flight planning parameters with forward overlap being much higher than side overlap [
136,
142,
153]. This design allows the users to collect a high number of images, while considerably reducing the flight time. Most studies utilized flight planning software in determining specific parameters, including Mission Planner [
39,
147,
155], FragMAP [
140,
141,
156], Pix4D Capture [
35,
137], and Altizure [
38,
134]. However, specific details regarding how these planning software programs were configured and why they were chosen were not given.
5.3. Processing
Typical processing measures for grassland and shrublands included image quality evaluations, orthorectification, geometric correction, and radiometric correction [
133,
138,
152,
157], or occasionally emissivity correction [
153,
154]. These pre-processing and spatial data modeling procedures were used to support applications including classifications and FVC or AGB estimations. Lu and He [
138] discussed each of these steps within their study, focused on species classification, in well-organized sections, and included a visual workflow that simplified these processes. The Ndyamboti et al. [
149] study, which estimated FVC in grasslands, also discussed processing in detail, mentioning that orthorectified data were transformed into DSM.
Several studies used spectral indices to process and further analyze data. The NDVI was the most commonly used index for shrub and grass monitoring; it was used for a variety of purposes, including to define shrubs and grasses from bare ground and to estimate FVC [
137,
141]. However, Strong et al. [
148] used an Enhanced NDVI (ENDVI) to differentiate grasslands at a community level and found that the ENDVI was more effective at delineating species than the NDVI. Other spectral indices, such as the Enhanced Vegetation Index (EVI), Soil Adjusted Vegetation Index (SAVI), and Blue green ratio index (BGRI), have also been shown to be useful in analyzing grassland metrics [
139,
141].
While a variety of spatial data modeling software packages were used, ArcGIS, Agisoft, and Pix4D were the most common software used for processing of UAS sensor data of grasslands and shrublands. Approximately half of the UAS applications related to grasslands and shrublands mentioned using a specific SfM processing workflow. Most of these studies utilized Agisoft or Pix4D, which feature semi-automated workflows and proprietary SfM-MVS algorithms. However, of the studies which mentioned SfM, few provided in-depth discussions of SfM methods, including the quality settings or filtering methods applied. Two studies which did discuss SfM workflows in detail were Fraser et al. [
150] and Forsmoo et al. [
155]. Fraser et al. [
150] investigated the use of UAS and SfM to characterize tundra shrub vegetation; in this study, a general processing overview was given with detailed SfM processing steps described in supplementary materials. Forsmoo et al. [
155] studied grassland sward heights and measurements, including an in-depth discussion of the SfM processing workflow that was used. These methods were supported by a visual flow chart emphasizing each step. This study was also unique in that it was the only one within the papers reviewed to use the MICMAC (Paris, France) open-source processing software. Other proprietary software includes eCognition [
39,
134,
147], ENVI (Broomfield, CO, USA) [
138,
148,
158], and Spectral Pro (Bozeman, MT, USA) [
153,
154]. Many studies utilized several different software packages for a variety of different purposes throughout pre- and post-processing. Lu and He [
152], for example, used ENVI for image quality evaluation and radiometric correction, Agisoft for image mosaicking and orthorectification, ArcGIS for geometric correction, and eCognition for object-based classification.
5.4. Qualitative and Quantitative Acheivements
One of the main objectives for UAS applications in this discipline was to accurately classify grassland and shrubland species, despite the often highly mixed nature of these ecosystems [
138,
147,
152]. Collecting species-level data of grasslands and shrublands is critical for gaining a better understanding their form and function. This information can then be used for conservation and management purposes [
39]. Several of the UAS applications were able to classify grasses and shrubs with relatively high accuracies through the use of UAS. One particularly formative study by Lu and He [
152] exhibited the ability of UAS to classify ecologically and economically important species within grasslands. This study performed classifications on several grassland species, including Awnless brome (
Bromus inermis), goldenrod (
Solidago canadensis L.), milkweed (
Asclepias L.), and fescue (
Festuca rubra L.), and found that classification models had an overall accuracy of 85%. Another study by Melville et al. [
147] used a hyperspectral UAS to classify lowland grasslands. This study was able to successfully classify five different vegetation classes (
Wilsonia rotundifolia,
Danthonia/
Poa,
Themeda, triandra
Acacia dealbata, and soil) with an overall accuracy ranging from 71% to 93%. The RF training model showed much higher accuracies than accuracies obtained for final classification results, exhibiting the importance of object-based RF classification models for species composition and classifications from UAS-derived data.
Another common application within grasslands and shrublands was AGB and FVC estimations [
140,
149]. AGB is a key indicator of carbon sinks and can be used to effectively estimate carbon stocks, especially within shrubs [
137,
159]. Several UAS applications were able to effectively use DAP workflows to estimate these metrics. One study, from Zhao et al. [
159], classified individual shrubs using UAS and LiDAR data with an overall accuracy of 91.8%, and found that textural aspects of UAS data were the most important predictor of individual shrub AGB. Another, from Abdullah et al. [
137], estimated AGB and below ground biomass (BGB) and used these results to quantify carbon stocks in desert shrubs, although their accuracy was not validated.
5.5. Current Limitations
A common limitation of UAS applications in grasslands and shrublands is the spectral resolution of the sensor, or the number of bands that the sensor can collect data in. Limited spectral resolutions may result in a decreased ability to discriminate between different vegetation types, as sensors with greater spectral ranges will detect greater amounts of discrete spectral information [
147]. Spectral resolution is particularly critical for species classification and composition estimates [
138,
147]. Additionally, lesser numbers of bands limit the number of spectral indices that can be calculated, especially if the sensor is unable to collect data in NIR. It should be noted, however, that hyperspectral sensors are much more expensive than multispectral, which may result in difficulties accessing these sensors. Lu et al. [
138] modified a Canon digital camera in their study by replacing the red band with NIR, but still mentioned that this sensor was limited in that it only collected data in three bands. A compromise between limited multispectral and more comprehensive hyperspectral sensors may be sensors which can detect several visible as well as non-visible (e.g., NIR or thermal) wavelengths. In other disciplines as well as commercial markets, intuitively designed sensors such as the commonly used Parrot Sequoia, MicaSense Dual Camera Imaging System, or Tetracam Micro-MCA system.
Several studies also noted difficulties in measuring AGB, height, and other quantitative aspects of vegetative biomass. Both underestimated or overestimated estimations were observed and may have been caused by a variety of elements, including discrepancies in training data, the specific modeling methods used, and the vegetation size and density [
26,
144,
155]. Examples of these measurement errors can be seen in [
155], which included detailed discussions of overestimated taller sward heights and the underestimated shorter sward heights. This study used a drop disc method, which measures a sample of sward height, and could explain some of the overestimations. Underestimations, on the other hand, may have been caused by increased homogeneity in shorter sward populations [
155]. In another example, Musso et al. [
144] found that UAS bias when estimating structural attributes of shrubs increased as shrub size and density increased. Madsen et al. [
26] also noted that absolute biomass change of the shrub species (
C. scoparius) may have been overestimated in their study due to accidental inclusion of additional shrub, forb, and grass species in training data. Separating out these species within training data samples proved difficult due to their mixed nature.
While grasslands and shrublands often must be sensed using high spatial resolutions, multiple studies discussed the issues that arise when the spatial resolution of sensors used are too high. Lu et al. [
138], for example, noted that while high spatial resolution can offer great spectral and textural detail, ultra-high spatial resolution UAS sensor data can “bring challenges for segmentation and feature selection”. Similarly, Abdullah et al. [
137] acknowledged that the detailed information that UAS provide may not always be beneficial for large area studies. The ultra-high spatial resolution of UAS can also make geometrical correction difficult, as common GPS errors range larger than 1 m, while UAS resolution is often much finer than that [
138]. Lu and He [
152] recommended using high-accuracy GNSS to mitigate this issue.
5.6. Future Research
The main goal of most grassland and shrubland UAS applications was to effectively quantify features such as species composition, vegetative structures, AGB, or FVC for conservation and management purposes. While many of the studies were able to achieve these goals with high accuracy levels, there were some noted biases and limitations, which led to identification of needed future research and refinement. Several studies suggested including more data, whether it be field- or UAS-based [
26,
133,
138]. For example, the Rampant et al. [
133] study, which examined fire predictions in grasslands, mentioned that future research should collect more field data to account for geographic distribution and rainfall variation. Another prominent knowledge gap for UAS applications in grassland and shrubland ecosystems is the optimal spatial resolution analyzing data of many of these ecosystems. Several studies point out the overly detailed information that UAS often provide, which can make classification and other aspects of image analysis difficult, as well as introduce errors when geometrically correcting the sensor data [
137,
138,
152]. At this time, there appear to be minimal studies which have specifically researched the ability of different spatial resolutions for applications within grassland and shrubland ecosystems, although the spatial resolution is a key parameter [
158]. While several applications flew UAS at different heights above ground, producing varying spatial resolutions, there were few explicit discussions on how these differences spatial resolutions affected the subsequent results.
6. UAS Applications in Agriculture
The challenges facing modern agricultural practices and global food security are numerous and substantial. From rising global temperatures, changes in precipitation patterns, and increasing risks of invasive species and diseases to the further resource demands of human populations, the global agriculture sector is experiencing compounding pressures [
49,
160,
161]. UAS have been adapted as a tool for monitoring and managing local scale crops for nearly half a century [
2,
7]. Throughout this time, UAS have proven as a capable solution for monitoring vegetation health, estimating potential yield, mapping disturbances, administering biological and chemical controls, and serving as a tool for precision management applications [
2,
47,
162]. While applications including UAS have certainly become more advanced and focused in the last five years, it is still recognized by many that the objective of incorporating this tool into agricultural practices remains to reduce input time and resource costs, while providing increasingly fine-scale and accurate information to end users.
The adoption of UAS for precision agriculture is expected to represent a major market force over the coming decades. Surveys on global markets expect UAS to reach a value between
$14 and
$36 billion within the next 10 years [
7,
163]. Although in some regions the rate of adoption has been slower than expected for precision management solutions, an increasing number of studies are starting to show that the rate of the adoption is expected to increase in the near future, with those willing to adopt such technologies experiencing a competitive advantage [
2,
47,
164]. In association with the refinement of statistical sampling techniques developed through decades of work in precision agriculture, UAS offer a supplement and alternative to field data-driven management. As a supplement to field-based sampling, UAS provide a means to reduce the resource intensive nature of measuring attributes, such as leaf area index (LAI), plant height, or potential yield, while remaining non-destructive in nature [
165,
166,
167]. As an alternative to other remote sensing data, such as satellite imagery, UAS provide the temporal and spatial resolution necessary to study phenology, yield accumulated throughout specific crop growth stages, and individual plant production [
168,
169,
170,
171].
In our review of primary literature from the last five years (2016–2021), several crop species were found to be common subjects of investigation using UAS. One of the most common applications was the estimation of pasture quality and yield [
54,
55,
168,
172,
173]. Other studies included livestock monitoring [
164], winter oilseed rape [
174], vineyards [
160], wheat [
175], and tree crops [
15]. Among these studies, UAS were found to sufficiently collect large amounts of data on crop water status, vigor, biomass estimation, disease and weed presence, plant density, and the dispersal of chemical and biological controls [
7,
62,
176,
177]. These applications featured varying levels of detail regarding the aircraft, sensors, flight planning, and data processing methodologies.
Several recent review papers were found that included summaries of agricultural applications of UAS over the last decade. These review papers either summarized specific UAS operations, such as a review of hyperspectral imagery by Adao et al. [
176], crop phenotyping by Yang et al. [
166], and pest management by Iost Filho et al. [
7], or provide a general overview of remote sensing and Geographic Information Systems and Science (GISS) technologies including UAS [
62,
162]. These latter papers are suggested for readers less familiar with remote sensing and Geographic Information Systems (GIS), including how they have come to benefit agricultural disciplines. Of particular importance for our review are studies by Hassler and Baysal-Gruel [
62] and Radoglou-Grammatikis et al. [
2]. In this first article, Hassler and Baysal-Gruel [
62] provided a thorough synthesis of common applications for UAS in precision agriculture as well as hardware and software that have been used to solve specific challenges. In Radoglou-Grammatikis et al. [
2], a high-level overview of UAS technologies and regulations concerning precision agriculture are summarized.
6.1. Aircraft and Sensors
Several configurations of UAS (e.g., fixed-wing, rotary-wing, and hybrid) are available to consumers for use in natural resource applications. Most common for agricultural purposes are fixed-wing and rotary-wing aircraft, with rotary-wing being preferred by most due to their maneuverability and flight control [
48,
62,
168]. In our review of agricultural studies featuring UAS, over 80% of the studies operated small rotary-wing aircraft. Many of these aircraft were from DJI (e.g., Phantom 4 Pro, Phantom 3, M100, M200, M600). The DJI Phantom 4, in its several models, was the most common aircraft, being regarded as a user-friendly and relatively affordable quadcopter, capable of achieving both a high-resolution data product and a high accuracy for numerous applications [
25,
49,
76,
172]. Two application papers [
169,
178] featured custom built multi-rotors, speaking to the still adaptable nature of this platform.
While many papers in the past have recognized UAS RGB sensors as simple, affordable, and capable hardware [
166,
173], our review of literature from the last five years has found that they were not commonly applied as the sole source of remotely sensed data. Only 6 out of the 30 review papers used RGB cameras as their sole sensor for agricultural analysis. Instead, we have seen a shift towards solely multispectral sensors or the use of both multispectral and RGB sensors. Multispectral UAS sensors have become quite capable and accessible in recent years. Numerous studies have also detailed how relatively affordable (<
$10 k) multispectral sensors have come to outperform RGB cameras, despite known tradeoffs in lens quality and subsequent gsd [
62,
173,
179,
180]. Still, for some investigations focused specifically on measures of biophysical attributes, RGB sensors have been found to provide the highest accuracy, likely due to their larger focal lengths (on average) and camera characteristics suited for digital photogrammetry (e.g., more commonly featuring global shutters) [
55].
For many applications in precision agriculture, multispectral sensors have become the preferred sensor of choice. The increased spectral resolution, especially in the Red-Edge and NIR wavelengths, has been proven to support analysis of plant health and nutrient status [
176,
177,
181]. These UAS multispectral sensors now often feature accompanying illumination sensors (i.e., downwelling light senor or DLS) and calibration plates, necessary for simplifying pre-processing of the respective imagery [
172,
179]. In our review, multispectral sensors were twice as common as RGB sensors in agricultural applications, with even more studies using multispectral data in combination with other sensors to further improve performance.
Thermal and hyperspectral sensors were found to represent only a small portion of research projects involving agriculture. Thermal sensors (including Forward Looking Infrared or FLIR) are becoming more openly applied in combination with other UAS sensors to detect water stress and plant health [
47]. Studies, such as Santesteban et al. [
160], have shown that modern FLIR sensors can be used to capture single date and seasonal assessments of water stress. When mounted on UAS, these thermal sensors have become capable of capturing data at ultra-high resolution (<9 cm gsd) and are offered by multiple companies at prices comparable to other sensors (e.g., under
$20 k from MicaSense, SenseFly, DJI). Commercially available hyperspectral sensors are also becoming more available, although still facing a more significant input cost than the previously mentioned sensor alternatives [
176]. While these sensors have been studied as a way of capturing discrete crop traits (e.g., various nutrient status including phosphorus and potassium), they are largely absent from use and discussion in the papers that we reviewed. Among the present challenges in adopting hyperspectral sensors for use in agricultural applications are the considerable initial costs, large amounts of data being collected and processed, and level of technical expertise required to appropriately filter and calibrate the subsequent data [
48,
62,
177].
Further advances in data processing and analysis (including machine learning) have opened the door to the more wide-scale adoption of data fusion and the operation of multiple UAS sensors. Roughly one-third of the review papers specializing in agricultural applications featured the use of multiple sensors. When properly captured and processed, remotely sensed data from a combination of sensors could be used to improve the accuracy of estimations for crop biophysical and biochemical attributes [
48]. One such example of combining an RGB and multispectral sensors is given by Pranga et al. [
173], in which the spectral and structural information gathered from the fusion of both sensors outperformed either when used alone. In another study, Maimaitijiang et al. [
181] used a combination of RGB, multispectral, and thermal UAS imagery to conduct soybean phenotyping and biochemical analysis. The fusion of multispectral and thermal data was found to provide the best estimations of soybean nitrogen concentrations and chlorophyll content.
6.2. Flight Planning
Few studies were found that included variations of flight planning parameters, other than flying height and the image overlap. Additional information on the guiding standards for each flight or citations for established practices were largely undocumented [
172,
182]. Further discussion and evaluation of image overlap, image illumination, and consistency in scale is needed to advance utility of UAS in agriculture and establish best practices [
2,
48]. In the testing of various parameters, including image forward overlap and flight line orientation, Tu et al. [
15] provided great evidence for constructing an informed UAS flight plan. Establishing such protocols, for the most effective image capture using UAS sensors, will inspire greater confidence in the resulting data products [
15].
Regarding image overlap, the recommendation for most agriculture applications was found to be at least 75% along the flight line (forward overlap) and 65% across flight lines (side overlap) regardless of the desired processing [
183]. This high level of image overlap was found in many agricultural studies, including in the use of thermal imagery by Santesteban et al. [
160], which exhibited 80% front and side overlaps [
48]. Several studies opted for even greater levels of image overlap, given their use of small sensors (such as the Phantom 4 Pro CMOS sensor), with front and side overlaps of 90% [
49,
167,
173]. These image overlaps, in combination with selection of an appropriate flying height, have been found to optimize the spatial data quality, including the point cloud density, and subsequent accuracy of measuring crop biophysical attributes [
15]. When image overlap is controlled by flight speed, however, it is important to not fly at a speed which induced motion blur (i.e., too fast) [
15].
Variations in UAS flying height has been studied repeatedly for agricultural applications. Wilke et al., [
180] flew as low as 10 m above the ground, generating a gsd of 0.69 cm. In Oliveira et al. [
184] and Kraunaratne et al. [
54], a distinct difference in the spatial resolution (gsd) and estimation accuracy was found at varying flying heights, with lower altitudes (e.g., 25–30 m) producing the highest estimation accuracy. Parameters such as plant density, pasture dry matter yield, and crop height were each found to be optimally estimated with flying heights between 30–40 m regardless of the sensor type [
49,
55,
173,
180].
Not unique to UAS imagery, variation in illumination between images can have varying degrees of influence depending on the type of sensor, spectral wavelength, time of day, and climate conditions. In the paper by Deng et al. [
179], spectral wavelengths such as the Green and Red bands were found to be more affected by changes in illumination than Red-Edge and NIR bands. Several studies highlighted the need to capture imagery on overcast days, or at least as a time of consistent illumination (i.e., solar noon) to reduce radiometric noise and shadowing, which is known to dramatically influence both reflectance values and SI [
171,
180,
183].
Of the 30 studies reviewed in this section, 22 (73%) included the use of GCPs. These GCPs were created either through the use of dedicated objects and real-time kinematic (RTK) sampling of their fixed location or through the use of known points and positional registration of their location. Several of the other studies relied solely on the visible separation of discrete treatment plots. The raw imagery collected using consumer-grade UAS sensors often features geometric deformations, justifying a need for precise geometric correction prior to further data analysis [
166]. However, as in other disciplines, GCPs may not always be available or beneficial. One study by Oliveria et al. [
184] even found that the inclusion of GCPs negatively impacted their ability to identify orchard trees and measure their heights.
6.3. Processing
Using the raw imagery collected from UAS sensors, applications focused on precision agriculture highlighted the diversity of spectral, textural, and photogrammetric data available. Spatial data products such as vegetation indices and photogrammetric point clouds, as well as the ultra-high resolution texture features, have been used to establish empirical relationships to crop attributes such as pasture biomass, yield, crop development, and plant phenotyping [
54,
62,
174,
185]. To highlight the importance of these data products, both the photogrammetric (i.e., SfM) and spectral (radiometric calibration and SI) data processing considerations were examined.
Photogrammetric processing was nearly ubiquitous in precision agriculture applications involving UAS. Modeling software such as Agisoft, Pix4D, and other proprietary solutions have made the user experience more accessible and automated in recent years [
22,
24,
62]. For applications specific to agriculture, Agisoft and Pix4D were the most commonly used software, with Agisoft having a slight lead. Other modeling software include Microsoft ICE (Redmond, WA, USA) [
183], DroneDeploy (San Francisco, CA, USA) [
163], and MicaSense Atlas [
165]. Rahamn et al. [
162] also provided the synthesis of commonly used UAS image analysis and modeling software for agricultural applications. We found that although a vast majority of papers included a SfM workflow as part of their post-processing, over 40% of them did not include a complete discussion on their data processing methods (i.e., quality settings and filtering choices). The level of details included on quality and filtering selections ranged from no discussion to a complete explanation [
55,
168,
172,
173,
174]. For the most in-depth discussion of SfM processing considerations, we recommend Michez et al. [
55]. This discussion demonstrates how “high-accuracy” photo alignment and “high-quality” photogrammetric data can be generated to pronounced effect for subsequent spatial data exploration and analysis. Additionally, the filtering and fine-tuning of the SfM workflow should be selected based on the characteristics of both the sensor and the features of interest [
55].
Surface reflectance calibration, also known as irradiance, brightness, or radiometric correction, involve the correction of raw UAS imagery through use of reflectance targets (empirically calibrated by the user or automated by pre-flight reference images), incident illumination, or sensor specific light sensors [
47,
166,
177]. Correcting UAS imagery for their variability in light conditions (i.e., radiometric noise) is a major concern for subsequent image processing and analysis [
176]. Two methods for completing this radiometric calibration are commonly used [
179]. The first entails pre-flight calibration in which reference imagery is collected of a sensor associated radiometric calibration panel. This method further adds to the advantages and accessibility of UAS sensors [
47]. Secondly, one of several empirical methods (e.g., dark object correction, linear regression, or empirical line calibration) can be used to transform the imagery based on reflectance targets captured during the flight [
54,
166,
179].
Spectral indices (SI or vegetation indices) are one of the most powerful tools for agriculture remote sensing [
62,
166,
183,
186]. As discussed above in this section, many agriculture practitioners have turned to multispectral cameras, and their increased potential for generating SI. Canopy-based, or leaf-based, reflectance measurements are first calibrated to surface reflectance values and then the indices created from them are used to estimate plant function or status [
32,
187]. For agricultural purposes, the Red-Edge and NIR based indices are recognized as particularly important. SI based on these bands have been distinguished for their ability to estimate maize yield, detect diseases in high density plantings such as wheat, and be modified to account for background noise (e.g., soil) [
7,
169,
175,
179]. As is common in other natural resource disciplines, NDVI is among the most common of SI [
32,
54,
187]. In agricultural remote sensing, NDVI is used to model crop yield, phenology, and vigor [
165,
174,
181,
186]. NDVI values have been found to change throughout growth stages, with flowering or leaf development stages, rather than early or late development stages, having the highest correlation to yield for studied crops [
169,
180,
183]. One of the major challenges for using NDVI, especially with the increased spatial resolution afforded by UAS imagery, is its known vulnerability to background pixels (i.e., mixed pixels and signal variation) [
165,
179]. Methods for overcoming mixed pixels include correcting for the plot level ground cover [
165,
181] or using modified SI [
7,
179]. These modified or alternative vegetation indices include the Red-Edge Difference Vegetation Index (reNDVI) [
179], the SAVI and its modified version (MSAVI) [
172,
174], Crop Water Stress Index (CWSI) [
62,
160], EVI [
48,
166,
185], and Excess Green Index (ExG) [
163,
173]. Vegetation indices, such as ExG, created from RGB sensors, were found to be a popular method for expanding the capabilities of crop surveys and moderating the signal noise caused by mixed pixels [
49,
163,
173].
6.4. Qualitative and Quantitative Achievements
Over the last five years, applications of UAS in agriculture have demonstrated the ability to achieve a high level of accuracy for a variety of objectives. In this section, we highlight some of these achievements, as well as recognize some of the ongoing challenges facing UAS and their ability to support precision agriculture.
Classification and regression algorithms, including machine learning and deep learning varieties, were common among the reviewed agriculture applications. Partial least squares regression (PLSR) was noted as a common method for estimating plant biophysical variables [
15,
181]. More advanced methods, such as extreme machine learning and artificial neural network (ANN) regressions, were found in several instances to better handle the large volumes of data available from UAS sensors (e.g., avoiding overfitting) [
48,
167,
181]. From a classification perspective, the selection of an optimal algorithm is still subject to the feature of interest, types and amounts of available input data, and technical expertise of the user [
188,
189]. In Vilar et al. [
170], the random forest classification outperformed ANN and support vector machine (SVM) for the monitoring of pasture in an agroforestry system for both singe-date and multi-date analyses. Similarly, Islam et al. [
161] found 2% improvement in weed detection accuracy when using the random forest algorithm instead of SVM and a 33% higher accuracy when compared to k-nearest neighbor. For more advanced users, Neupane and Baysal-Gruel [
177] outlined the use and performance of numerous deep learning algorithms in the evaluation of crop health. Only a few examples of deep learning algorithms, such as Su et al. [
175], were found in our review of studies between 2016–2021; however, their improvement in performance and recognized need to become more seamlessly integrated into current processing and analysis frameworks pave a bright future for UAS applications in agriculture.
Using only UAS RGB imagery and the resulting spectral and structural data, Niu et al. [
49] realized a high correlation to field measurements of maize height and AGB (
of 0.90 for height and 0.82 for AGB). In Zhang et al. [
163], a slightly older RGB sensor generated a mean absolute error (MAE) ranging from 6.2–15.1% for maize yield. UAS data, generated through digital photogrammetry, are important for more than just the spectral data analysis. Several studies demonstrated more accurate results when including structural data (such as a photogrammetric point cloud) into their analysis [
25,
54,
168,
173]. For example, in the analysis of maize AGB by Niu et al. [
49], the 99th percentile of plant height was found to be the best single predictor of AGB, while SI including ExG were also found to be competent predictors of AGB. Torres-Sanzhez et al. [
190] used only the photogrammetric point cloud, created from UAS RGB imagery, to characterize olive crown vigor in high density orchards using indirect measures such as crown height and plant volume. Crown vigor and volume were used to study specific cultivars and their productivity, thus providing an effective alternative to field-based assessments [
190]. An unsupervised algorithm was used to detect the presence and orientation of vineyard crops throughout the growing season, and across variable terrain, in Comba et al. [
191]. The average overall accuracy throughout the season was 94%, with each individual date remaining above 92%. For the study of crop height, Enciso et al. [
187] produced a coefficient of correlation value (r) above 0.9766 for three varieties of tomatoes, in comparison to field measured samples. Their discussion noted that UAS can be an effective means of increasing the number of measurements taken in future crop surveys [
187].
6.5. Current Limitations
A number of limitations were found within the reviewed studies for the continued use and success of UAS for precision agriculture. First, there are many aspects of UAS flight planning as well as pre- and post-processing and analysis that pose technological barriers to the widespread adoption of this platform [
164,
183]. While UAS have undoubtedly become more user friendly in recent years, flight planning and data processing using best practices is far from automated and instantaneous [
7,
54]. Additionally, as we have seen in these current studies, such practices have yet to be regularly acknowledged. Further highlighting the technological expertise required to get the most benefit from UAS in agriculture is the superior performance of machine learning and deep learning algorithms. Such classification and regression algorithms are being proven capable of handling the large amounts of data collected from UAS operation, yet have not been the most practical or robust solution for all users, due to their computational complexity and greater reference data sample size requirements [
166,
173,
181]. Another challenge facing the future of UAS in agriculture is the clearly defined economic benefit derived from this tool. Some authors have suggested that smaller farms, potentially on the order of 5 ha to 50 ha, may see the most commercial benefit from UAS [
62,
178,
192]. Larger or smaller operations, while still benefiting from the adoption of UAS, may not find them as practical [
2,
54,
177]. The input costs of integrating UAS into precision agriculture applications has been discussed in several papers. In Michez et al. [
55], specific UAS and accompanying methods were selected, which highlight the capabilities of relatively affordable consumer systems [
25,
167]. In their analysis, an aircraft costing only a few thousand dollars was able to generate data with a good relationship to mean pasture height and pasture biomass reference data. Exceedingly higher cost systems, such as UAS-lidar and UAS hyperspectral configurations, are currently facing a cost of entry barrier [
49,
176]. Few studies mentioned the use of hyperspectral imagery in their given area of study and even fewer discussed lidar solutions. Instead, more advanced and integrative analytical solutions such as machine learning algorithms may provide the added perceptibility needed to make UAS RGB and multispectral sensors the more realistic approach [
49]. A third challenge facing current UAS application in precision agriculture are the inconsistencies caused by shadows, variable illumination, and mixed pixels [
166,
173,
182]. Grouped together here as a suite of spectral and radiometric calibration challenges, two main approaches are being developed to overcome issues with achieving a consistent surface reflectance product from UAS imagery. Either (a) users have been found to filter, or segment, vegetation regions of interest from background or shadowed areas [
165,
167,
183] or (b) modified SI have been included which are less influenced by such noise [
7,
174,
179]. A fourth challenge for UAS applications in agriculture are the restrictions imposed by national regulatory frameworks. In countries and regions such as India [
193] and the European Union [
2], the future perspectives on the regulations governing the use UAS for precision agriculture are positive. In many countries around the world, UAS may now be operated within defined policies [
193]. Still, the slow pace of these government frameworks as well as their limited flexibility have been found to limit the potential of UAS agriculture applications [
166,
179]. Lastly, a challenge that is often overlooked regarding the use of UAS, is the need to expand communication and collaborations between scientists, farmers, and industry [
7]. Few studies acknowledged the potential benefits from the joint acceptance of this technology. In the future, more studies should promote a collaboration with end users so that the results may provide the most benefit.
6.6. Future Research
To have a complete understanding of the scope of UAS applications in precision agriculture, it is important to also explore the suggestions voiced for future research. Many authors discussed the need to replicate their studies and findings across additional phenotypes, crop growth stages, species, and geographic regions [
15,
167,
173,
185,
187]. Validating the results of specific UAS applications across additional crop species and environmental conditions reinforces the presented findings and allows for further discovery of challenges or limitations in the generating the resulting spatial data products. Other discussions for future research on UAS applications in agriculture defined a need for expanding the integration of supplemental spectral or structural data and the need to further reduce the radiometric noise caused by non-crop pixels. These corrected and novel spatial data inputs may have strong relationships to crop biophysical and biochemical attributes [
7,
168,
179]. Novel UAS derived data may include developing new narrowband SI or reliable methods for calibrating for mixed pixels [
55,
179]. Similarly, multi-sensor and multi-platform data fusion are being widely recognized in agriculture applications as a promising future for UAS applications. The fusion of remotely sensed data across multiple sensors or multiple platforms, such as RGB and thermal UAS sensors, spectral and structural, and UAS and satellite imagery, presents as a means for precision agriculture to escape from isolated analyses or case studies [
48,
54,
169,
170]. Several studies reviewed here showcased the increased performance found through the fusion of multiple UAS data types [
25,
49,
173]. Using the opportunity to concurrently evaluate distinct data types and data sources could provide the means of validating the best approaches for specific monitoring and management objectives [
181]. Lastly, many of these future research topics in precision agriculture are restricted without the increased adoption and collaboration on GIS and digital image processing technologies [
2]. Whether automated or provided at a more accessible level, the pre- and post-processing solutions as well as the techniques required to analyze the data generated from UAS will guide the future of this tool for precision agriculture.
7. Discussion
UAS applications in forestry, freshwater ecosystems, grasslands and shrublands, and agriculture face a promising future, as practitioners continue to define success and limitations for this critical remote sensing tool. The first objective of this review of UAS sensor data applications for natural resources was to define the common types of hardware and software characteristics utilized in disciplines such as forestry, freshwater ecosystem management, grassland and shrubland surveys, and agriculture. For hardware, primary applications published over the last five years demonstrated a key preference for small copter-style UAS. In a similar finding to Cumming et al. [
145], who reported the dominance of DJI rotary-winged UAS in commercial and research markets, small rotary-winged UAS were prevalent among all natural resource publications over the last five years. UAS applications in forestry featured a large number of studies that deployed either multiple aircraft or sensors, while applications in agriculture consisted primarily of single UAS operations [
25,
28,
73,
172]. An increasing number of studies are drawing comparisons between UAS and satellite data or using the multi-source information to extend their analyses [
107,
126,
133,
141]. Additionally, several disciplines demonstrate a growing trend towards adopting dedicated multispectral sensors as their primary source of remotely sensed data. UAS applications in forestry, however, are still largely focused on ultra-high-resolution RGB sensor data (
Figure 2).
Of the approximately 120 UAS applications reviewed for this analysis, half provided an incomplete level of detail regarding their flight planning and sensor data processing procedures. This definition of “incomplete” was defined as the paper providing insufficient details for their sensor data collection and processing to be replicable and informative. UAS flight planning parameters should include discussion of the flying height, image or flight line overlap, weather conditions (such as wind), and solar angle or shadow presence. The sensor data processing methods should include discussion of the software package(s) or coding libraries used to pre-process and model the spatial data products, as well as the quality settings or filtering methods applied to the data prior to analysis. Only approximately 40% of the UAS applications reviewed from the last five years provided a level of detail regarded as complete, with few among them containing supportive citations for their parameter choices. These data collection and processing parameter choices have the ability to drastically influence the resulting data quality and accuracy of the results [
14,
17,
18,
20,
55].
In the discussion of flight planning parameters, UAS applications in natural resources most often included a description of their flying height and image or flight line overlap. Applications in forestry, grasslands and shrublands, and agriculture most specifically demonstrated this trend towards selective details. UAS flying heights for applications in forestry ranged from an average of 30 to 50 m, to as high as 800 m, with several studies also finding success between 80 and 120 m [
6,
56,
67,
76,
77]. Among freshwater ecosystems, flying heights averaged around 100 m [
45,
115,
128]. For agricultural and grassland studies, safety and vision concerns were more subdued, with average flying heights remaining around approximately 30 m [
54,
55,
173]. Image overlaps ranged from 80 to 90% among forestry applications [
78,
79,
80] to an average of 50 to 86% for freshwater systems [
45,
118]. Agriculture as well as grasslands and shrublands also featured high levels (e.g., >75%) of image overlap for UAS sensor data collection [
35,
48,
148,
151,
183]. Additional UAS flight planning considerations such as wind speed or direction, sun angle, and presence or calibration of shadows were not discussed regularly (
Figure 3). Given the popularity of multispectral sensors throughout each of these natural resource disciplines, further discussion on the effects that these characteristics have on the resulting imagery and analysis should be investigated [
48,
179,
183,
194,
195].
UAS sensor data processing workflows among each of the natural resource disciplines most often featured the use of a proprietary SfM solution such as Agisoft or Pix4D (
Figure 4). Still, a high number of papers did not provide descriptions of their SfM-MVS or supplemental modeling procedures beyond the basic note of their software choice (
Figure 3). Individual filtering algorithms, interpolation methods, and quality settings each have the ability to alter the spatial models generated from these processing procedures [
6,
20,
51,
54,
55]. Natural resource disciplines such as forestry featured a wide selection of modeling and analysis software [
82,
83], while agriculture as well as grasslands and shrublands followed more selective approaches, in their use of proprietary software solutions [
22,
24,
62,
143].
Our second objective for this review was to review which capabilities and limitations have been discussed for UAS applications in natural resource monitoring and management. UAS applications in natural resources featured the comparison of forest structure measurements in comparison to field data [
96], the detection of cyanobacteria in freshwater systems [
46], the classification of grassland species [
147], and the monitoring of agroforestry pastures [
170]. A wide variety of spectral, structural, and biochemical properties were investigated using UAS sensors. Still, this rapidly evolving remote sensing platform is not without notable limitations. First, regulations governing UAS applications have become more complete in the last decade, but still restrict the adaptability of this tool. While not fully encompassing the growing number of UAS applications and hardware types, many countries have come to establish some form of policy and regulatory system [
146,
193]. Even a decade ago, the establishment of UAS regulations was only a distant thought [
5]. Other challenges facing many UAS applications are the presence of shadows or unforeseen wind changes [
77,
99,
195], or the limited spectral resolution afforded by the currently available dedicated UAS sensors [
138,
147]. From a processing standpoint, there are two notable challenges facing modern UAS applications. First, reconstructing homogenous environments, such as the surface of open water, is difficult [
106,
107,
110,
131]. Second, UAS sensor data processing often takes much longer than data collection, representing a significant portion of most projects time [
68,
87]. Luckily, advances in cloud-computing, computer hardware, and efficiencies in computer vision algorithms continue to drive down processing resources. A final challenge for UAS applications in natural resources that was discussed in several studies was the lack of communication of the actual benefit derived from this remote sensing tool. The integration of UAS sensor data collection and analysis stands to provide lower resource costs, adaptable and enhanced data collection, and previously unavailable data insights [
6,
70,
76]. However, few studies have addressed the need to directly communicate the benefits that end users would realize from the integration of UAS, including a cost–benefit evaluation of their potential [
2,
62,
177,
178,
192].
Our final objective for this review was to evaluate what the primary perspectives on the future research of UAS application in natural resource would be. A significant knowledge gap remains in the ability to define an optimal spectral or spatial resolution for UAS sensor data of field specific features of interest. Defining field specific best practices, or conversely limiting factors, for the spatial resolution acquired for UAS applications could inform flight planning and data processing practices [
137,
138,
152]. Defining the most appropriate spectral wavelengths or SI for UAS applications in field specific assessments could promote the development of more suitable UAS sensors or the applicability of currently available UAS sensors [
55,
105,
107,
126,
132,
147,
148]. Future research should investigate these characteristics, in the context of regional or climatic variability. Expanding the spatial or temporal coverage of previous UAS applications would also support these efforts, and was directly referenced as a suggestion for future research in several studies [
60,
109]. Additionally, it should be acknowledged that many ecosystems exist outside of those characterized in this review, and should be reviewed to establish effective methods for data collection and processing, such as intertidal zones [
196]. Two final discussion points commonly found among UAS applications in natural resources highlight growing trends in data science as a whole [
30]. Review papers, such as Adao et al. [
176] and Osco et al. [
197] and Bouguettaya et al. [
198], complement this discussion by focusing on UAS hyperspectral imaging and deep learning methods, respectively. First, several studies discussed the need to further automate the data processing and analysis procedures for UAS sensor data [
72,
105]. Providing automated insights into local scale conditions would lower the technical barrier of access to UAS spatial data analysis. Second, many applications directly featured or suggested the integration of data fusion [
25,
49,
173]. The fusion of satellite image and UAS sensor data, or multiple forms of UAS sensor data has become a prominent approach to improving recognized limitations of single source analysis [
29,
199,
200]. These limitations may be the spectral resolution of the UAS individual sensor, or the spatial resolution of the satellite imagery. Each of these potential future research topics provide the opportunity to further establish confidence in UAS and their data products [
72,
74].
As new sensors, unpiloted aircraft, and spatial data processing software become available, it is important that they may be adopted and applied based on a foundation of scientific evidence which supports their most appropriate operation [
16]. To instill confidence in UAS, far greater than 40% of the modern applications in natural resources should include a description of their methods, with references to validated procedures [
6,
21,
52,
53]. UAS have the potential to operate for previously unavailable applications, providing ultra-high-resolution data in a relatively small amount of time [
28,
85,
145]. It is up to all practitioners to ensure that they are used effectively, and that the information generated from their sensor data is informative and valid.
8. Conclusions
This review examined the current practices and trends in UAS flight planning and sensor data processing in natural resource applications. UAS applications in forestry, freshwater ecosystems, grasslands and shrublands, and agriculture were independently synthesized to provide a discussion on several aspects regarding the collection and use of UAS sensor data. The first discussion was of the common hardware and software characteristics for each of these disciplines, and to what level of detail these characteristics are being discussed. The second objective examined the current capabilities and limitations for UAS applications in each of these disciplines. Lastly, this review discussed the recommendations for future research that are being reported and the current trends in UAS applications for each of these disciplines. Specific choices made by the UAS operator or spatial analyst including the sensor or aircraft choice, flying height, weather conditions during each mission, software choice, software settings, and calibration methods can each have an effect on the spatial data products and subsequent results [
14,
17,
18,
42,
55]. It is, therefore, imperative that these decisions can be easily made based on reliable and applicative scientific evidence.
From this literature review, consisting of articles and review papers published between 2016 and the beginning of 2022, applications in each of the four natural resource disciplines exhibited commonalities but not standard characteristics for their methodologies. For example, in forestry, while most applications selected a flying height of 30 m to 50 m, some applications flew as high as 800 m above the ground. Alternatively, for all disciplines other than freshwater hydrology, image/flight line overlaps were consistently greater than 75%. While these general trends could be observed throughout each of the disciplines, more specific inferences on the preferred or most viable flight planning or sensor data processing methods could not be defined. Less than half of the applications included a level of detail of their methodologies for the reader to be able to confidently replicate the study. A far lower number, less than 20% of the articles, included a full description of their methods and provided evidence to support them. To further instill confidence in this remote sensing tool, a larger proportion of applications need to address their flight planning and sensor data processing methodologies. This increased level of information would create a pathway for a set of common characteristics to be established for each discipline or ecosystem of interest, given further investigations on the best practices or conversely methodological limitations of UAS.


 ,
, 
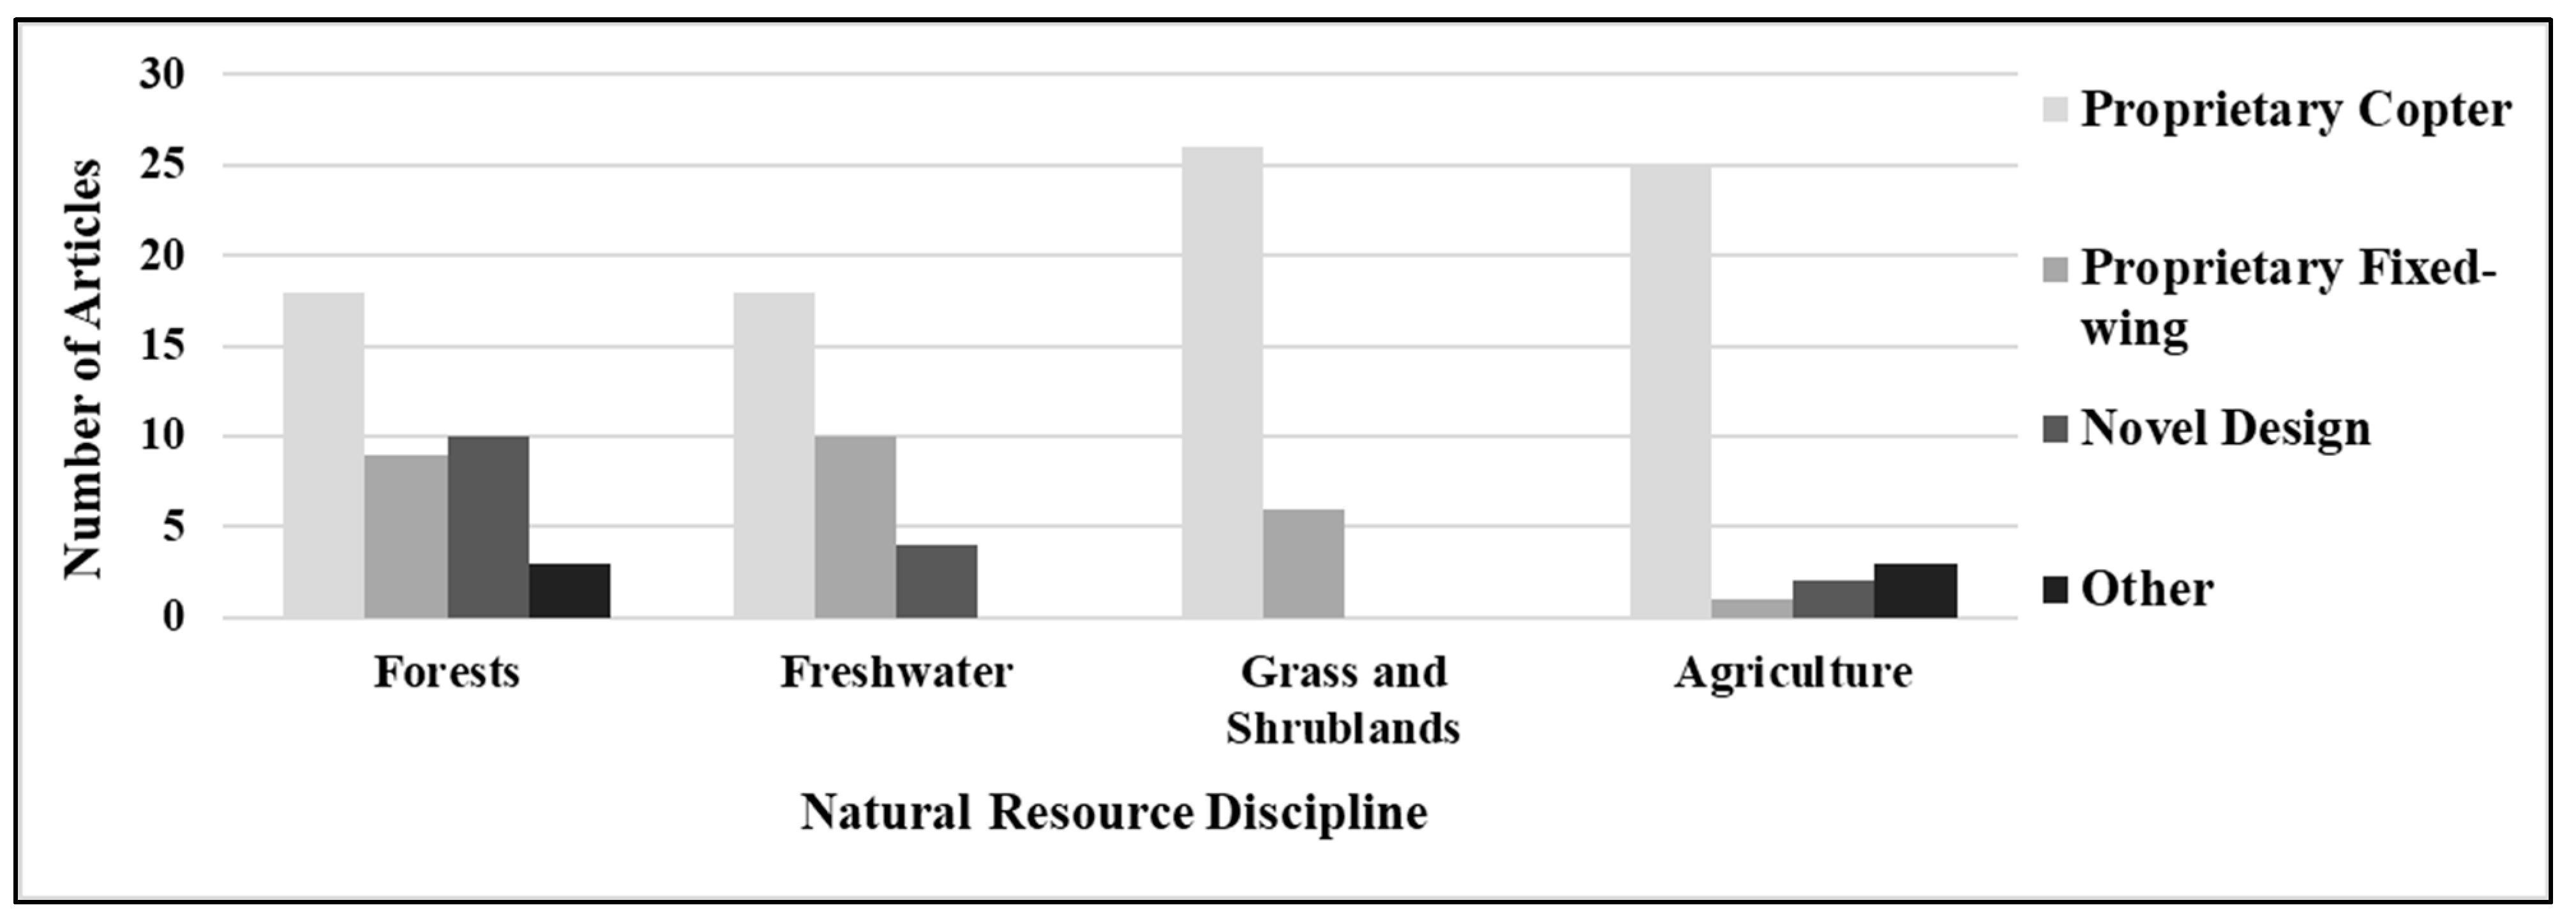


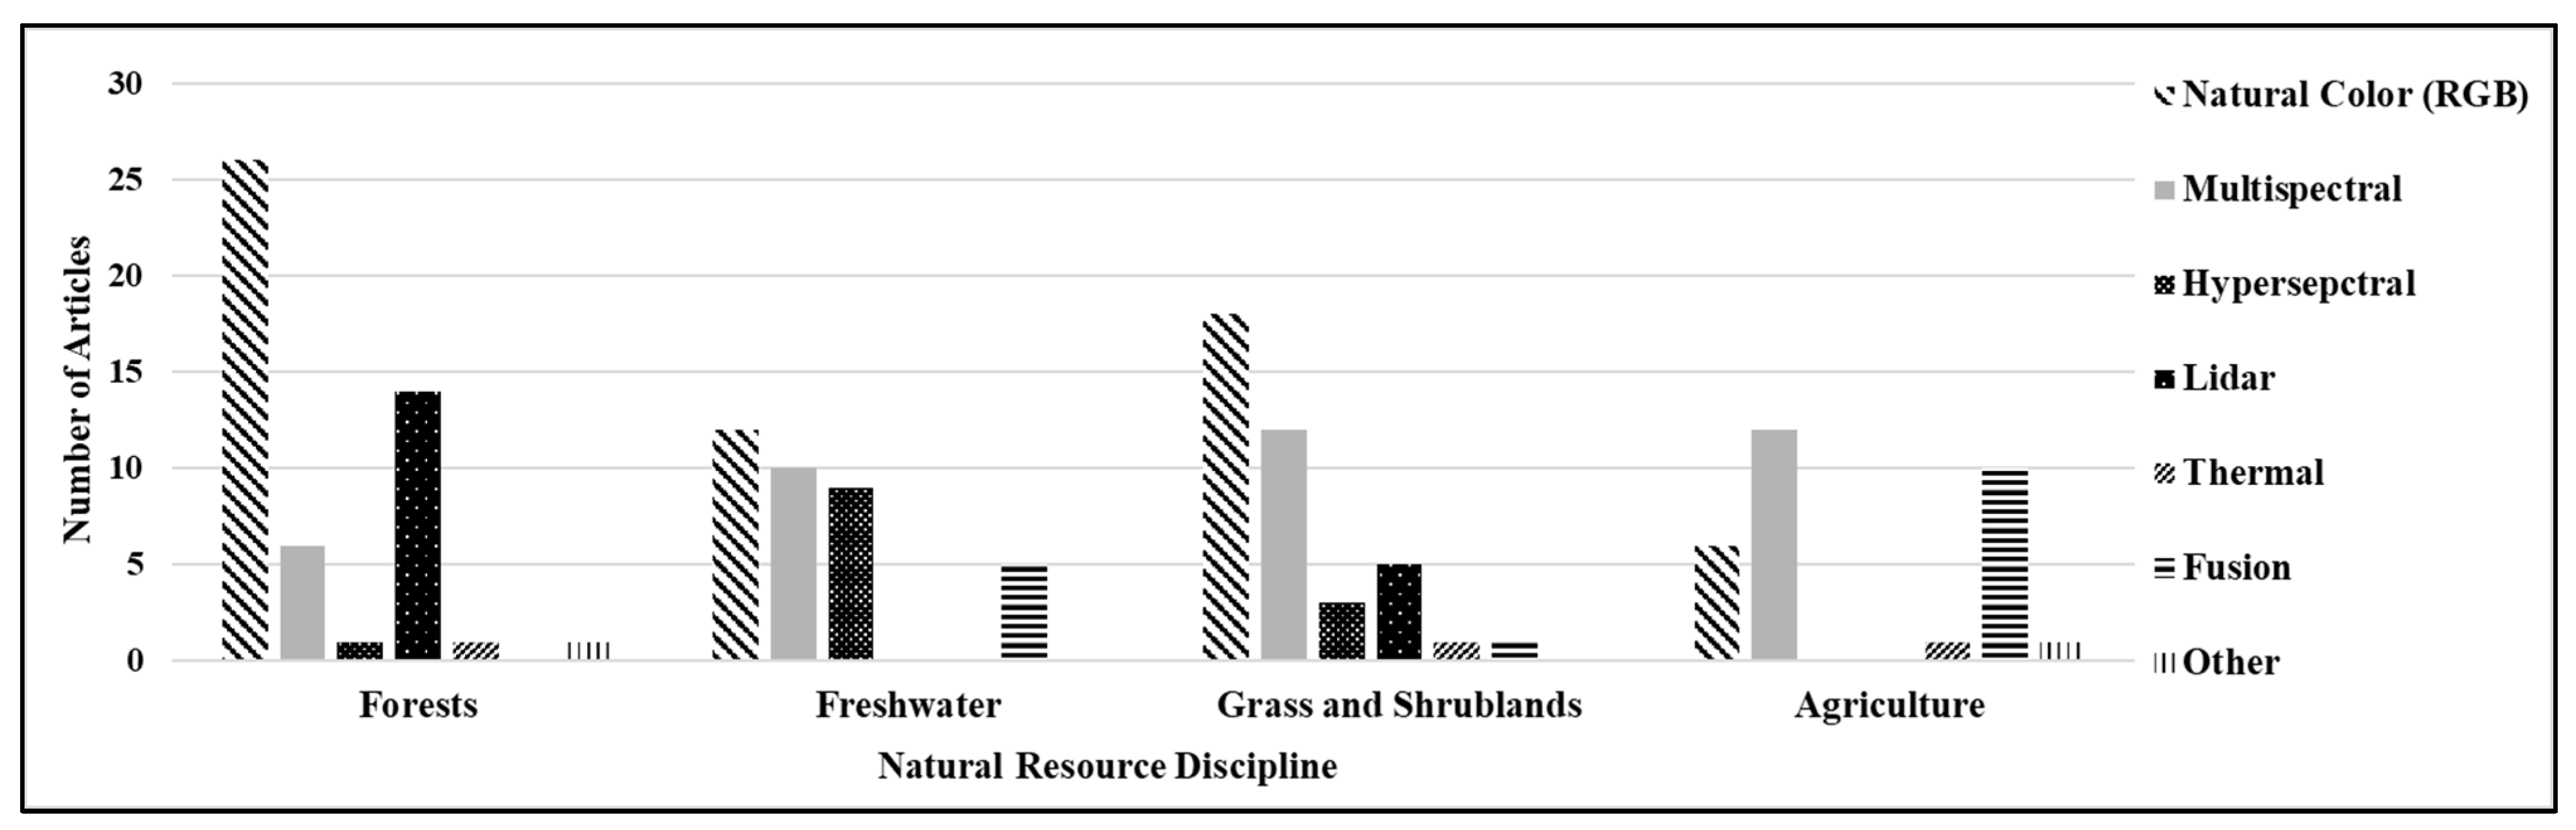
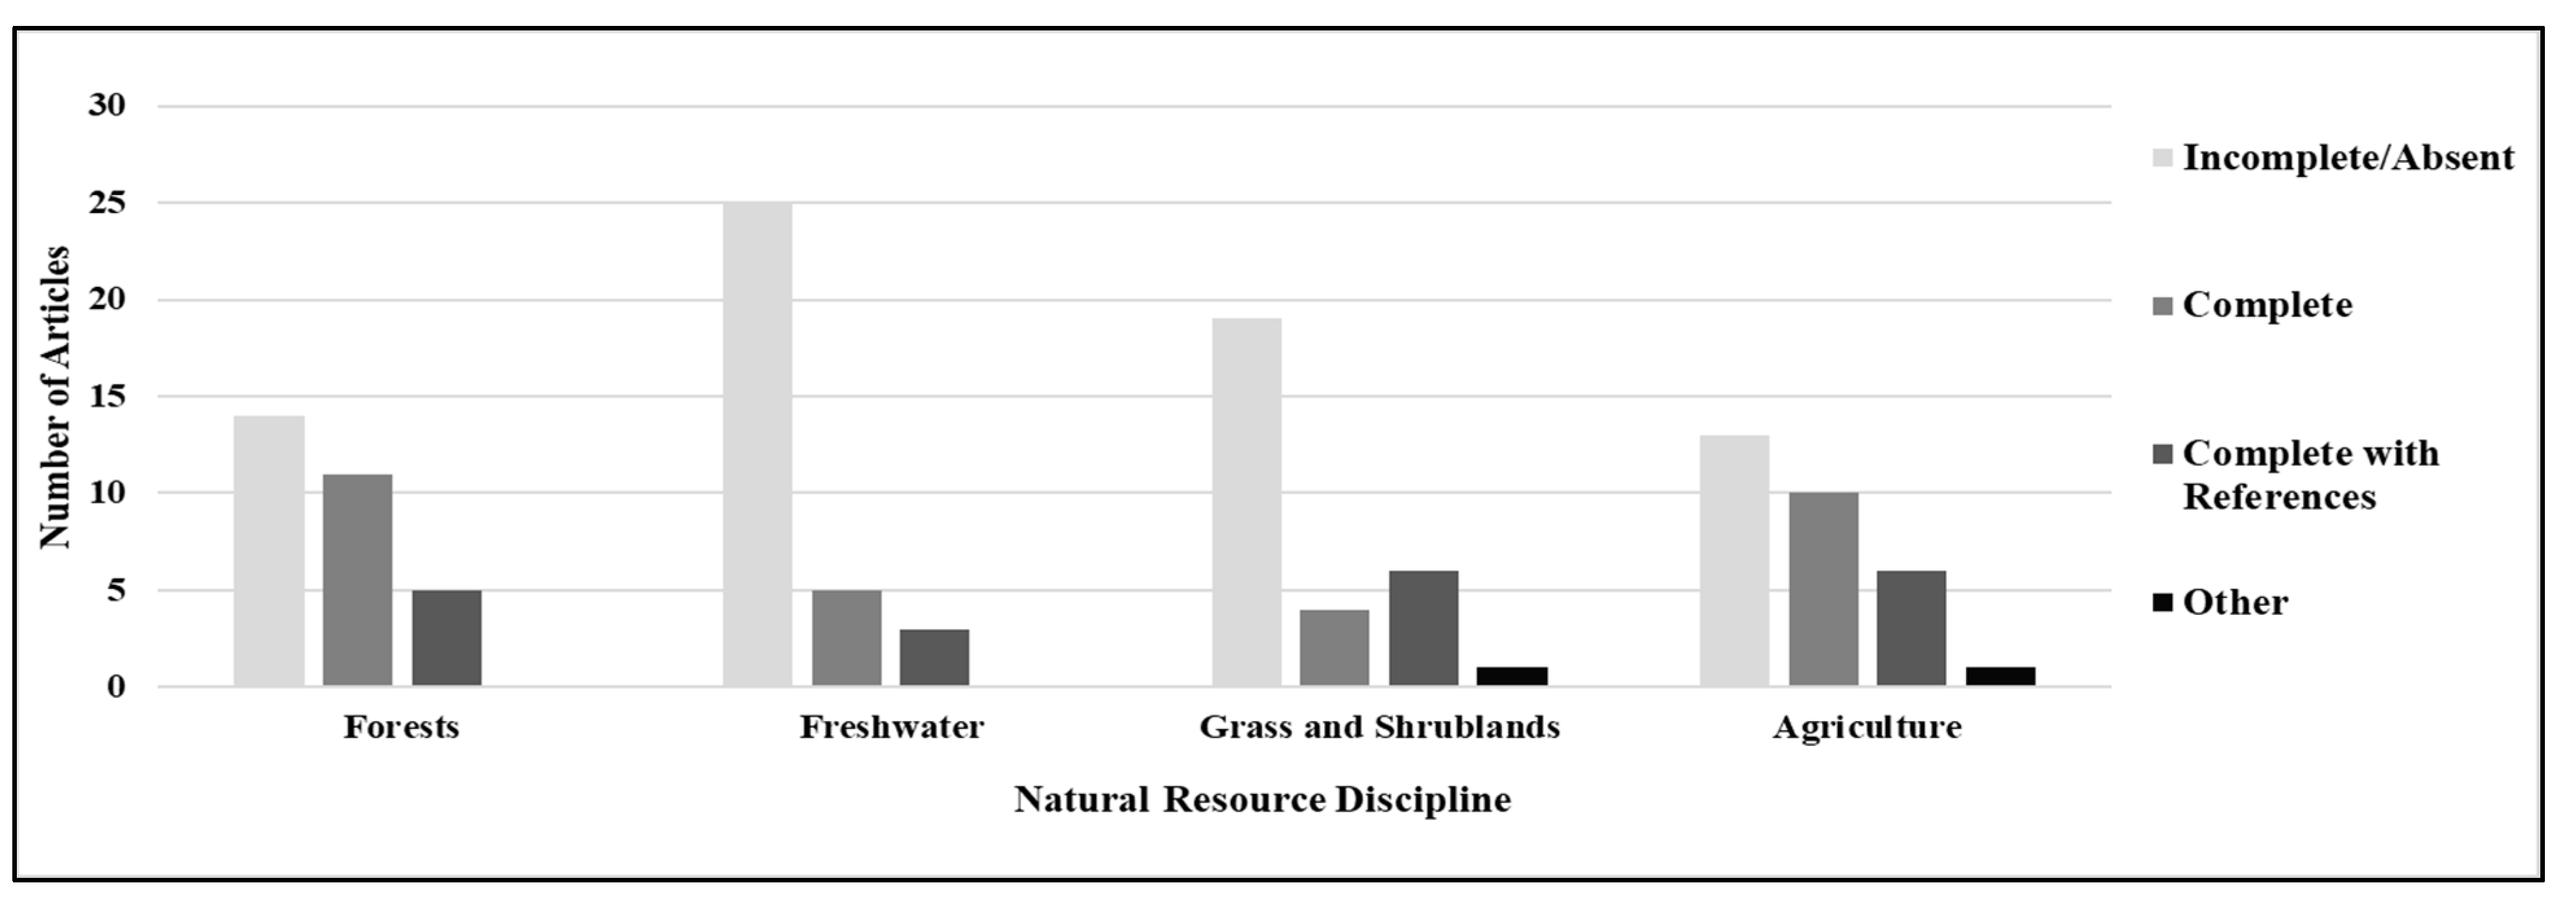
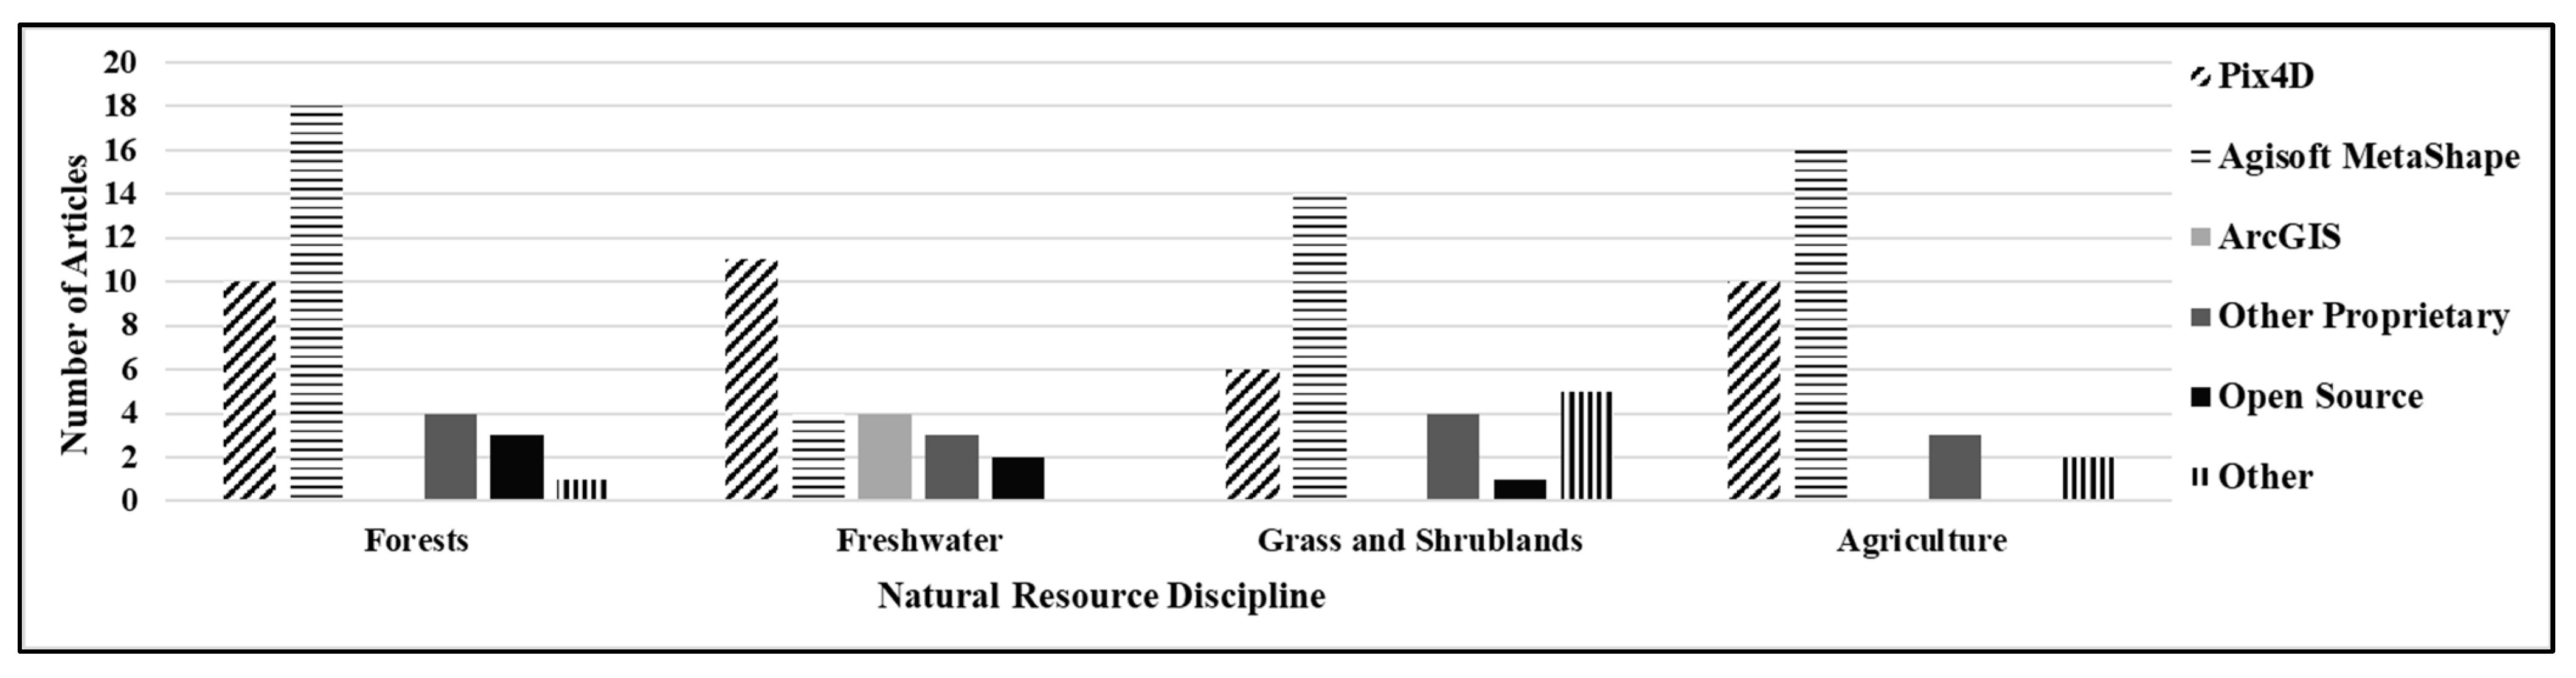