
Contribution of Land Cover Conversions to Connecticut (USA) Carbon Footprint

 ,
,  , ,
, ,  , and
, and
Abstract
:1. Introduction
The Role of Soils in Connecticut’s Global Warming Solutions Act and Carbon Footprint

| Stocks | Ecosystem Services | |||
|---|---|---|---|---|
| Soil Order | General Characteristics and Constraints | Provisioning | Regulation/Maintenance | Cultural |
| Slightly Weathered | ||||
| Entisols | Embryonic soils with ochric epipedon | x | x | x |
| Inceptisols | Young soils with ochric or umbric epipedon | x | x | x |
| Histosols | Organic soils with ≥ 20% of organic carbon | x | x | x |
| Moderately Weathered | ||||
| Mollisols | Carbon-enriched soils with B.S. ≥ 50% | x | x | x |

2. Materials and Methods
| County | Total SOC Storage (kg) (%) | Degree of Weathering and Soil Development | |||
| Slight | Moderate | ||||
| Entisols | Inceptisols | Histosols | Mollisols | ||
| Total SOC Storage (kg), (% of Total by County) | |||||
| Fairfield | 1.7 × 10¹⁰ (12) | 1.7 × 10⁹ (10) | 1.2 × 10¹⁰ (67) | 3.9 × 10⁹ (23) | 2.8 × 10⁷ (0) |
| Hartford | 1.8 × 10¹⁰ (13) | 4.2 × 10⁹ (23) | 1.2 × 10¹⁰ (65) | 2.0 × 10⁹ (11) | 1.8 × 10⁸ (1) |
| Litchfield | 2.9 × 10¹⁰ (20) | 9.8 × 10⁸ (3) | 1.9 × 10¹⁰ (66) | 8.7 × 10⁹ (30) | 1.3 × 10⁸ (1) |
| Middlesex | 1.1 × 10¹⁰ (8) | 7.1 × 10⁸ (6) | 7.3 × 10⁹ (65) | 3.1 × 10⁹ (28) | 4.5 × 10⁷ (1) |
| New Haven | 1.8 × 10¹⁰ (13) | 2.0 × 10⁹ (11) | 1.1 × 10¹⁰ (59) | 5.1 × 10⁹ (29) | 1.7 × 10⁸ (1) |
| New London | 2.1 × 10¹⁰ (15) | 1.3 × 10⁹ (6) | 1.3 × 10¹⁰ (64) | 6.4 × 10⁹ (30) | 0 (0) |
| Tolland | 1.1 × 10¹⁰ (8) | 8.1 × 10⁸ (8) | 8.1 × 10⁹ (76) | 1.6 × 10⁹ (15) | 5.3 × 10⁷ (1) |
| Windham | 1.6 × 10¹⁰ (11) | 1.4 × 10⁹ (9) | 9.8 × 10⁹ (60) | 5.0 × 10⁹ (31) | 0 (0) |
| Totals | 1.4 × 10¹¹ (100) | 1.3 × 10¹⁰ (9) | 9.1 × 10¹⁰ (65) | 3.6 × 10¹⁰ (25) | 6.2 × 10⁸ (1) |
3. Results
3.1. Storage and Value of SOC by Soil Order and County for Connecticut
3.2. Storage and Value of SIC by Soil Order and County for Connecticut
3.3. Storage and Value of TSC (SOC + SIC) by Soil Order and County for Connecticut
| County | Total TSC Storage (kg) (%) | Degree of Weathering and Soil Development | |||
|---|---|---|---|---|---|
| Slight | Moderate | ||||
| Entisols | Inceptisols | Histosols | Mollisols | ||
| Total TSC Storage (kg), (% of Total by County) | |||||
| Fairfield | 2.5 × 10¹⁰ (12) | 2.7 × 10⁹ (11) | 1.8 × 10¹⁰ (73) | 4.0 × 10⁹ (16) | 5.2 × 10⁷ (0) |
| Hartford | 2.7 × 10¹⁰ (13) | 6.7 × 10⁹ (25) | 1.8 × 10¹⁰ (67) | 2.0 × 10⁹ (7) | 3.4 × 10⁸ (1) |
| Litchfield | 4.0 × 10¹⁰ (20) | 1.6 × 10⁹ (4) | 3.0 × 10¹⁰ (74) | 8.9 × 10⁹ (22) | 2.5 × 10⁸ (1) |
| Middlesex | 1.6 × 10¹⁰ (8) | 1.1 × 10⁹ (7) | 1.2 × 10¹⁰ (72) | 3.2 × 10⁹ (20) | 8.4 × 10⁷ (1) |
| New Haven | 2.5 × 10¹⁰ (13) | 3.2 × 10⁹ (13) | 1.7 × 10¹⁰ (66) | 5.2 × 10⁹ (21) | 3.2 × 10⁸ (1) |
| New London | 3.0 × 10¹⁰ (15) | 2.0 × 10⁹ (7) | 2.1 × 10¹⁰ (71) | 6.5 × 10⁹ (22) | 0 (0) |
| Tolland | 1.6 × 10¹⁰ (8) | 1.3 × 10⁹ (8) | 1.3 × 10¹⁰ (81) | 1.7 × 10⁹ (10) | 9.9 × 10⁷ (1) |
| Windham | 2.3 × 10¹⁰ (11) | 2.2 × 10⁹ (10) | 1.5 × 10¹⁰ (68) | 5.1 × 10⁹ (22) | 0 (0) |
| Totals | 2.0 × 10¹¹ (100) | 2.1 × 10¹⁰ (10) | 1.4 × 10¹¹ (71) | 3.6 × 10¹⁰ (18) | 1.1 × 10⁹ (1) |
| County | Total SC-CO2 ($) | Degree of Weathering and Soil Development | |||
|---|---|---|---|---|---|
| Slight | Moderate | ||||
| Entisols | Inceptisols | Histosols | Mollisols | ||
| SC-CO2 ($ = USD) | |||||
| Fairfield | 4.2 × 10⁹ | 4.6 × 10⁸ | 3.1 × 10⁹ | 6.7 × 10⁸ | 8.7 × 10⁶ |
| Hartford | 4.6 × 10⁹ | 1.1 × 10⁹ | 3.1 × 10⁹ | 3.4 × 10⁸ | 5.8 × 10⁷ |
| Litchfield | 6.8 × 10⁹ | 2.6 × 10⁸ | 5.0 × 10⁹ | 1.5 × 10⁹ | 4.1 × 10⁷ |
| Middlesex | 2.7 × 10⁹ | 1.9 × 10⁸ | 1.9 × 10⁹ | 5.3 × 10⁸ | 1.4 × 10⁷ |
| New Haven | 4.3 × 10⁹ | 5.4 × 10⁸ | 2.8 × 10⁹ | 8.8 × 10⁸ | 5.4 × 10⁷ |
| New London | 5.0 × 10⁹ | 3.4 × 10⁸ | 3.5 × 10⁹ | 1.1 × 10⁹ | 0 |
| Tolland | 2.7 × 10⁹ | 2.2 × 10⁸ | 2.2 × 10⁹ | 2.8 × 10⁸ | 1.7 × 10⁷ |
| Windham | 3.8 × 10⁹ | 3.8 × 10⁸ | 2.6 × 10⁹ | 8.5 × 10⁸ | 0 |
| Totals | 3.4 × 10¹⁰ | 3.5 × 10⁹ | 2.4 × 10¹⁰ | 6.1 × 10⁹ | 1.9 × 10⁸ |
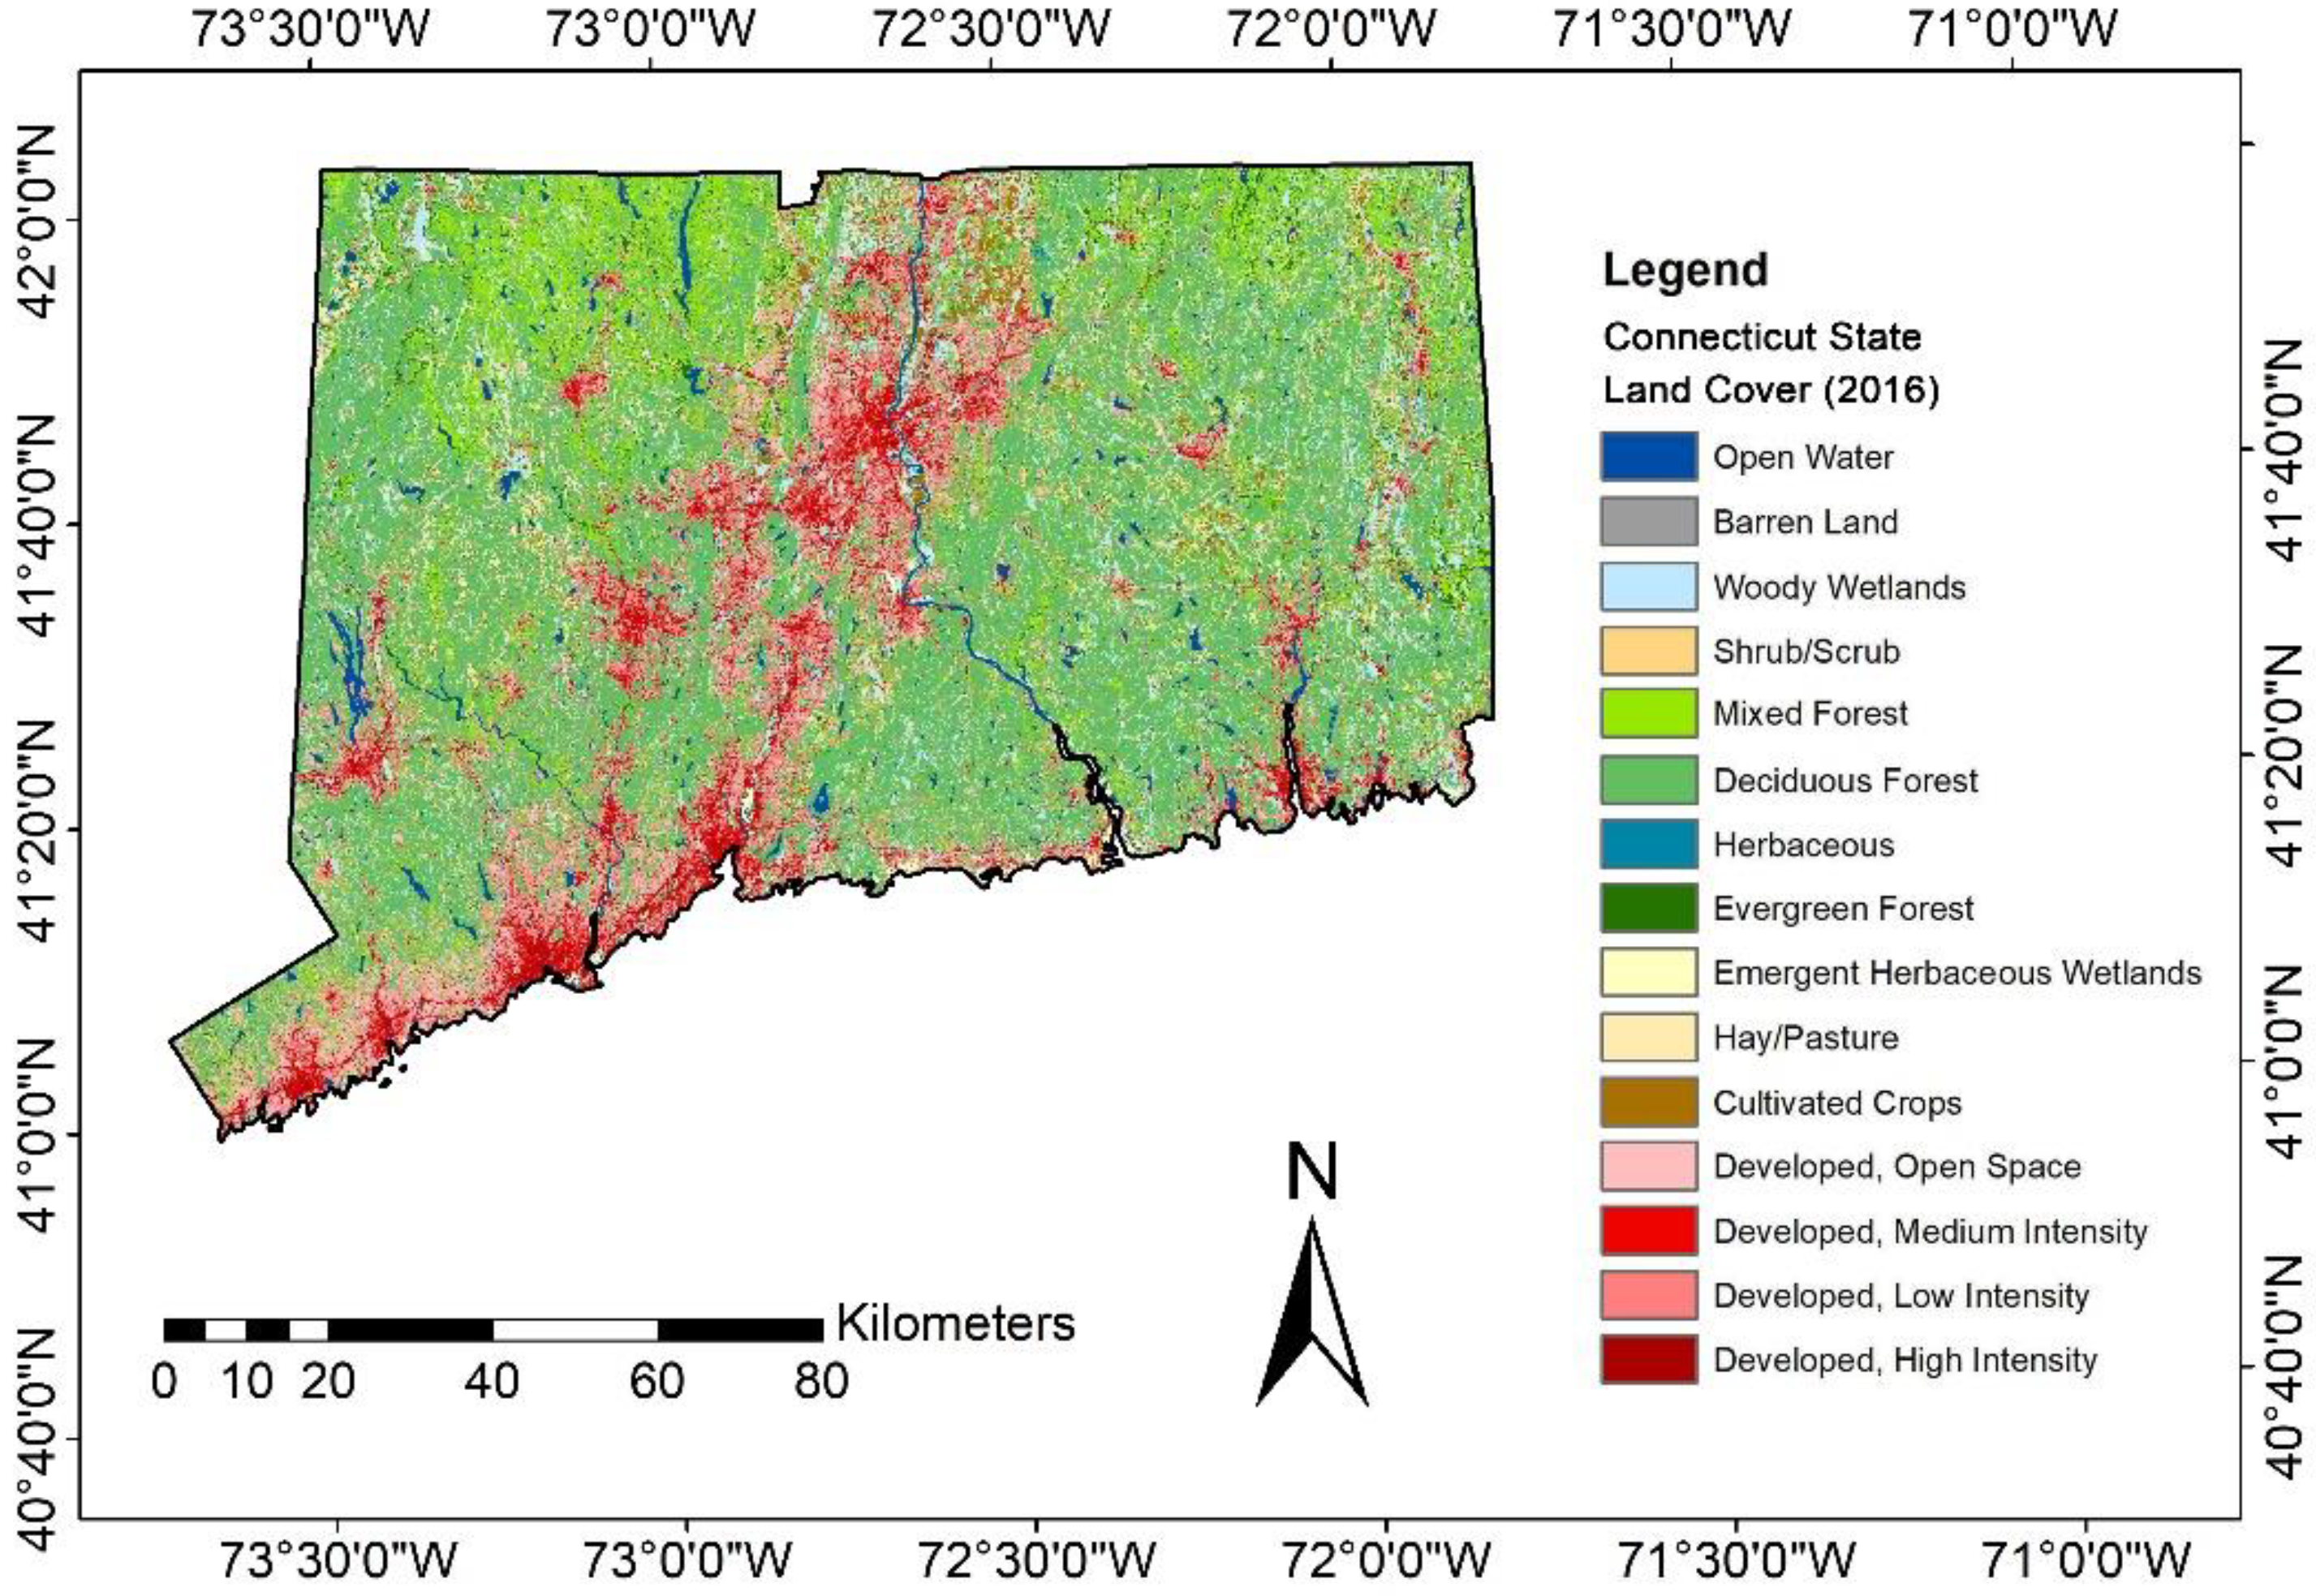
3.4. Land Use/Land Cover Change by Soil Order in Connecticut from 2001 to 2016
| NLCD Land Cover Classes (LULC) | 2016 Total Area by LULC (km2) (Change in Area, 2001–2016, %) | Degree of Weathering and Soil Development | |||
|---|---|---|---|---|---|
| Slight | Moderate | ||||
| Entisols | Inceptisols | Histosols | Mollisols | ||
| 2016 Area by Soil Order, km2 (Change in Area, 2001–2016, %) | |||||
| Barren land | 39.0 (−5.8%) | 19.1 (−6.3%) | 19.4 (−5.3%) | 0.5 (−12.5%) | 0.0 (100.0%) |
| Woody wetlands | 1010.0 (0.4%) | 123.4 (0.6%) | 721.5 (−0.0%) | 164.4 (2.1%) | 0.8 (−2.3%) |
| Shrub/Scrub | 50.0 (83.8%) | 5.7 (12.6%) | 44.2 (100.3%) | 0.1 (45.3%) | 0.1 (57.7%) |
| Mixed forest | 1554.0 (−0.4%) | 124.0 (−0.9%) | 1415.4 (−0.3%) | 10.1 (−0.1%) | 4.5 (−1.1%) |
| Deciduous forest | 5569.7 (−2.7%) | 245.5 (−6.6%) | 5287.7 (−2.6%) | 15.1 (−2.2%) | 21.4 (−5.3%) |
| Herbaceous | 102.6 (40.2%) | 20.7 (4.5%) | 80.8 (53.3%) | 0.6 (77.5%) | 0.5 (51.9%) |
| Evergreen forest | 202.8 (−3.0%) | 34.8 (−5.5%) | 165.7 (−2.5%) | 1.1 (−4.7%) | 1.2 (−3.0%) |
| Emergent herbaceous wetlands | 76.7 (−4.6%) | 8.4 (−6.9%) | 22.7 (−4.5%) | 45.6 (−4.1%) | 0.0 (7.7%) |
| Hay/Pasture | 476.7 (−7.0%) | 58.9 (−11.6%) | 413.6 (−6.4%) | 2.3 (−1.2%) | 1.9 (−10.2%) |
| Cultivated crops | 198.4 (3.2%) | 37.9 (−4.1%) | 159.6 (5.0%) | 0.2 (11.3%) | 0.7 (15.8%) |
| Developed, open space | 1260.1 (3.1%) | 208.1 (−1.1%) | 1035.8 (3.9%) | 8.6 (0.1%) | 7.6 (5.6%) |
| Developed, medium intensity | 577.2 (11.1%) | 311.6 (7.1%) | 262.0 (16.0%) | 1.8 (28.0%) | 1.8 (24.6%) |
| Developed, low intensity | 898.4 (3.8%) | 288.5 (−0.8%) | 599.8 (6.1%) | 5.2 (3.7%) | 4.9 (7.6%) |
| Developed, high intensity | 171.9 (18.5%) | 139.6 (11.9%) | 31.9 (59.1%) | 0.2 (32.0%) | 0.2 (101.5%) |
4. Significance of Results
4.1. Significance of Results for Connecticut’s GHG Emissions Inventory and Global Warming Solutions Act
| NLCD Land Cover Classes (LULC) | Degree of Weathering and Soil Development | |||
|---|---|---|---|---|
| Slight | Moderate | |||
| Entisols | Inceptisols | Histosols | Mollisols | |
| Area Change, km2 (SC-CO2, $ = USD) | ||||
| Developed, open space (39.6 km2, $94.2M) | - | 39.2 ($92.5M) | - | 0.4 ($1.7M) |
| Developed, medium intensity (57.6 km2, $140.8M) | 20.7 ($44.9M) | 36.1 ($85.1M) | 0.4 ($9.3M) | 0.4 ($1.5M) |
| Developed, low intensity (35.1 km2, $87.5M) | - | 34.6 ($81.6M) | 0.2 ($4.4M) | 0.3 ($1.5M) |
| Developed, high intensity (26.8 km2, $60.7M) | 14.9 ($32.3M) | 11.8 ($27.9M) | - | 0.1 ($511,515.0) |
| Totals (159.1 km2, $383.3M) | 35.6 ($77.2M) | 121.7 ($287.1M) | 0.6 ($13.7M) | 1.2 ($5.1M) |
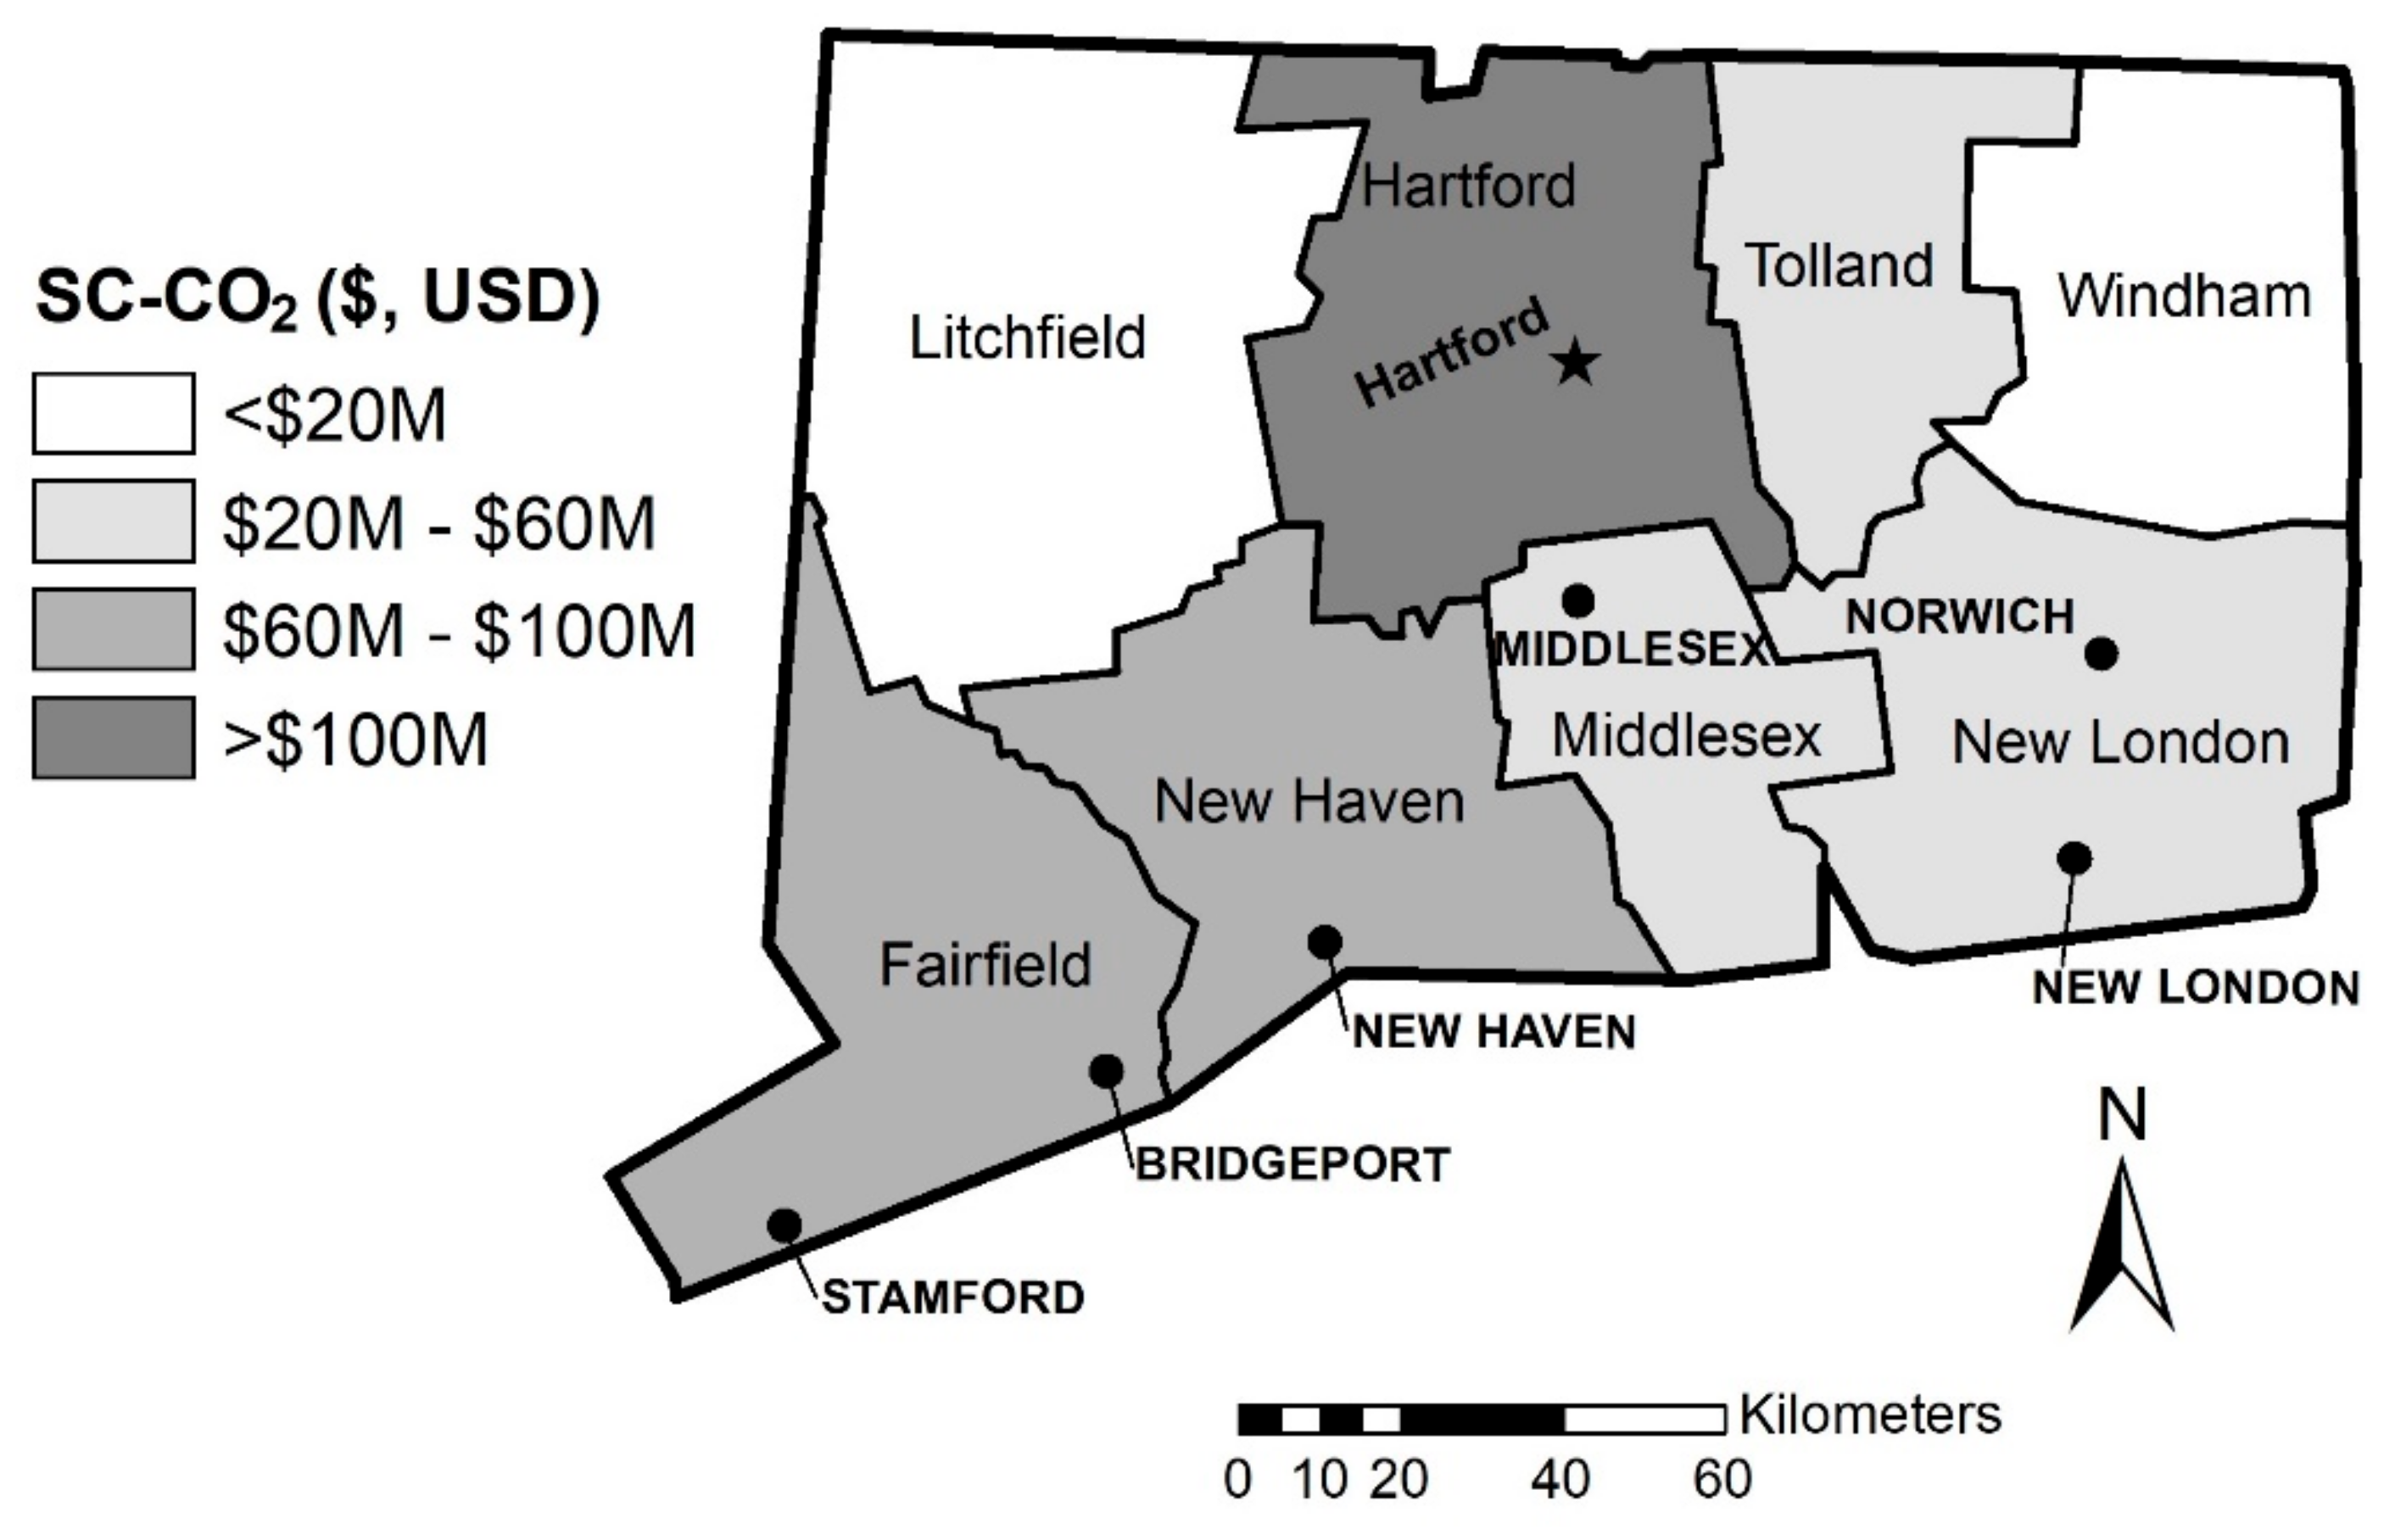
| County | Total Area Change (km2) (SC-CO2, $ = USD) | Degree of Weathering and Soil Development | |||
|---|---|---|---|---|---|
| Slight | Moderate | ||||
| Entisols | Inceptisols | Histosols | Mollisols | ||
| Developed Area Increase between 2001 and 2016 (km2) (SC-CO2, $ = USD) | |||||
| Fairfield | 31.6 ($75.6M) | 5.7 ($12.3M) | 25.8 ($60.9M) | 0.1 ($2.4M) | 0 |
| Hartford | 49.5 ($117.3M) | 15.2 ($33.0M) | 33.4 ($78.9M) | 0.1 ($2.4M) | 0.7 ($3.1M) |
| Litchfield | 7.0 ($16.3M) | 1.3 ($2.7M) | 5.8 ($13.6M) | 0 | 0 |
| Middlesex | 11.5 ($28.9M) | 1.8 ($3.8M) | 9.6 ($22.7M) | 0.1 ($2.4M) | 0 |
| New Haven | 32.6 ($80.4M) | 7.4 ($16.0M) | 24.9 ($58.7M) | 0.2 ($4.8M) | 0.2 ($842,000.0) |
| New London | 14.0 ($32.4M) | 3.1 ($6.8M) | 10.9 ($25.6M) | 0 | 0 |
| Tolland | 8.7 ($20.6M) | 1.4 ($2.9M) | 7.2 ($16.9M) | 0 | 0.2 ($697,630.8) |
| Windham | 7.3 ($16.6M) | 3.2 ($6.8M) | 4.1 ($9.8M) | 0 | 0 |
| Totals | 162.2 ($388.1M) | 38.9 ($84.4M) | 121.7 ($287.1M) | 0.5 ($12.0M) | 1.1 ($4.6M) |
4.2. Significance of Results in Broader Context
- -
- Definition of CF: Soil CF is defined as GHG emissions because of land disturbances from various soil types and events expressed as carbon dioxide (CO2) equivalent, which can be expressed in monetary terms (e.g., social costs of C, etc.).
- -
- Drivers: Soil CF is commonly caused by natural and/or anthropogenic (e.g., urban development) disturbances. Anthropogenic drivers often include land consumption-based new developments (e.g., new home construction).
- -
- Elements: Soil CF has spatial (e.g., science-based, administrative, etc.) and temporal (e.g., event) scales, and can have different intensities (e.g., low, medium, and high-intensity developments). Soil CF has the composition (e.g., soil type, land cover, soil C content, etc.).
- -
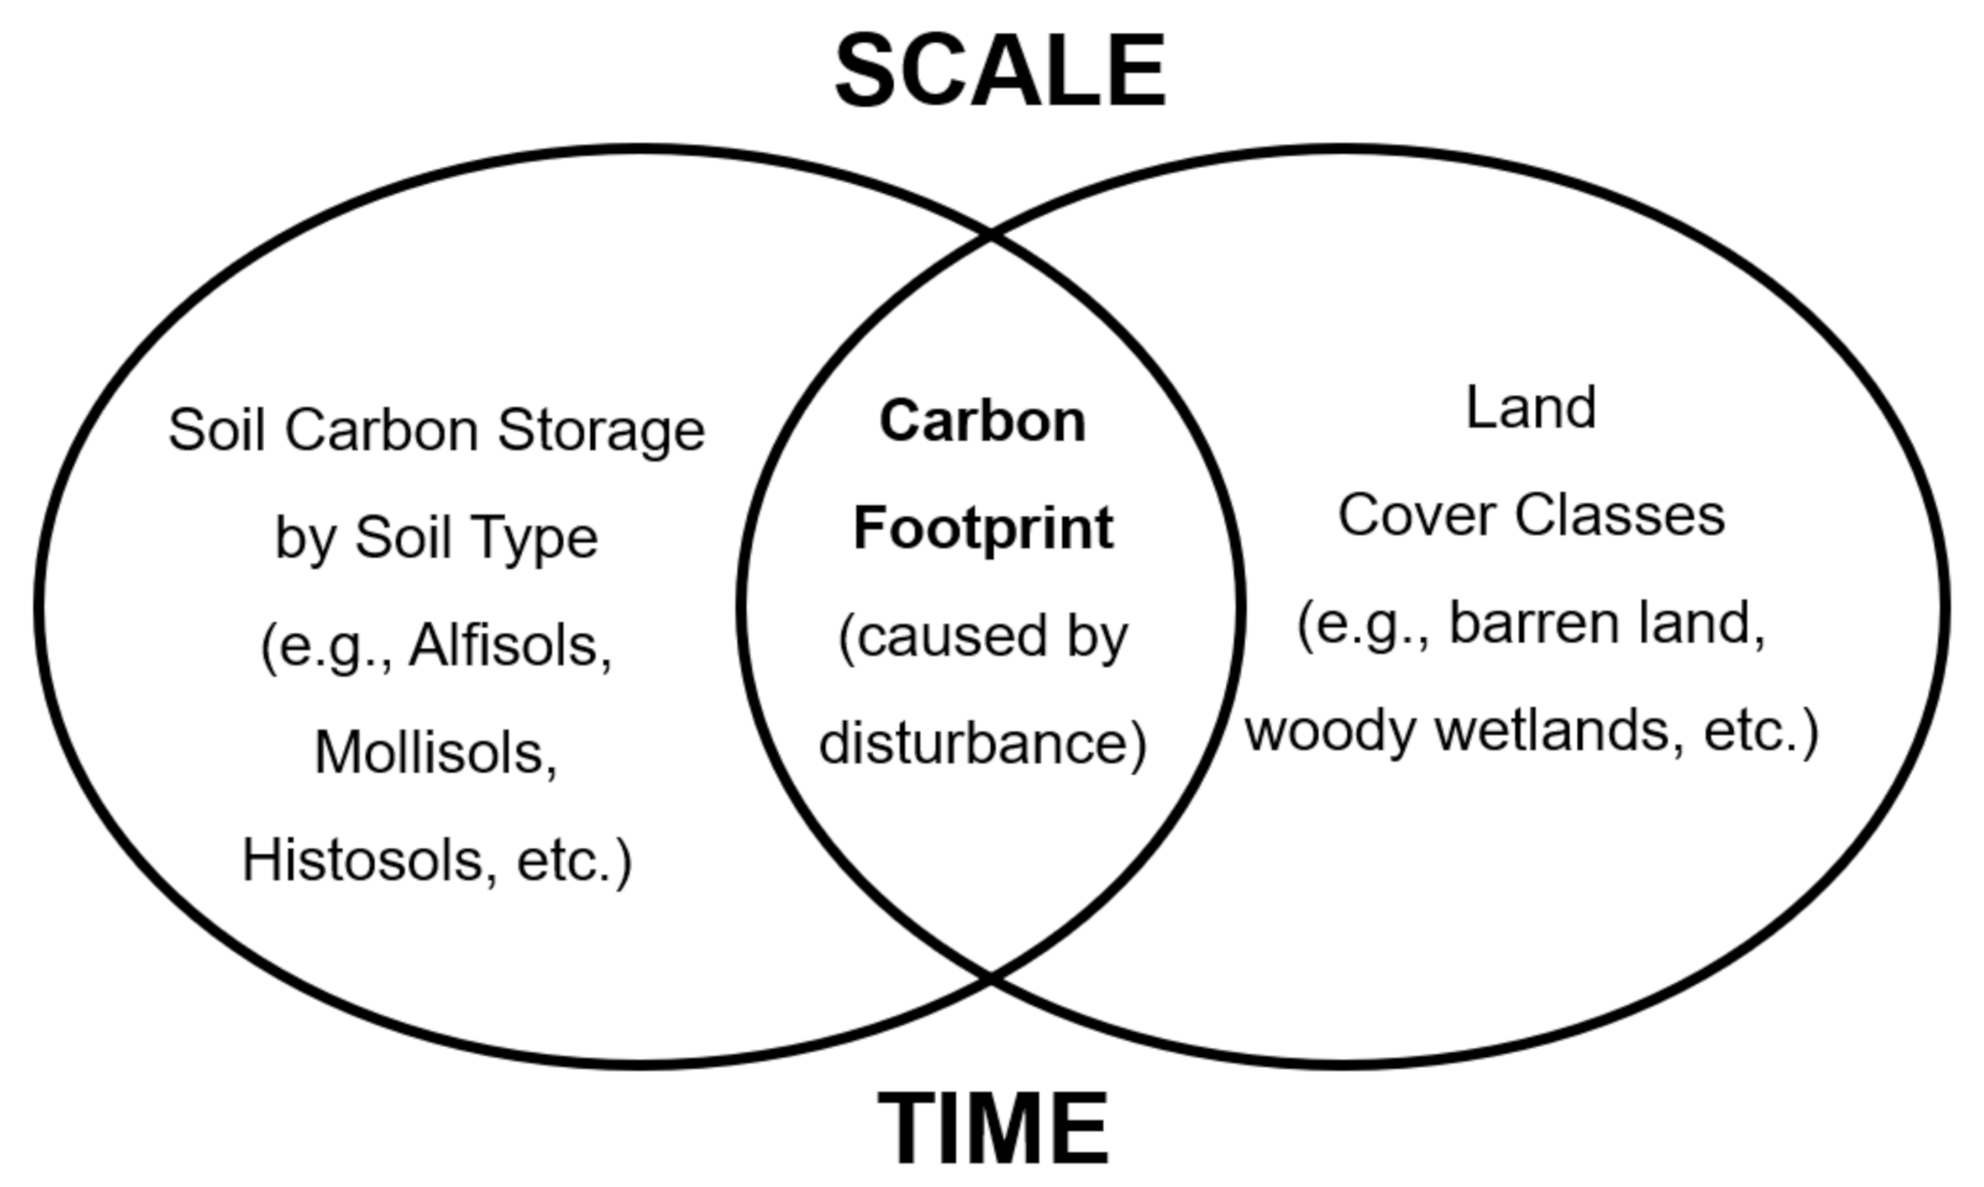
- Measurements: Soil CF is determined by using the area of land disturbance and soil C content to calculate the maximum potential for realized social costs of C (SC-CO2) from each disturbance based on land cover change analysis (Figure 1). These estimates can be performed at various administrative and spatial scales (Figure 1).
- -
- Dynamics: Soil CF results in soil and land cover transformations leading to biophysical and socio-economic transformations. The consequences of these transformations extend beyond the boundaries of CF since GHG emissions extend outside the boundaries of the CF.
- -
- Effects: Soil CF results not only in GHG emissions, but in biodiversity loss, increase in impervious surface, and reduction in both agricultural and forest lands and the future sequestration potential of these lands.
- -
- -
- Outcomes: Soil CF contributes directly to climate change while also increasing the vulnerabilities of ecosystems to climate change.
5. Conclusions
Author Contributions
Funding
Data Availability Statement
Acknowledgments
Conflicts of Interest
Glossary
| CF | Carbon footprint |
| ED | Ecosystem disservices |
| ES | Ecosystem services |
| EPA | Environmental Protection Agency |
| SC-CO2 | Social cost of carbon emissions |
| SDGs | Sustainable Development Goals |
| SOC | Soil organic carbon |
| SIC | Soil inorganic carbon |
| SOM | Soil organic matter |
| SSURGO | Soil Survey Geographic Database |
| STATSGO | State Soil Geographic Database |
| TSC | Total soil carbon |
| USDA | United States Department of Agriculture |
References
- Durojaye, O.; Laseinde, T.; Oluwafemi, I. A descriptive review of carbon footprint. In Human Systems Engineering and Design II; Ahram, T., Karwowski, W., Pickl, S., Taiar, R., Eds.; IHSED 2019; Advances in Intelligent Systems and Computing; Springer, Nature: Cham, Switzerland, 2020; Volume 1026, pp. 960–968. [Google Scholar] [CrossRef]
- Pandey, D.; Agrawal, M.; Pandey, J.S. Carbon footprint: Current methods of estimation. Environ. Monit. Assess. 2011, 178, 135–160. [Google Scholar] [PubMed]
- Bosco, S.; Di Bene, C.; Galli, M.; Remorini, D.; Massai, R.; Bonari, E. Soil organic matter accounting in the carbon footprint analysis of the wine chain. Int. J. Life Cycle Assess. 2013, 18, 973–989. [Google Scholar]
- Wackernagel, M.; Rees, W.E. Our Ecological Footprint: Reducing Human Impact on the Earth; New Society Publisher: Philadelphia, PA, USA, 1996. [Google Scholar]
- Adhikari, K.; Hartemink, A.E. Linking soils to ecosystem services—A global review. Geoderma 2016, 262, 101–111. [Google Scholar]
- Baveye, P.; Baveye, J.; Gowdy, J. Soil “ecosystem” services and natural capital: Critical appraisal of research on uncertain ground. Front. Environ. Sci. 2016, 4, 41. [Google Scholar]
- Keestra, S.D.; Bouma, J.; Wallinga, J.; Tittonell, P.; Smith, P.; Cerda, A.; Montanarella, L.; Quinton, J.N.; Pachepsky, Y.; Van der Putten, W.H.; et al. The significance of soils and soil science towards realization of the United Nations Sustainable Development Goals. Soil 2016, 2, 111–128. [Google Scholar]
- Wood, S.L.; Jones, S.K.; Johnson, J.A.; Brauman, K.A.; Chaplin-Kramer, R.; Fremier, A.; Girvetz, E.; Gordon, L.J.; Kappel, C.V.; Mandle, L.; et al. Distilling the role of ecosystem services in the Sustainable Development Goals. Ecosyt. Serv. 2017, 29, 701–782. [Google Scholar]
- Navarro-Pedreño, J.; Almendro-Candel, M.B.; Zorpas, A.A. The increase of soil organic matter reduces global warming, myth or reality? Science 2021, 3, 18. [Google Scholar] [CrossRef]
- EPA (United States Environmental Protection Agency). The Social Cost of Carbon. EPA Fact Sheet. 2016. Available online: https://19january2017snapshot.epa.gov/climatechange/social-cost-carbon_.html (accessed on 15 March 2022).
- Mikhailova, E.A.; Zurqani, H.A.; Post, C.J.; Schlautman, M.A.; Post, C.J. Soil diversity (pedodiversity) and ecosystem services. Land 2021, 10, 288. [Google Scholar] [CrossRef]
- Jones, C.M.; Wheeler, S.M.; Kammen, D.M. Carbon footprint planning: Quantifying local and state mitigation opportunities for 700 California cities. Urban Plan. 2018, 3, 35–51. [Google Scholar] [CrossRef] [Green Version]
- Bétard, F.; Peulvast, J. Geodiversity hotspots: Concept, method and cartographic application for geoconservation purposes at a regional scale. Environ. Manag. 2019, 63, 822–834. [Google Scholar] [CrossRef]
- Mikhailova, E.A.; Lin, L.; Hao, Z.; Zurqani, H.A.; Post, C.J.; Schlautman, M.A.; Post, G.C. Land cover change and soil carbon regulating ecosystem services in the state of South Carolina, USA. Earth 2021, 2, 674–695. [Google Scholar] [CrossRef]
- EPA—United States Environmental Protection Agency. What Climate Change Means for Connecticut. 2016. Available online: https://19january2017snapshot.epa.gov/sites/production/files/2016-09/documents/climate-change-ct.pdf (accessed on 30 March 2022).
- Connecticut General Assembly. Connecticut House Bill 5600, Public Act No. 08-98. An Act Concerning Connecticut Global Warming Solutions. 2008. Available online: https://www.cga.ct.gov/2008/ACT/Pa/pdf/2008PA-00098-R00HB-05600-PA.pdf (accessed on 30 March 2022).
- Soil Survey Staff, Natural Resources Conservation Service, United States Department of Agriculture. Soil Survey of the State of Connecticut. Available online: https://www.nrcs.usda.gov/Internet/FSE_MANUSCRIPTS/connecticut/CT600/0/connecticut.pdf (accessed on 10 March 2022).
- USDA/NRCS. State Soils. Available online: https://www.nrcs.usda.gov/wps/portal/nrcs/detail/soils/edu/?cid=stelprdb1236841 (accessed on 1 March 2022).
- Zhai, R.; Zhang, C.; Li, W.; Zhang, X.; Li, X. Evaluation of driving forces of land use and land cover change in New England area by a mixed method. ISPRS Int. J. Geoinf. 2020, 9, 350. [Google Scholar] [CrossRef]
- Goeminne, G.; Paredis, E. The concept of ecological debt: Some steps towards an enriched sustainability paradigm. Environ. Dev. Sustain. 2010, 12, 691–712. [Google Scholar] [CrossRef]
- Tomasso, L.P.; Leighton, M. The impact of land use change for greenhouse gas inventories and state-level climate mediation policy: A GIS methodology applied to Connecticut. J. Environ. Prot. 2014, 5, 1572–1587. [Google Scholar] [CrossRef] [Green Version]
- Arnold, C.; Wilson, E.; Hurd, J.; Civco, D. 30 years of land cover change in Connecticut, USA: A case study of long-term research, dissemination of results, and their use in land use planning and natural resource conservation. Land 2020, 9, 255. [Google Scholar] [CrossRef]
- The United States. Bureau of the Census. In Statistical Abstract of the United States: 1991; U.S. Bureau of the Census: Washington, DC, USA, 1991; p. 201. Available online: https://www.census.gov/library/publications/1991/compendia/statab/111ed.html (accessed on 10 December 2021).
- Soil Survey Staff, Natural Resources Conservation Service, United States Department of Agriculture. Soil Survey Geographic (SSURGO) Database. Available online: https://nrcs.app.box.com/v/soils (accessed on 10 March 2022).
- The United States Census Bureau, 2018 TIGER/Line Boundary Shapefiles. Available online: https://www.census.gov/geographies/mapping-files/time-series/geo/tiger-line-file.2018.html (accessed on 10 March 2022).
- Guo, Y.; Amundson, R.; Gong, P.; Yu, Q. Quantity and spatial variability of soil carbon in the conterminous United States. Soil Sci. Soc. Am. J. 2006, 70, 590–600. [Google Scholar]
- Multi-Resolution Land Characteristics Consortium (MRLC). Available online: https://www.mrlc.gov/ (accessed on 1 March 2022).
- Groshans, G.R.; Mikhailova, E.A.; Post, C.J.; Schlautman, M.A.; Zhang, L. Determining the value of soil inorganic carbon stocks in the contiguous United States based on the avoided social cost of carbon emissions. Resources 2019, 8, 119. [Google Scholar] [CrossRef] [Green Version]
- ESRI (Environmental Systems Research Institute). ArcGIS Pro 2.6. Available online: https://pro.arcgis.com/en/pro-app/2.6/get-started/whats-new-in-arcgis-pro.htm (accessed on 1 March 2022).
- Mikhailova, E.A.; Groshans, G.R.; Post, C.J.; Schlautman, M.A.; Post, C.J. Valuation of total soil carbon stocks in the contiguous United States based on the avoided social cost of carbon emissions. Resources 2019, 8, 157. [Google Scholar] [CrossRef] [Green Version]
- Mikhailova, E.A.; Groshans, G.R.; Post, C.J.; Schlautman, M.A.; Post, G.C. Valuation of soil organic carbon stocks in the contiguous United States based on the avoided social cost of carbon emissions. Resources 2019, 8, 153. [Google Scholar] [CrossRef] [Green Version]
- Connecticut Department of Energy and Environmental Protection. 2018 Connecticut Greenhouse Gas Emissions Inventory. Available online: https://portal.ct.gov/-/media/DEEP/climatechange/GHG_Emissions_Inventory_2018.pdf (accessed on 4 April 2022).
- Soil Survey Staff. Natural Resources Conservation Service, United States Department of Agriculture. Photos of Soil Orders. Available online: https://www.nrcs.usda.gov/wps/portal/nrcs/detail/soils/edu/?cid=nrcs142p2_053588 (accessed on 20 September 2021).
- Feng, Q.; Gauthier, P. Untangling urban sprawl and climate change: A review of the literature on physical planning and transportation drivers. Atmosphere 2021, 12, 547. [Google Scholar] [CrossRef]
- Yigitcanlar, T.; Kamruzzaman, M. Investigating the interplay between transport, land use and the environment: A review of the literature. Int. J. Environ. Sci. Technol. 2014, 11, 2121–2132. [Google Scholar] [CrossRef] [Green Version]
- Werts, J.D.; Mikhailova, E.A.; Post, C.J.; Sharp, J.L. Sediment pollution assessment of abandoned developments using remote sensing and GIS. Pedosphere 2013, 23, 39–47. [Google Scholar] [CrossRef]
- Yang, L.; Qian, F.; Song, D.; Zheng, K. Research on urban heat-island effect. Procedia Eng. 2016, 169, 11–18. Available online: http://creativecommons.org/licenses/by-nc-nd/4.0/ (accessed on 4 April 2022).
- Hauer, M.E. Migration induced by sea-level rise could reshape the US population landscape. Nat. Clim. Chang. 2017, 7, 321–325. [Google Scholar]
- Hauer, M.E.; Fussell, E.; Mueller, V.; Burkett, M.; Call, M.; Abel, K.; McLeman, R.; Wrathall, D. Sea-level rise and human migration. Nat. Rev. Earth Environ. 2020, 1, 28–39. [Google Scholar] [CrossRef]
| Ownership (e.g., government, private, foreign, shared, single, etc.) | |||||
| Time (e.g., information disclosure, etc.) | Stocks/Source Attribution | Flows | Value | ||
| Biophysical Accounts (Science-Based) | Administrative Accounts (Boundary-Based) | Monetary Account(s) | Benefit(s) | Total Value | |
| Soil extent: | Administrative extent: | Ecosystem good(s) and service(s): | Sector: | Types of value: | |
| Composite (total) stock: Total soil carbon (TSC) = Soil organic carbon (SOC) + Soil inorganic carbon (SIC) | |||||
| Past (e.g., post-development disclosures) Current (e.g., status) Future (e.g., pre-development disclosures) | Environment | The social cost of carbon (SC-CO2) emissions can be used in carbon footprint (CF) calculations: | |||
| - Soil orders (Entisols, Inceptisols, Histosols, Mollisols) | - State (Connecticut) - County (8 counties) | - Regulating (e.g., carbon sequestration) | - Carbon sequestration | - $46 per metric ton of CO2 applicable for 2025 (2007 U.S. dollars with an average discount rate of 3% [10]) | |
| County | Total Area (km2) (%) | Degree of Weathering and Soil Development | |||
|---|---|---|---|---|---|
| Slight | Moderate | ||||
| Entisols | Inceptisols | Histosols | Mollisols | ||
| 2016 Area (km2), (% of Total County Area) | |||||
| Fairfield | 1557.8 (13) | 211.0 (14) | 1316.7 (85) | 28.1 (2) | 2.1 (0) |
| Hartford | 1840.8 (15) | 520.0 (28) | 1293.0 (70) | 14.1 (1) | 13.7 (1) |
| Litchfield | 2317.3 (19) | 122.0 (5) | 2123.1 (92) | 62.3 (3) | 9.8 (0) |
| Middlesex | 935.7 (8) | 88.6 (9) | 821.6 (88) | 22.1 (2) | 3.4 (0) |
| New Haven | 1491.8 (12) | 250.8 (17) | 1191.7 (80) | 36.6 (2) | 12.7 (1) |
| New London | 1706.2 (14) | 158.3 (9) | 1502.5 (88) | 45.5 (3) | 0 |
| Tolland | 1029.8 (8) | 101.7 (10) | 912.5 (89) | 11.6 (1) | 3.9 (0) |
| Windham | 1308.0 (11) | 173.6 (13) | 1099.0 (84) | 35.5 (3) | 0 |
| Totals | 12,187.5 (100) | 1626.0 (13) | 10,260.1 (84) | 255.8 (2) | 45.6 (1) |
| Soil Order | SOC Content | SIC Content | TSC Content | SOC Value | SIC Value | TSC Value |
|---|---|---|---|---|---|---|
| Minimum—Midpoint—Maximum Values | Midpoint Values | |||||
| (kg m−2) | (kg m−2) | (kg m−2) | ($ m−2) | ($ m−2) | ($ m−2) | |
| Slightly Weathered | ||||||
| Entisols | 1.8–8.0–15.8 | 1.9–4.8–8.4 | 3.7–12.8–24.2 | 1.35 | 0.82 | 2.17 |
| Inceptisols | 2.8–8.9–17.4 | 2.5–5.1–8.4 | 5.3–14.0–25.8 | 1.50 | 0.86 | 2.36 |
| Histosols | 63.9–140.1–243.9 | 0.6–2.4–5.0 | 64.5–142.5–248.9 | 23.62 | 0.41 | 24.03 |
| Moderately Weathered | ||||||
| Mollisols | 5.9–13.5–22.8 | 4.9–11.5–19.7 | 10.8–25.0–42.5 | 2.28 | 1.93 | 4.21 |
| County | Total SC-CO2 ($) | Degree of Weathering and Soil Development | |||
|---|---|---|---|---|---|
| Slight | Moderate | ||||
| Entisols | Inceptisols | Histosols | Mollisols | ||
| SC-CO2 ($ = USD) | |||||
| Fairfield | 2.9 × 10⁹ | 2.8 × 10⁸ | 2.0 × 10⁹ | 6.6 × 10⁸ | 4.7 × 10⁶ |
| Hartford | 3.0 × 10⁹ | 7.0 × 10⁸ | 1.9 × 10⁹ | 3.3 × 10⁸ | 3.1 × 10⁷ |
| Litchfield | 4.8 × 10⁹ | 1.6 × 10⁸ | 3.2 × 10⁹ | 1.5 × 10⁹ | 2.2 × 10⁷ |
| Middlesex | 1.9 × 10⁹ | 1.2 × 10⁸ | 1.2 × 10⁹ | 5.2 × 10⁸ | 7.7 × 10⁶ |
| New Haven | 3.0 × 10⁹ | 3.4 × 10⁸ | 1.8 × 10⁹ | 8.6 × 10⁸ | 2.9 × 10⁷ |
| New London | 3.5 × 10⁹ | 2.1 × 10⁸ | 2.3 × 10⁹ | 1.1 × 10⁹ | 0 |
| Tolland | 1.8 × 10⁹ | 1.4 × 10⁸ | 1.4 × 10⁹ | 2.7 × 10⁸ | 9.0 × 10⁶ |
| Windham | 2.7 × 10⁹ | 2.3 × 10⁸ | 1.6 × 10⁹ | 8.4 × 10⁸ | 0 |
| Totals | 2.4 × 10¹⁰ | 2.2 × 10⁹ | 1.5 × 10¹⁰ | 6.0 × 10⁹ | 1.0 × 10⁸ |
| County | Total SIC Storage (kg) (%) | Degree of Weathering and Soil Development | |||
|---|---|---|---|---|---|
| Slight | Moderate | ||||
| Entisols | Inceptisols | Histosols | Mollisols | ||
| Total SIC Storage (kg), (% of Total by County) | |||||
| Fairfield | 7.8 × 10⁹ (13) | 1.0 × 10⁹ (13) | 6.7 × 10⁹ (86) | 6.7 × 10⁷ (1) | 2.4 × 10⁷ (0) |
| Hartford | 9.3 × 10⁹ (15) | 2.5 × 10⁹ (27) | 6.6 × 10⁹ (71) | 3.4 × 10⁷ (0) | 1.6 × 10⁸ (2) |
| Litchfield | 1.2 × 10¹⁰ (19) | 5.9 × 10⁸ (5) | 1.1 × 10¹⁰ (93) | 1.5 × 10⁸ (1) | 1.1 × 10⁸ (1) |
| Middlesex | 4.7 × 10⁹ (8) | 4.3 × 10⁸ (9) | 4.2 × 10⁹ (89) | 5.3 × 10⁷ (1) | 3.9 × 10⁷ (1) |
| New Haven | 7.5 × 10⁹ (12) | 1.2 × 10⁹ (16) | 6.1 × 10⁹ (81) | 8.8 × 10⁷ (1) | 1.5 × 10⁸ (2) |
| New London | 8.5 × 10⁹ (14) | 7.6 × 10⁸ (9) | 7.7 × 10⁹ (90) | 1.1 × 10⁸ (1) | 0 (0) |
| Tolland | 5.2 × 10⁹ (9) | 4.9 × 10⁸ (9) | 4.7 × 10⁹ (89) | 2.8 × 10⁷ (1) | 4.5 × 10⁷ (1) |
| Windham | 6.5 × 10⁹ (11) | 8.3 × 10⁸ (13) | 5.6 × 10⁹ (86) | 8.5 × 10⁷ (1) | 0 (0) |
| Totals | 6.1 × 10¹⁰ (100) | 7.8 × 10⁹ (13) | 5.2 × 10¹⁰ (85) | 6.1 × 10⁸ (1) | 5.2 × 10⁸ (1) |
| County | Total SC-CO2 ($) | Degree of Weathering and Soil Development | |||
|---|---|---|---|---|---|
| Slight | Moderate | ||||
| Entisols | Inceptisols | Histosols | Mollisols | ||
| SC-CO2 ($ = USD) | |||||
| Fairfield | 1.3 × 10⁹ | 1.7 × 10⁸ | 1.1 × 10⁹ | 1.2 × 10⁷ | 4.0 × 10⁶ |
| Hartford | 1.6 × 10⁹ | 4.3 × 10⁸ | 1.1 × 10⁹ | 5.8 × 10⁶ | 2.6 × 10⁷ |
| Litchfield | 2.0 × 10⁹ | 1.0 × 10⁸ | 1.8 × 10⁹ | 2.6 × 10⁷ | 1.9 × 10⁷ |
| Middlesex | 7.9 × 10⁸ | 7.3 × 10⁷ | 7.1 × 10⁸ | 9.1 × 10⁶ | 6.5 × 10⁶ |
| New Haven | 1.3 × 10⁹ | 2.1 × 10⁸ | 1.0 × 10⁹ | 1.5 × 10⁷ | 2.5 × 10⁷ |
| New London | 1.4 × 10⁹ | 1.3 × 10⁸ | 1.3 × 10⁹ | 1.9 × 10⁷ | 0 |
| Tolland | 8.8 × 10⁸ | 8.3 × 10⁷ | 7.8 × 10⁸ | 4.8 × 10⁶ | 7.6 × 10⁶ |
| Windham | 1.1 × 10⁹ | 1.4 × 10⁸ | 9.5 × 10⁸ | 1.5 × 10⁷ | 0 |
| Totals | 1.0 × 10¹⁰ | 1.3 × 10⁹ | 8.8 × 10⁹ | 1.0 × 10⁸ | 8.8 × 10⁷ |
| Soil Regulating Ecosystem Services in the State of Connecticut | |||
|---|---|---|---|
| Degree of Weathering and Soil Development | |||
| Slight 99% | Moderate 1% | ||
| Entisols 13% | Inceptisols 84% | Histosols 2% | Mollisols 1% |
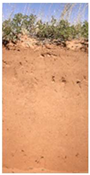 | 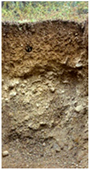 |  | 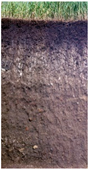 |
| Social cost of soil organic carbon (SOC): $23.7B | |||
| $2.2B | $15.4B | $6.0B | $104.0M |
| 9% | 65% | 25% | 1% |
| Social cost of soil inorganic carbon (SIC): $10.3B | |||
| $1.3B | $8.8B | $104.9M | $88.0M |
| 13% | 85% | 1% | 1% |
| Social cost of total soil carbon (TSC): $34.0B | |||
| $3.5B | $24.2B | $6.1B | $192.0M |
| 10% | 71% | 18% | 1% |
| Sensitivity to climate change | |||
| Low | Low | High | High |
| SOC and SIC sequestration (recarbonization) potential | |||
| Low | Low | Low | Low |
Publisher’s Note: MDPI stays neutral with regard to jurisdictional claims in published maps and institutional affiliations. |
© 2022 by the authors. Licensee MDPI, Basel, Switzerland. This article is an open access article distributed under the terms and conditions of the Creative Commons Attribution (CC BY) license (https://creativecommons.org/licenses/by/4.0/).
Share and Cite
Mikhailova, E.A.; Lin, L.; Hao, Z.; Zurqani, H.A.; Post, C.J.; Schlautman, M.A.; Post, G.C. Contribution of Land Cover Conversions to Connecticut (USA) Carbon Footprint. Geographies 2022, 2, 286-302. https://doi.org/10.3390/geographies2020020
Mikhailova EA, Lin L, Hao Z, Zurqani HA, Post CJ, Schlautman MA, Post GC. Contribution of Land Cover Conversions to Connecticut (USA) Carbon Footprint. Geographies. 2022; 2(2):286-302. https://doi.org/10.3390/geographies2020020
Chicago/Turabian StyleMikhailova, Elena A., Lili Lin, Zhenbang Hao, Hamdi A. Zurqani, Christopher J. Post, Mark A. Schlautman, and Gregory C. Post. 2022. "Contribution of Land Cover Conversions to Connecticut (USA) Carbon Footprint" Geographies 2, no. 2: 286-302. https://doi.org/10.3390/geographies2020020
APA StyleMikhailova, E. A., Lin, L., Hao, Z., Zurqani, H. A., Post, C. J., Schlautman, M. A., & Post, G. C. (2022). Contribution of Land Cover Conversions to Connecticut (USA) Carbon Footprint. Geographies, 2(2), 286-302. https://doi.org/10.3390/geographies2020020