Article

Validating Capacitive Pressure Sensors for Mobile Gait Assessment

1
Athlete Engineering Institute, Mississippi State University, Starkville, MS 39759, USA
2
Industrial and Systems Engineering, Mississippi State University, Mississippi State, MS 39762, USA
3
Electrical and Computer Engineering, Mississippi State University, Mississippi State, MS 39762, USA
4
Agricultural and Biological Engineering, Mississippi State University, Starkville, MS 39759, USA
5
Office of Research and Economic Development, Mississippi State University, Starkville, MS 39759, USA
6
Fashion Design and Merchandising, Mississippi State University, Mississippi State, MS 39762, USA
7
Fashion Design and Merchandising, Texas Christian University, Fort Worth, TX 76109, USA
8
Kinesiology, Mississippi State University, Mississippi State, MS 39762, USA
9
School of Health Related Professions, University of Mississippi Medical Center, Jackson, MS 39216, USA
*
Author to whom correspondence should be addressed.
Biomechanics 2025, 5(3), 54; https://doi.org/10.3390/biomechanics5030054 (registering DOI)
Submission received: 9 April 2025 / Revised: 20 June 2025 / Accepted: 2 July 2025 / Published: 1 August 2025
(This article belongs to the Section Gait and Posture Biomechanics)

Abstract

Background: This study was performed to validate the addition of capacitive-based pressure sensors to an existing smart sock developed by the research team. This study focused on evaluating the accuracy of soft robotic sensor (SRS) pressure data and its relationship with laboratory-grade Kistler force plates in collecting ground force reaction data. Methods: Nineteen participants performed walking trials while wearing the smart sock with and without shoes. Data was collected simultaneously with the sock and the force plates for each gait phase including foot-flat, heel-off, and midstance. The correlation between the smart sock and force plates was analyzed using Pearson’s correlation coefficient and R-squared values. Results: Overall, the strength of the relationship between the smart sock’s SRS data and the vertical ground reaction force (GRF) data from the force plates showed a strong correlation, with a Pearson’s correlation coefficient of 0.85 ± 0.1; 86% of the trials had a value higher than 0.75. The linear regression models also showed a strong correlation, with an R-squared value of 0.88 ± 0.12, which improved to 0.90 ± 0.07 when including a stretch-SRS for measuring ankle flexion. Conclusions: With these strong correlation results, there is potential for capacitive pressure sensors to be integrated into the proposed device and utilized in telehealth and sports performance applications.

1. Introduction

Each year, an estimated 37.3 million falls severe enough to require medical attention occur, of which adults older than 60 years suffer the most incidents [1]. Quantitative gait markers have been utilized as independent, strong predictors of incident falls in geriatric populations [2]. With great advancements in biomechanical assessment technology, these measures can be easily and quickly collected in clinical and research laboratory settings. However, access to these services can be a limitation for individuals in rural areas due to a lack of available facilities and economic barriers. The renaissance of telehealth services has begun to address some of the barriers facing rural areas. Telehealth, as described by the Health Resources and Services Administration, refers to the electronic information and telecommunication technologies used to support health-related services [3]. The expansion of telehealth services has been catalyzed in recent years due to major societal shifts caused by the COVID-19 pandemic and healthcare labor shortages [4,5].
The emergence of telehealth practices has been met with new technological developments in monitoring and assessment tools in the form of wearable technology. Smart, pressure-based insoles have emerged as a common gait assessment tool, proven to be suitable for capturing parameters for performing gait assessments, comparable to that of clinical and research-grade systems, at fractions of the cost of standard biomechanical systems [6,7]. FeetMe® is a commercially available, patented, and validated smart insole system capable of measuring pace, rhythm, variability, asymmetry, postural control, and walking dynamics data for remote therapeutic monitoring, home care rehabilitation, clinical trial optimization, medical practice, and work injury management applications [7,8,9]. However, these embedded-sensor insole solutions have two significant limitations: (1) their requirement to be used with shoes and (2) their inability to be incorporated with medical orthotics. Some practitioners prefer assessments that do not involve wearing shoes to limit the stabilization introduced to the ankle joint requiring a non-insole approach to set a baseline for patients, such as going barefoot or wearing socks [10]. Additionally, smart insoles are inadequate on their own for capturing joint angles at the foot–ankle complex, typically having to be paired with complementary technology such as video data for pose estimation [11]. The sensing technology used in smart insoles can be combined with novel sensing methods and implemented in sock applications to address some of the limitations of smart insoles.
Research conducted by the research team has aimed to address these very limitations. Through multiple rounds of National Science Foundation (NSF) I-Corps program interviews, a common desire for reliable and validated data “from the ground up” emerged among practitioners regarding wearable technology [12,13]. This need is what served as the driving factor of a wave of research with the goal of designing a wearable smart sock capable of accurately measuring kinematic and kinetic measures at the foot–ankle complex during gait and athletic movements [14]. Previous research has involved the use of inertial measurement units (IMUs) to capture gait-related measures; however, these solutions are limited due to inherent restrictions in the sensing technology for IMUs, such as drift [15].
Previous studies investigating the validity of pressure sensors in a smart sock during gait phases have increased over the past 5 years. The data collected in this study is comparable to that of those using smart insoles for a few reasons:
(1) Several studies have been conducted that compare smart, pressure-based insoles with force plate technology, as outlined in this paper. One study validated smart insoles using a vector force plate during walking and running. Gait phases were not investigated, but the data collected with the insoles was found to have excellent absolute agreement using intraclass correlation analysis. Regardless, these biases were negligible, and the studies still indicate a strong correlation between the two measurement methods [16]. To reduce potential bias in the future, more sensors could be added to improve accuracy when measuring these features.
(2) The authors did not discover any peer-reviewed publications directly utilizing the capacitive-based pressure sensors investigated in this study; however, prior work does exist which tested the validity of capacitive-based pressure sensors in smart insole applications. A recent 2022 study used several capacitive pressure sensors, like the smart sock discussed in this paper, placed along the bottom of the foot in a 3D-printed insole. This study used several sensors distributed throughout the insole where the sock uses a single stretch-SRS sensor. These sensors proved to be capable of measuring and mapping real-time plantar pressures at each phase of a typical gait cycle, which further validates the reliability of capacitive pressure sensors in real-time gait analysis [17].
(3) Prior work has investigated the validity of gait analysis using pressure-based insoles; however, these studies are limited to capturing only heel strike and toe off [18]. Additionally, a study using a capacitive pressure-sensing insole was found to have good agreement with the plantar pressure forces during the stance, heel-off, swing, and heel-strike gait phases. It could also properly distinguish between gait patterns of walking and running. The study concluded that capacitive pressure sensors could be used to measure varying plantar pressures and detect gait phase changes in order to properly track the health of the ankle and foot [19]. This becomes relevant to the goal of integrating the smart sock into telemedicine so that patients and physicians can have an option to analyze various features of gait without having to rely on wearing a shoe that could possibly alter gait kinematics. Since the sock uses capacitive pressure sensors as this insole does, it poses a competitive solution that still offers a strong correlation to force plate data. An additional background on the state of the literature for smart socks for gait analysis research has been presented in a previous work [14].
The novelty in the approach of this research was the incorporation of soft robotic sensors (SRSs). These SRSs, which exhibit less drift and demonstrate a linear change in capacitance to the stretch or compression of the sensors, can be used to develop a smart sock and validate it against gold-standard motion capture equipment for effectively capturing joint kinematics. The primary focus of this research is centered around the usage of strain SRSs for capturing joint kinematics at the foot–ankle complex based on validated sensor positioning at bony landmarks. The next step in development is to address the kinetic aspect of data collection through the usage of pressure SRSs with a similar basis for positioning, using anatomical landmarks, as previously performed with strain SRSs. Therefore, this paper outlines the research efforts surrounding the incorporation of pressure-based SRSs into an existing smart sock application.
The novel contributions of this study with respect to the previous literature on closing the wearable gap research are as follows:
  • Presentation of an improved smart sock prototype for measuring kinetic data;
  • Validation of the newly developed smart sock prototype as a mobile force-sensing solution.

2. Materials and Methods

2.1. Participants

Nineteen participants (9 males and 10 females) were recruited for the study. The participants varied in height (M: 170 cm–193 cm; F: 157 cm–178 cm), weight (M: 69 kg–102 kg; F: 52 kg–95 kg), and foot size (M: 8–12 [US]; F: 6–10 [US]), and a summary is provided in Table 1. No major lower extremity injuries that could have affected gait were reported in pre-session screening, and all participants signed informed consent before any activity. An Institutional Review Board (IRB Protocol #17--725) documented and reviewed all methods.

2.2. Proposed Device/Solution

The core technology powering the proposed device, which is illustrated in Figure 1, has been presented in previous work: utilizing soft robotic sensors (SRSs) in wearables to capture kinematic and kinetic information. Previous studies focused on the use of capacitive-based stretch sensors to capture joint angles at the foot–ankle complex. This study focuses specifically on pressure sensors located on the bottom of the sock to capture ground reaction force (GRF) production with a single strain sensor along the sagittal plane for aligning the smart sock data with the MoCap data. The alignment was performed within a Python 3 script for analysis, which used cross-correlation to align the ankle flexion data collected from MoCap to match the stretch sensor data collected along the sagittal plane of the ankle. The participants were instructed to briefly stand on their toes at the beginning of each trial to induce a clear signal peak from each system to help improve data alignment. This same technique has been employed in previous research to ensure reliable alignment [14]. Researchers applied three significant changes to the solution from the devices described in [14]: (1) a new sensor supplier, (2) modifications to the existing hardware module, and (3) a new athletic sock.
Researchers secured a new sensor partner, Parker Hannifin (PH; Cleveland, OH, USA), who offered a similar capacitive-based sensor line that was integrated directly into existing hardware and software solutions, with slight revisions. The revisions included the development of new printed circuit boards (PCBs) for both the hardware module and the strain sensors, a new wiring solution, and 3D-printed sensor mounts.

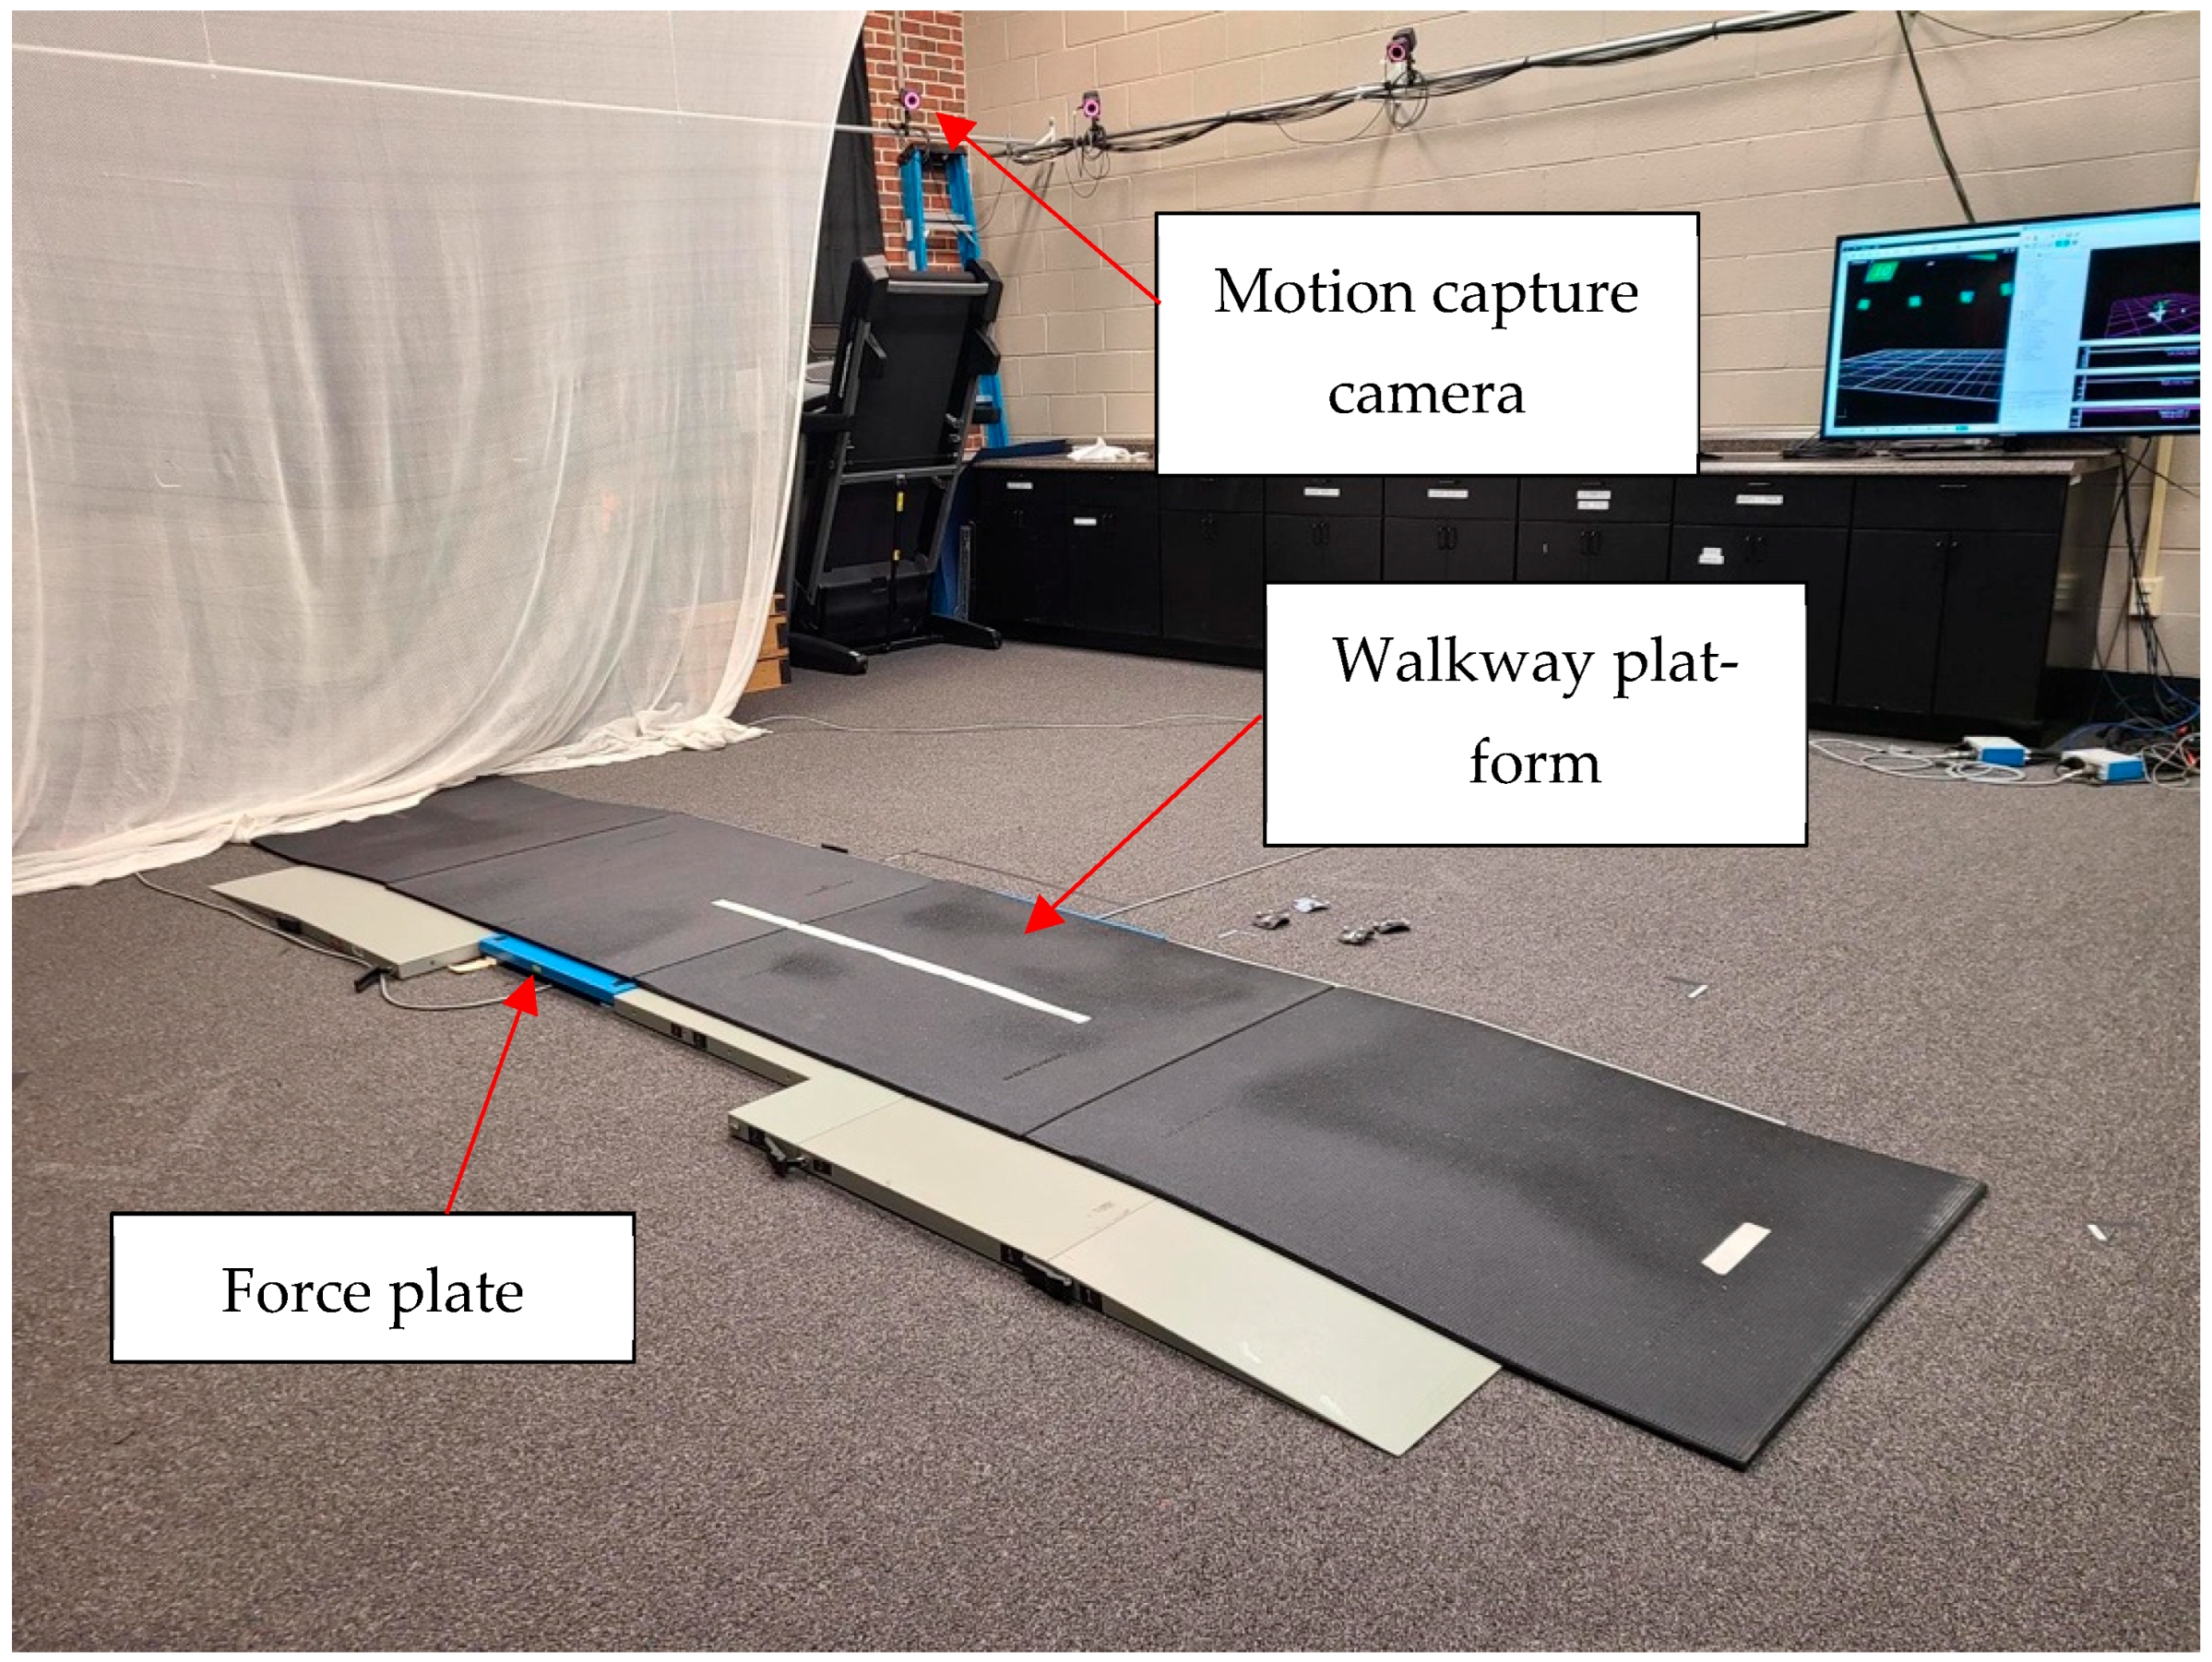
2.3. Experimental Setup and Methodology

The study sessions were conducted at Mississippi State University’s Center for Advanced Vehicular Systems (CAVS). Specifically, the Human Performance Lab (HPL) was utilized because it has the gold-standard lab equipment. The HPL is outfitted with a 12-camera three-dimensional (3D) motion capture (MoCap) system (Vicon, Oxford, UK) and a set of two force plates (Kistler, Novi, MI, USA). Biomechanical analysis was conducted using the MotionMonitor (MM) xGen (Innovative Sports Training, Inc., Chicago, IL, USA). MoCap was sampled at 250 Hz, while ground reaction forces were downsampled to 250 Hz to match the MoCap sampling rate.
The lab used blackout curtains and deidentified descriptors to protect participant confidentiality. After ensuring their familiarity with the protocol and obtaining their signed consent, the participants were instructed to don sock liners and smart socks. Sock liners were provided for the participants and worn underneath the socks for sanitary purposes. These sock liners were replaced for each participant. The location of each sensor was then inspected to ensure that it aligned with the desired anatomical landmark. Next, marker clusters for the MoCap system were placed on the shank and foot of each leg to capture lower-limb kinematic data. A stylus was used for a ten-point subject calibration process to annotate bony landmarks for the MM xGen 3.55.7 to compute biomechanical information. A Python 3-based graphical user interface was developed by the research team to collect sensor data from the smart sock via Bluetooth.
Once the setup was complete, the participants were instructed to stand at a base point on the platform, shown in Figure 2, and walk at a self-selected pace across the platform, refraining from looking down where each foot was landing. The purpose was to prevent participants from altering their gait to ensure that each foot was in contact with the force plates. Instead, the researchers would adjust the participant’s starting location so that their natural gait would align with the location of the force plates.
At this point, trials began with five total walks being performed. Each trial was monitored closely to confirm that each step was in full contact with the force plates. The MM and custom-developed smart sock software were also analyzed after each trial to ensure that the data was correctly collected with no tracking loss or sensor connection issues.
After five trials, the marker clusters on the feet were removed to perform the next set of trials with shoes. Velcro-covered slip-ons were placed over the shoes for the cluster to attach to the shoe. Subject calibration was performed once again since the clusters were removed; this action must be completed any time marker clusters change position on a participant. One test walk was performed to see if the shoes altered the participants’ gait, and adjustments to the starting position were made accordingly. Five additional trials were performed following the same procedures as those described above.

2.4. Data Analysis

2.4.1. Preprocessing

Data analysis was performed using Python 3 with signals from the smart sock prototype upsampled to 250 Hz using linear interpolation to match the sampling frequency of motion capture and force plate systems. The datasets were time-aligned using a cross-correlation between the stretch-SRS signal and the flexion signal of the MoCap system. Then, the alignment was fine-tuned based on the GFR_Z signal from the force plate. A Savitzky—Golay filter with a window length of 51 and order of 5 was applied to the data to remove high-frequency noise from the signals and improve the reliability of the cross-correlation alignment. This is the same approach used in previous work by the authors [14]. During the processing stage, the data was visually inspected to ensure that complete gait cycles were captured on the force plates. Consequently, 16 trials of SRS measurements were removed from the dataset due to incomplete gait cycles being captured.

2.4.2. Linear Regression and Correlation

To this end, the pressure data measured with the SRS embedded into the sock prototype was compared with the force plate data. After preprocessing of data was carried out, correlation analysis and multivariate linear regression analysis were performed to compare the SRS and force plate data to determine the strength of the relationship between the systems. Pearson’s correlation coefficient and R-squared values were calculated to investigate the linearity between measurements. Pearson’s correlation varied between −1 and +1, and values closer to the end of this range indicated a stronger relationship. For correlation analysis, the three signals from the compression-based SRS were scaled and added together, and the combined SRS signal was evaluated against the force plate GRF_Z using Pearson’s correlation. In the case of multivariate linear regression, two sets of models were developed. In the first method, GRF_Z was modeled using three compression-based SRS signals, whereas in the second method, GRF_Z was modeled using three compression-based SRS signals and the Plantarflexion SRS signal.
Besides the evaluation of the overall relationship between systems during the stance phase, several kinetic features of interest have been extracted from the GRF signals, including the first peak (foot-flat), second peak (heel-off), and valley corresponding to the pressure minima at ~50% ground contact (midstance). These features are extracted from GRF and compared to their estimation from regression using correlation analysis and Bland–Altman plots.

2.4.3. Bland–Altman Analysis

The Bland–Altman analysis, proposed by Martin Bland and Douglas Altman [20], is a method for evaluating the agreement between two measurement methods and has been employed by many researchers, especially in medical laboratories, to validate a clinical measurement method [21]. This method plots the mean of two measurements (x-axis) against their difference (y-axis). A one-sample t test was carried out on the differences between the measurements of the two systems. The bias is defined as the mean of the difference between the measurements of two systems, and the limits of agreements (LOA) is defined as the standard deviation of the differences.

3. Results

The overall strength of the relationship between the combined pressure-based SRS signals and GRF using Pearson’s correlation analysis was 0.85 ± 0.1, with 86% of the trials having a correlation value higher than 0.75, indicating a strong correlation between the two variables [22]. These results are fully illustrated in Table 2.
Modeling the GRF based on three compression-based SRS using linear regression showed a strong relationship between the two measurement systems, with an R-squared value of 0.88 ± 0.12, and incorporating the stretch-SRS into the model improved the R-squared value to 0.90 ± 0.07. The violin plots of the results are illustrated in Figure 3.
The agreement between the two measurement systems in capturing the features of interest was evaluated using Pearson’s correlation and Bland–Altman analysis. The correlation values are presented in Table 1 for all the trials and separately for the trials with shoes and no shoes (socks only).
The Bland–Altman plots indicated in Figure 4 show some agreement between the features of interest of the two systems. The mean differences in the LOA are indicated by blue and orange dashed lines, respectively, and the majority of the points are within the LOA. There is almost no bias in the mean pressure. However, the Bland–Altman plots for the other features indicate that the max pressure, foot-flat, and heel-off regression models underestimated (positive bias) these features, and the local valley of the signal at the midstance SRS overestimated (negative bias) the pressure.
These findings indicate, however, that there is a high correlation between the measurements of the two systems, but the SRS cannot accurately capture the valleys of the signal at midstance, and incorporating more sensors will help improve the accuracy of sock measurements at the midstance.

4. Discussion

This study’s purpose was to determine the validity of the integration of capacitive pressure sensors in a smart sock for capturing ground reaction force data. The purpose was to incorporate these sensors into a smart sock used in previous research. The SRS data was compared with the GRF data that was simultaneously collected by lab-grade Kistler force plates. The results from both the Pearson correlation analysis and linear regression models showed that the pressure-based SRS data collected from the smart sock have a strong correlation with the force plate data for measuring varying plantar pressures at several phases of gait analysis, including foot-flat, heel-off, and midstance. The walking speed trials showed a bias of slightly underestimating the GRF peak and valley values [16], whereas the smart sock in this study had a bias of underestimating peak values but overestimating the valleys.
As previously mentioned, insoles have been designed in other studies to capture pressure data as well [6,9], but this can pose a problem of requiring shoes and not being compatible with medical orthotic insoles. Since one benefit of the smart sock is that it does not require shoes as insoles do, the validity of the sock must be compared in trials with shoes and without shoes. Table 1 shows the correlation results from the linear regression models between the signals from the smart socks and force plates. The data showed no major degradation in signal accuracy between the trials. This differs from previous studies, which acquired better results from trials with shoes [1]. The main difference between the trials in this study was that the data collected from the no-shoe trials had more outliers. Researchers determined that this may be due to the lack of insulation and reduction in noise provided by shoes or because of sensor processing and wiring failures.
Even though the mean correlation in this study was robust, the data could have potentially been skewed by several outliers. It has been concluded that these outliers may have been due to sensor connection issues. Signal loss was seen in two trials, causing a drop in the signal, resulting in a lower correlation with the force plate data in those trials. Faulty sensor connections could be mitigated through alternative filtering methods, by increasing the strength of the filter to limit the effect of the dips in signal at the specific times they dropped, or by implementing a median filter to reduce the spikes that occurred.
The signal loss that resulted in outliers could have occurred in two ways: (1) wire breakage at the solder joint or (2) wire breakage at the connector. The most common failure mode was at the connector where the thin wires would be sliced by the crimp connector over time with movement from the participant trials. One solution could be to use a larger wire or sensors that integrate better with the fabric, such as a heat-pressed wiring solution that allows for more movement in the electrical connections.
Overall, the relationship between the pressure-based SRS signal and the GRF using Pearson’s correlation analysis was 0.85± 0.1. Previous iterations of this prototype achieved correlations of 0.78 and 0.56 for no-shoe and shoed experiments, reflecting a strong improvement in correlation when compared to the gold-standard lab equipment [23]. This improvement suggests further acceptability in the adoption of capacitive-based pressure SRSs for use in smart sock applications.
The next step in the evolution of the smart sock prototype would be to combine the sensors from each stretch- and compression-based design into one solution that could provide a full biomechanical assessment of the foot—ankle complex. The information from the SRSs could be combined with an inertial measurement unit (IMU) for this purpose. IMUs are adequate for assessing metrics during running-based team sports [24]. Adding this element could improve the existing external monitoring devices in sports and medical settings. Additionally, future studies could investigate the validity of assessing other metrics, such as center-of-pressure, 3D ground–reaction forces, or postural sway, which would offer additional insight into the validity of a developed smart sock as a telehealth assessment tool [25,26].

5. Conclusions

Revisions of a previously investigated smart sock prototype were developed to include pressure-sensing technology. Human subject trials were performed to analyze the application of smart socks as a gait assessment tool. A correlation analysis was used to test the validity of the smart sock against “gold-standard” force plate technology. The results showed a strong correlation with the force plates; thus, there is potential for a “mobile force plate” application with the proposed device, given that the limitations are addressed.
The use of shoes in this study improved the results compared to the no-shoe trials. Further research is necessary to test specific telehealth-related measures; however, the initial results encourage their use in healthcare applications. Future work will also explore combining the joint information gathered in previous iterations of the smart sock with the presented iteration to deliver complete kinetic and kinematic information at the foot–ankle complex. Additionally, future research will explore the effects of influencing factors (e.g., participant anthropometry and gait characteristics) on data accuracy. With promising results from this study on the validity of the smart sock compared to “gold-standard” lab equipment, future studies involving heterogeneous populations for target applications may be warranted.

6. Patents

Burch, R. F., Luczak, T., Saucier, D., Ball, J., & Chander, H. Wearable flexible sensor motion capture system. Patents No. 11672480. Awarded 13 June 2023.

Author Contributions

Conceptualization, J.C.M., D.S., S.D., E.P., T.S., J.C., R.F.B., J.E.B., C.E.F., B.S. and H.C.; methodology, J.C.M., D.S., S.D., E.P., R.F.B., J.E.B., C.E.F., B.S. and H.C.; software, J.C.M., D.S., S.D., E.P. and J.E.B., validation, J.C.M., D.S., S.D., E.P., T.S., J.C., R.F.B., J.E.B., C.E.F. and H.C.; formal analysis, J.C.M., D.S., S.D., J.E.B., C.E.F. and H.C.; investigation, J.C.M., D.S., S.D., E.P., T.S. and J.C.; resources, R.F.B., J.E.B., C.E.F. and H.C.; data curation, J.C.M., D.S., S.D., E.P., T.S. and J.C.; writing—original draft preparation, J.C.M., D.S., S.D., E.P. and T.S.; writing—review and editing, J.C.M., D.S., S.D., E.P., T.S., J.C., R.F.B., J.E.B., C.E.F. and H.C.; visualization, J.C.M., D.S., S.D., E.P. and T.S.; supervision, R.F.B., J.E.B., C.E.F., B.S. and H.C.; project administration, J.C.M., D.S., S.D., R.F.B., B.S. and J.E.B.; funding acquisition, R.F.B., J.E.B., C.E.F., B.S. and H.C. All authors have read and agreed to the published version of the manuscript.

Funding

This research was funded by the National Science Foundation, NSF 18-511—Partnerships for Innovation award number 1827652.

Institutional Review Board Statement

The study was conducted in accordance with the Declaration of Helsinki and approved by the Institutional Review Board of Mississippi State University (IRB# 17-725, approved 04/12/2018).

Informed Consent Statement

Informed consent was obtained from all subjects involved in the study.

Data Availability Statement

The original contributions presented in this study are included in the article. Further inquiries can be directed to the corresponding author.

Acknowledgments

We thank the anonymous reviewers for their helpful suggestions for improving the paper.

Conflicts of Interest

The authors declare no conflicts of interest.

References

  1. Falls. Available online: https://www.who.int/news-room/fact-sheets/detail/falls (accessed on 13 September 2023).
  2. Verghese, J.; Holtzer, R.; Lipton, R.B.; Wang, C. Quantitative Gait Markers and Incident Fall Risk in Older Adults. J. Gerontol. A Biol. Sci. Med. Sci. 2009, 64A, 896–901. [Google Scholar] [CrossRef] [PubMed]
  3. What Is Telehealth?|HRSA. Available online: https://www.hrsa.gov/telehealth/what-is-telehealth (accessed on 13 September 2023).
  4. Fields, C. Supporting the Health Care Workforce: Lessons Following the COVID-19 Pandemic. JAMA 2020, 323, 1439–1440. [Google Scholar] [CrossRef]
  5. Shaver, J. The State of Telehealth Before and After the COVID-19 Pandemic. Prim. Care 2022, 49, 517–530. [Google Scholar] [CrossRef] [PubMed]
  6. Martini, E.; Fiumalbi, T.; Dell’agnello, F.; Ivanić, Z.; Munih, M.; Vitiello, N.; Crea, S. Pressure-Sensitive Insoles for Real-Time Gait-Related Applications. Sensors 2020, 20, 1448. [Google Scholar] [CrossRef] [PubMed]
  7. Parati, M.; Gallotta, M.; Muletti, M.; Pirola, A.; Bellafà, A.; De Maria, B.; Ferrante, S. Validation of Pressure-Sensing Insoles in Patients with Parkinson’s Disease during Overground Walking in Single and Cognitive Dual-Task Conditions. Sensors 2022, 22, 6392. [Google Scholar] [CrossRef] [PubMed]
  8. Domínguez, A.G.; Sevilla, R.R.; Alemán, A.; Durán, C.; Hochsprung, A.; Navarro, G.; Páramo, C.; Venegas, A.; Lladonosa, A.; Ayuso, G.I.; et al. Study for the validation of the FeetMe® integrated sensor insole system compared to GAITRite® system to assess gait characteristics in patients with multiple sclerosis. PLoS ONE 2023, 18, e0272596. [Google Scholar] [CrossRef]
  9. Jacobs, D.; Farid, L.; Ferré, S.; Herraez, K.; Gracies, J.-M.; Hutin, E. Evaluation of the Validity and Reliability of Connected Insoles to Measure Gait Parameters in Healthy Adults. Sensors 2021, 21, 6543. [Google Scholar] [CrossRef] [PubMed]
  10. Contini, B.G.; Bergamini, E.; Alvini, M.; Di Stanislao, E.; Di Rosa, G.; Castelli, E.; Vannozzi, G.; Camomilla, V. A wearable gait analysis protocol to support the choice of the appropriate ankle-foot orthosis: A comparative assessment in children with Cerebral Palsy. Clin. Biomech. Bristol. Avon. 2019, 70, 177–185. [Google Scholar] [CrossRef] [PubMed]
  11. Kim, S.; Park, S.; Lee, S.; Seo, S.H.; Kim, H.S.; Cha, Y.; Kim, J.-T.; Kim, J.-W.; Ha, Y.-C.; Yoo, J.-I. Assessing physical abilities of sarcopenia patients using gait analysis and smart insole for development of digital biomarker. Sci. Rep. 2023, 13, 10602. [Google Scholar] [CrossRef] [PubMed]
  12. Luczak, T.; Saucier, D.; Burch V., R.F.; Ball, J.E.; Chander, H.; Knight, A.; Wei, P.; Iftekhar, T. Closing the Wearable Gap: Mobile Systems for Kinematic Signal Monitoring of the Foot and Ankle. Electronics 2018, 7, 117. [Google Scholar] [CrossRef]
  13. Luczak, T.; Burch, R.; Lewis, E.; Chander, H.; Ball, J. State-of-the-art review of athletic wearable technology: What 113 strength and conditioning coaches and athletic trainers from the USA said about technology in sports. Int. J. Sports Sci. Coach. 2020, 15, 26–40. [Google Scholar] [CrossRef]
  14. Carroll, W.; Turner, A.; Talegaonkar, P.; Parker, E.; Middleton, J.C.; Peranich, P.; Saucier, D.; Burch, R.F.; Ball, J.E.; Smith, B.K.; et al. Closing the Wearable Gap–Part IX: Validation of an Improved Ankle Motion Capture Wearable. IEEE Access 2021, 9, 114022–114036. [Google Scholar] [CrossRef]
  15. Young, F.; Mason, R.; Wall, C.; Morris, R.; Stuart, S.; Godfrey, A. Examination of a foot mounted IMU-based methodology for a running gait assessment. Front. Sports Act. Living 2023, 4, 2022. [Google Scholar] [CrossRef] [PubMed]
  16. Cramer, L.A.; Wimmer, M.A.; Malloy, P.; O’Keefe, J.A.; Knowlton, C.B.; Ferrigno, C. Validity and Reliability of the Insole3 Instrumented Shoe Insole for Ground Reaction Force Measurement during Walking and Running. Sensors 2022, 22, 2203. [Google Scholar] [CrossRef] [PubMed]
  17. Samarentsis, A.G.; Makris, G.; Spinthaki, S.; Christodoulakis, G.; Tsiknakis, M.; Pantazis, A.K. A 3D-Printed Capacitive Smart Insole for Plantar Pressure Monitoring. Sensors 2022, 22, 9725. [Google Scholar] [CrossRef] [PubMed]
  18. Fastier-Wooller, J.W.; Lyons, N.; Vu, T.-H.; Pizzolato, C.; Rybachuk, M.; Itoh, T.; Dao, D.V.; Maharaj, J.; Dau, V.T. Flexible Iron-On Sensor Embedded in Smart Sock for Gait Event Detection. ACS Appl. Mater. Interfaces 2024, 16, 1638–1649. [Google Scholar] [CrossRef] [PubMed]
  19. Zhang, Q.; Wang, Y.L.; Xia, Y.; Wu, X.; Kirk, T.V.; Chen, X.D. A low-cost and highly integrated sensing insole for plantar pressure measurement. Sens. Bio-Sens. Res. 2019, 26, 100298. [Google Scholar] [CrossRef]
  20. Bland, J.M.; Altman, D.G. Statistical methods for assessing agreement between two methods of clinical measurement. Am. J. Ophthalmol. 1986, 148, 4–6. [Google Scholar] [CrossRef]
  21. Doğan, N.Ö. Bland-Altman analysis: A paradigm to understand correlation and agreement. Turk. J. Emerg. Med. 2018, 18, 139–141. [Google Scholar] [CrossRef] [PubMed]
  22. Düking, P.; Fuss, F.K.; Holmberg, H.C.; Sperlich, B. Recommendations for Assessment of the Reliability, Sensitivity, and Validity of Data Provided by Wearable Sensors Designed for Monitoring Physical Activity. JMIR mHealth uHealth 2018, 6, e9341. [Google Scholar] [CrossRef] [PubMed]
  23. Closing the Wearable Gap: Foot–Ankle Kinematic Modeling via Deep Learning Models Based on a Smart Sock Wearable|Wearable Technologies|Cambridge Core. Available online: https://www.cambridge.org/core/journals/wearable-technologies/article/closing-the-wearable-gap-footankle-kinematic-modeling-via-deep-learning-models-based-on-a-smart-sock-wearable/5BF02B4389609465419DFA71149B0D0E (accessed on 17 January 2025).
  24. Armitage, M.; Beato, M.; McErlain-Naylor, S.A. Inter-unit reliability of IMU Step metrics using IMeasureU Blue Trident inertial measurement units for running-based team sport tasks. J. Sports Sci. 2021, 39, 1512–1518. [Google Scholar] [CrossRef] [PubMed]
  25. Andò, B.; Baglio, S.; Graziani, S.; Marletta, V.; Dibilio, V.; Mostile, G.; Zappia, M. A Comparison among Different Strategies to Detect Potential Unstable Behaviors in Postural Sway. Sensors 2022, 22, 7106. [Google Scholar] [CrossRef] [PubMed]
  26. Fischer, A.G.; Wolf, A. Body weight unloading modifications on frontal plane joint moments, impulses and Center of Pressure during overground gait. Clin. Biomech. 2016, 39, 77–83. [Google Scholar] [CrossRef] [PubMed]
Figure 1. Revised smart sock prototype with SRS pressure sensors located at the heel, first metatarsal, and fifth metatarsal. The hardware module is attached just above the ankle bone. Motion capture marker clusters are attached at the foot and the shank.
Biomechanics 05 00054 g001
Figure 2. Procedure setup displaying the walkway platform with embedded force plates.
Biomechanics 05 00054 g002
Figure 3. Violin plots of Pearson’s correlation and regression analysis between SRS and force plate measurements. Data from all trials indicates data that is included from trials both with and without shoes being worn.
Biomechanics 05 00054 g003
Figure 4. Bland–Altman plots of force plate versus SRS data showing excellent agreement between the two systems.
Biomechanics 05 00054 g004
Table 1. Participant information.
GenderTotalMean HeightMean WeightMean Foot Size
Male9185 cm98 kg11 [US]
Female10163 cm84 kg8 [US]
Table 2. Correlation and regression analysis between SRS and force plate measurements. “All” indicates both with and without shoe trials.
ShoeFootCorrelation MeanCorrelation StdR2 MeanR2 StdR2 MeanR2 Std
0AllAll0.810.130.830.120.860.10
1AllL0.800.140.830.110.860.09
2AllR0.830.130.830.120.860.10
3ShoesAll0.810.090.830.100.870.08
4ShoesL0.820.170.820.130.860.11
5ShoesR0.810.090.850.090.880.07
6No shoeAll0.800.090.820.110.860.08
7No shoeL0.780.170.800.130.850.11
8No shoeR0.850.160.840.130.870.11
Disclaimer/Publisher’s Note: The statements, opinions and data contained in all publications are solely those of the individual author(s) and contributor(s) and not of MDPI and/or the editor(s). MDPI and/or the editor(s) disclaim responsibility for any injury to people or property resulting from any ideas, methods, instructions or products referred to in the content.

