Communication

Quinaldehyde o-Nitrobenzoylhydrazone: Structure and Sensitization of HepG2 Cells to Anti-Cancer Drugs

by
Valeri V. Mossine
1,*,
Steven P. Kelley
2 and
Thomas P. Mawhinney
1,3
1
Department of Biochemistry, University of Missouri, Columbia, MO 65211, USA
2
Department of Chemistry, University of Missouri, Columbia, MO 65211, USA
3
Department of Child Health, University of Missouri, Columbia, MO 65211, USA
*
Author to whom correspondence should be addressed.
Compounds 2025, 5(3), 24; https://doi.org/10.3390/compounds5030024
Submission received: 16 May 2025 / Revised: 11 June 2025 / Accepted: 23 June 2025 / Published: 25 June 2025
(This article belongs to the Special Issue Organic Compounds with Biological Activity)

Abstract

A quinoline unit is present in many natural products and is an attractive pharmacophore for the development of clinical drugs, including antineoplastics. The title compound (QN) was synthesized via the condensation reaction between quinoline-2-carboxaldehyde and 2-nitrobenzhydrazide. QN’s structure was examined by X-ray diffraction and features extensive stacking interactions in the crystal. The compound is weakly toxic to HepG2 cells, with an IC50 exceeding 400 μM for 48 h exposure. QN at 50 μM, with the dose reduction index in the range of 1.9–4.4, potentiated the cytotoxicity of several clinical chemotherapeutic drugs, including doxorubicin and other topoisomerase inhibitors, vincristine, and carboplatin, but not cisplatin or 5-fluorouracil. The calculated ADME parameters predict satisfactory drug-like properties for QN.

1. Introduction

Liver cancer is one of the most common cancers by incidence and the third leading cause of cancer-related mortality globally [1]. Moreover, these already unfortunate statistics have increased by 25% in the last decade [2]. To counter this alarming trend, major efforts are being dedicated to the development of new therapeutic agents targeting hepatoma in adults [3], but the clinical treatment of liver cancer in children has not progressed beyond standard chemotherapy so far [4]. Therefore, pursuing the enhancement of the therapeutic efficacy of chemotherapeutic drugs in children and the mitigation of their severe side effects remains a high priority in the field of pediatric oncology research.
The sensitization of cancer cells to clinical anti-cancer drugs is an important task in medicinal chemistry. It aims at overcoming primary or acquired cancer drug resistance and lowering the burden of systemic toxicity, which are typical for chemotherapy [5,6]. Although a large number of natural products have been proposed as chemosensitizers [7], consistently favorable clinical outcomes have been achieved when molecular mediators of drug resistance have been identified and specifically targeted. Consequently, the application of drug combinations in clinics has proven beneficial over many years and has become a cornerstone of modern cancer therapy.
A significant number of successful clinical and experimental drugs for cancer treatment contain quinoline units. For instance, a family of topoisomerase inhibitors derived from the plant metabolite camptothecin, such as topotecan, irinotecan, and exatecan, and a line of tyrosine kinase inhibitors for targeted cancer therapy, including lenvatinib, cabozantinib, bosutinib, foretinib, and neratinib, use quinoline as a scaffold (Figure 1). In addition, the quinoline pharmacophore constitutes a privileged structure for many antimalarial drugs (quinine, chloroquine, mefloquine, amodiaquine) or antibacterials (bedaquiline, ciprofloxacin), some of which are being considered for repurposing in cancer therapy [8,9]. Another interesting class of pharmaceuticals marked for repurposing are nitroaromatics [10], which include a variety of antimicrobials (nitrofurans), antiparasitics (niclosamide), and others (e.g., dantrolene). Several ortho-nitrophenyl derivatives have displayed promising activity in experimental cancer models [11,12].
As a part of our search for sensitizers of tumor cells [13,14], we prepared quinaldehyde o-nitrobenzoylhydrazone (QN) and report here the details of its molecular and crystal structure, as well as evidence of QN sensitization of human hepatoblastoma line HepG2 to chemotherapeutic drugs that are currently used to treat this pediatric cancer in clinics [4,15].

2. Materials and Methods

All commercial reagents and cell culture media were purchased from the companies Thermo Fisher Scientific (Waltham, MA, USA) or Sigma-Aldrich (St. Louis, MO, USA).
The HepG2 (passage 74) human hepatoblastoma cell line was purchased from the American Type Culture Collection. The cells were stably transfected with a viability reporter continuously producing destabilized green fluorescent protein from a copepod (cGFP), as reported earlier [16]. The original HepG2 and its reporter transfect were maintained in Gibco OptiMEM-I (Thermo Fisher Scientific) media supplemented with 5% Newborn Calf Serum (NCS) and a penicillin/streptomycin antibiotic cocktail. All cells were kept at 100% humidity, 5% CO2, and 37 °C. The cells were subcultured at a 1:4 ratio upon reaching near confluency.

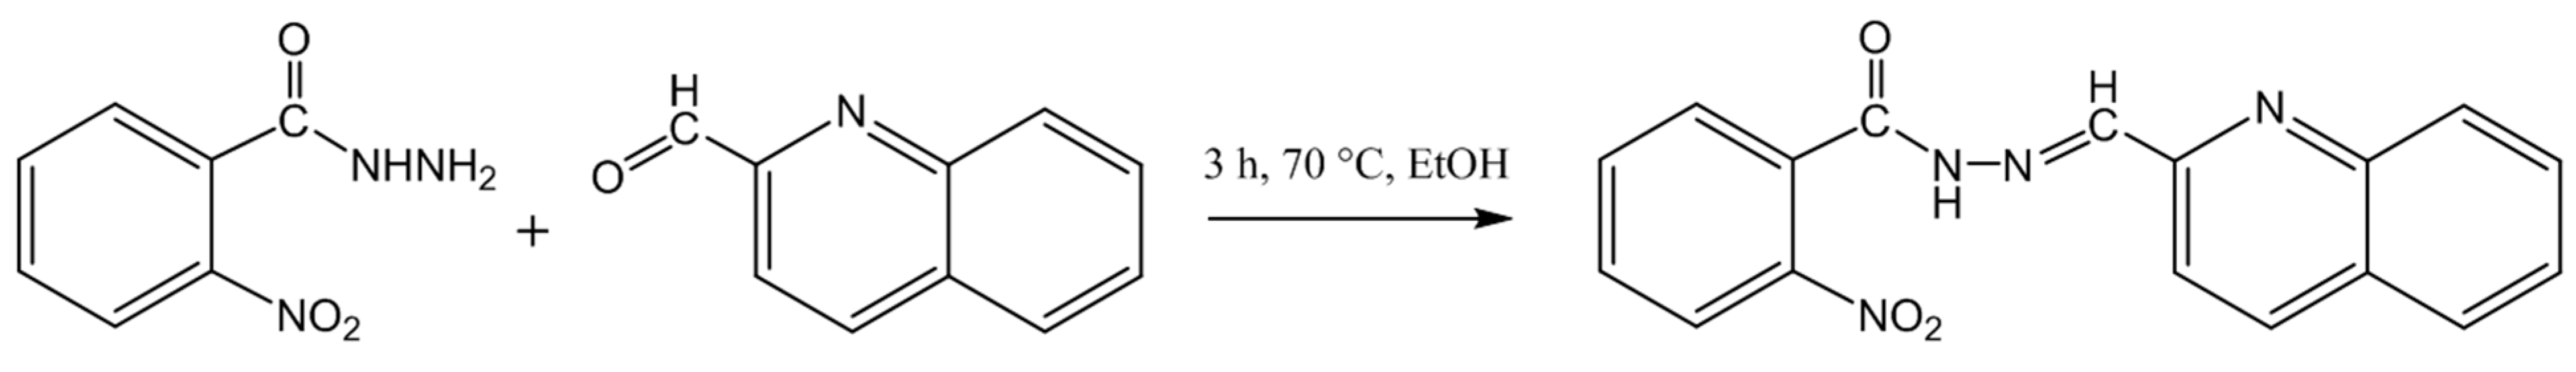
2.1. Synthesis and Crystallization of 2-Nitro-N’-(Quinolin-2-ylmethylene)benzohydrazide

The synthesis of QN was carried out by following a general protocol for the preparation of hydrazones [16]. Briefly, 2-nitrobenzhydrazide was prepared by the hydrazinolysis of methyl 2-nitrobenzoate [17]. In the next step, 362 mg (2 mmoles) of 2-nitrobenzhydrazide and 314 mg (2 mmoles) of 2-formylquinoline were completely dissolved in 10 mL of 95% EtOH and left at room temperature overnight. Crystallization started within one hour, depositing off-white plates of chromatographically (TLC on silica gel F254, Rf = 0.7 with 1:20 MeOH/CHCl3 irrigant) pure crystalline QN, yield 487 mg (76%). The material was recrystallized once from 95% ethanol and used for spectroscopic characterization, diffraction studies, and cytotoxicity experiments. M.p. 193–193.5 °C.

2.2. Mass-Spectrometric and NMR Characterization

QN was dissolved in methanol at room temperature to 2 mg/mL and diluted 1:100 in water/MeOH (1:1 v/v) containing 0.1% formic acid. An accurate mass measurement was acquired with an LTQ Orbitrap XL high-resolution mass spectrometer equipped with an electrospray ionization (ESI) source and Xcalibur software v.2.1.0 (Thermo NA, Thermo Fisher Scientific, Waltham, MA, USA). Calc for C17H13N4O3 ([M + H]+ ion) m/z = 321.0982; found m/z = 321.0984. See Supplementary Figure S1.
H-1 and C-13 NMR spectra of a 0.2 M QN solution in d6-DMSO were recorded at, respectively, 800.1 and 201.2 MHz using a Bruker AMX800 instrument (Bruker Corporation, Billerica, MA, USA). Data are given for the major component. H-1 NMR: 7.335 (d, 1H, J = 8.6 Hz, arom.), 7.741 (dd, 1H, J = 7.6; 1.4 Hz, arom.), 7.748 (m, 1H, J = 8.2; 1.1 Hz, arom.), 7.586 (m, 1H, J = 7.1; 0.8 Hz, arom.), 7.798 (m, 1H, J = 7.5; 1.3 Hz, arom.), 7.898 (d, 1H, J = 7.8 Hz, arom.), 7.908 (t, 1H, J = 7.5 Hz, arom.), 8.039 (d, 1H, J = 8.4 Hz, arom.), 8.184 (s, 1H, azomethine), 8.226 (d, 1H, J = 8.2 Hz, arom.), 8.253 (d, 1H, J = 8.6 Hz, arom.), 12.463 (s, 1H, NH). C-13 NMR: 116.38, 123.61, 127.41, 127.71, 127.93, 128.84, 129.72, 130.17, 130.73, 131.02, 134.48, 136.74, 145.12, 146.92, 147.21, 152.80, 168.10. See Supplementary Tables S1 and S2 and Supplementary Figures S2–S4.

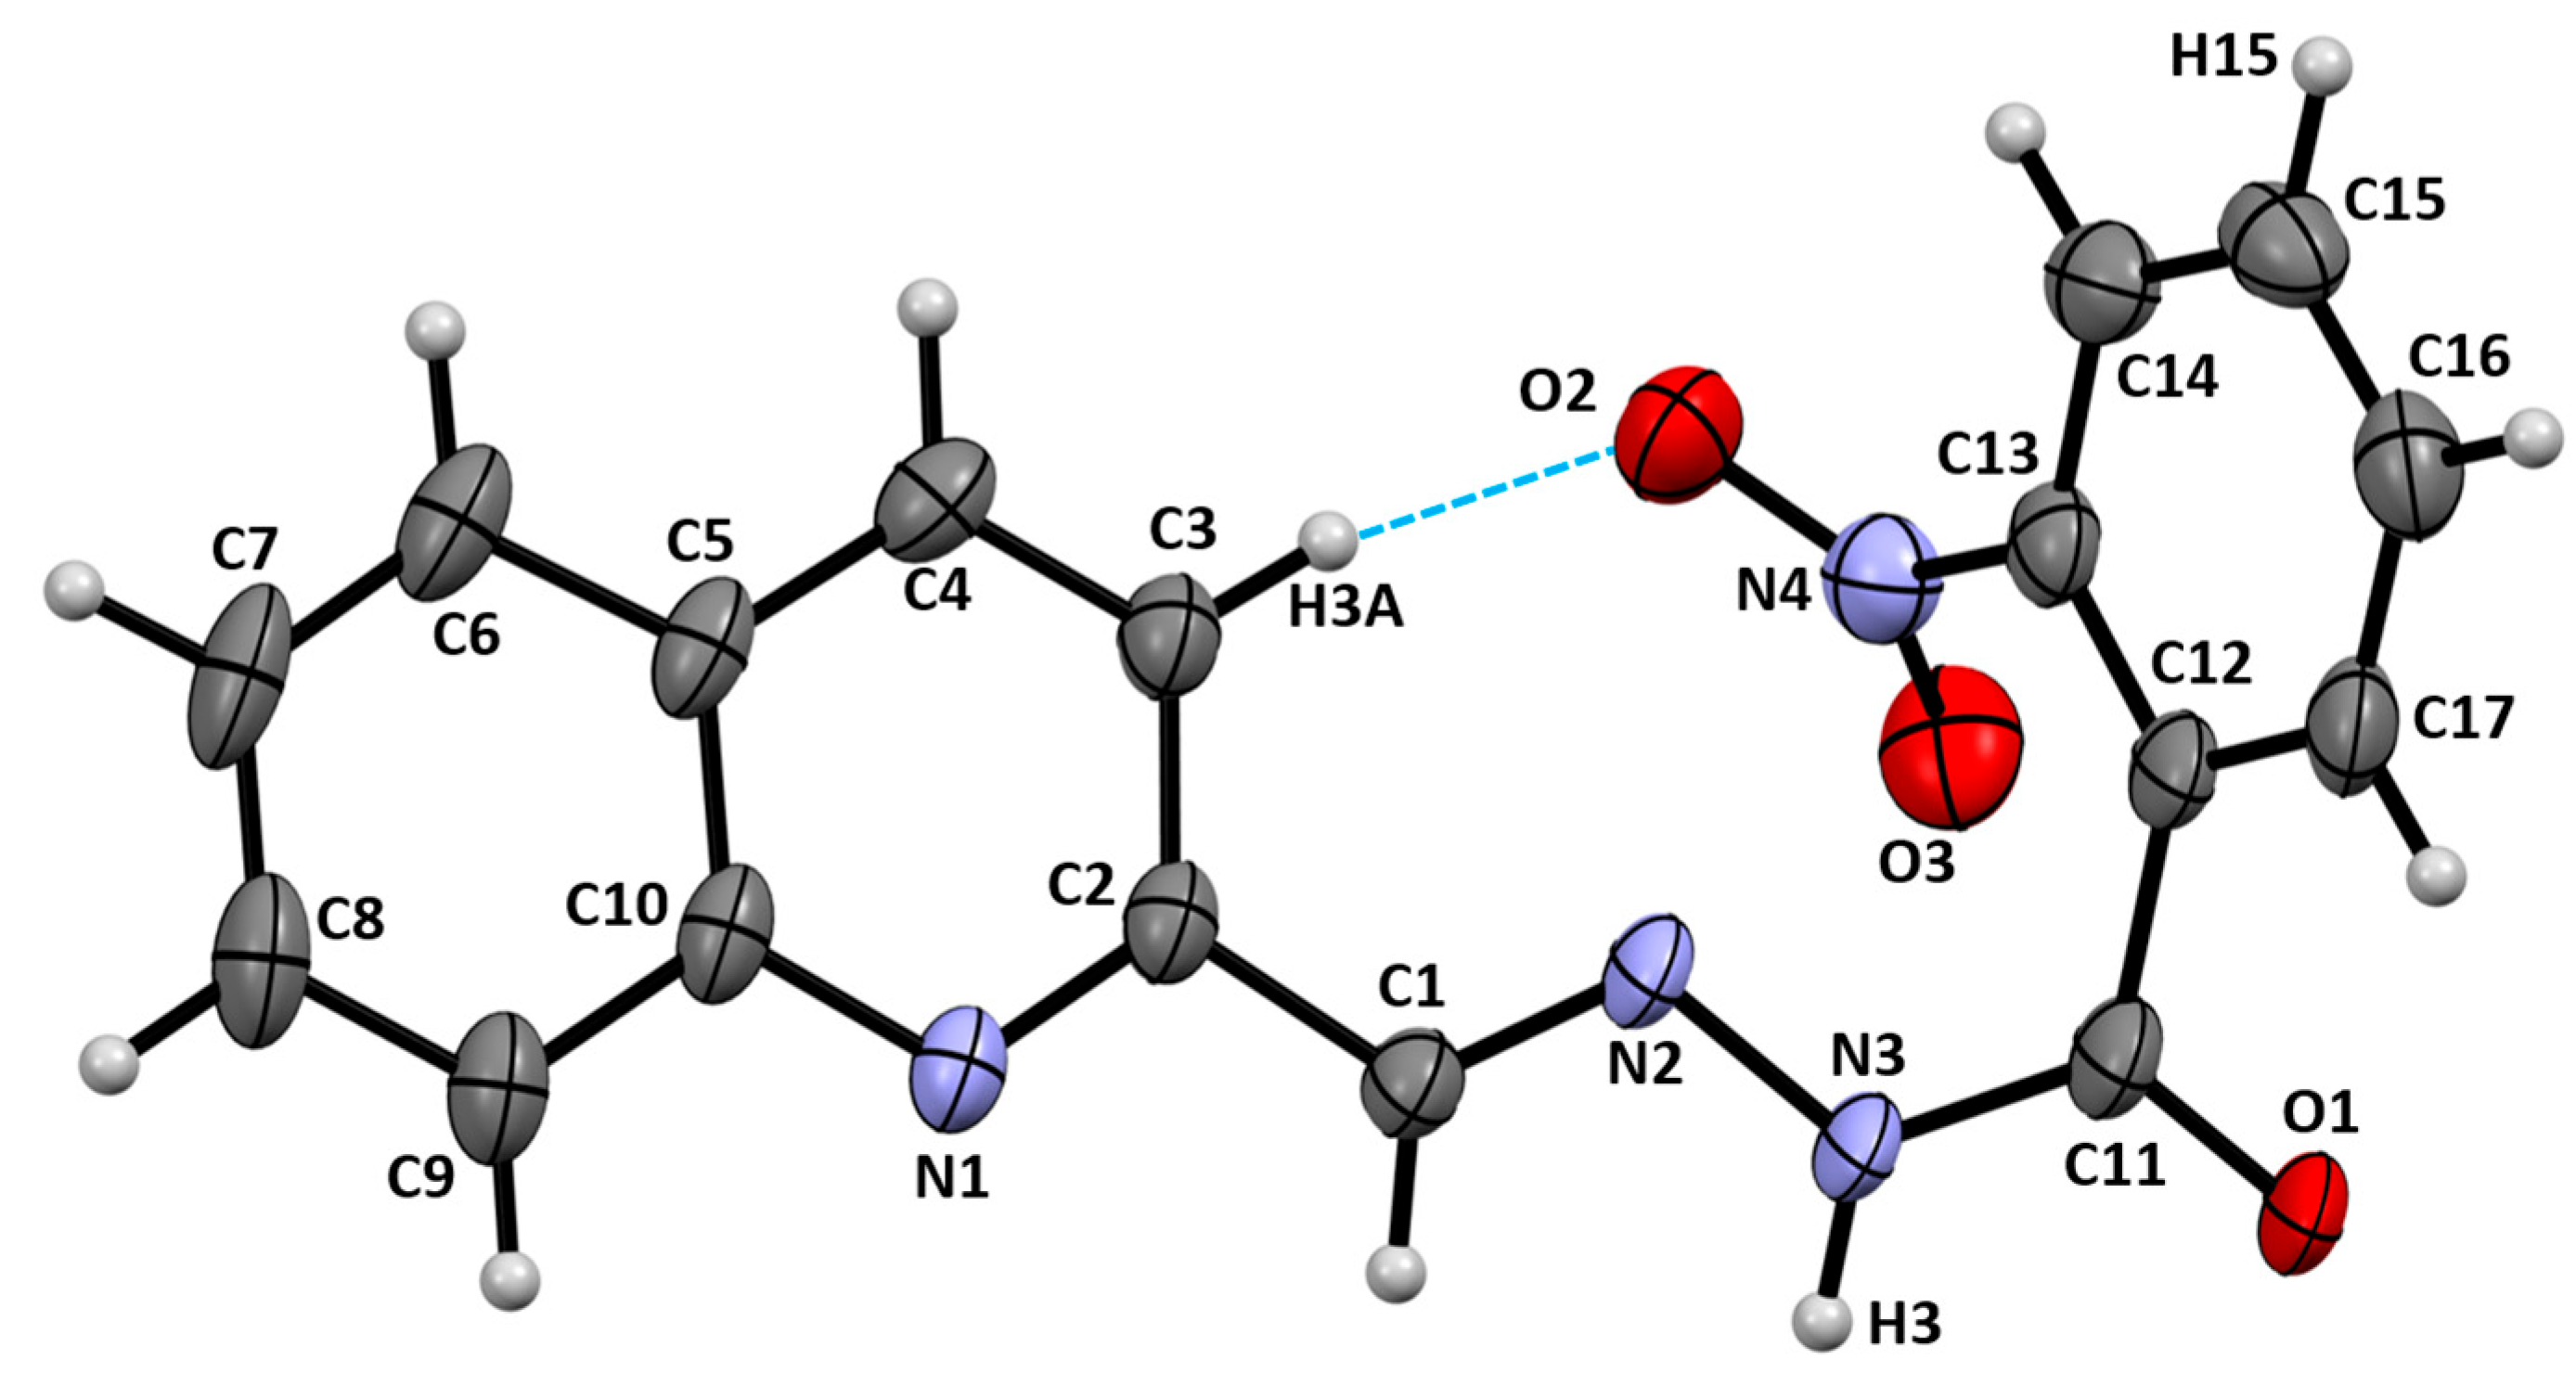
2.3. X-Ray Diffraction Studies

Crystal data and experimental details of the crystallographic studies are given in Supplementary Table S3. The crystal structure was solved with the direct methods program SHELXS [18] and refined by full-matrix least squares techniques using the SHELXL suite of programs [19], with the help of Olex2 [20]. Data were corrected for Lorentz, polarization, and absorption effects. Non-hydrogen atoms were refined with anisotropic thermal parameters. The hydroxyl and ammonium hydrogen atoms were located in difference Fourier maps and were allowed to refine freely. The remaining H-atoms were placed at calculated positions and included in the refinement using a riding model. All hydrogen atom thermal parameters were constrained to ride on the carrier atoms (Uiso(methine, methylene H) = 1.2Ueq and Uiso(amide H) = 1.5Ueq). Structure visualization was performed with the Mercury program v.3.8 [21].

2.4. Cellular Proliferation Assay

The cellular proliferation assay is based on measurements of destabilized GFP, which is continuously produced and degraded in the reporter cells. In the typical manner, reporter HepG2 cells were seeded in wells of a cell culture-treated 96-well plate at 1 × 10⁴ cells per well in the maintenance medium. The cells were allowed to adhere and establish clusters for 42 h. Next, the maintenance medium was replaced with the Phenol Red-free 5:5:1 DMEM/F12 Ham/RPMI-1640 mixture, supplemented with 1 g/L BSA, 2 mg/L insulin, 2 mg/L transferrin, 2 μg/L selenite, and the pen/strep (the test medium). The cells were allowed to adapt for the next 6 h; then, they were exposed to fresh test medium, now containing test agents, their combinations, or the drug carrier (0.5% DMSO) alone, for 48 h. Immediately after treatments with cytotoxic agents, the adherent reporter cells in wells were washed and lysed in 70 μL of the reporter lysis buffer [22] overnight at 8 °C. The lysates’ fluorescence was measured at the 482(9)/512(17) nm wavelength (slit width) setup. All measurements were performed using a Synergy MX (BioTek Instruments, Winooski, VA, USA) plate reader.

2.5. Molecular Modeling, Dose-Effect Analysis, ADME Predictions, and Statistical Analysis

The Hirshfeld surfaces analyses and DFT calculations of the crystal lattices, at the B3LYP/6-31G(d,p) theory level, were performed using CrystalExplorer v.17.5 software [23,24]. Dose–effect analysis of the cell proliferation data was performed by CalcuSyn v.2 (Biosoft, Ferguson, MO, USA). ADME parameters and drug target predictions were performed using the online tools SwissADME and SwissTargetPrediction [25,26]. Statistical tests and plots were performed by using SigmaPlot v.11.0.

3. Results

Quinaldehyde o-nitrobenzoylhydrazone was readily synthesized via the condensation reaction between quinaldehyde and o-nitrobenzhydrazide in ethanol (Scheme 1).
The title compound crystallizes in the monoclinic space group P21/c, with four molecules per unit cell (Supplementary Tables S3–S5). The asymmetric unit contains one molecule of the hydrazone QN, as shown in Figure 2. All bond lengths and angles are within their expected ranges (Supplementary Table S6), with an exception for the C1-C2 bond, whose length, at 1.465(3) Å, is shorter than typical σ-bonds and is longer than typical aromatic bonds. This deviation is likely due to the C1 participation in an extended delocalized π-bonding, which involves the quinoline ring system, the C1-N2 azomethine π-electrons, a pair of p-electrons at the sp2-hybridized amide N3, and the C11-O1 acyl π-bond. Indeed, a portion of the QN molecule that includes the aforementioned components is flat (Supplementary Table S7), with the greatest deviation from the mean plane, among the non-hydrogen atoms, found for atom C11 at 0.223 Å. The nitrophenyl ring is at 67.31° to the quinoline plane. The configuration around the azomethine bond is trans; thus, the systematic name of the structure is (E)-2-nitro-N’-(quinolin-2-ylmethylene)benzohydrazide. The configuration around the amide bond is cis, which is uncommon and which may be stabilized by a short intramolecular contact, the C3—H3A···O2, between the electronegative nitro group and the quinoline ring (Figure 2, Supplementary Table S8).
The conventional hydrogen bonding in the crystal structure of QN is limited to just one intermolecular heteroatom contact (Supplementary Table S8) involving the hydrazide groups only and is shown in Figure 3. The hydrogen-bonding pattern consists of isolated R22(8) rings. This homodromic motif is formed by centrosymmetric dimers of QN molecules linked by the N3—H3···O1 hydrogen bonds. In addition, one short intermolecular contact, the C15—H15···O3, which satisfies the distance and directionality conditions for a potential hydrogen bond (Supplementary Table S8), may also contribute to the stability of molecular packing in the crystal. The intermolecular non-polar interactions are dominated by the aromatic ring π-π contacts between quinoline residues; the shortest of these contacts, occurring between two neighboring rings #2, is about 0.14 Å less than the sum of the Van der Waals radii (Supplementary Table S9). These interactions form a pattern of infinite stacks, propagating in the [010] direction, perpendicular to the H-bonded rings (Figure 3).
To evaluate the contributions of these and other intermolecular contacts to the energetics of the crystal lattice in QN, we calculated pairwise interaction energies for all unique contacts found in the crystal structure. The results are shown in Figure 4. It follows from these data that electrostatic interactions within the dimers and the π-π stacking are the major contributors to the packing forces in the crystal of QN. The pairwise interaction energies calculated for QN can be visualized as energy framework diagrams for the contributions of electrostatic and dispersion forces, and for the total energy. The diagrams and crystal packing are shown in Figure 4 and demonstrate that the main crystal packing forces are those that form sheets of the dimers parallel to the crystallographic plane (101) and those that keep stacks of the sheets together.
In DMSO solution, QN undergoes isomerization, as evidenced by the presence of two sets of signals, with a 2:1 signal intensity ratio, both in the proton- and carbon-13 NMR spectra (Supplementary Tables S1 and S2, Supplementary Figures S2–S4). Based on previous studies of N′-arylhydrazone stereochemistry [27,28], it is conceivable that QN dissolved in DMSO retains the E-configuration around the azomethine C1=N2 bond, but establishes an equilibrium between two conformers, namely syn- and antiperiplanar in respect to the mutual disposition of the N2 and O1 atoms, due to a slow rotation around the amide C11-N3 bond. Furthermore, relative values of chemical shifts of the amide and the azomethine protons are indicative [27] of the specific rotamers: the upfield resonances of the amide were ascribed as corresponding to the synperiplanar conformer, while the downfield signals were attributed to its antiperiplanar counterpart. For azomethine protons, the order is reversed. In the H-1 NMR spectrum of QN, the amide proton singlets are located at 12.463 ppm (major) and 12.459 ppm (minor), while the azomethine proton resonates at 8.184 ppm (major) and 8.414 ppm (minor). This observation suggests that the antiperiplanar conformation of QN existing in a crystalline state (Figure 2) dominates the equilibrium in DMSO solution as well.

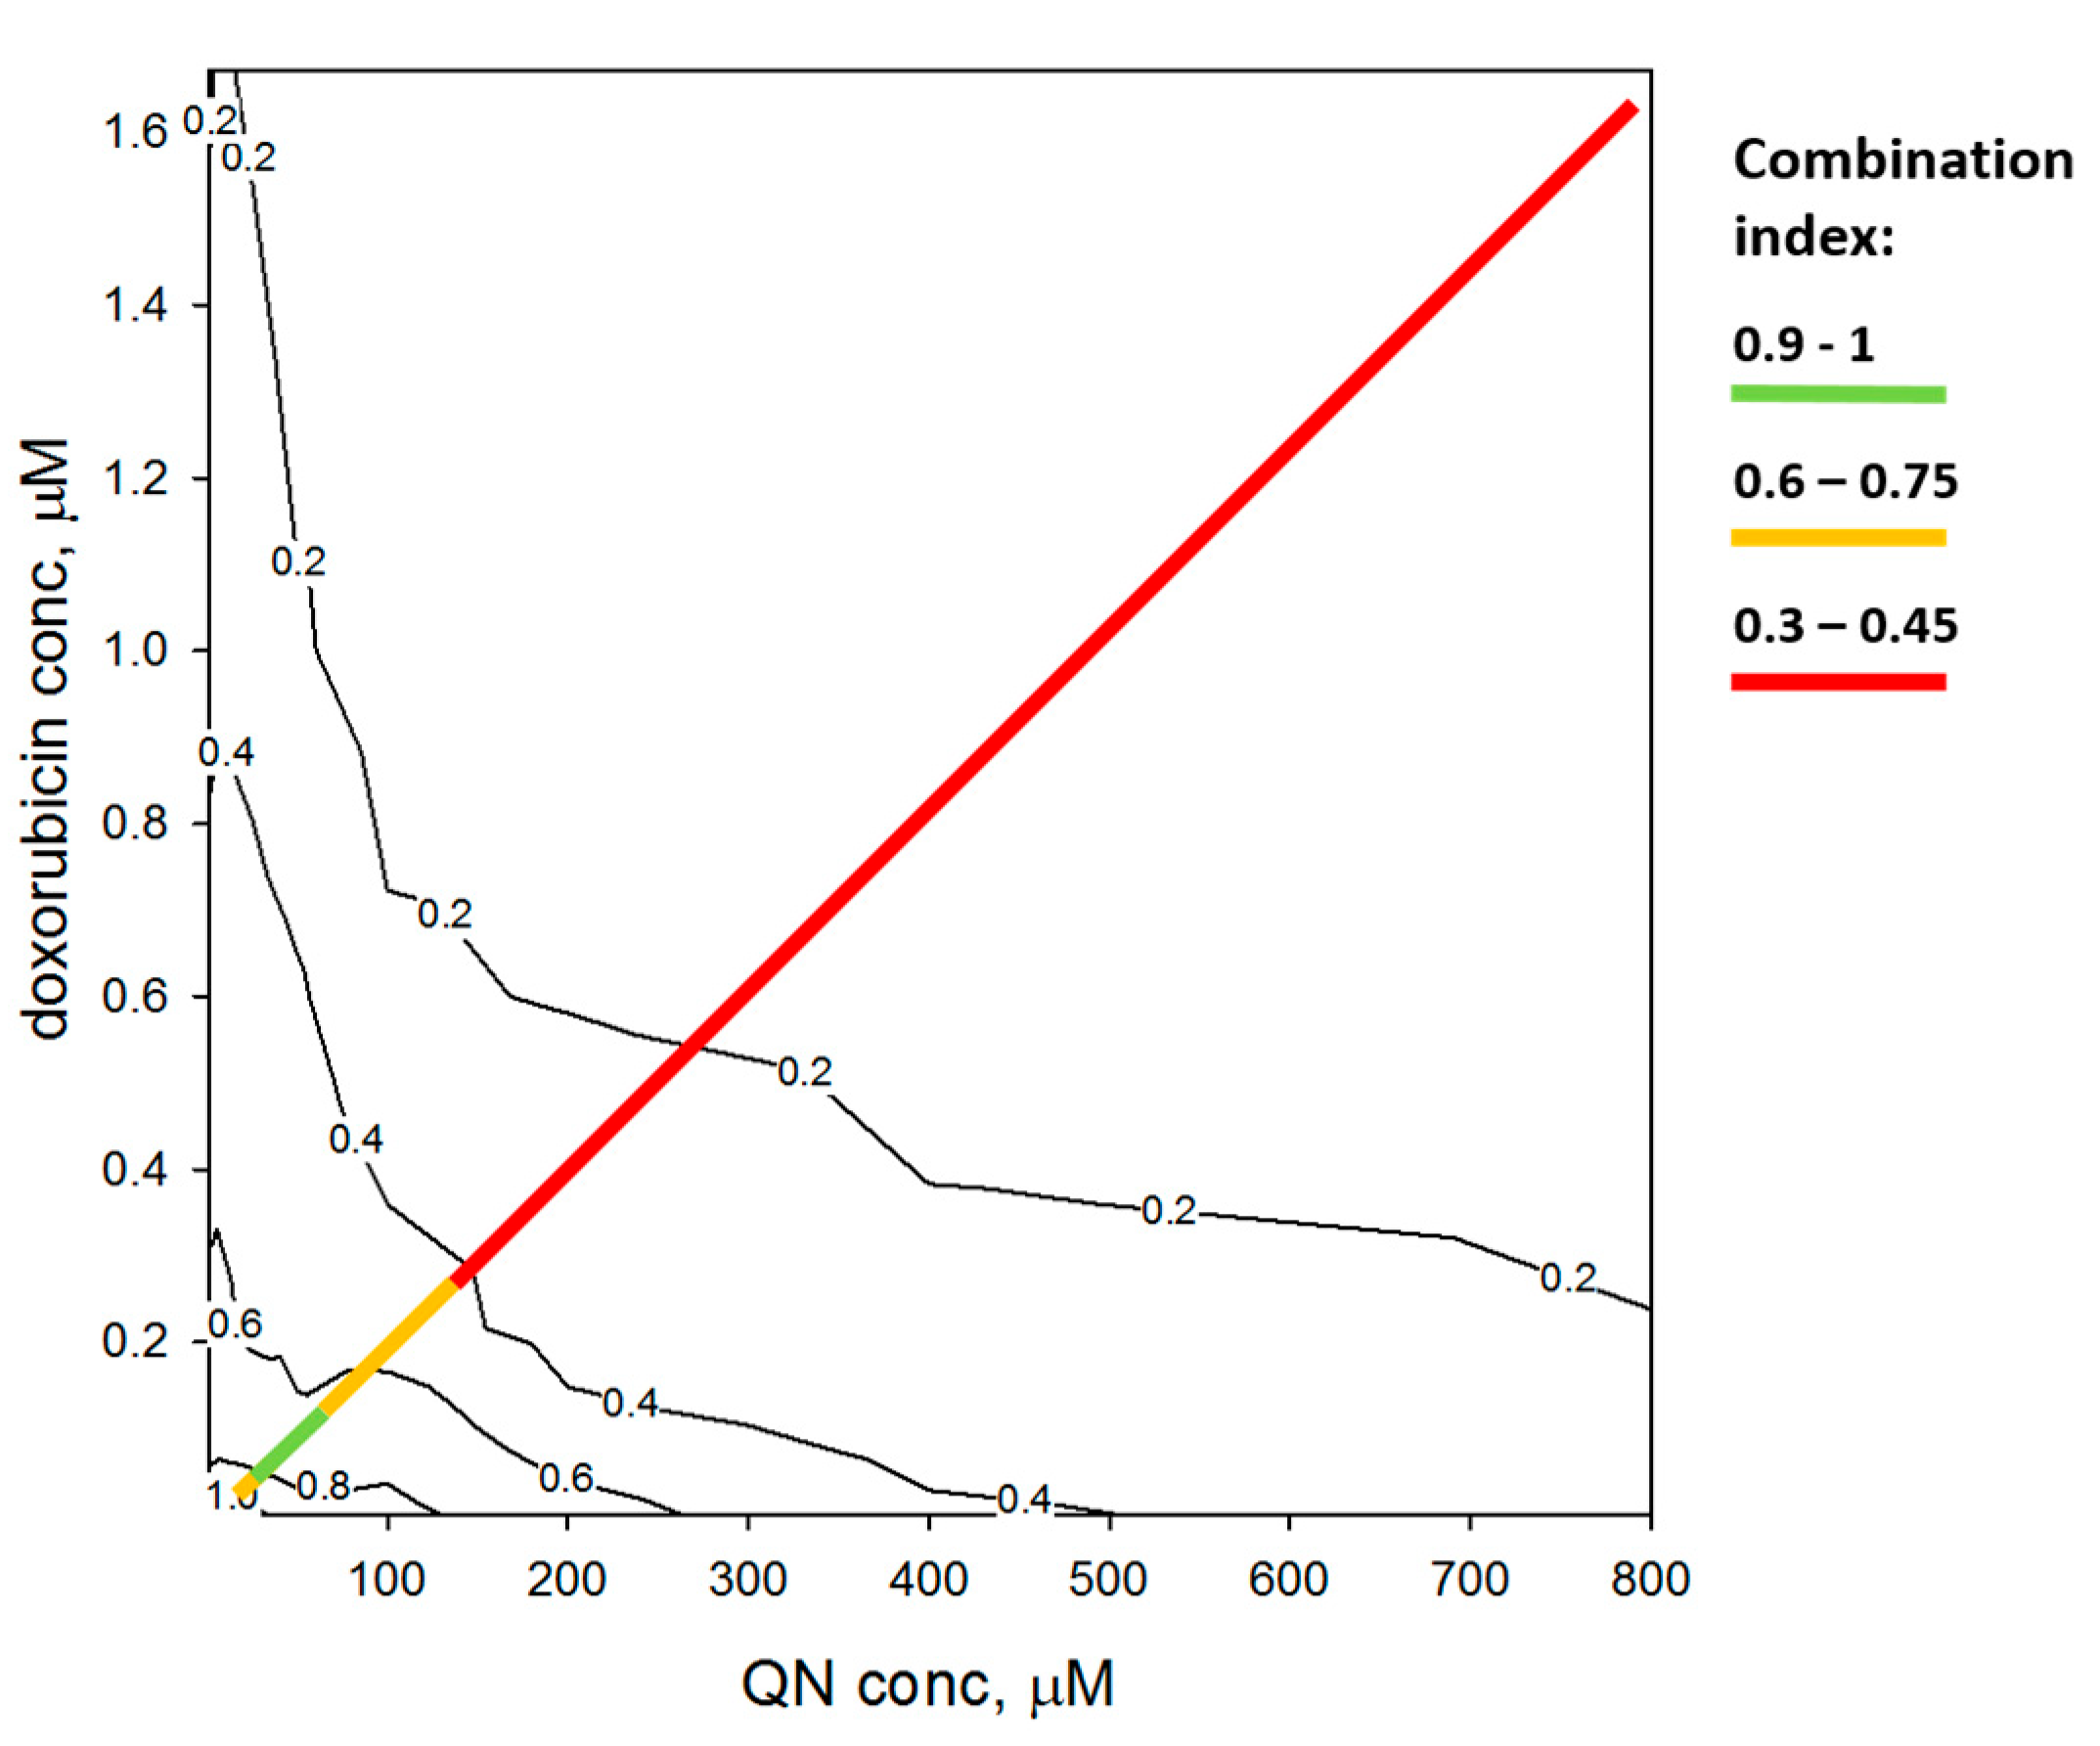
Interactions of QN and Cytotoxic Chemotherapeutic Agents in HepG2 Cells

The initial evaluation of QN cytotoxicity in the hepatoblastoma cell line HepG2 revealed that this compound can inhibit cell proliferation significantly, over 10%, in the range of concentrations exceeding 100 μM, as shown in Figure 5. We next questioned whether this hydrazone could sensitize HepG2 to cytotoxic drugs approved for hepatoblastoma, namely, doxorubicin, vinblastine, cisplatin, carboplatin, and 5-fluorouracil. Three out of five agents from this list showed a clear interaction with QN, so we have expanded the number of tested drugs to seventeen, including an extended set of topoisomerase inhibitors and sorafenib, which is the first-line chemotherapeutic drug for hepatocellular carcinoma. Experimental dose–response curves recorded for treatments of the cells with individual drugs and the drug combinations with 50 μM of QN are shown in Figure 5 and Supplementary Figures S5–S8. Based on these data, we determined IC50 values for the individual agents and calculated the dose reduction indexes for the combinations, which are summarized in Table 1. It follows from these experiments that QN sensitized HepG2 cells to most of the tested agents, with moderate DRI (arbitrarily set in the 1.9–4.4 range) obtained for nine agents, low DRI (1.4–1.7) observed for three agents, and no sensitization by QN (DRI < 1.3) found for five drugs, including cisplatin and 5-fluorouracil.
In addition to the drug combination studies, where the dose of QN was fixed at a non-toxic 50 μM, we performed a checkerboard experiment, with the doses of both doxorubicin and QN being varied. This experiment allowed us to probe whether QN, at cytotoxic concentrations, could interact with doxorubicin synergistically. Specifically, we built isobolographic curves, shown in Figure 6, which are concave towards the origin point and thus suggest a synergistic interaction between doxorubicin and QN. To quantify the synergism, we calculated the Combination Index (CI) based on the dose–effect analysis empowered by the CalcuSyn v.2 software [29]. It follows from the analysis that the synergistic interaction between doxorubicin and QN is dose-dependent and significantly increases when the dose–effect (inhibition of the cell proliferation) of the drug combination exceeds 50%, as illustrated in Figure 6.

4. Discussion

Hydrazone is a useful structure that is widely employed in medicinal chemistry. Dozens of clinical and experimental drugs contain a hydrazone unit, and hundreds more have demonstrated interesting biological activities in the lab [30]. Although falling short of matching the potential of “click” chemistry, Schiff base formation between carbonyl and hydrazine derivatives is quantitative and provides readily attainable coupling between desirable pharmacophores, thus enabling the assembly of combinatorial and dynamic libraries [16,31]. Indeed, our interest in the structure and bioactivity of QN was inspired by preliminary data obtained as a result of running a small combinatorial library against doxorubicin-treated HepG2.
Although this small study did not aim to unveil the molecular mechanism(s) of QN’s potentiation of doxorubicin and other chemotherapeuticals, the literature provides a few insights on the matter. For instance, several quinoline hydrazones have shown low-to-submicromolar cytotoxicity against HepG2, which was attributed to the inhibitory potential of these structures against epidermal growth factor receptor (EGFR) activity [32]. EGFR is a tyrosine kinase implicated in tumorigenesis and, along with a number of other kinases, in the intrinsic drug resistance of hepatic cancer cells [33]. As a matter of fact, several tyrosine kinase inhibitors built around the quinoline core, such as lenvatinib (multi-kinase inhibitor), cabozantinib (multi-kinase inhibitor), bosutinib, and neratinib (HER1/2/4 inhibitor), have been recently approved for targeting cancer therapies. Using the online server SwissTargetPrediction, we evaluated probabilities for QN to inhibit pharmacologically significant proteins. As illustrated in Figure 7, kinases were predicted to be more likely targets for the QN structure.
Additionally, we evaluated the bioavailability and other ADME parameters for QN and found that this molecule is expected to possess pharmacokinetic properties favorable for drug development (Figure 7, Table 2).

5. Conclusions

In conclusion, quinaldehyde o-nitrobenzoylhydrazone is a novel structure whose crystal structure is dominated by π-π stacking, with the total lattice energy estimated to be −225.7 kJ/mol. The structure is conformationally unstable and undergoes the cis/trans isomerization around the amide bond in solution. In vitro, QN demonstrated the ability to sensitize a hepatoblastoma cancer cell line to 13 out of 17 tested common chemotherapeutic agents, with the maximum effect, at DRI = 4.4, observed for its combination with vincristine and the synergistic interaction, at CI = 0.3, demonstrated for its combination with doxorubicin. The compound is likely to target kinases and to have favorable ADME parameters. It may serve as a hit structure for further drug development.

Supplementary Materials

The following supporting information can be downloaded at: https://www.mdpi.com/article/10.3390/compounds5030024/s1, Table S1: Tentative assignments of resonances in a H-1 NMR spectrum of QN; Table S2: Tentative assignments of resonances in a C-13 NMR spectrum of QN; Table S3: Details of X-ray diffraction experiment for QN; Table S4: Fractional atomic coordinates and isotropic or equivalent isotropic displacement parameters for QN; Table S5: Atomic displacement parameters for QN; Table S6: Bond distances and angles for QN; Table S7: Torsion angles for QN; Table S8: Hydrogen bond geometry for QN; Table S9: π-π stacking geometry for QN; Figure S1: ESI-MS of QN; Figures S2 and S3: H-1 NMR spectrum of QN; Figure S4: C-13 NMR spectrum of QN; Figures S5–S8: Proliferation of HepG2 cells treated with anti-cancer drugs alone or in combination with 50 μM of QN.

Author Contributions

Conceptualization, V.V.M. and T.P.M.; methodology, chemical synthesis, V.V.M.; structural data collection and curation, S.P.K.; biological data collection and analysis, V.V.M.; writing—original draft preparation, V.V.M.; review and editing, S.P.K. and T.P.M.; project administration and funding acquisition, T.P.M. All authors have read and agreed to the published version of the manuscript.

Funding

This research was funded, in part, by the University of Missouri Experiment Station Chemical Laboratories and by the USDA National Institute of Food and Agriculture, Hatch project 1023929.

Data Availability Statement

Supporting data are included in the Supplementary Information. The complete crystallographic data for the structural analysis have been deposited in the Cambridge Crystallographic Data Centre, CCDC #2359763. Copies of this information may be obtained free of charge from the Director, Cambridge Crystallographic Data Centre, 12 Union Road, Cambridge, CB2 1EZ, UK (fax: +44-1223-336033, e-mail: depos-it@ccdc.cam.ac.uk, or via: www.ccdc.cam.ac.uk). All other data are available from the corresponding author upon reasonable request.

Acknowledgments

The authors thank Deborah L. Chance and Shaokai Jiang for their help with obtaining the MS and NMR spectra.

Conflicts of Interest

The authors declare no conflicts of interest.

References

  1. Bray, F.; Laversanne, M.; Sung, H.; Ferlay, J.; Siegel, R.L.; Soerjomataram, I.; Jemal, A. Global cancer statistics 2022: GLOBOCAN estimates of incidence and mortality worldwide for 36 cancers in 185 countries. CA Cancer J. Clin. 2024, 74, 229–263. [Google Scholar] [CrossRef] [PubMed]
  2. Tan, E.Y.; Danpanichkul, P.; Yong, J.N.; Yu, Z.; Tan, D.J.; Lim, W.H.; Koh, B.; Lim, R.Y.; Tham, E.K.; Mitra, K.; et al. Liver cancer in 2021: Global burden of disease study. J. Hepatol. 2025, 82, 851–860. [Google Scholar] [CrossRef]
  3. Yang, C.; Zhang, H.; Zhang, L.; Zhu, A.X.; Bernards, R.; Qin, W.; Wang, C. Evolving therapeutic landscape of advanced hepatocellular carcinoma. Nat. Rev. Gastroenterol. Hepatol. 2023, 20, 203–222. [Google Scholar] [CrossRef]
  4. PDQ Pediatric Treatment Editorial Board. Childhood Liver Cancer Treatment (PDQ®): Health Professional Version. In PDQ Cancer Information Summaries [Internet]; National Cancer Institute (US): Bethesda, MD, USA, 2005. Available online: https://www.ncbi.nlm.nih.gov/books/NBK65790/ (accessed on 7 June 2025).
  5. Avendaño, C.; Menéndez, J.C. Medicinal Chemistry of Anticancer Drugs, 3rd ed.; Elsevier: Amsterdam, The Netherlands, 2023; pp. 655–700. [Google Scholar]
  6. Al-Lazikani, B.; Banerji, U.; Workman, P. Combinatorial drug therapy for cancer in the post-genomic era. Nat. Biotechnol. 2012, 30, 679–692. [Google Scholar] [CrossRef] [PubMed]
  7. Vinod, B.S.; Maliekal, T.T.; Anto, R.J. Phytochemicals as chemosensitizers: From molecular mechanism to clinical significance. Antioxid. Redox Signal. 2013, 18, 1307–1348. [Google Scholar] [CrossRef] [PubMed]
  8. Verbaanderd, C.; Pantziarka, P.; Bouche, G.; Maes, H.; Schaaf Marco, B.; Agostinis, P.; Sukhatme Vikas, P.; Sukhatme, V. Repurposing Drugs in Oncology (ReDO)-chloroquine and hydroxychloroquine as anti-cancer agents. eCancer 2017, 11, 781. [Google Scholar] [CrossRef]
  9. Ferreira, P.M.P.; Ferreira, J.R.d.O.; de Sousa, R.W.R.; Bezerra, D.P.; Militão, G.C.G. Aminoquinolines as translational models for drug repurposing: Anticancer adjuvant properties and toxicokinetic-related features. J. Oncol. 2021, 2021, 3569349. [Google Scholar] [CrossRef]
  10. Zuma, N.H.; Aucamp, J.; N’Da, D.D. An update on derivatisation and repurposing of clinical nitrofuran drugs. Eur. J. Pharm. Sci. 2019, 140, 105092. [Google Scholar] [CrossRef]
  11. Lopes, M.S.; Sena, C.F.d.A.; Silva, B.L.; de Souza, C.M.; Ramos, J.P.; Cassali, G.D.; de Souza-Fagundes, E.M.; Alves, R.J.; de Oliveira, M.C.; de Oliveira, R.B. Synthesis of nitroaromatic compounds as potential anticancer agents. Anti-Cancer Agents Med. Chem. 2015, 15, 206–216. [Google Scholar] [CrossRef]
  12. Song, P.; Yao, X.; Zhong, T.; Zhang, S.; Guo, Y.; Ren, W.; Huang, D.; Duan, X.-C.; Yin, Y.-F.; Zhang, S.-S.; et al. The anti-tumor efficacy of 3-(2-nitrophenyl) propionic acid-paclitaxel (NPPA-PTX): A novel paclitaxel bioreductive prodrug. Oncotarget 2016, 7, 48467–48480. [Google Scholar] [CrossRef]
  13. Mossine, V.V.; Chopra, P.; Mawhinney, T.P. Interaction of tomato lycopene and ketosamine against rat prostate tumorigenesis. Cancer Res. 2008, 68, 4384–4391. [Google Scholar] [CrossRef] [PubMed]
  14. Mossine, V.V.; Kelley, S.P.; Mawhinney, T.P. Crystal structure of (E)-3-methoxy-N’-(1-(pyridin-2-yl)ethylidene) benzohydrazide, C15H15N3O2. Z. Kristallogr. New Crystal Struct. 2020, 235, 907–909. [Google Scholar] [CrossRef]
  15. Watanabe, K. Current chemotherapeutic approaches for hepatoblastoma. Int. J. Clin. Oncol. 2013, 18, 955–961. [Google Scholar] [CrossRef]
  16. Mossine, V.V.; Kelley, S.P.; Waters, J.K.; Mawhinney, T.P. Screening a small hydrazide-hydrazone combinatorial library for targeting the STAT3 in monocyte-macrophages with insulated reporter transposons. Med. Chem. Res. 2023, 32, 682–693. [Google Scholar] [CrossRef]
  17. Sunder, S.; Peet, N.P.; Barbuch, R.J. A reinvestigation of the cyclodesulfurization of thiosemicarbazides. J. Heterocycl. Chem. 1981, 18, 1601–1604. [Google Scholar] [CrossRef]
  18. Sheldrick, G.M. A short history of SHELX. Acta Crystallogr. 2008, A64, 112–122. [Google Scholar] [CrossRef]
  19. Sheldrick, G.M. Crystal structure refinement with SHELXL. Acta Crystallogr. 2015, C71, 3–8. [Google Scholar]
  20. Dolomanov, O.V.; Bourhis, L.J.; Gildea, R.J.; Howard, J.A.K.; Puschmann, H. OLEX2: A complete structure solution, refinement and analysis program. J. Appl. Crystallogr. 2009, 42, 339–341. [Google Scholar] [CrossRef]
  21. Macrae, C.F.; Bruno, I.J.; Chisholm, J.A.; Edgington, P.R.; McCabe, P.; Pidcock, E.; Rodriguez-Monge, L.; Taylor, R.; van de Streek, J.; Wood, P.A. Mercury CSD 2.0—New features for the visualization and investigation of crystal structures. J. Appl. Crystallogr. 2008, 41, 466–470. [Google Scholar] [CrossRef]
  22. Mossine, V.V.; Waters, J.K.; Gu, Z.; Sun, G.Y.; Mawhinney, T.P. Bidirectional responses of eight neuroinflammation-related transcriptional factors to 64 flavonoids in astrocytes with transposable insulated signaling pathway reporters. ACS Chem. Neurosci. 2022, 13, 613–623. [Google Scholar] [CrossRef]
  23. MacKenzie, C.F.; Spackman, P.R.; Jayatilaka, D.; Spackman, M.A. CrystalExplorer model energies and energy frameworks: Extension to metal coordination compounds, organic salts, solvates and open-shell systems. IUCr J. 2017, 4, 575–587. [Google Scholar] [CrossRef] [PubMed]
  24. Spackman, P.R.; Turner, M.J.; McKinnon, J.J.; Wolff, S.K.; Grimwood, D.J.; Jayatilaka, D.; Spackman, M.A. CrystalExplorer: A program for Hirshfeld surface analysis, visualization and quantitative analysis of molecular crystals. J. Appl. Crystallogr. 2021, 54, 1006–1011. [Google Scholar] [CrossRef]
  25. Daina, A.; Michielin, O.; Zoete, V. SwissADME: A free web tool to evaluate pharmacokinetics, drug-likeness and medicinal chemistry friendliness of small molecules. Sci. Rep. 2017, 7, 42717. [Google Scholar] [CrossRef] [PubMed]
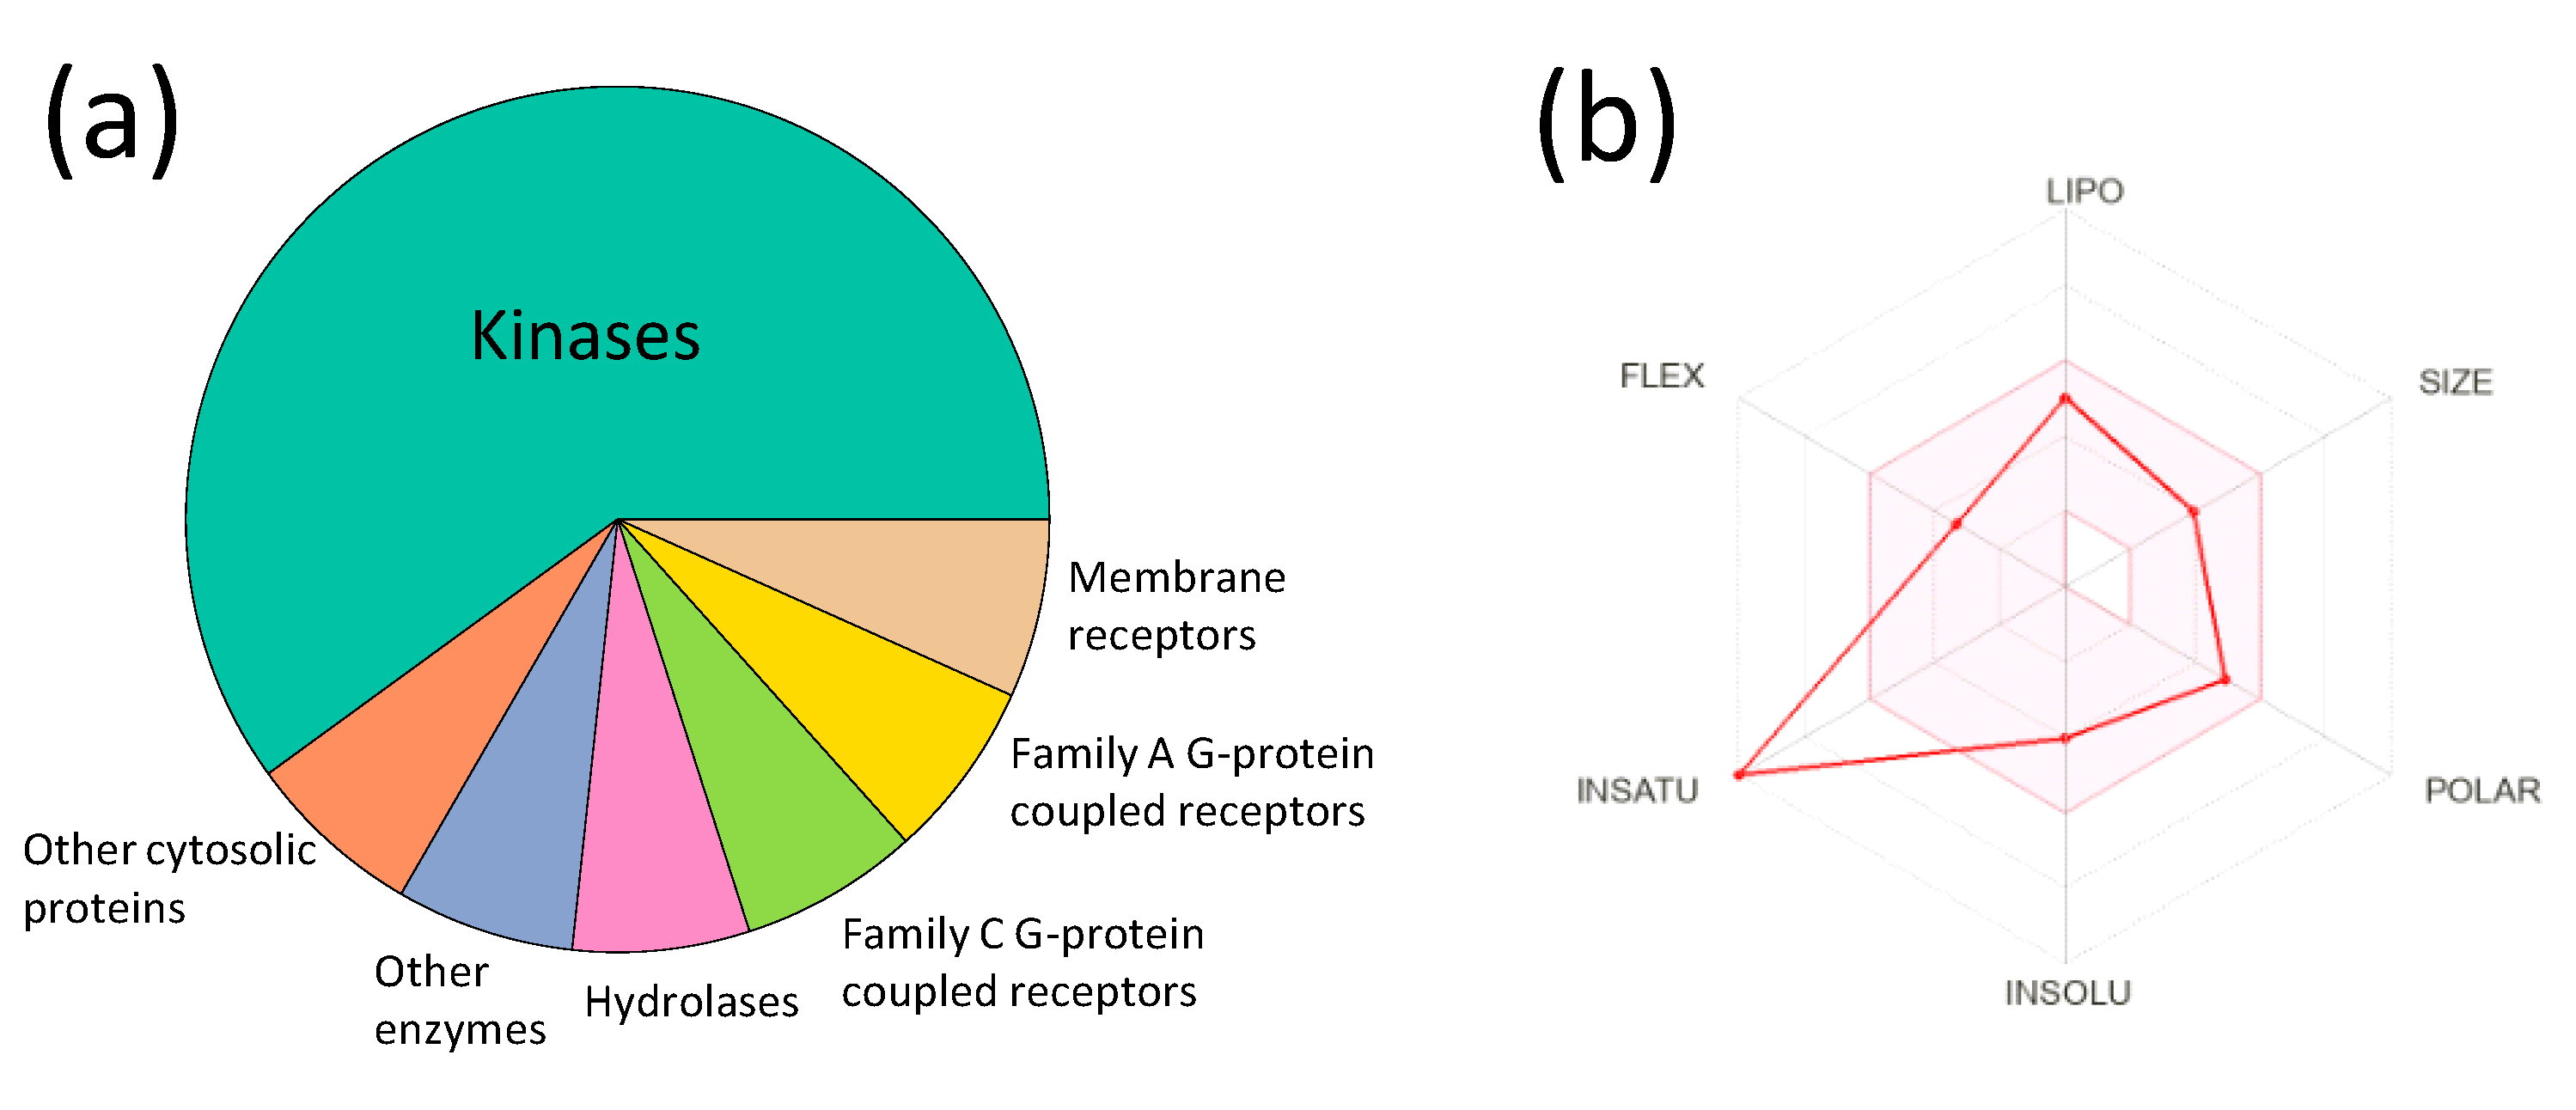
  26. Daina, A.; Michielin, O.; Zoete, V. SwissTargetPrediction: Updated data and new features for efficient prediction of protein targets of small molecules. Nucleic Acids Res. 2019, 47, W357–W364. [Google Scholar] [CrossRef]
  27. Lopes, A.B.; Miguez, E.; Kümmerle, A.E.; Rumjanek, V.M.; Fraga, C.A.M.; Barreiro, E.J. Characterization of amide bond conformers for a novel heterocyclic template of N-acylhydrazone derivatives. Molecules 2013, 18, 11683–11704. [Google Scholar] [CrossRef]
  28. Kadyan, K.; Singh, R.; Sindhu, J.; Kumar, P.; Devi, M.; Lal, S.; Kumar, A.; Singh, D.; Kumar, H. Exploring the structural versatility and dynamic behavior of acyl/aroyl hydrazones: A comprehensive review. Top. Curr. Chem. 2025, 383, 18. [Google Scholar] [CrossRef]
  29. Chou, T.-C. The median-effect principle and the combination index for quantitation of synergism and antagonism. In Synergism and Antagonism in Chemotherapy; Chou, T.-C., Rideout, D.C., Eds.; Academic Press: San Diego, CA, USA, 1991; pp. 61–102. [Google Scholar]
  30. Socea, L.-I.; Barbuceanu, S.-F.; Pahontu, E.M.; Dumitru, A.-C.; Nitulescu, G.M.; Sfetea, R.C.; Apostol, T.-V. Acylhydrazones and their biological activity: A review. Molecules 2022, 27, 8719. [Google Scholar] [CrossRef] [PubMed]
  31. Frei, P.; Pang, L.; Silbermann, M.; Eris, D.; Muehlethaler, T.; Schwardt, O.; Ernst, B. Target-directed dynamic combinatorial chemistry: A study on potentials and pitfalls as exemplified on a bacterial target. Chem. Eur. J. 2017, 23, 11570–11577. [Google Scholar] [CrossRef]
  32. Elrayess, R.; Darwish, K.M.; Nafie, M.S.; El-Sayyed, G.S.; Said, M.M.; Yassen, A.S.A. Quinoline-hydrazone hybrids as dual mutant EGFR inhibitors with promising metallic nanoparticle loading: Rationalized design, synthesis, biological investigation and computational studies. New J. Chem. 2022, 46, 18207–18232. [Google Scholar] [CrossRef]
  33. Ezzoukhry, Z.; Louandre, C.; Trecherel, E.; Godin, C.; Chauffert, B.; Dupont, S.; Diouf, M.; Barbare, J.-C.; Maziere, J.-C.; Galmiche, A. EGFR activation is a potential determinant of primary resistance of hepatocellular carcinoma cells to sorafenib. Int. J. Cancer 2012, 131, 2961–2969. [Google Scholar] [CrossRef]
Figure 1. Natural metabolite quinine and examples of synthetic quinoline derivatives—clinical drugs.
Compounds 05 00024 g001
Scheme 1. Molecular and crystal structure of QN.
Compounds 05 00024 sch001
Figure 2. Atom numbering and displacement ellipsoids at the 50% probability level for quinaldehyde o-nitrobenzoylhydrazone. An intramolecular C—H···O interaction is shown as a dashed line.
Compounds 05 00024 g002
Figure 3. (a) Ring numbering and formation of H-bonded homodimers for quinaldehyde o-nitrobenzoylhydrazone. (b) Molecular packing of QN. Hydrogen bonds are shown as cyan dotted lines. Crystallographic axes’ color codes: a—red; b—green; c—blue.
Compounds 05 00024 g003
Figure 4. Interaction energies in the crystal structure of QN. (a) A view of the interactions between a central molecule, shown as its Hirshfeld surface, and 14 molecules that contact the central molecule. (b) Calculated energies (electrostatic, polarization, dispersion, repulsion, and total) of pairwise interactions between the central molecule and those encoded by respective colors. Energy frameworks for (c) electrostatic and (d) dispersion contributions to the total pairwise interaction energies in QN. The cylinders link molecular centroids, and the cylinder thickness is proportional to the magnitude of the energies. For clarity, the cylinders corresponding to energies < 6 kJ/mol are not shown.
Compounds 05 00024 g004
Figure 5. Proliferation, expressed as GFP transcriptional activity, of HepG2 cells treated for 48 h with (a) quinaldehyde o-nitrobenzoylhydrazone (QN) alone, (b) carboplatin alone (blue dose–response curve), or in combination with 50 μM of QN (red dose–response curve). Error bars are SDs for n = 3.
Compounds 05 00024 g005
Figure 6. Analysis of the cytotoxic interactions between doxorubicin and QN in HepG2 cells exposed to doxorubicin/QN combinations for 48 h. The numbers on the isobolographic curves correspond to the fractions of surviving cells. The color pattern on the diagonal bar encodes approximate regions of weak-to-no interaction (green), moderate synergism (yellow), or strong synergism (red) based on the calculated Combination Index values.
Compounds 05 00024 g006
Figure 7. (a) The classes of the top 15 potential targets for QN, as predicted by SwissTargetPrediction. (b) Bioavailability radar predicted by SwissADME for QN, with the pink zone signifying the optimal range of molecular properties. The red line connects individual molecular property scores.
Compounds 05 00024 g007
Table 1. Inhibition of HepG2 proliferation 1 by anti-cancer agents alone and in combination with 50 μM of QN.
AgentMechanismSingle AgentCombination with QN
IC50, μMrIC50, μMrDRI
Doxorubicintopoisomerase inh0.7920.9600.4100.9611.9
Daunorubicintopoisomerase inh0.6500.9540.3190.9662.0
Epirubicintopoisomerase inh3.000.9801.160.9412.6
Idarubicintopoisomerase inh0.2130.9350.1550.9531.4
Mitoxanthronetopoisomerase inh0.8840.9340.7180.9361.2
Topotecantopoisomerase inh4.470.9472.270.9672.0
Etoposidetopoisomerase inh1320.98079.70.9591.7
Actinomycin Dtopoisomerase inh0.0150.9900.00460.8443.3
Docetaxelmicrotubule stabil0.1450.9530.0700.9092.1
Vincristinemicrotubule inh1.800.9000.4060.9054.4
CisplatinDNA crosslink1.590.9542.410.9410.7
CarboplatinDNA crosslink1320.96265.60.9422.0
OxaliplatinDNA crosslink17.40.98224.30.9750.7
Mitomycin CDNA crosslink4.260.9932.230.9871.9
5-Fluorouracilantimetabolite1370.9291400.9831.0
Sorafenibmulti-kinase inh13.20.8767.550.9481.7
VorinostatHDAC inhibitor4.770.9964.420.9011.1
QN 4180.998
1 Measured for 48 h exposure.
Table 2. Some ADME parameters and drug-likeness predicted for QN.
ParameterValue
GI absorptionHigh
BBB permeabilityLow
P-glycoprotein substrateNo
CYP1A2 inhibitorYes
CYP2C19 inhibitorYes
CYP2C9 inhibitorYes
CYP2D6 inhibitorNo
CYP3A4 inhibitorNo
Log Kp (skin permeability)−5.94 cm/s
Lipinski rule violations0
PAINS alerts0
Bioavailability score0.55
Disclaimer/Publisher’s Note: The statements, opinions and data contained in all publications are solely those of the individual author(s) and contributor(s) and not of MDPI and/or the editor(s). MDPI and/or the editor(s) disclaim responsibility for any injury to people or property resulting from any ideas, methods, instructions or products referred to in the content.

