1. Introduction
The development of efficient and compact cooling devices represents a critical challenge in modern technology, particularly for applications requiring precise temperature control in confined spaces [
1]. Shape Memory Alloys (SMAs) have emerged as promising candidates for solid-state cooling applications due to their peculiar elastocaloric effect (eCE), which consists in temperature changes determined by stress-induced martensitic transformation [
2]. This phenomenon has attracted significant attention for the development of cooling solutions that avoid the use of traditional refrigerants and offer improved energy efficiency [
3]. The unique properties of SMAs that enable elastocaloric effects also make these materials valuable for various other technological applications, ranging from seismic protection systems [
4] to advanced wearable sensing technologies for physiological monitoring [
5]. The field of elastocaloric cooling has evolved rapidly in recent years, advancing from fundamental material characterization to practical device implementation. Research has demonstrated that elastocaloric refrigeration based on SMAs offers significant advantages, including high energy efficiency, zero environmental impact, and compact design potential [
6]. However, optimizing performance for practical applications requires addressing several interconnected challenges related to material response, system design, and operational parameters. Recent advances in continuous operation strategies have significantly enhanced cooling device feasibility. Cheng et al. [
7] developed a continuous rotating bending system for elastocaloric cooling using Ni-Ti sheets that successfully separates cold and hot areas, enabling more efficient heat exchange while avoiding reciprocal movements. Concurrently, fundamental research [
8] on buckling prevention of Ni-Ti tubes in a compressive elastocaloric regenerator has deepened our understanding of how deformation affect heat transfer during elastocaloric cycling—a critical consideration for optimizing system efficiency. These achievements build upon pioneering work in regenerative elastocaloric devices by Engelbrecht et al. [
9] and device engineering approaches by Kirsch et al. [
10].
Ni-Ti-based alloys are particularly attractive for microcooling applications due to their significant temperature changes (up to 20 K) under loading conditions [
11] and their established biocompatibility [
12]. The elastocaloric response in these materials is the result of reversible stress-induced martensitic transformation, where mechanical loading and unloading cycles result in heat release and absorption, respectively [
13].
Figure 1 illustrates this thermomechanical cycle, showing how the application and removal of mechanical stress leads to temperature changes through phase transformation, setting the basis for solid-state cooling applications.
SMAs exhibit complex thermomechanical mechanisms that significantly influence their elastocaloric performance. The behavior of these materials differs substantially from conventional cubic metals, particularly in their rate-dependent response. While rate dependence theories are well-established for conventional materials, SMAs’ unique mechanisms, involving both twinning and phase transformation, require specific investigation for accurate modeling.
The strain rate sensitivity of Ni-Ti alloys manifests through multiple interconnected phenomena. These rate-dependent transformation characteristics directly influence the material’s potential for elastocaloric applications. Wang et al. [
15] identified distinct deformation mechanisms across different strain rate ranges, demonstrating that both stress response and energy dissipation characteristics are fundamentally influenced by strain rate. This relationship becomes particularly evident in the material’s superelastic behavior, which is crucial for elastocaloric applications. To address this complexity, Roh [
16] developed advanced models incorporating non-constant parameters to accurately simulate the hysteresis behavior under varying strain rates.
The influence of strain rate extends beyond mechanical response to affect transformation stability and energy dissipation mechanisms. Kaup et al. [
17] demonstrated that higher strain rates significantly modify both martensitic phase stability and hysteresis behavior, with direct implications for the cyclic performance required in cooling applications. Similarly, Costanza et al. [
18] showed that temperature significantly affects the mechanical response and energy dissipation in Ni-Ti sheets, with higher temperatures resulting in increased shape recovery capability and hysteresis area, suggesting an important interrelation between transformation kinetics and temperature-rate effects. These effects are further complicated by material processing conditions, as shown by Islam et al. [
19], who found that manufacturing methods significantly influence local deformation behaviors. These manufacturing-dependent characteristics fundamentally affect the material’s response to different loading rates, thereby influencing the potential cooling efficiency achievable in practical applications. Such findings are particularly relevant for optimizing material preparation for specific operating conditions.
Qian et al. [
20] developed constitutive models accounting for strain rate effects, providing valuable tools for device design. Temperature dependence adds another layer of complexity, with Kreitcberg et al. [
21] demonstrating significant strain rate sensitivity at higher temperatures and lower strain rates.
This complex behavior is further evidenced by Saletti et al. [
22], who observed unexpected transformation characteristics under certain strain rate conditions, suggesting the existence of optimal operating windows for cooling applications. These observations highlight the importance of understanding and controlling strain rate effects for practical elastocaloric applications.
The studies discussed above collectively highlight the complex interplay between strain rate, mechanical response, and energy conversion efficiency—a fundamental challenge in developing commercially viable elastocaloric cooling systems. Despite significant progress, several obstacles remain, including the need to optimize thermomechanical responses across operational strain rates, enhance heat transfer dynamics, and ensure long-term cycling stability without performance degradation. While prior studies have identified distinct transformation behaviors across different strain rate regimes, a comprehensive understanding of how these variations affect elastocaloric performance specifically in sheet geometries remains limited, creating a significant knowledge gap for practical device applications.
To address these challenges, the present study investigates the strain rate dependence of mechanical response and elastocaloric performance in Ni-Ti SMAs sheets. Through systematic experimental characterization across a range of strain rates, we aim to identify optimal loading conditions for compact cooling device applications. Our approach combines mechanical testing with comprehensive statistical analysis to establish correlations between deformation parameters, energy dissipation, and material response characteristics. This investigation addresses the knowledge gap regarding strain rate effects specifically in sheet geometries, with potential implications for enhancing energy conversion efficiency in practical elastocaloric cooling systems.
Our findings demonstrate that the material’s response transitions from highly predictable behavior at low strain rates, evidenced by strong correlations between energy dissipation and mechanical work, to more complex responses at higher rates and deformation levels. The analysis reveals optimal operating windows where energy conversion efficiency can be maximized while maintaining practical cycling frequencies. These results establish guidelines for selecting optimal operating conditions in elastocaloric cooling applications, considering the trade-offs between energy efficiency, transformation stability, and cycling frequency. The identified correlations between mechanical parameters and strain rate provide a framework for designing more efficient compact cooling systems.
2. Materials and Methods
In order to establish the optimal conditions for elastocaloric cooling applications, a systematic investigation of strain rate effects on Ni-Ti SMA sheets was conducted. The experimental methodology was designed to quantitatively evaluate the material’s response across strain rates ranging from to , focusing on the relationship between deformation parameters, energy dissipation, and mechanical work. The investigation covered material characterization, standardized specimen preparation, systematic mechanical testing at multiple deformation levels, and detailed statistical analysis. Particular attention was paid to maintaining consistent experimental conditions to ensure reproducibility and reliability of the results, enabling robust correlation analysis between strain rate and material response parameters.
2.1. Material Caracteristics
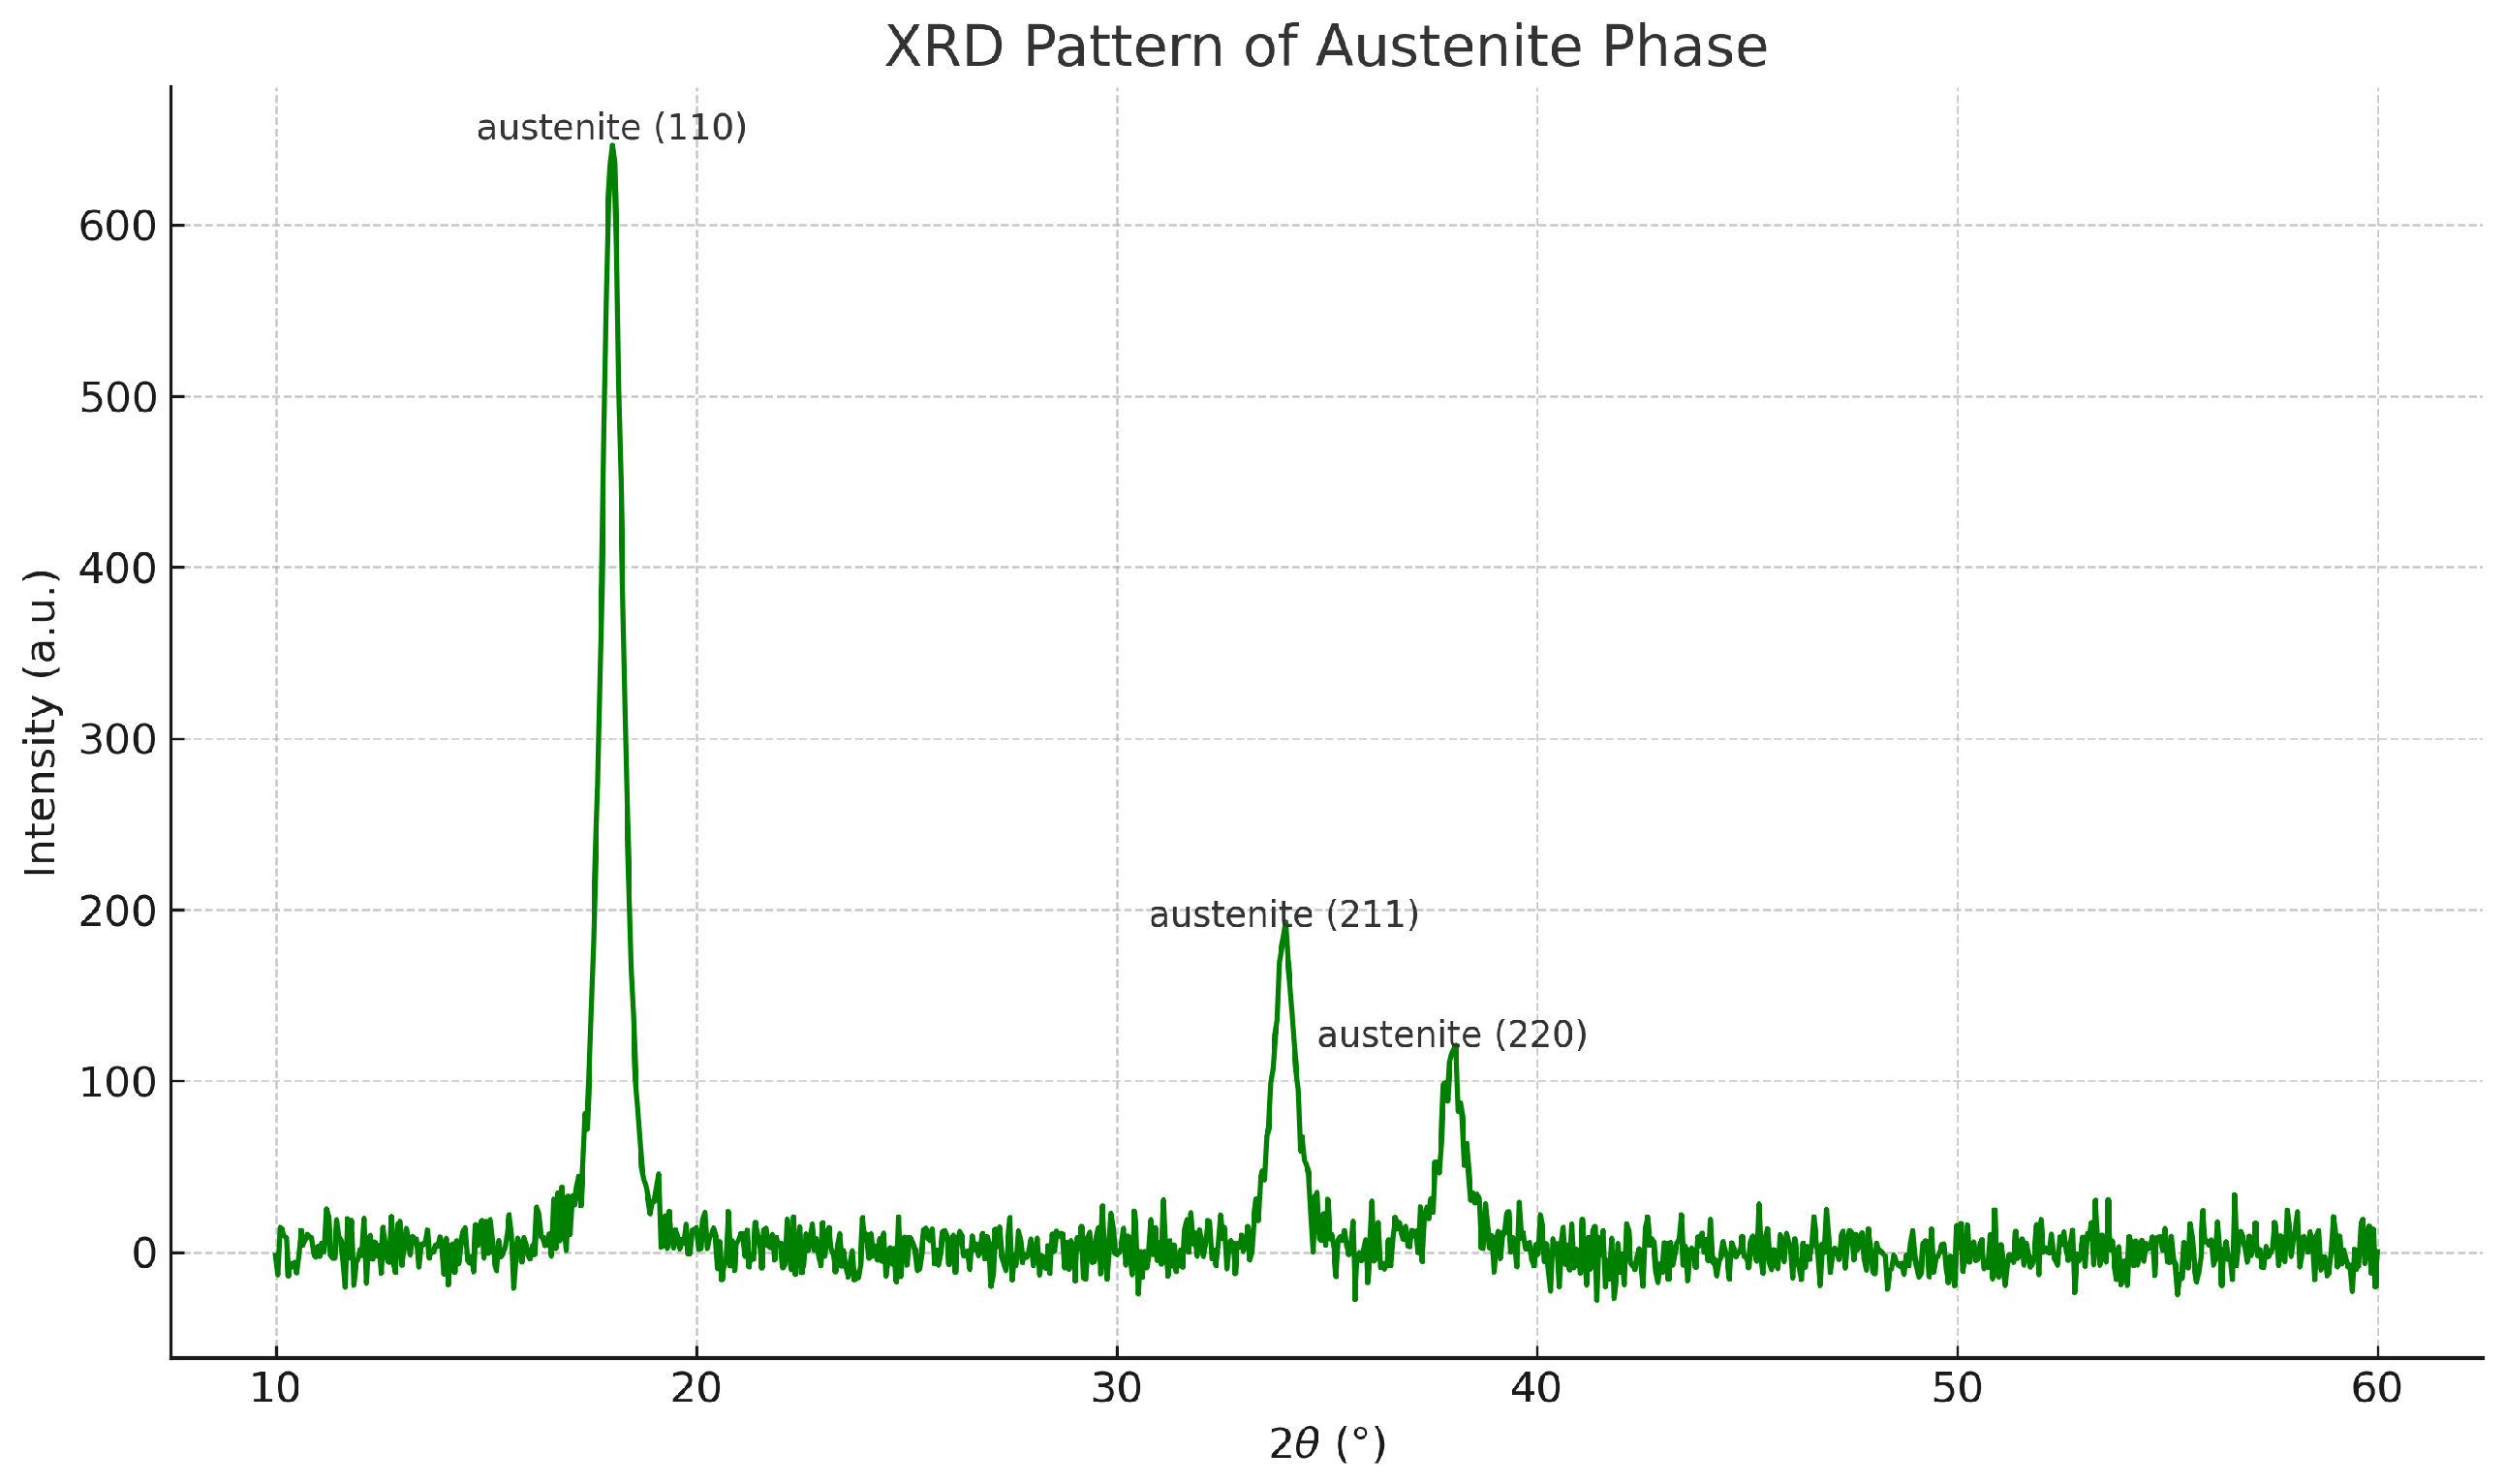
The experimental investigation utilized commercial Ni-Ti superelastic sheets, which underwent mechanical characterization in their as-received condition. While the exact chemical composition was not provided by the manufacturer, the material was specified as a standard superelastic Ni-Ti alloy optimized for shape memory applications. The alloy demonstrated characteristic phase transformation behavior, with the martensite phase manifesting below −10 °C and an Austenite Finish temperature () of 5 °C ± 10 °C, according to the specifications provided by the manufacturer. These transformation temperatures ensure that, at ambient temperature and in the absence of an applied load, the material remains in the austenitic phase, providing optimal conditions for superelastic behavior and elastocaloric response.
X-ray diffraction (XRD) analysis using Mo-Kα radiation (
Å) confirmed the presence of the B2 austenitic phase with a mean lattice parameter of 3.001 Å ± 0.003 Å. The diffraction pattern, shown in
Figure 2, exhibited characteristic peaks corresponding to the (110), (211), and (220) planes of the austenitic structure, validating the material’s phase composition.
Vickers microhardness measurements were performed in accordance with UNI EN ISO 6507-1:2023 [
23] standards. The testing protocol incorporated three distinct load levels (300 gf, 500 gf, and 1000 gf), with a standardized load application time of 10 s. For statistical reliability, three series of indentations were executed at each load level, and the diagonal measurements of each indentation were independently assessed twice to minimize measurement uncertainty and potential systematic errors.
The initial characterization of the as-received material showed an average Vickers hardness of 368.1 HV with a mean standard deviation of 12.6 HV.
2.2. Specimen Preparation and Shape Setting Heat Treatment
Test specimens had a width of 20 mm, thickness of 1 mm, height of 100 mm, as shown in
Figure 3. For experimental tests, a gauge length of 65 mm was employed.
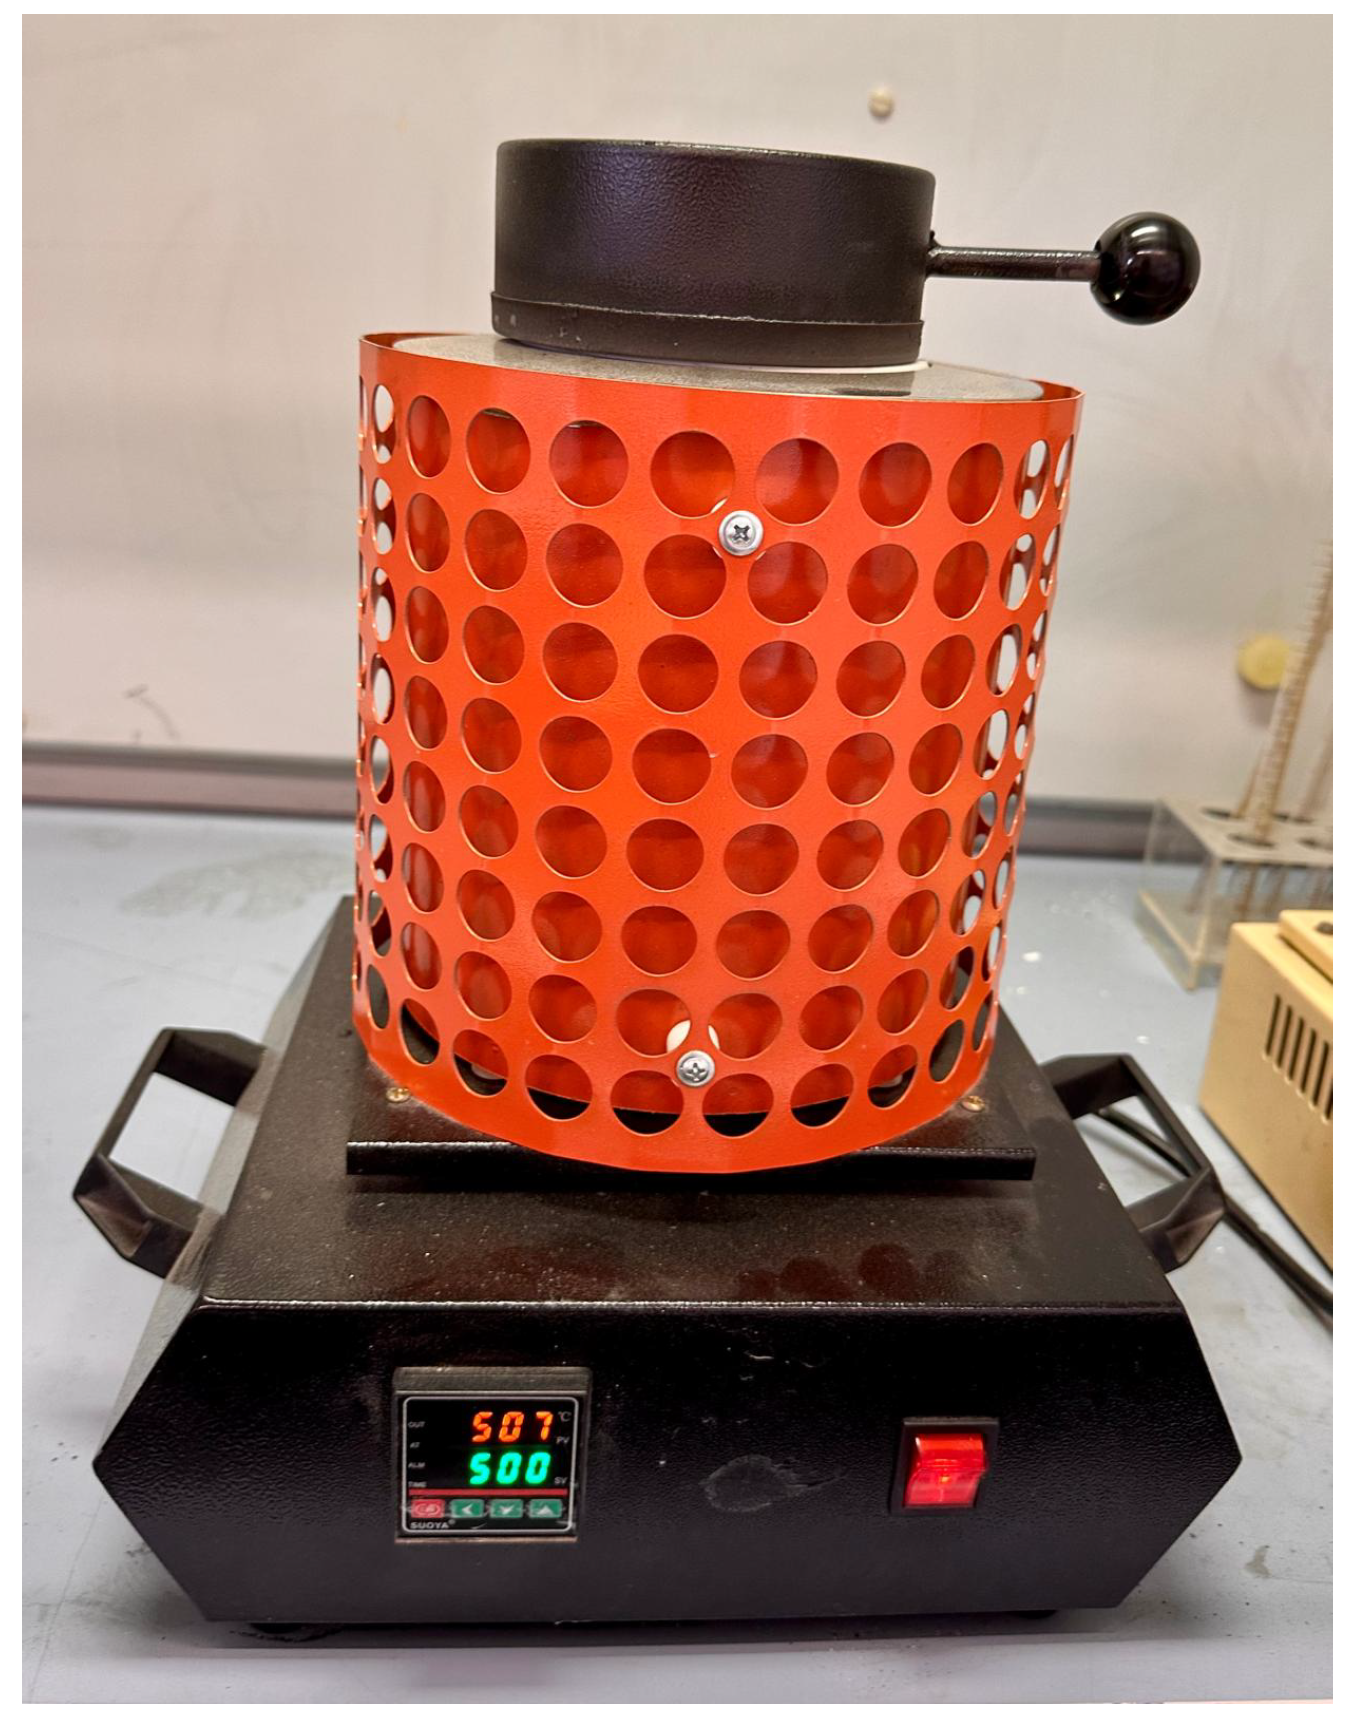
Prior to mechanical testing, all specimens underwent a standardized Shape Setting heat treatment protocol. This process involved heating the material to 500 °C, maintaining this temperature for 30 min, followed by water quenching to room temperature.
Figure 4 shows a representative Ni-Ti specimen before and after the Shape Setting heat treatment, and the characteristic surface appearance resulting from the heat treatment process.
Figure 5 displays the furnace employed to perform the Shape Setting treatment.
Comprehensive Vickers microhardness measurements were conducted after the Shape Setting to evaluate its impact on mechanical properties, following the UNI EN ISO 6507-1: 2023 [
23] testing protocol previously described.
The Shape Setting induced significant changes in the material’s mechanical properties, with the average Vickers hardness decreasing from 368.1 HV to 294.8 HV, representing approximately a 20% reduction. This substantial change in hardness was accompanied by a marked improvement in microstructural homogeneity, evidenced by the reduction in standard deviation from 12.6 HV to 5.1 HV. The load-dependent analysis revealed distinct patterns in both pre- and post-treatment conditions. At the lowest load (300 gf), measurements showed consistent values but limited representation of bulk properties due to smaller indentation sizes. Higher loads (500 gf and 1000 gf) provided more comprehensive material response assessment.
The observed reduction in hardness and improved uniformity can be attributed to structural relaxation mechanisms and microstructural reorganization during the Shape Setting process. These modifications, characteristic of SMA, resulted in decreased surface resistance while enhancing the material’s structural homogeneity. Such changes are particularly beneficial for applications requiring consistent and predictable mechanical responses, making the heat-treated material well-suited for elastocaloric applications where reliable transformation behavior is essential.
2.3. Experimental Setup
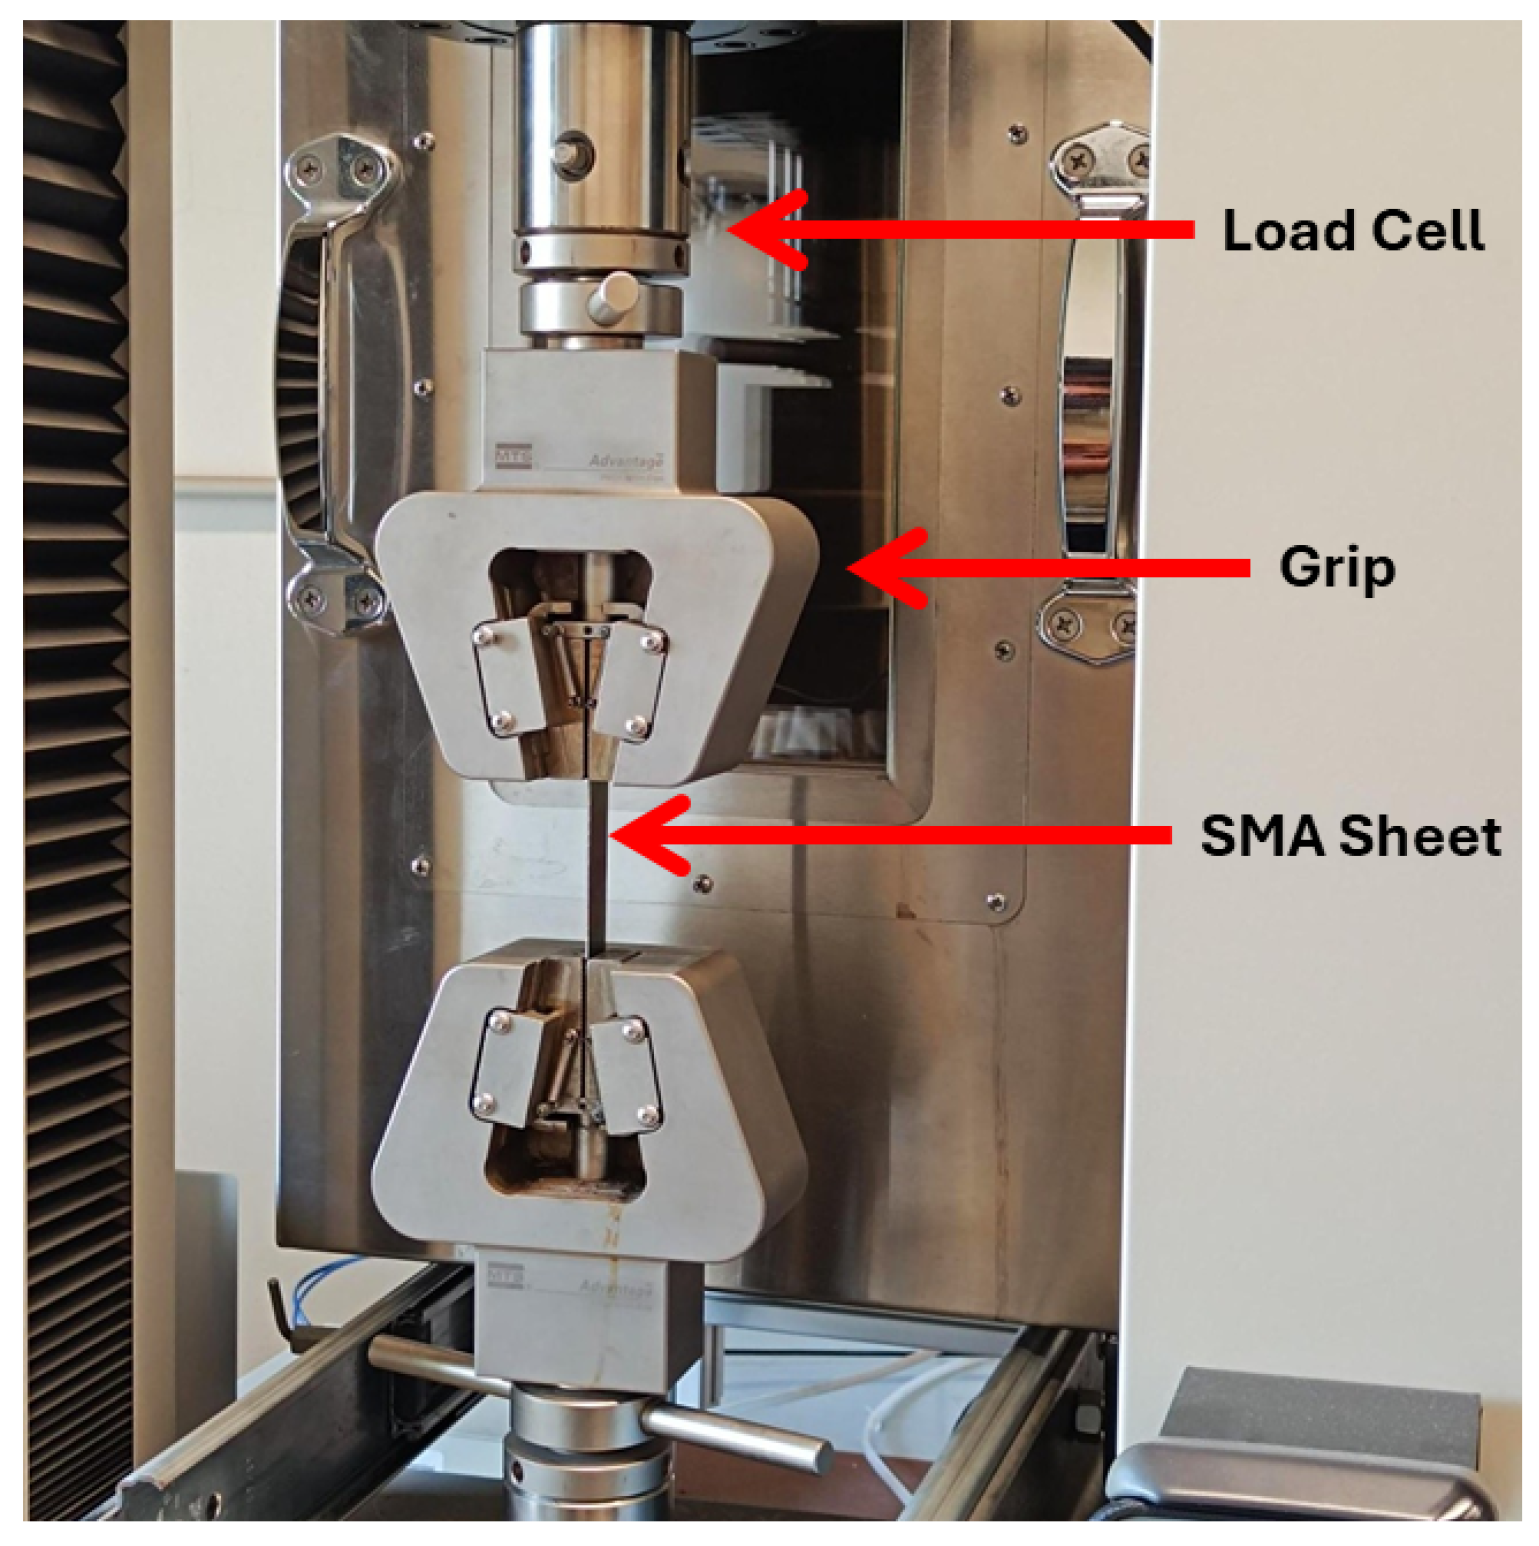
The mechanical characterization was performed using a universal testing machine equipped with a 50 kN load cell, enabling control and measurement of loading conditions.
Figure 6 shows the experimental setup used for all tests.
2.4. Testing Parameters and Protocol
A comprehensive test matrix was designed to investigate the strain rate dependence of the elastocaloric response. The experimental campaign consisted of a series of tensile tests, identified by a progressive number N ranging from 1 to 8, where each N corresponds to a specific target deformation level. Each deformation level was investigated through tests performed at four different crosshead speeds ( = 1 mm/min, = 6 mm/min, = 12 mm/min, and = 24 mm/min), corresponding to strain rates of , , , and respectively.
To achieve comparable deformation conditions across different strain rates, the testing time at each speed was adjusted to maintain the same total deformation. This was accomplished by scaling the testing time inversely proportional to the crosshead speed. For instance, to achieve a specific total deformation, a test performed at 6 mm/min required one-sixth of the time needed for the same test at 1 mm/min. This approach ensured that the total displacement, and consequently the total strain, remained constant across all testing speeds for each test number N.
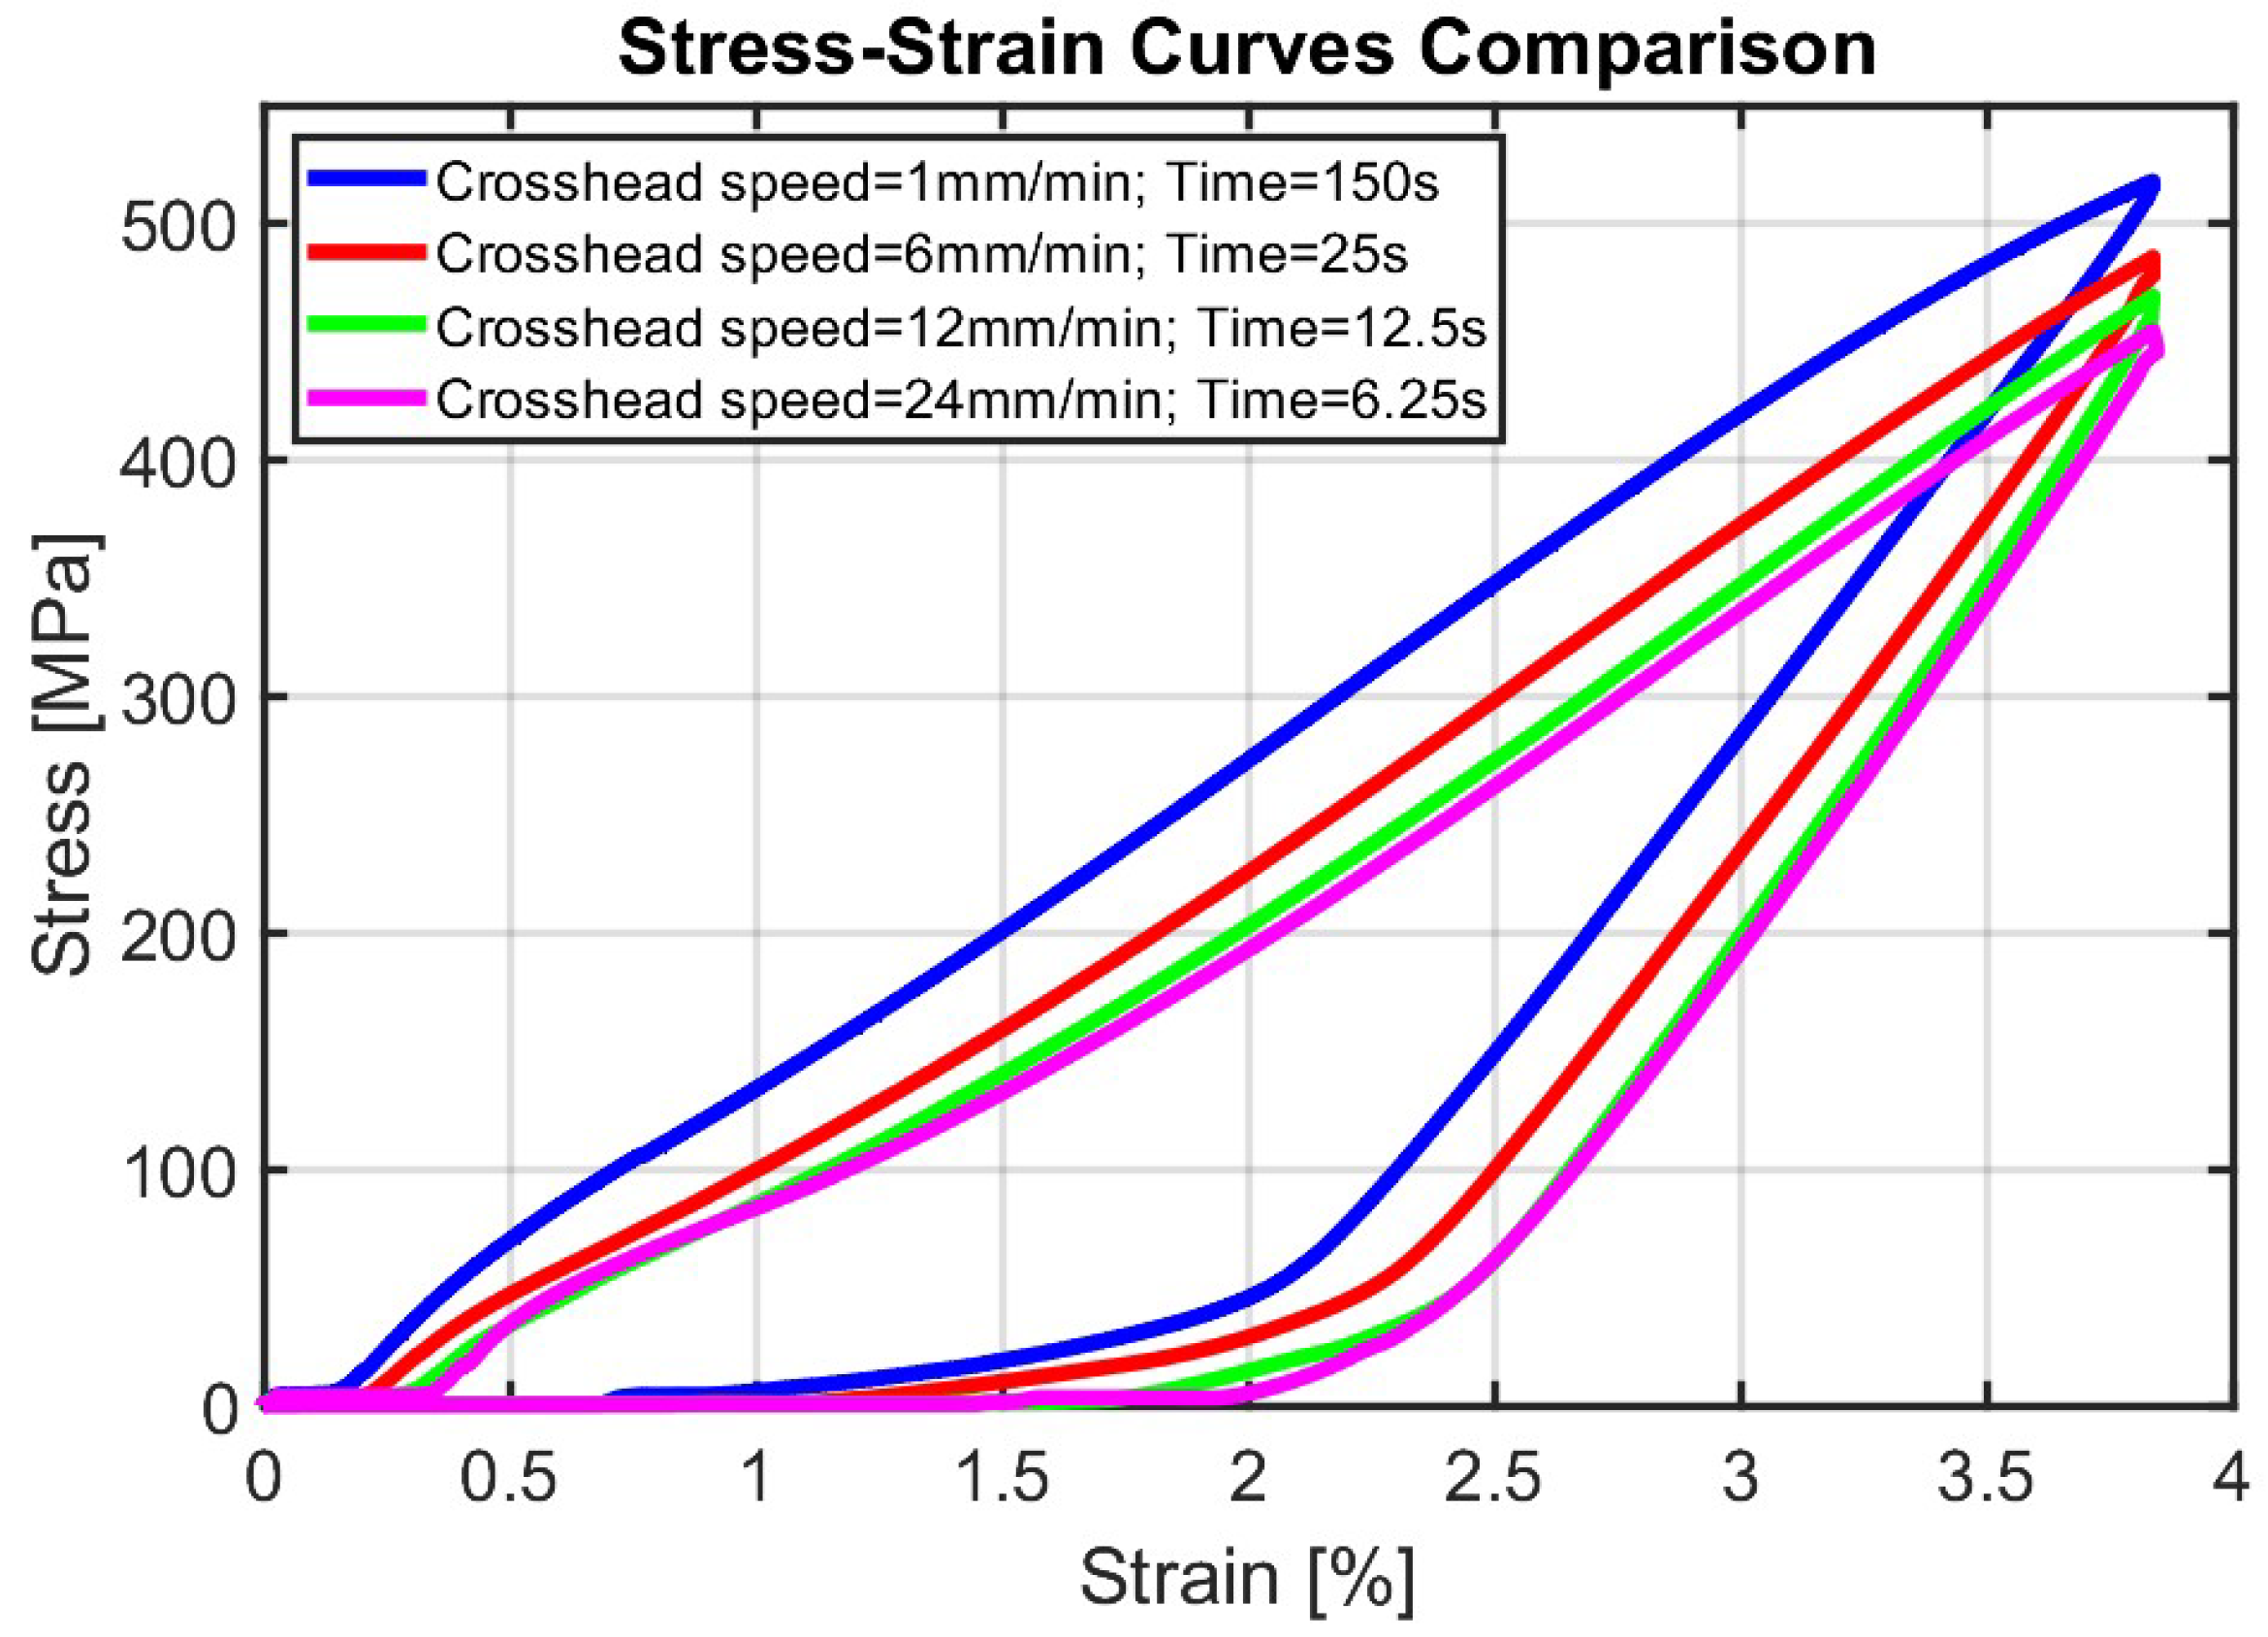
Taking test
N = 8 as an example, in order to reach a total strain of 3.84%, the testing times were proportionally adjusted: 150 s at 1 mm/min, 25 s at 6 mm/min, 12.5 s at 12 mm/min, and 6.25 s at 24 mm/min. This systematic approach, detailed in
Table 1, allows for direct comparison of the material’s rate-dependent response while maintaining consistent total deformation conditions.
Each test followed a standardized protocol, beginning with careful specimen alignment and mounting in the grips, followed by the application of the prescribed loading cycle. This testing strategy allowed for a systematic investigation of the material’s rate-dependent behavior while maintaining comparable deformation states across all testing speeds.
2.5. Data Acquisition and Processing
Force and displacement data were continuously recorded at a sampling frequency of 10 Hz using the testing machine’s integrated data acquisition system. Engineering stress values were calculated based on the initial cross-sectional area of the specimen (20 mm2).
The data analysis was performed using MATLAB R2023a (MathWorks, Natick, MA, USA). Raw force-displacement data were converted to engineering stress-strain values using the initial specimen dimensions (width = 20 mm, thickness = 1 mm, working length = 65 mm). To ensure accurate energy calculations, noise in the data was minimized using a moving average filter with a 5-point window.
2.6. Elastocaloric Performance Analysis Method
The optimization of elastocaloric performance involves balancing three critical parameters: adiabatic temperature change (
), energy dissipation (
), and energy conversion efficiency (
). During a loading-unloading cycle, the mechanical energy input undergoes two processes: conversion to thermal energy and partial dissipation through irreversible mechanisms. This dissipated energy, measured by the area within the stress-strain hysteresis loop (
), plays a dual role: while it contributes to temperature changes, it simultaneously reduces the overall process efficiency [
1]. Larger hysteresis areas typically indicate greater energy dissipation, potentially resulting in larger temperature changes but at reduced energy conversion efficiency [
24]. Additionally, excessive energy dissipation can lead to degradation of the elastocaloric effect and shortened thermal fatigue life [
25].
The material’s elastocaloric performance can be characterized through its coefficient of performance (
):
where
Q represents the transformation latent heat and
denotes the mechanical work input required for the complete loading-unloading cycle [
14].
To evaluate the elastocaloric characteristics of each test, we implemented a systematic analysis approach using custom MATLAB scripts. The total work (
) was calculated by integrating the stress-strain curve during the loading phase:
The energy dissipation (
) was determined by calculating the area enclosed within the complete stress-strain hysteresis loop, representing the difference between the loading and unloading work:
These calculations were performed using numerical integration (trapezoidal method) of the experimental stress-strain data for each test condition. The point of maximum stress was used to separate the loading and unloading portions of each curve. For consistency in comparison across different strain rates, both and were normalized by the specimen volume and expressed in Joules (J).
3. Results
The experimental investigation provided comprehensive data on the strain rate dependence of Ni-Ti SMA sheets under various deformation conditions. Through systematic testing at multiple strain levels and strain rates, we observed distinct patterns in mechanical response, phase transformation characteristics, and energy dissipation behavior. The results are presented in four complementary subsections: first, we examine the fundamental stress-strain responses across different strain rates, discussing the evolution of mechanical behavior from low to high deformation levels. This is followed by an analysis of rate effects on phase transformation, highlighting the relationship between strain rate and transformation characteristics. We then present the rate effects on energy dissipation and elastocaloric potential, evaluating the correlations between mechanical work, energy dissipation, and strain rate. Finally, a comparative analysis of these parameters provides insights into the optimal operating conditions for elastocaloric applications.
This comprehensive characterization provides insights for optimizing elastocaloric cooling applications, particularly in identifying operating conditions that balance energy efficiency with practical cycling requirements.
3.1. Stress-Strain Response at Different Strain Rates
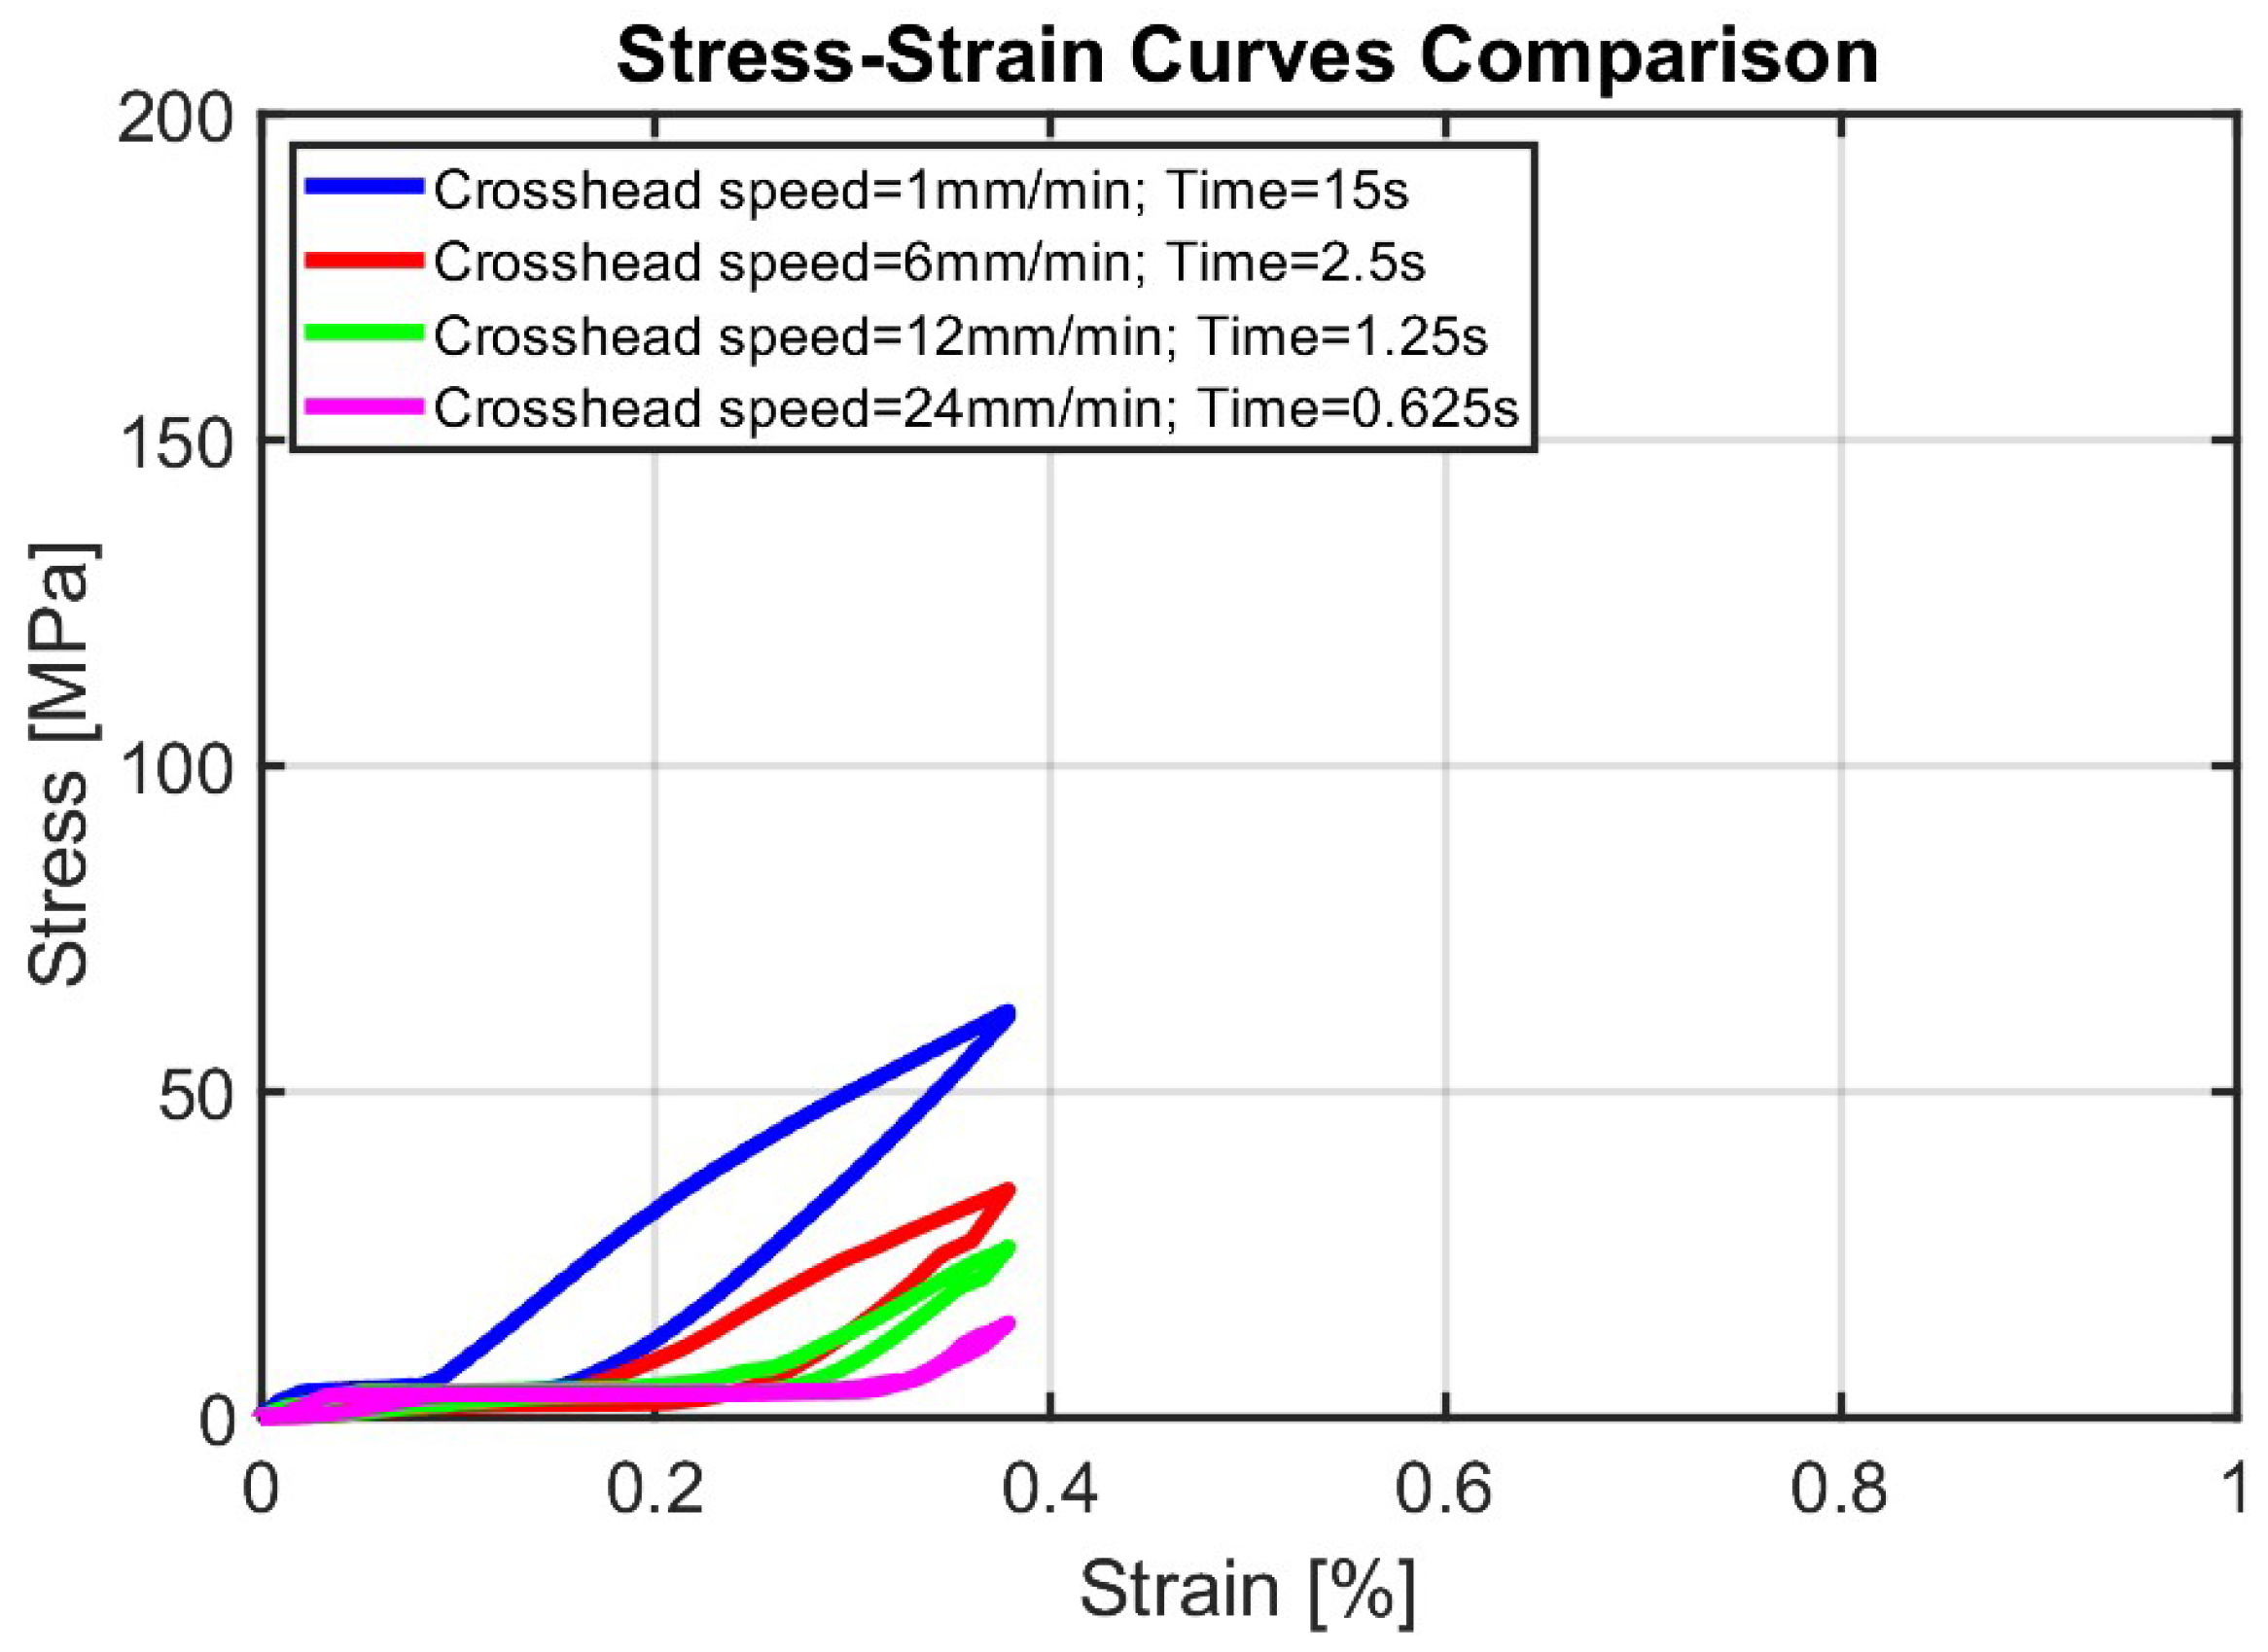
The mechanical behavior of the tested Ni-Ti sheets exhibited distinctive patterns across the investigated strain range, with significant strain rate influence observed from the lowest (0.38%) to the highest (3.84%) deformation levels. Analysis of the stress-strain curves revealed systematic relationships between strain rates and mechanical response, characterized by specific trends in transformation stresses, hysteresis behavior, and energy dissipation characteristics. At each deformation level, increasing strain rates from to led to systematic changes in the material’s response, particularly evident in the stress levels and transformation behavior.
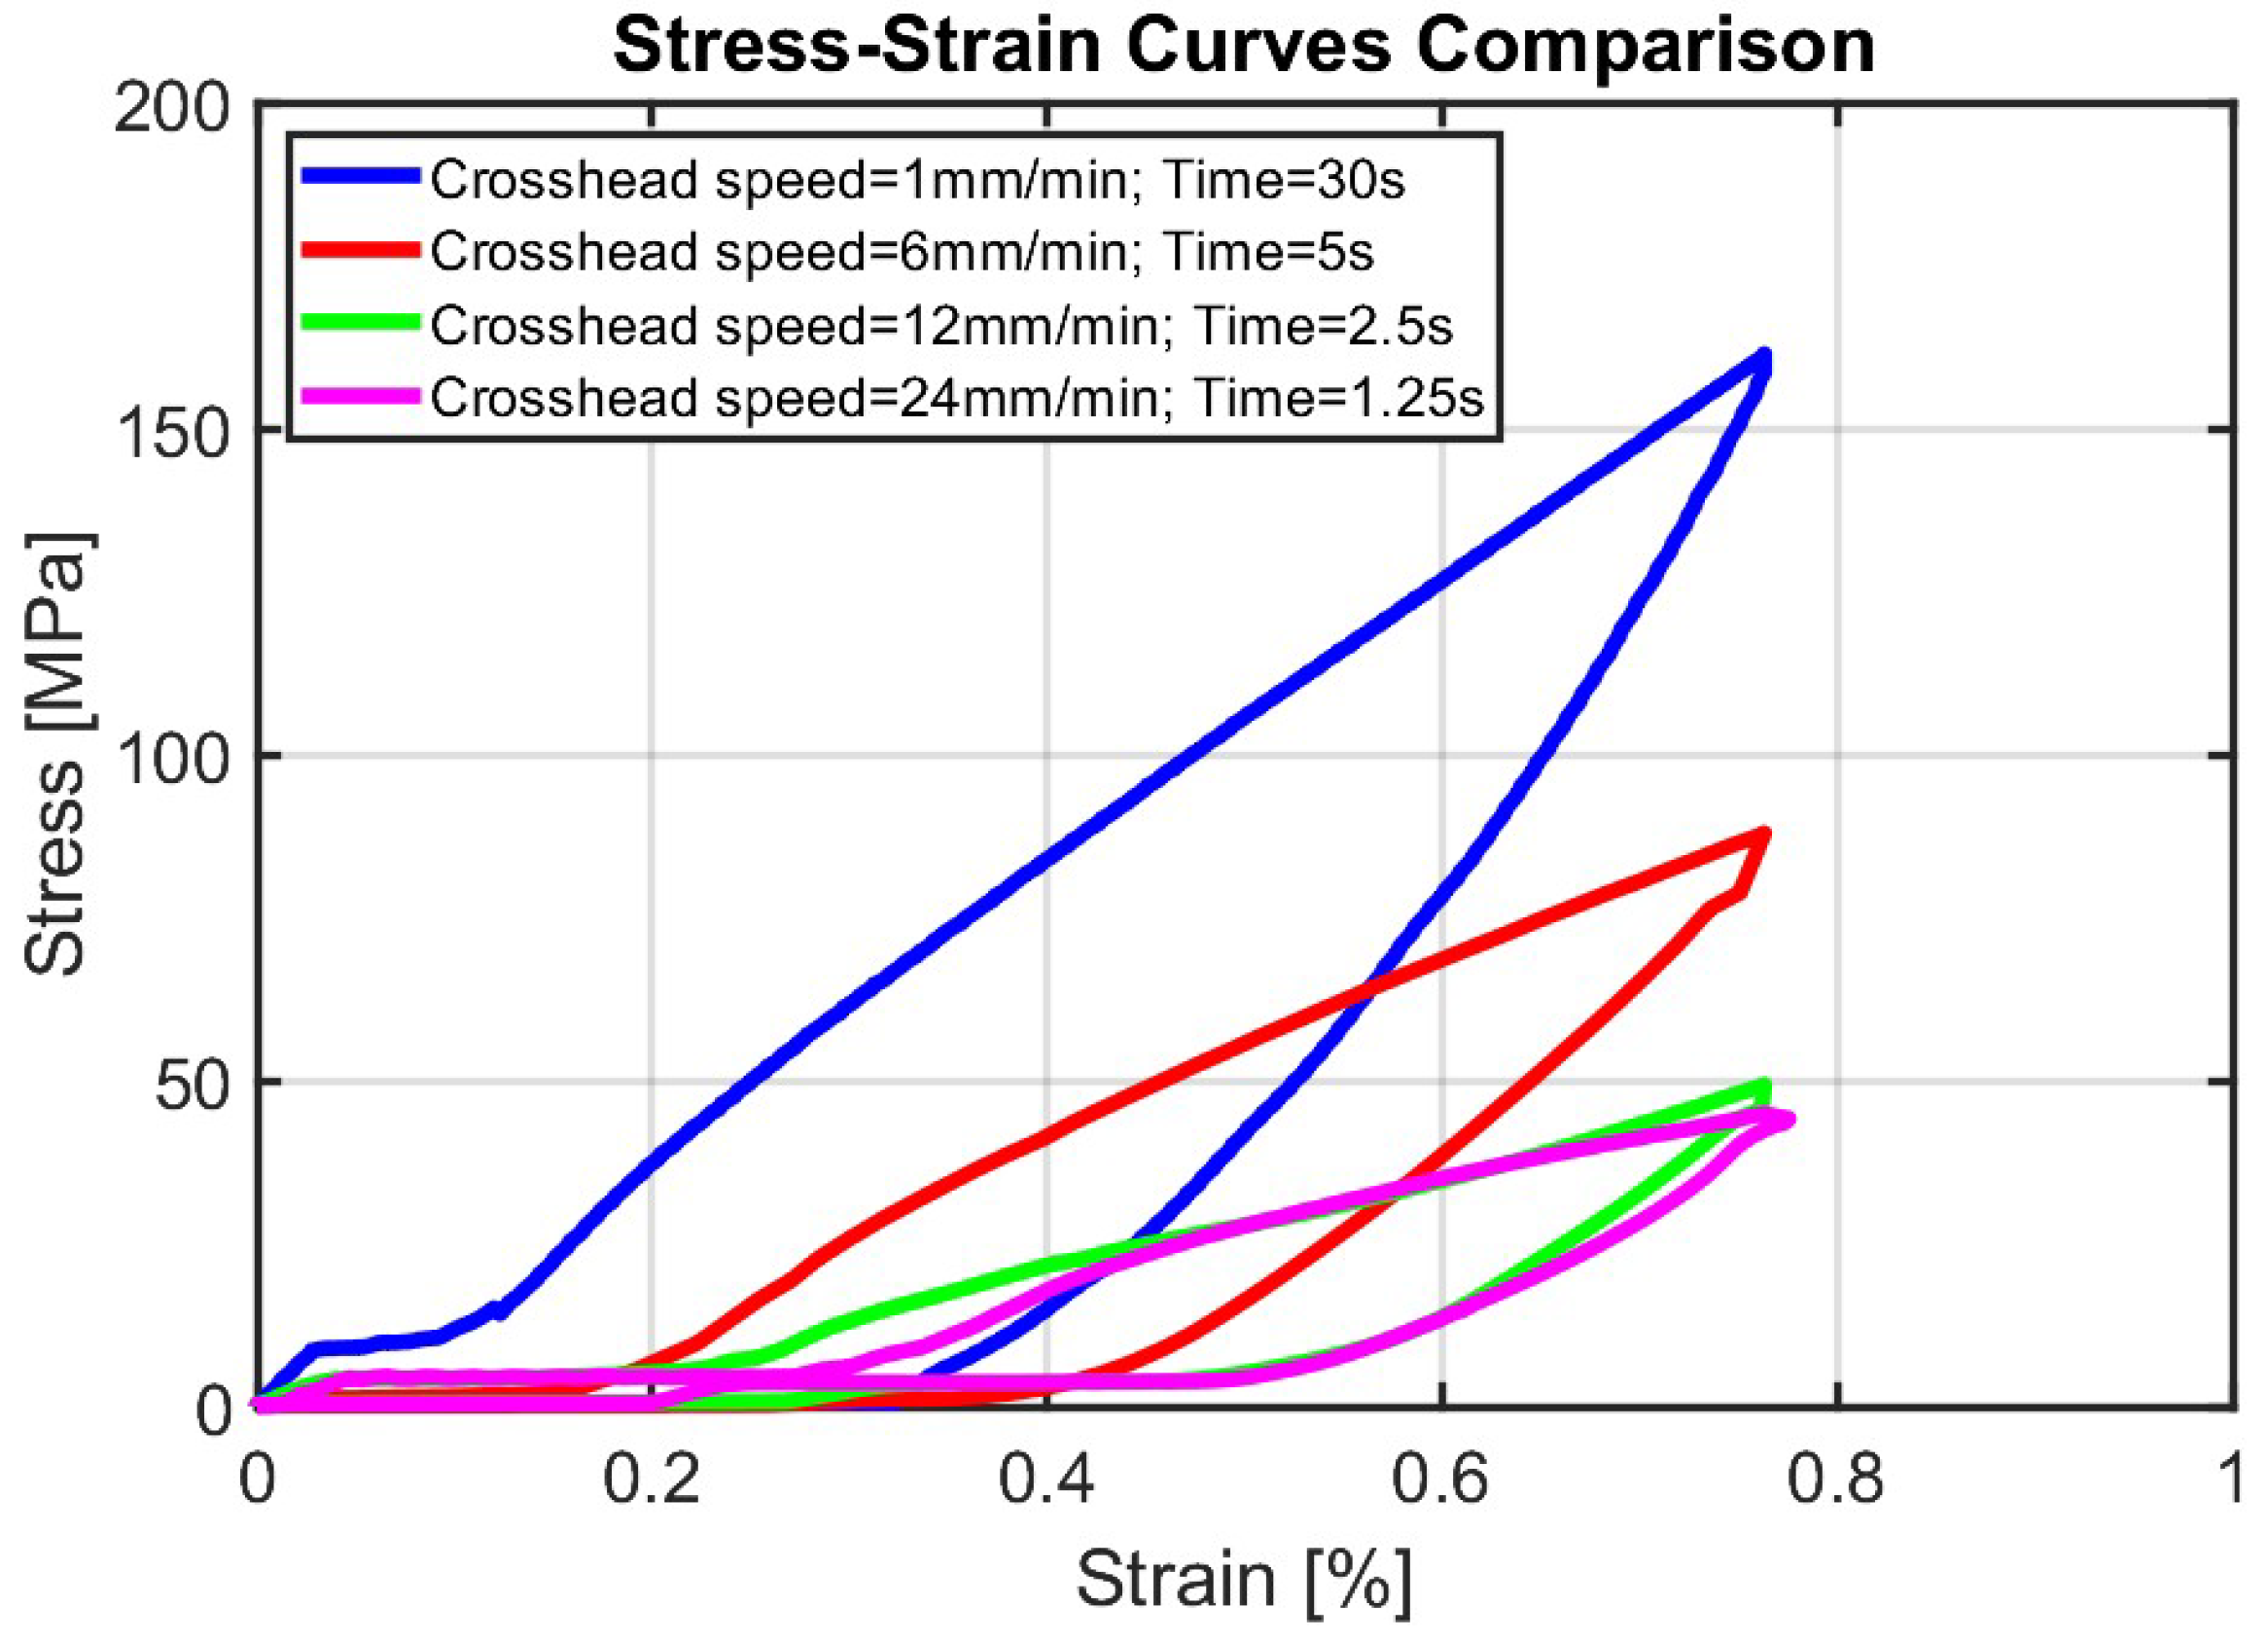
Initial mechanical response, characterized in tests
N = 1 and
N = 2 (
Figure 7 and
Figure 8), corresponding to maximum strains of 0.38% and 0.77% respectively, demonstrated significant rate sensitivity even at these low strain levels. In this regime, substantial differences in stress levels were observed across different strain rates, with the slowest rate (
, 1 mm/min) showing for test
N = 2 maximum stresses 115 MPa higher than those at the fastest rate (
, 24 mm/min) at equivalent strain levels. This behavior indicates that the material’s mechanical response exhibits strong rate dependency from the onset of loading, with slower strain rates consistently producing significantly higher stress levels for a given strain.
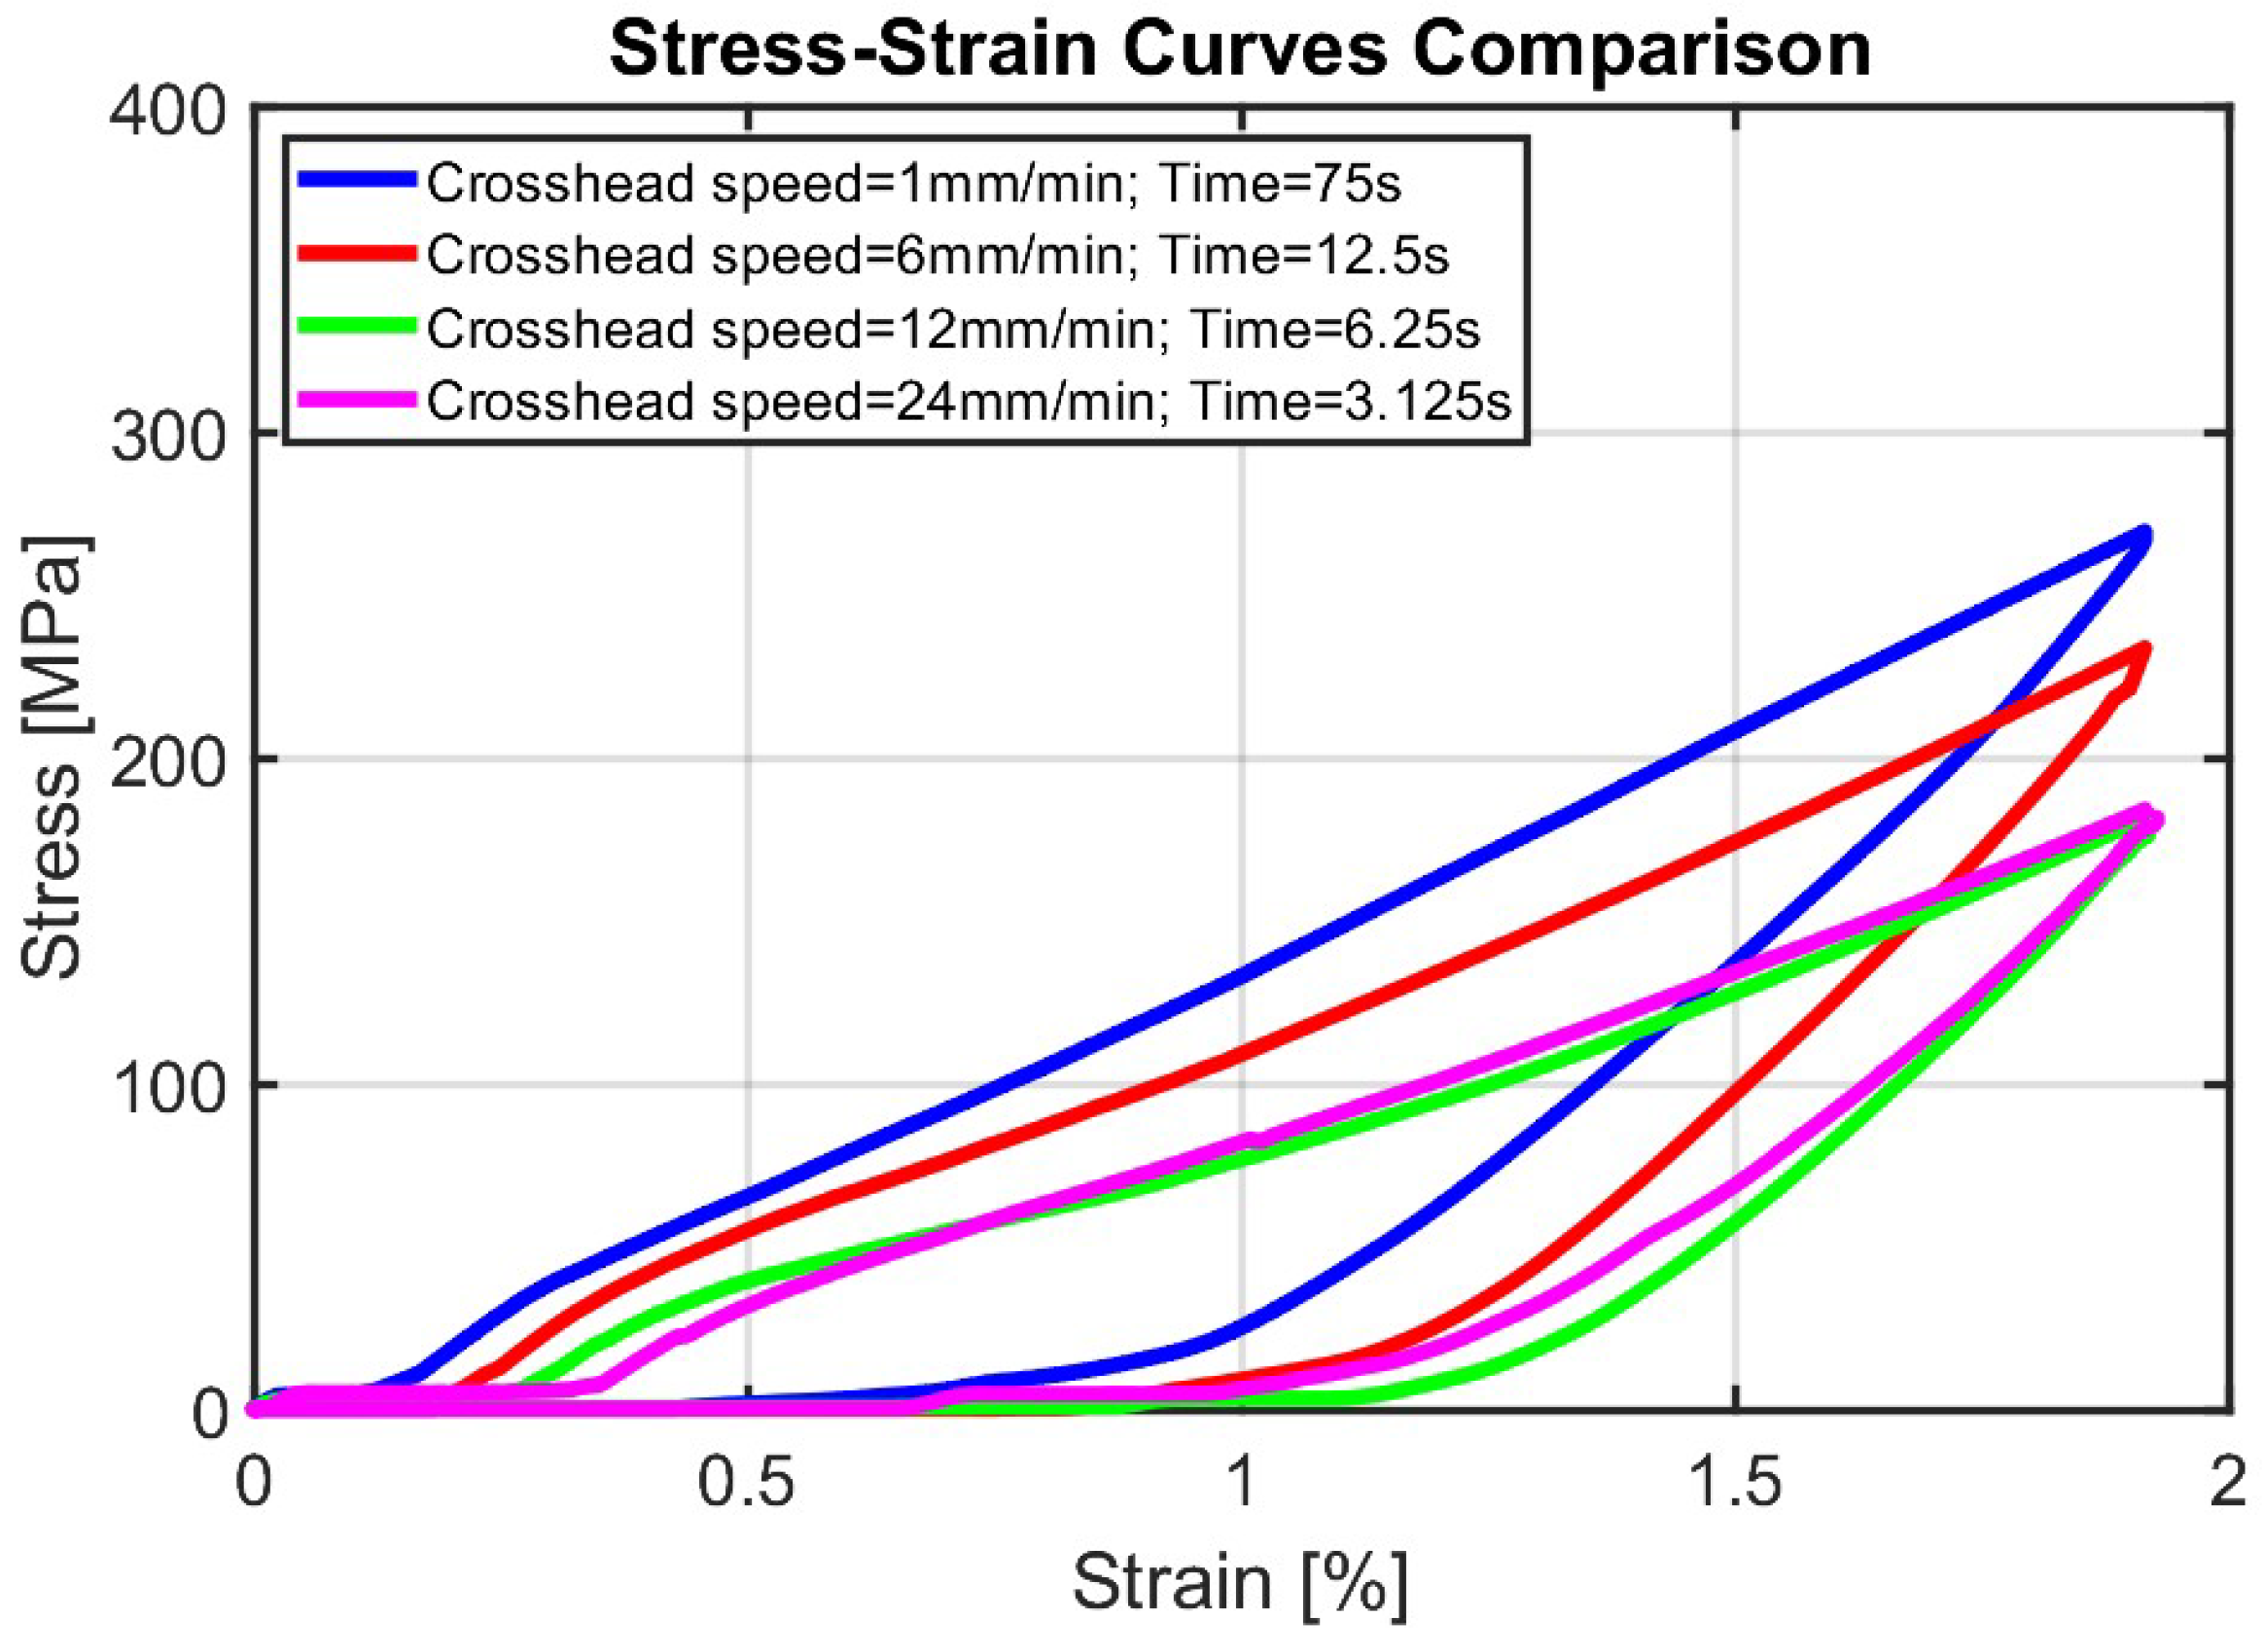
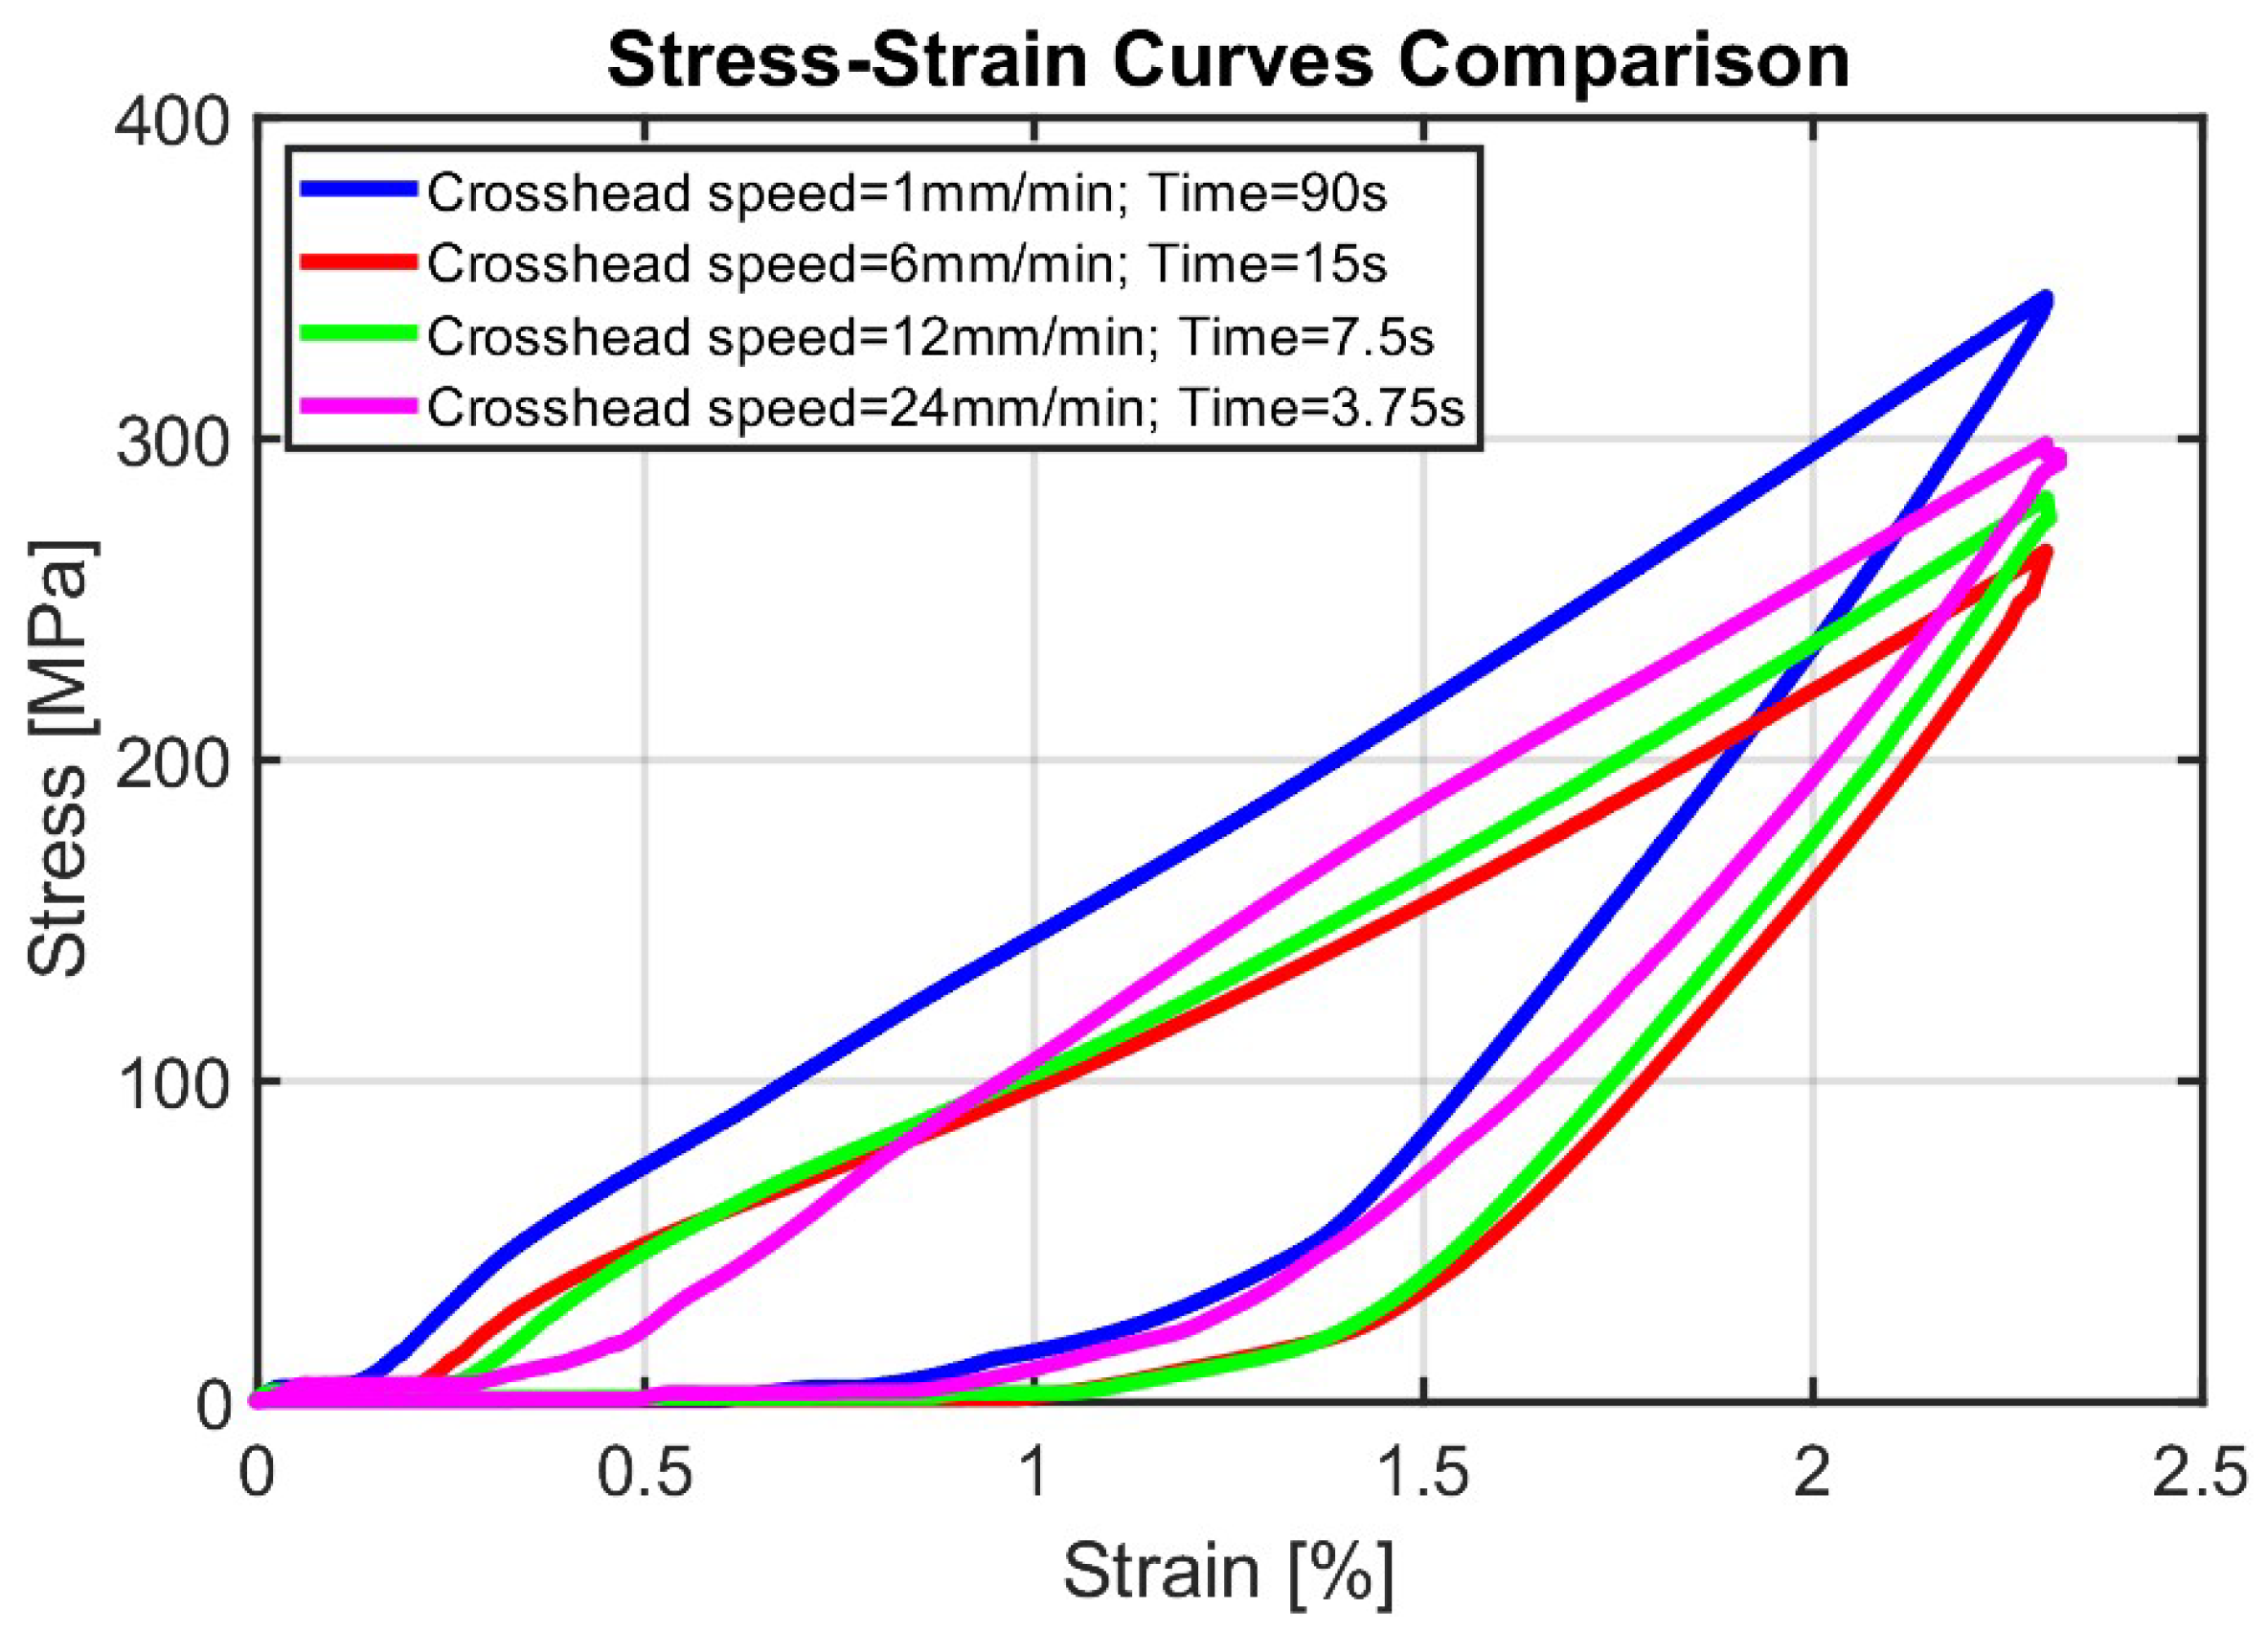
Tests
N = 3 and
N = 4 (
Figure 9 and
Figure 10) showed a progressive evolution of the material response at higher strain levels (up to 1.91% and 2.30% respectively). In both tests, the strain rate effect remained significant, with the highest stresses consistently observed at the slowest strain rate (
, 1 mm/min). For test
N = 3, maximum stresses ranged from 267 MPa at the lowest strain rate to 184 MPa at the highest strain rate (
, 24 mm/min), representing a 31% reduction in maximum stress with increasing strain rate.
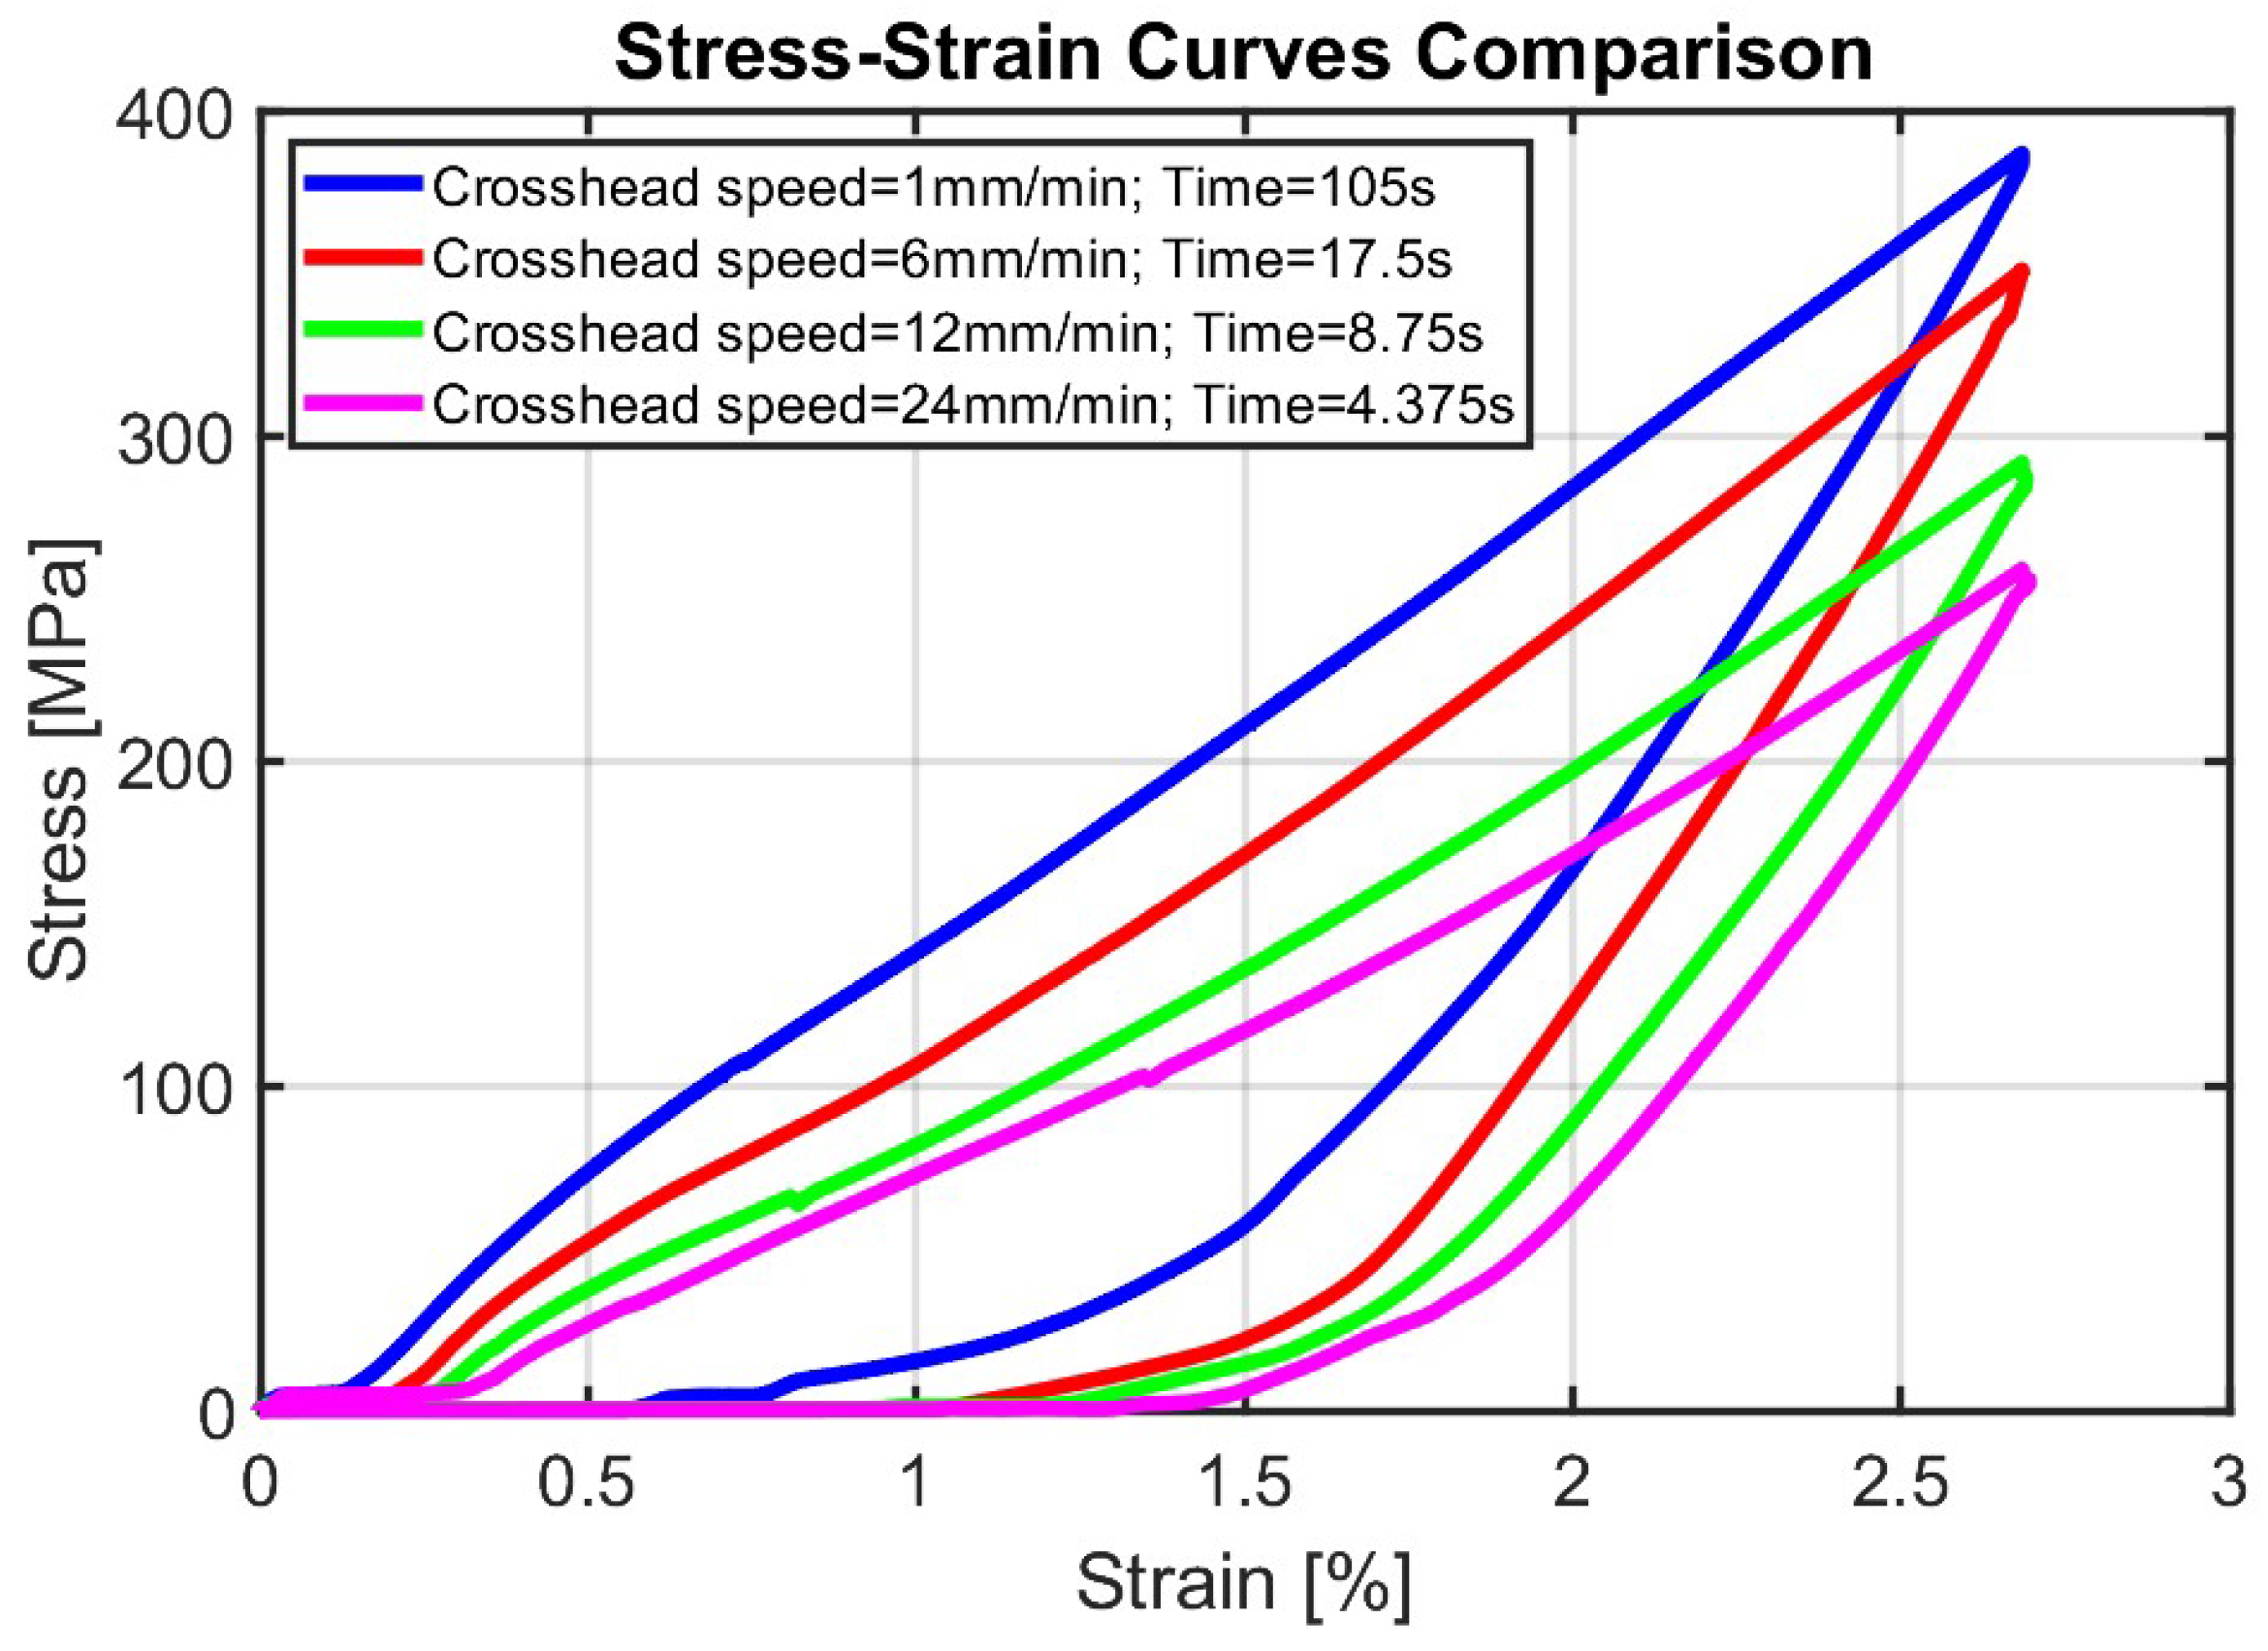
Tests
N = 5 through
N = 8 (
Figure 11,
Figure 12,
Figure 13 and
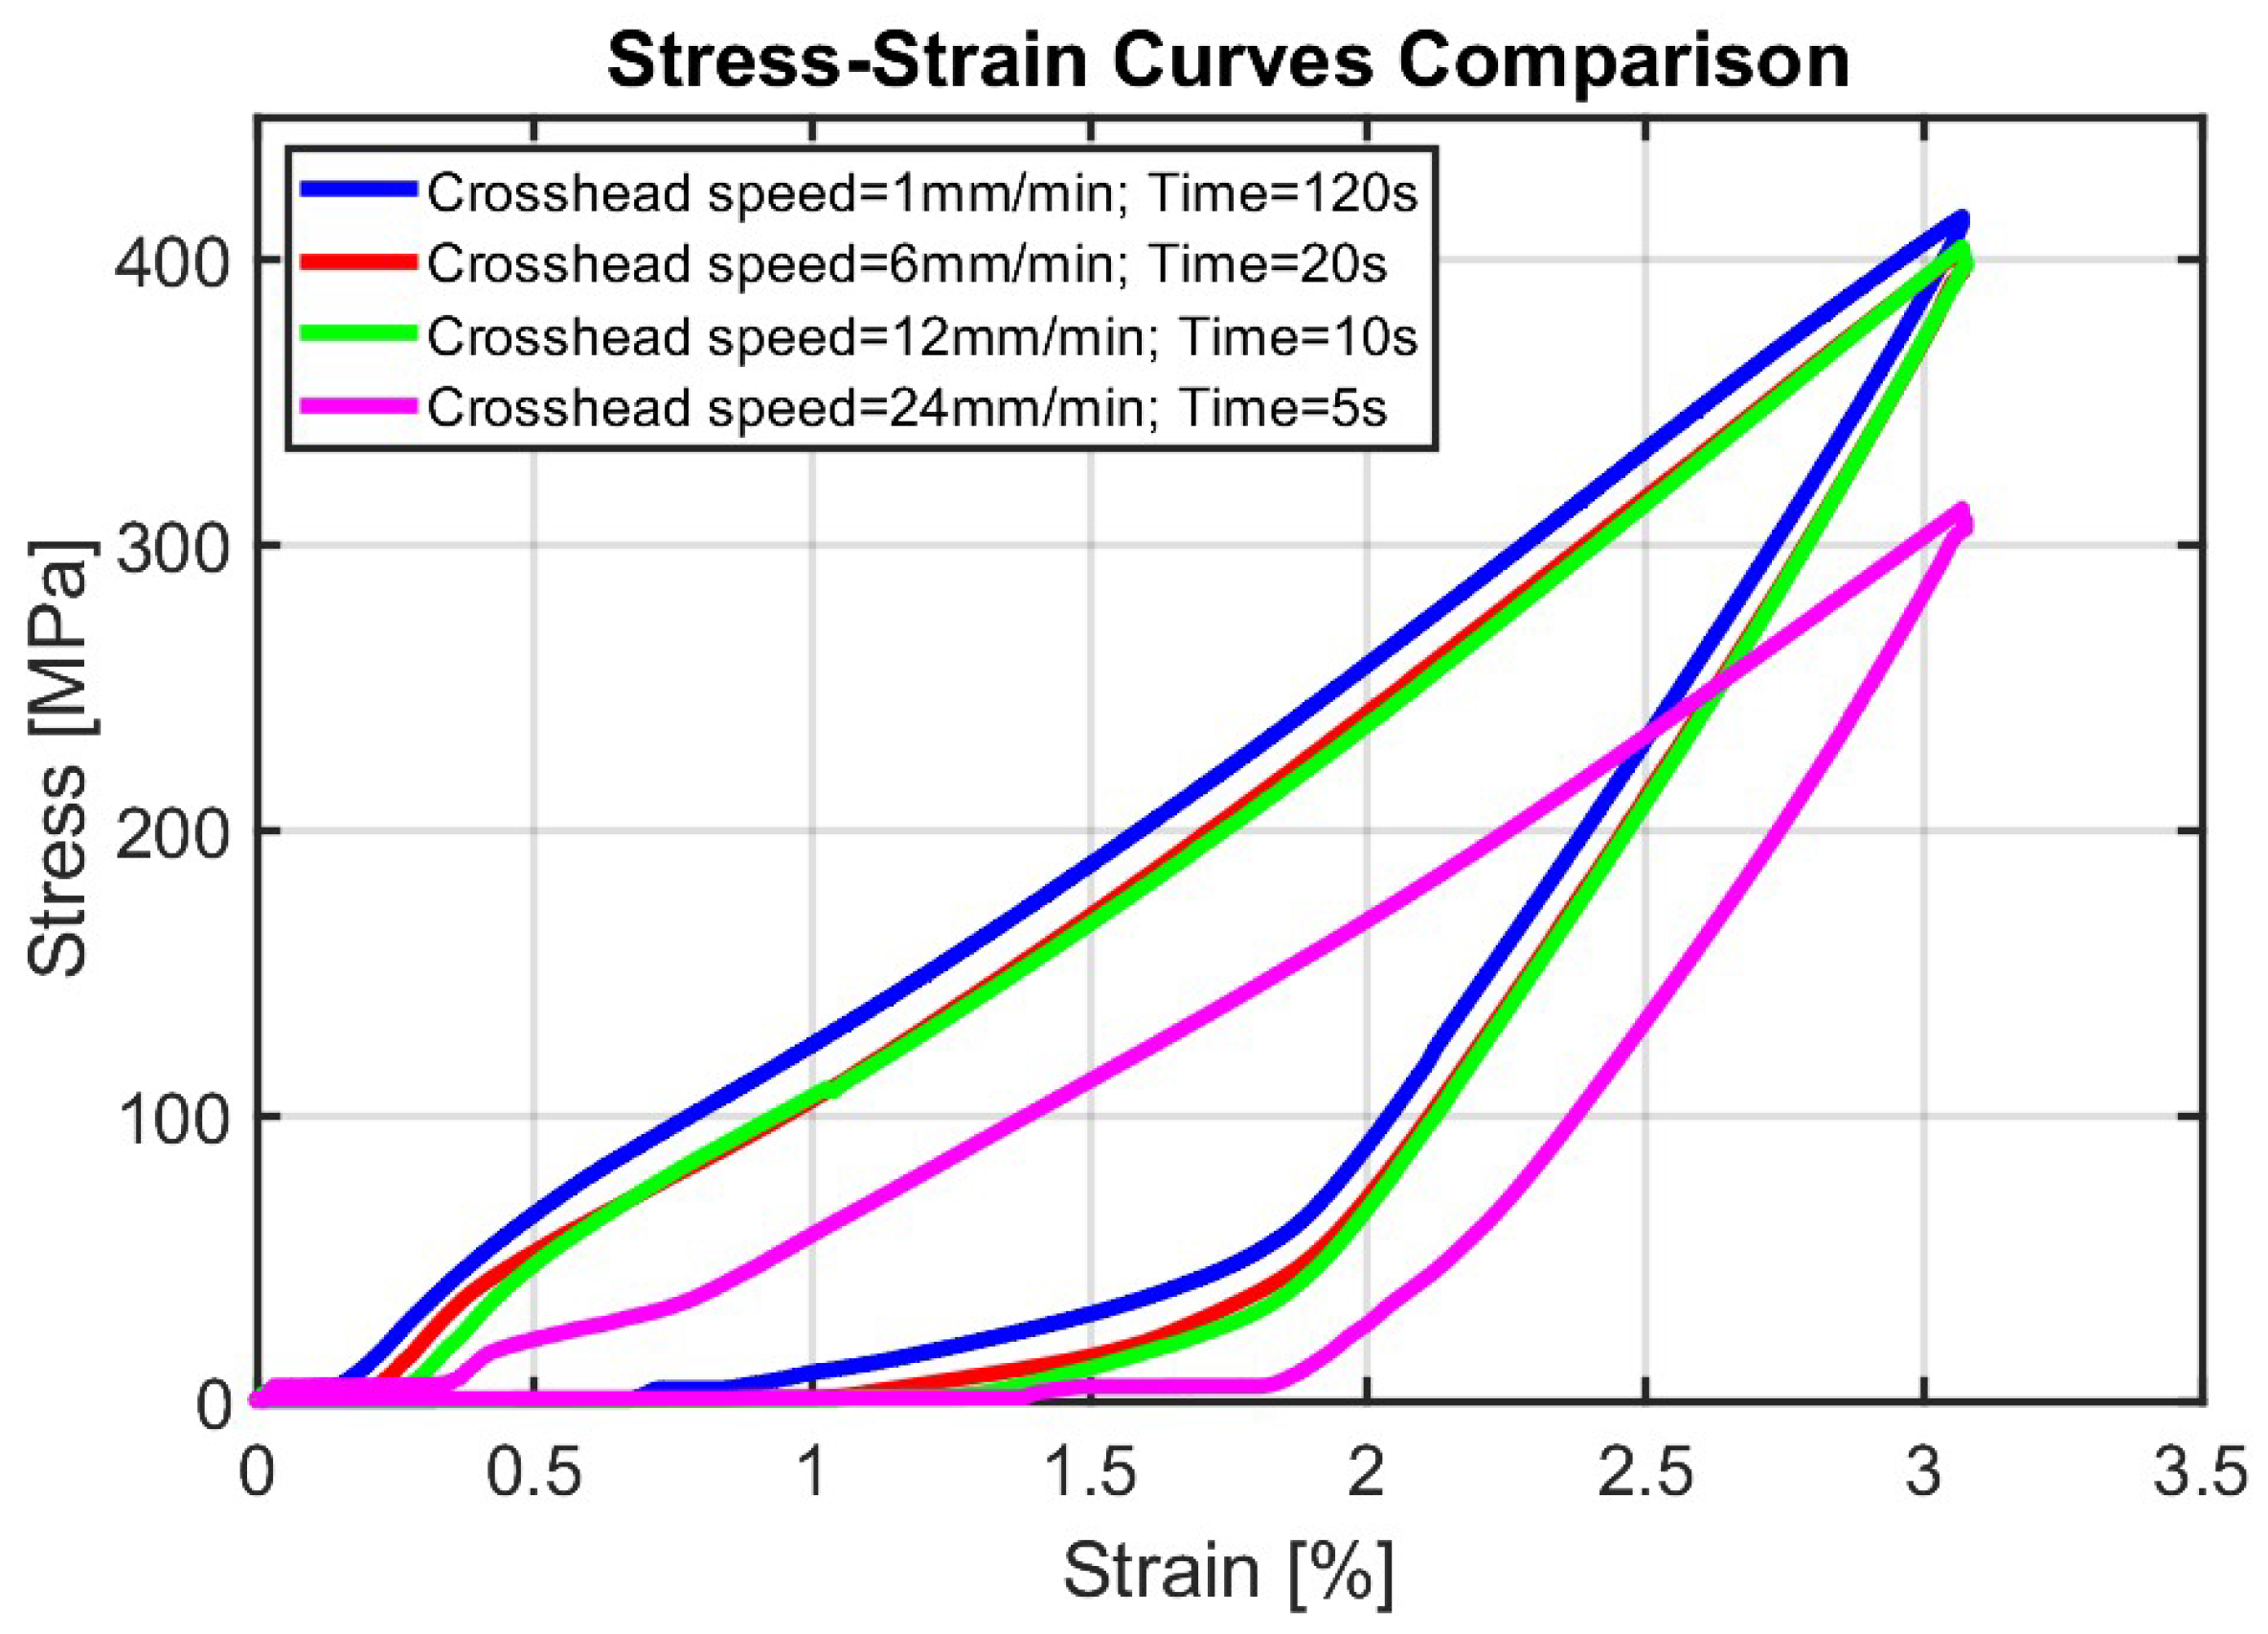
Figure 14) explored the material behavior at progressively higher strain levels, from 2.68% to 3.84%. In test
N = 5, the maximum stresses ranged from 387 MPa at the lowest strain rate (
, 1 mm/min) to 257 MPa at the highest strain rate (
, 24 mm/min). The hysteresis loops showed clear rate dependence, with their enclosed area, which directly relates to the dissipated energy, being notably larger at slower strain rates. A notable feature observed particularly at higher strain rates (24 mm/min,
) is the presence of a distinct plateau region in the stress-strain curves, most evident in
Figure 11. This plateau, appearing after the initial elastic rise and before a subsequent linear region, corresponds to the critical phase where stress-induced martensitic transformation initiates. Under these nearly adiabatic conditions, the latent heat generated during transformation cannot effectively dissipate, creating a localized temperature increase that temporarily stabilizes the transformation front. This results in a quasi-equilibrium state where deformation proceeds at nearly constant stress. The subsequent linear region indicates either the elastic loading of transformed martensite or the propagation of additional transformation fronts at higher stresses due to the established thermal conditions. This plateau characteristic is less pronounced at lower strain rates where more isothermal conditions allow for gradual and distributed transformation throughout the specimen. Test
N = 6 showed a similar pattern but with higher stress levels, reaching 414 MPa at the lowest strain rate and 312 MPa at the highest strain rate. The stress differential between strain rates remained significant, while the hysteresis loops maintained their rate-dependent characteristics. The stress-strain curves at this strain level (3.07%) exhibited more pronounced differences in the loading paths across different strain rates, indicating an enhanced strain rate sensitivity at higher deformation levels.
As strain levels increased further in tests N = 7 and N = 8, the rate effect became even more evident. In test N = 7, maximum stresses reached 414 MPa at the lowest strain rate (, 1 mm/min), while test N = 8 showed the highest stresses of the series, approaching 517 MPa at the lowest strain rate. The hysteresis loops in these tests demonstrated the most significant rate dependence, with the lowest strain rate consistently producing the largest loop areas, indicating maximum energy dissipation.
A particularly notable feature across all these higher-strain tests was the systematic variation in the unloading paths. At lower strain rates, the material showed more gradual stress reduction during unloading, resulting in wider hysteresis loops. In contrast, higher strain rates (, 24 mm/min) produced narrower loops with more rapid stress drops during unloading.
3.2. Rate Effects on Energy Dissipation and Elastocaloric Potential
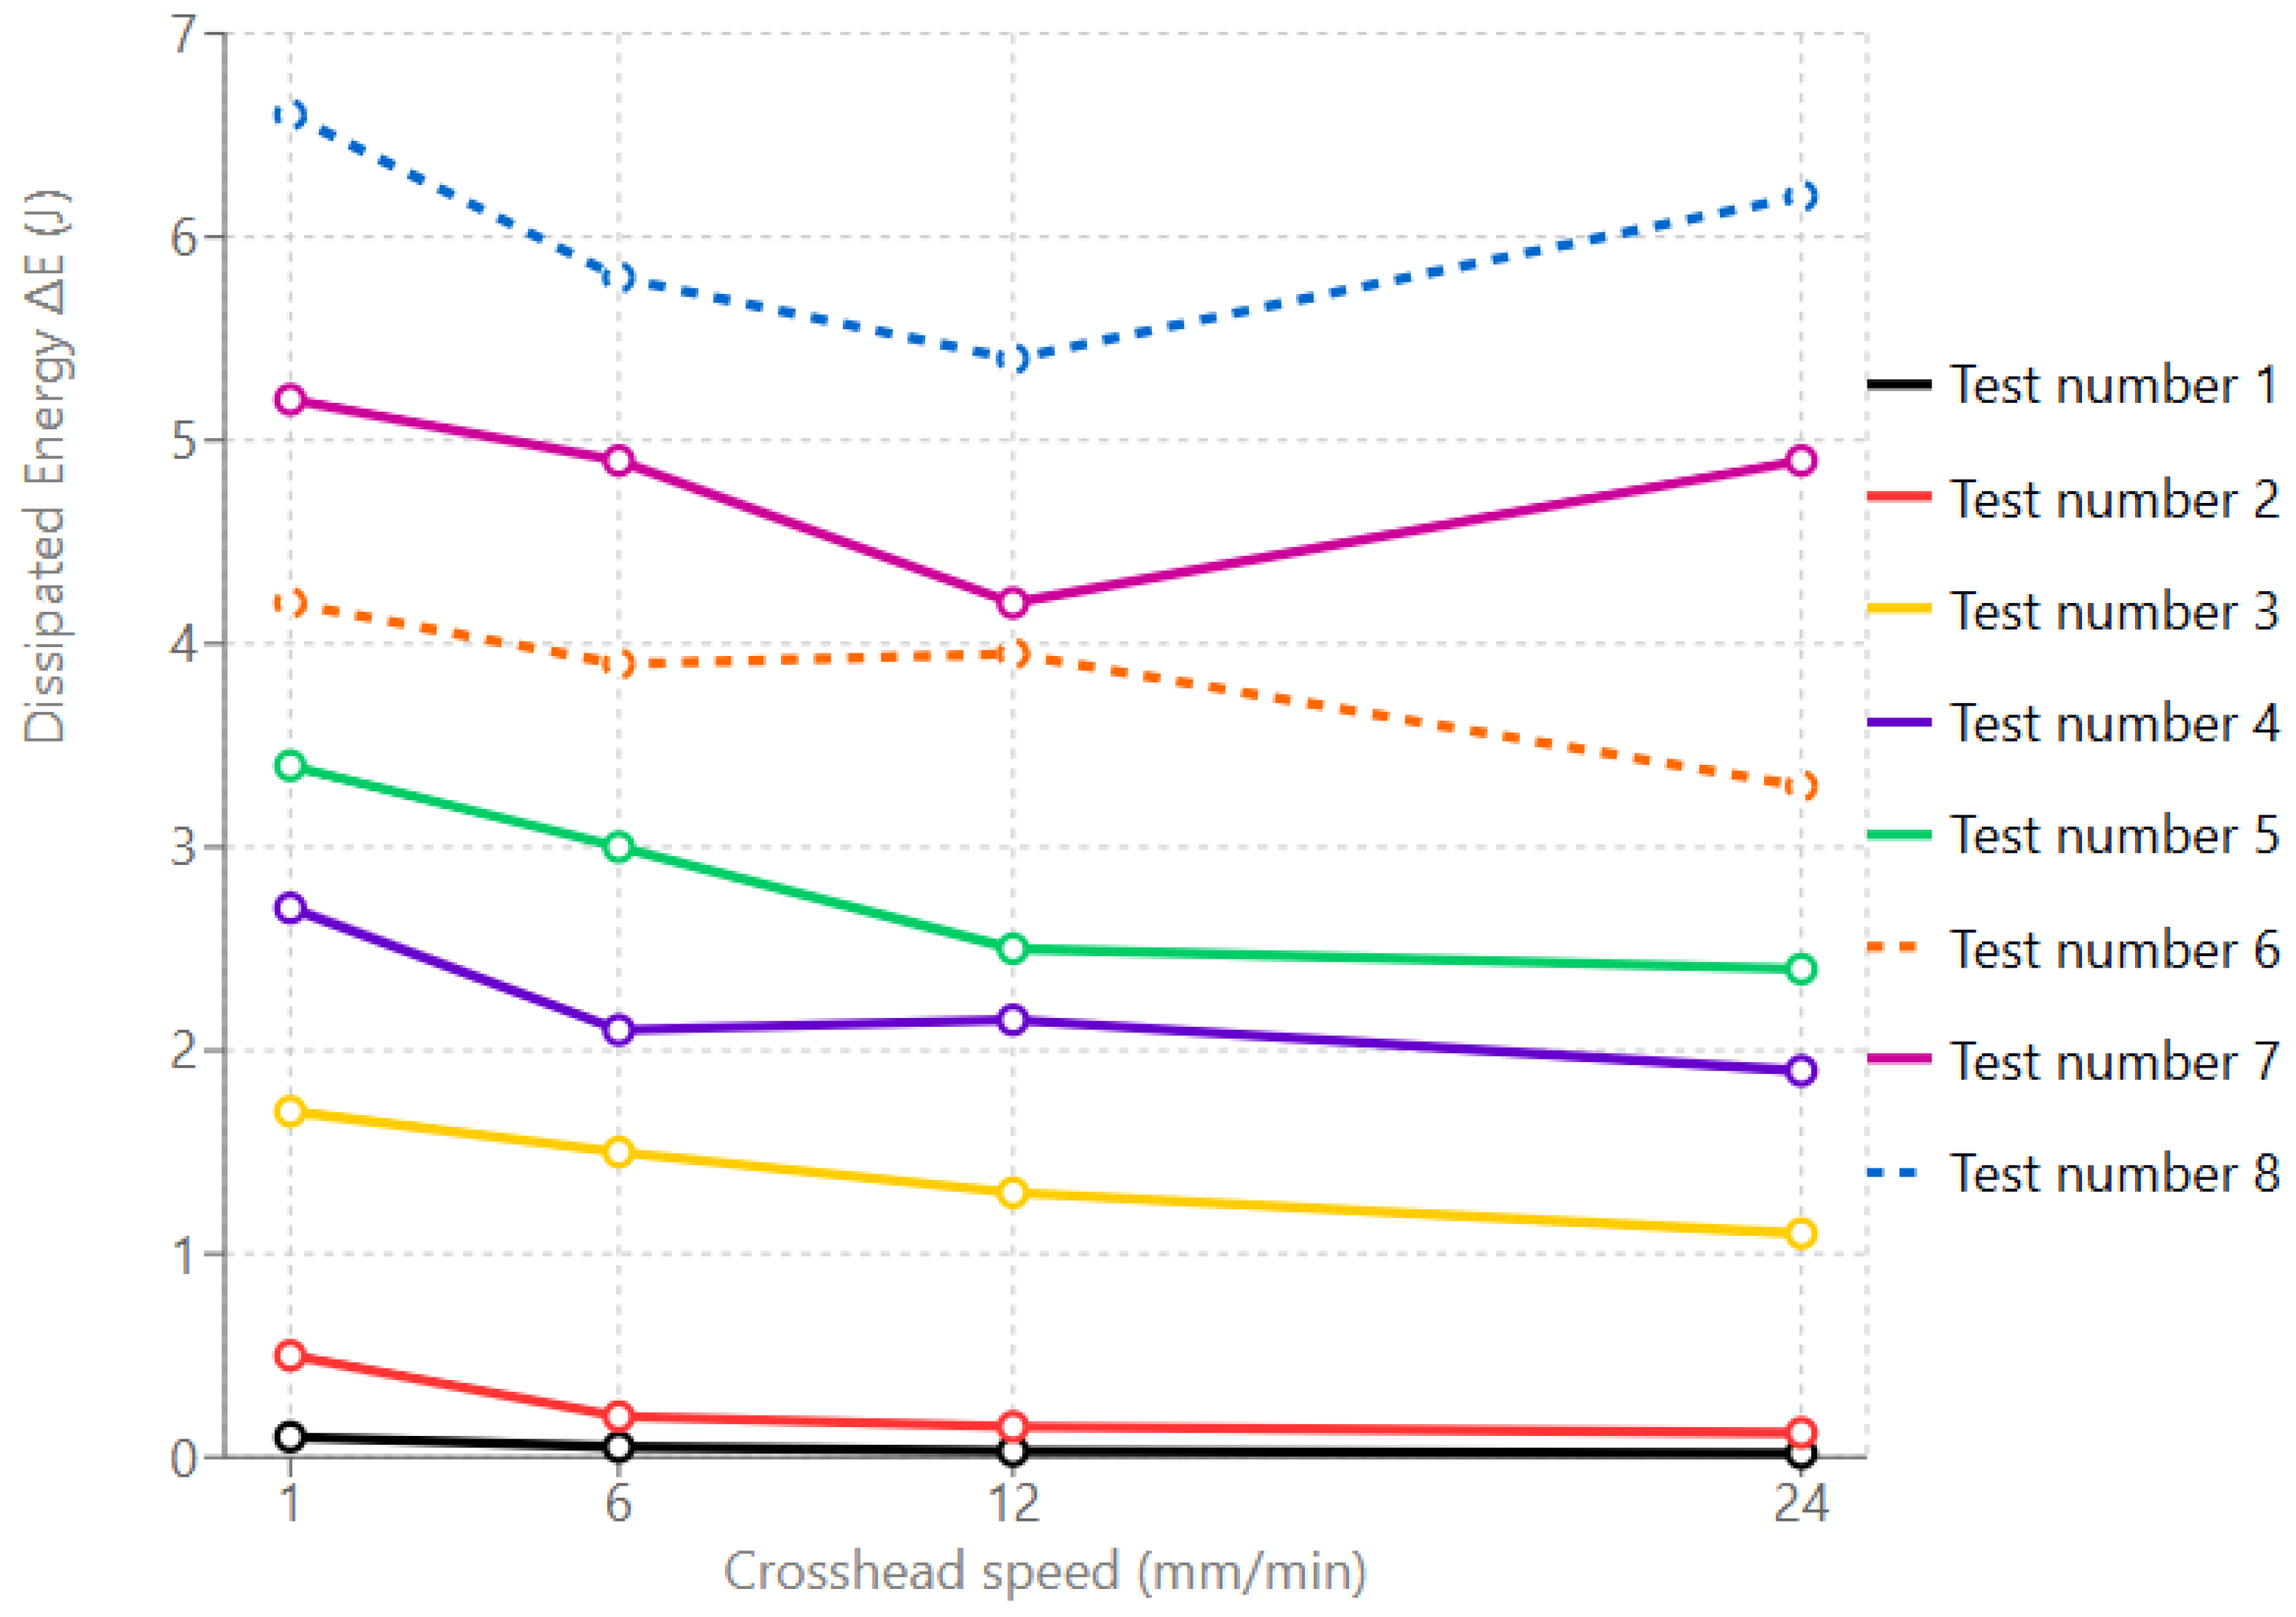
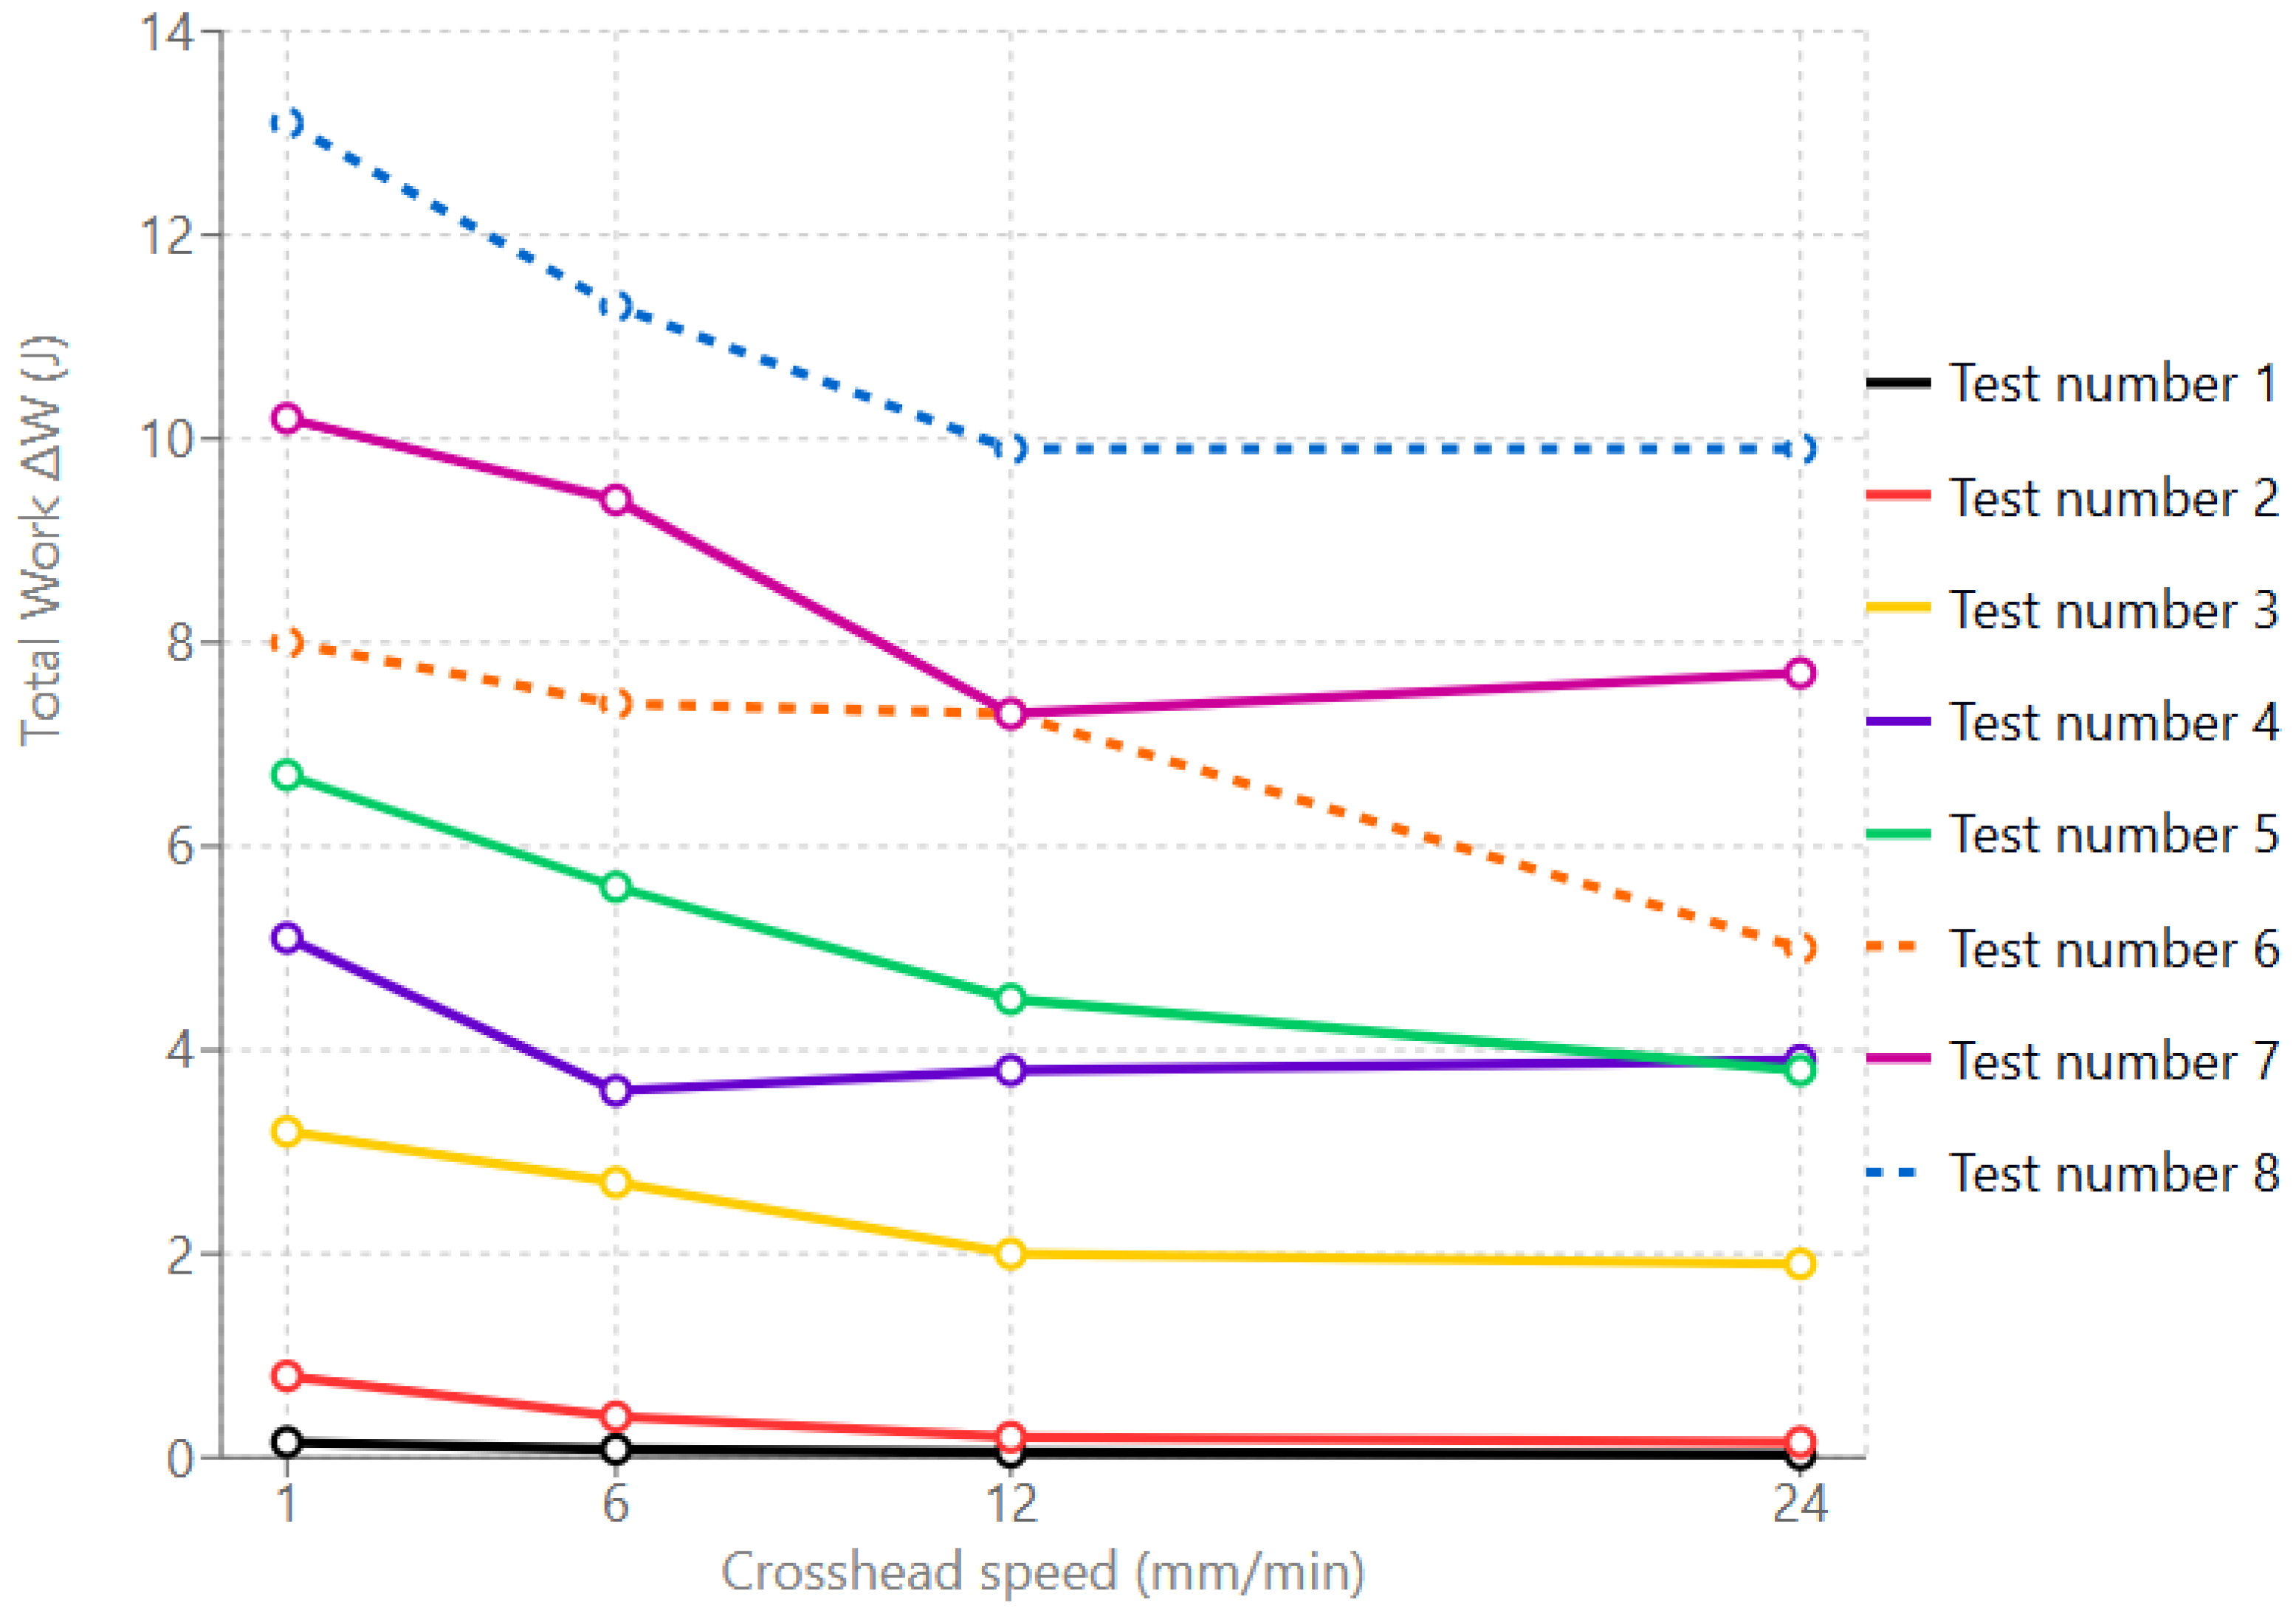
The relationship between crosshead speed and energy parameters reveals distinct patterns across different deformation levels.
Figure 15 and
Figure 16 presents respectively the evolution of dissipated energy (
) and total work (
) as function of crosshead speed for each test.
The dissipated energy exhibits a clear dependence on both deformation level and strain rate. For test
N = 8 (maximum deformation),
decreases from 6.62 J at 1 mm/min to 5.35 J at 12 mm/min, followed by an increase to 6.20 J at 24 mm/min. This non-monotonic behavior is observed in tests
N = 7 and
N = 8, suggesting a complex interplay between transformation dynamics and strain rate at higher deformation levels, which will be examined in detail in
Section 4.3.
The total work shows a decreasing trend with increasing crosshead speed across all tests. For test N = 8, decreases from 13.11 J at 1 mm/min to 9.93 J at 24 mm/min, representing a 24% reduction. While tests N = 1 through N = 3 show larger percentage reductions ( decreases by 83%, 76%, and 40% respectively), their absolute variations are smaller due to lower initial work values (from 0.15 J to 0.02 J for N = 1, 0.78 J to 0.19 J for N = 2, and 3.23 J to 1.92 J for N = 3).
Both energy parameters demonstrate stronger rate sensitivity at lower crosshead speeds (1–12 mm/min) compared to higher speeds (12–24 mm/min), particularly evident in tests
N = 4 through
N = 8. The ratio
/
, which indicates the proportion of input energy dissipated during the transformation, increases with crosshead speed for higher deformation levels, ranging from 0.42 for test
N = 1 at 1 mm/min to 0.63 for test
N = 8 at 24 mm/min, as reported in
Table 2.
4. Discussion
The experimental investigation revealed complex relationships between strain rate, mechanical response, and energy characteristics of Ni-Ti sheets, with significant implications for elastocaloric applications. The observed behaviors, characterized by systematic changes in stress-strain response and strong correlations between energy parameters ( at low deformation levels), can be attributed to multiple interacting mechanisms, ranging from transformation kinetics to energy dissipation processes. Our analysis focuses on five key aspects: strain rate effects on transformation stress, impact on superelastic response, energy dissipation mechanisms, rate sensitivity, and implications for elastocaloric pplications. Through this systematic examination, our research establishes relationships between the observed rate-dependent phenomena and their underlying physical mechanisms, providing practical guidelines for optimizing elastocaloric cooling applications.
4.1. Strain Rate Effects on Transformation Stress
The stress-strain behavior reveals a distinct relationship between strain rate and transformation characteristics. Our experimental results demonstrate that increasing the strain rate from
to
leads to a significant decrease in transformation stresses, particularly in tests
N = 6 through
N = 8. This substantial rate sensitivity can be attributed to the complex interaction between transformation kinetics and thermal effects during loading [
26]. Higher strain rates induce significant localized heating and cooling phenomena, which directly influence the transformation kinetics and lead to the progressive nucleation of multiple transformation fronts [
27]. The interaction between these thermal and mechanical processes creates a complex relationship between heat transfer conditions and transformation stress, resulting in characteristic stress responses. The material’s inability to fully accommodate the phase transformation process at higher strain rates, coupled with these thermomechanical effects, explains the observed reduction in transformation stresses.
From a thermodynamic perspective, this behavior can be understood through the Gibbs free energy framework, where the driving force for martensitic transformation is expressed as . During rapid deformation ( s−1), the latent heat released throughout transformation cannot dissipate effectively, creating localized temperature gradients that modify the term. This temperature rise temporarily increases the stability of the austenitic phase in affected regions, altering transformation kinetics. The observed stress plateaus at higher strain rates represent this thermodynamic equilibrium state where transformation proceeds under nearly adiabatic conditions. As deformation continues, the interplay between heat generation, partial dissipation, and transformation proceeds through a complex sequence of localized transformation events rather than the more uniform progression observed under isothermal conditions at lower strain rates.
This relationship between temperature and transformation stability can be more rigorously analyzed by examining the energy barrier separating austenite and martensite phases. As demonstrated by Wendler et al. [
28], during high strain rate deformation, latent heat release locally modifies the energy landscape, shifting phase equilibria. This shift necessitates stress values to maintain transformation conditions at elevated strain rates according to
, where
represents the Clausius-Clapeyron coefficient. This mechanism explains the observed inclination in stress plateaus and the strain rate dependence of transformation behavior, which is primarily a thermal effect rather than an intrinsic kinetic effect.
These findings also align with research by Shen et al. [
29] on aged Ni-rich TiNi alloys, which demonstrated that microstructural conditions significantly influence transformation stability and associated temperature evolution. Their work revealed that precipitation hardening alters not only the transformation temperatures but also the material’s response to thermal variations during loading cycles, creating distinct transformation regimes dependent on the operational conditions. This further supports our observations regarding the critical role of thermomechanical coupling in determining transformation behavior under various strain rates.
4.2. Impact on Superelastic Response
Quantitative analysis of the hysteresis loops reveals distinct rate-dependent patterns in the superelastic response. At lower strain rates (
to
, 1–6 mm/min), we observe hysteresis loops with larger stress differentials between loading and unloading paths, particularly in the 1.0% to 2% strain range. The wider hysteresis loops at these lower rates are characterized by stress changes occurring over longer time periods, allowing for more effective heat exchange with the environment [
30].
The hysteresis behavior demonstrates significant rate-dependent characteristics at higher strain rates (
to
, 12–24 mm/min), with reduced stress differentials between loading and unloading paths. At these elevated rates, the martensitic transformation kinetics accelerate, with phase evolution occurring over reduced temporal intervals that substantially affect the thermomechanical equilibrium [
1]. This contracted temporal evolution limits thermal exchange with the environment, establishing increasingly adiabatic conditions where transformation-generated heat remains locally concentrated. The resulting temperature gradients influence reverse transformation thermodynamics, producing a distinctive hysteresis profile with modified path characteristics.
4.3. Energy Dissipation Mechanisms
The correlation analysis between energy dissipation (
) and work (
) reveals distinct patterns across different deformation levels. Statistical analysis shows very high correlation (R
2 > 0.98) in tests
N = 1, 2, 5 and 6, progressively decreasing to low correlation (R
2 < 0.50) for test
N = 8. This suggests that as deformation increases, the relationship between energy dissipation and work becomes less linear, indicating a transition in the material’s response mechanism. Further details and graphical representation of this correlation analysis are provided in
Appendix A.
Further analysis on the correlation between strain rate and both energy dissipation and work has been performed. The results are summarized in
Table 3 and
Table 4.
At low deformation levels, where the correlation between
and
is strongest, the process appears to be dominated by predictable thermomechanical coupling. However, as deformation increases, the decreasing correlation coefficients suggest the emergence of additional dissipation mechanisms. This transition in behavior indicates a critical deformation threshold that modifies the energy storage and dissipation mechanisms. In the low strain rate regime, the relationship between work and dissipation remains highly linear, suggesting that latent heat from phase transformation and elastic energy storage dominate the response, with heat being effectively dissipated to the environment [
15]. As strain rates and deformation level increase, the process becomes increasingly adiabatic, leading to significant temperature rises and localized heating effects that modify the transformation behavior and energy dissipation mechanisms, causing a progressive breakdown of this linear relationship.
The non-monotonic behavior observed in the energy dissipation versus strain rate relationship for tests
N = 7 and
N = 8 (
Figure 15) can be explained through thermodynamic principles. At intermediate strain rates (
s
−1), the material operates in a transitional regime between isothermal and adiabatic conditions, where transformation efficiency reaches a local optimum. In this regime, the balance between heat generation and dissipation creates favorable conditions for martensitic transformation with minimized energy losses. When strain rates increase further to
s
−1, the process becomes predominantly adiabatic, introducing additional dissipation mechanisms. Internal friction between transforming domains increases as multiple transformation fronts develop under thermal gradients due to the heterogeneous temperature distribution across the material, that activates non-uniform transformation pathways that require additional energy to overcome interfacial barriers between transformed and untransformed regions, resulting in the observed increase in energy dissipation despite reduced total work input.
This transition in dissipation behavior at high deformation levels has important implications for elastocaloric cooling applications, as it indicates that optimal energy efficiency may be achieved at specific ‘transition point’ strain rates that balance these competing mechanisms. Interestingly, these observations align with broader trends in advanced material systems. Recent advancements in complex alloy research have demonstrated similar principles of strain-induced lattice distortion affecting material properties [
31], despite fundamental differences in composition and application domains. Such parallels suggest common underlying mechanisms in how microstructural changes influence energy dissipation across different metallic systems, reinforcing the importance of considering atomic-scale interactions when optimizing functional properties for energy applications.
4.4. Rate Sensitivity and Material Response
The rate sensitivity demonstrated in our experiments shows distinct patterns across different deformation levels. Statistical analysis reveals that in tests N = 1 through N = 3 (strains up to 1.91%) the energy dissipation shows strong negative correlation with strain rate (R2 between −0.79 and −0.97), indicating a predictable response. However, tests N = 4 through N = 8 show a more complex behavior, with correlation coefficients progressively decreasing to −0.19 at the highest strain levels. This suggests a fundamental change in the material’s response mechanism at higher deformations.
Quantitative analysis of the stress-strain curves reveals systematic variations in material behavior. The mechanical response, characterized by the transformation slope (), shows significant variations with strain rate that correlate with the observed changes in energy dissipation patterns. The strong correlations found between and at low deformation levels (R2 > 0.98 for tests N = 1 and N = 2) progressively weaken at higher deformations (R2 = 0.49 for test N = 8), indicating a transition in the material’s response mechanism.
The development of transformation behavior shows a clear rate dependence throughout the testing range. This effect is supported by the correlation analysis between strain rate and work, which shows consistently strong negative correlations (R2 between −0.82 and −0.96) even at high deformation levels, indicating a systematic influence of strain rate on the mechanical response.
Furthermore, our experimental observations revealed significant variability in stress-strain responses specifically at the intermediate strain rate of
(12 mm/min). This behavior can be understood as a consequence of the Ni-Ti sheets operating in a transitional thermomechanical regime at this specific strain rate. While lower strain rates allow sufficient time for thermal equilibration (creating predominantly isothermal conditions) and higher rates create primarily adiabatic conditions, this intermediate regime presents a unique scenario. Under these conditions, the material’s response demonstrates heightened sensitivity to minor variations in experimental parameters and local microstructural heterogeneities. The transformation process becomes more susceptible to subtle differences in initial conditions, resulting in more variable mechanical responses among tests. This transitional regime provides valuable insight into the complex strain-rate dependent response mechanisms of Ni-Ti sheets and has important implications for optimizing elastocaloric applications, particularly when seeking to balance transformation efficiency with operational stability. This transitional regime behavior has parallels in other material systems, as seen in recent computational investigations of soft-matter systems, where strain rate dependence has been analyzed at the molecular level to reveal similar mechanisms of structural reorganization under varying deformation rates [
32].
4.5. Implications for Elastocaloric Applications
Our comprehensive analysis aims to provides guidelines for optimizing elastocaloric cooling systems. Statistical analysis reveals distinct behavioral regimes at different strain rates (corresponding to strain rates from to ). At lower rates (1–6 mm/min), we observe:
Higher total work input ( up to 13.11 J for test N = 8),
Larger energy dissipation ( reaching 6.62 J),
Very high correlation between energy dissipation and work (R2 > 0.98).
While at higher rates (12–24 mm/min), the material exhibits:
Reduced total work input ( decreasing to 9.93 J),
Non-monotonic energy dissipation behavior,
Decreasing correlation between energy dissipation and work (R2 down to 0.49).
These characteristics have specific implications for device design parameters:
Lower strain rates provide more predictable and efficient energy conversion but require longer cycling times,
Higher strain rates offer faster cycling but with less predictable energy conversion patterns,
Operating strains should be kept in ranges where strong correlations between energy and work are maintained (corresponding to tests N = 1, 2, 5, and 6).
The trade-off analysis suggests that the optimal operating conditions depend on the specific application requirements:
For maximum energy conversion efficiency and predictability: operate at lower rates (1–6 mm/min),
For higher cycling frequencies: operate at intermediate rates (6–12 mm/min),
For rapid response applications: use higher rates (12–24 mm/min) with appropriate thermal management.
4.6. Future Research Directions
Based on our findings, several research directions emerge. First, an essential extension of the present work involves comprehensive thermal characterization of the elastocaloric effect in these materials. Direct measurement of temperature evolution during mechanical loading using techniques such as infrared thermography would provide valuable insights into the heat transfer dynamics at different strain rates. Such thermal analysis would further elucidate the transitional regime behaviors observed in our mechanical testing and establish quantitative relationships between strain rate, mechanical response, and temperature change. This thermal characterization represents a first next step toward optimizing the elastocaloric cooling potential of Ni-Ti sheets and is currently being pursued as a complementary investigation. A second research direction involves the development of advanced statistical and constitutive models that can effectively integrate our correlation analysis findings across different deformation regimes. These models should incorporate the observed rate-dependent energy dissipation patterns and be validated across the full range of observed strain rates ( to ).
Moreover, from this research emerges the need of a deeper investigation of energy dissipation mechanisms. This includes understanding the transition in correlation between and , analyzing the emergence of non-linear relationships at higher deformation levels, and characterizing energy dissipation mechanisms during cyclic loading. Particular attention should be paid to understanding why certain deformation ranges maintain strong correlations while others show significant deviations.
Optimization strategies represent another key area for future research. These should focus on developing solutions to maximize system efficiency while maintaining predictable behavior across different operating conditions.
Finally, material performance enhancement remains a critical objective. Future research should focus on developing materials with more predictable energy dissipation behavior, investigating how composition affects correlation stability, and optimizing materials for specific operating conditions based on statistical indicators. This could lead to materials specifically engineered for applications requiring either high predictability or rapid response capabilities.
5. Conclusions
The systematic investigation of strain rate effects on Ni-Ti SMA sheets revealed several insights into their mechanical and elastocaloric behavior. Through comprehensive analysis across strain rates ranging from to , we established distinct behavioral regimes with significant implications for elastocaloric applications.
The mechanical response demonstrated clear rate dependence, with transformation stresses decreasing as strain rates increased from 1 mm/min to 24 mm/min. This behavior was accompanied by systematic changes in energy dissipation characteristics, revealing predictable thermomechanical interactions at low strain rates.
Statistical analysis revealed strong correlations between energy parameters at low deformation levels ( for tests N = 1, 2, 5, and 6), which progressively weakened at higher deformations ( for test N = 8). This transition suggests fundamental changes in the material’s response mechanisms, with important implications for device design and operation.
Our findings demonstrate that the optimization of elastocaloric cooling systems requires careful consideration of the strain rate-dependent transformation behavior. The observed correlations between mechanical work and energy dissipation provide a framework for predicting material performance under various operating conditions. This understanding enables the development of more efficient cooling devices by allowing precise control of the transformation process through appropriate strain rate selection.
Furthermore, the research establishes a clear relationship between loading conditions and energy conversion mechanisms, suggesting that elastocaloric efficiency can be maximized by tailoring operating parameters to specific application requirements. The identification of distinct behavioral regimes and their associated energy characteristics provides a framework for developing advanced control strategies that can optimize cooling performance while maintaining material stability. These insights advance our understanding of SMA behavior under dynamic loading conditions and establish a framework for the rational design of elastocaloric cooling systems. Future development should focus on exploiting these strain rate dependencies to achieve optimal performance across multiple applications, considering trade-offs between energy efficiency, cycling frequency, and thermal management requirements.


