Article

Calculation of the Localized Surface Plasmon Resonances of Au Nanoparticles Embedded in NiO

1
Materials Science Department, University of Patras, 26504 Patras, Greece
2
Department of Mechanical Engineering, University of Peloponnese, M. Alexandrou 1, 26334 Patras, Greece
*
Author to whom correspondence should be addressed.
Present address: Department of Physics, University of Warwick, Coventry CV4 7AL, UK.
Solids 2022, 3(1), 55-65; https://doi.org/10.3390/solids3010005
Submission received: 27 December 2021 / Revised: 16 January 2022 / Accepted: 24 January 2022 / Published: 28 January 2022
(This article belongs to the Special Issue Feature Papers of Solids 2021)

Abstract

:
The present article examined the influence of size and periodicity of simulated gold (Au) nanoparticles (NPs) embedded in Nickel Oxide (NiO) matrix on localized plasmonic resonances (LSPRs). The scope of this work is to comparatively study the theoretical outcomes exhibited against the experimental results delivered from previous works, including a significant number of simulations and testing of numerous NPs diameter values. A comparison between Au and NiO NPs over silver (Ag) and NiO NPs is also reported to investigate whether the nature of noble metal affects its behavior in terms of LSPRs. The computational results strongly support that the appearance and intensity of LSPRs is straightforward to the increase in the diameter of NPs. The simulation results are in a good agreement with the literature of small NPs, offering the opportunity to further understand the LSPR phenomenon and its more effective implementation to opto-electronic applications. Rigorous Coupled Wave Analysis (RCWA) is performed to stimulate the justification and knowledge of the theoretical conclusions.

1. Introduction

Over the years, the scientific interest has been concentrated on metal’s surface plasmon resonances (SPRs) and localized SPRs or LSPRs (for metallic NPs) since the latest have the unique ability to amplify multiple times the induced electromagnetic field once it is radiated on their surface [1]. This phenomenon prioritizes these metallic NPs as highly remarkable and suitable for a series of operations [2,3,4,5,6,7,8,9,10].
This interest is primarily oriented to the demonstration of the existence and number of Plasmonic Resonances in the UV-Vis spectrum via experimental structures. The scope of this work is to controversially show the appearance of LSPRs generated with the aid of software analysis. This study focuses on the noble metal Au, a promising material according to recent studies, due to the numerous technological applications; it participates, characteristically mentioning the diode and biochemical devices, the bioluminescence and biosensing applications, the electromechanical sensors, the photocatalytic activity, the Metal-Organic Framework, the photocatalytic mechanism for the solar, and photovoltaic production [11,12,13,14,15,16,17,18].
The computational results are discussed with the help of the Rigorous Coupled-Wave Analysis (RCWA) in order to obtain a deeper physical insight. The numerical method applied is the modeling of the RCWA. The absorbance, transmission, and reflection formulas have been interpreted according to [19]. In the Fourier expansion of the permittivity (Equation (1) of [19]), thirteen grating vectors are used in each direction. Calculations with a higher number of grating vectors gave results within the 2% difference.
The advantage of applying the RCWA method over other computational methods is its ability to efficiently handle very large objects that have the same cross section along the z-axis. In RCWA, cubes and cylinders having their axis along the z axis can be effectively treated using almost the same computational time regardless of their length while methods such as the Finite Difference Time Domain (FDTD) or Finite Element (FE) need to increase their mesh linearly as length increases in order to keep the computational time reduced [20].
Among the most important parameters of a nanosized/nanostructured system in order to be applicable is the controllable optical band gap tuning. This tuning is feasible, since the band gap depends strongly on the particle size of the NPs or the thickness of the film and, therefore, it can be changed by properly adjusting the NPs dimensions [21].
The dependence of the geometry of AuNiO NPs in terms of the induction and sizing of LSPRs has been thoroughly investigated in the context of this work. In particular, size and shape variables such as thickness (ti), diameter (d), lattice constant (a), and the conditions between them are some software parameters examined if affecting the optical properties of AuNiO NPs. The demand for the existence of NiO medium is due to the improved gas sensing properties AuNiO NPs exhibit. In particular, the gas sensing result reveals that the response of AuNiO Core-Shell NPs gas sensor is higher than pristine NiO NPs [22,23].
In this work, NPs of d = 2.54 nm−240 nm are simulated and the LSPRs intensity and position are calculated. NPs sizing over 30 nm demonstrate opposite plasmonic features against those when the diameter is less than 25 nm. The main difference observed is the redshift of resonances as the size of Au NPs is increasing.
Significant outcomes also delivered after the comparison of Au nanoscaled particles over the bulk material. When diameter values increase, whether it comes for NPs or bulk material, any shift of the simulated resonances appearing seems to eliminate.
Last but not least, comparative simulations over the plasmonic behavior of AuNiO against AgNiO NPs towards the existence of LSPRs have also been evaluated as part of an overall effort to comprehend the LSPRs induction and scale up this study to other new and modern materials and metal alloys [24].

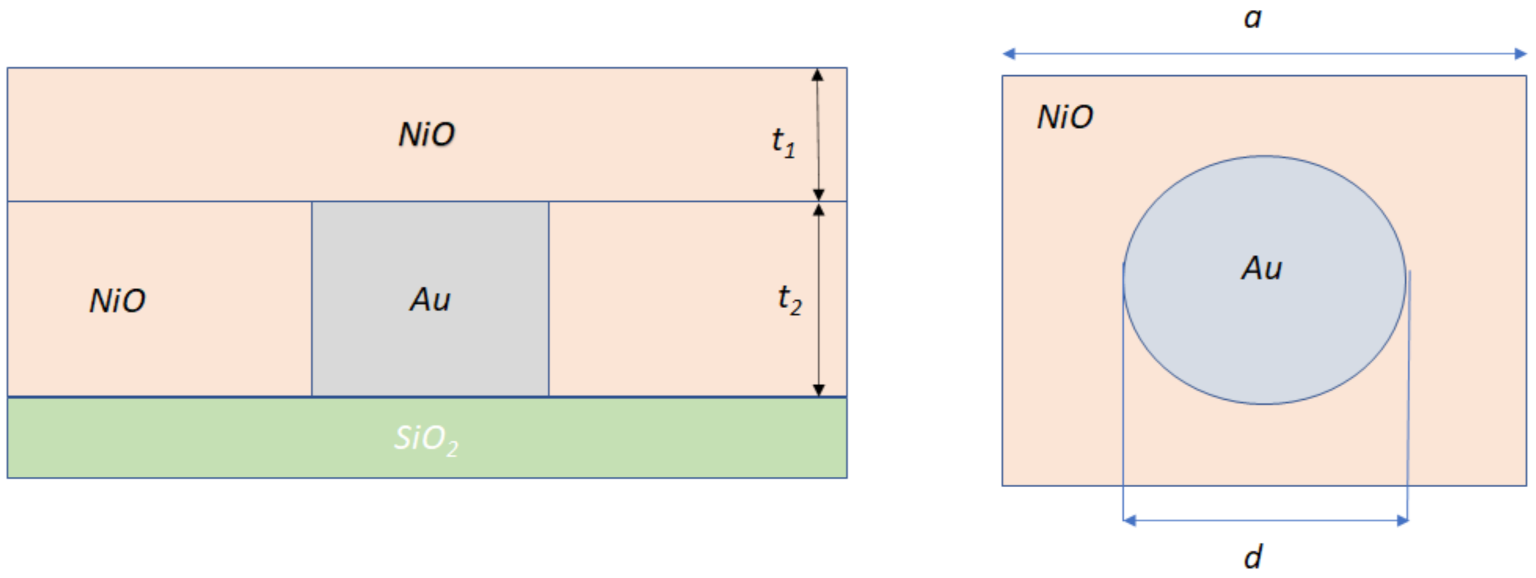
2. Materials and Methods

In this work, the tuning of the geometrical parameters of noble metals Au NPs is investigated whether it has any impact on the induction of resonances. Au was reviewed as a susceptible material [25,26] for the induction of LSPRs it exhibits, and thus was thoroughly investigated in terms of its size. Simulated absorbance spectra results have shown that the dependence of Au existence and intensity of LSPRs is straightforward to the size of NPs. The methodology, and consequently, all results derived, have been based on software calculations. Numerous simulations of diameter have been performed along with the system modeled in order to reach a safe conclusion about the dependence of the increased absorbance values with size and any shift of the resonances to the Infra-Red (IR) or Ultra-Violet (UV) spectrum that might occur. The initial system studied comprises Au NPs on Silicon Dioxide (SiO2) substrate. The NiO dielectric is of total thickness (t1 + t2) nm, with t2 equal to Au NPs thickness. The thickness layer t1 = 30 nm is constant for all cases examined. The diameter values range among 30 nm–240 nm with an increasing rate of 30 nm. The system studied is illustrated in Figure 1. For all cases, t2 = d/2 is applied. In this model, Au NPs are placed directly on SiO2 according to high-resolution transmission electron microscopy images [27]. Au NPs examined are depicted as cylinders placed in lattice in NiO environment. RCWA theory also takes precedence over Mie theory, since the latest only deals with spherical objects [28].

3. Results and Discussion

The “Results and Discussion” part of this work is divided into five (5) main sections, including the (a) analysis of the absorbance spectra against the increasing diameter values for Au NPs of d= 30 nm–240 nm, (b) analysis of the absorbance spectra against the increasing diameter values for Au NPs of d = 2.54 nm–25 nm, (c) comparative study of the simulated LSPRs presence against the plasmonic behavior of Au NPs in precursor NiO thin film as reported in [27], (d) comparative assessment of the behavior of bulk Au NPs against those in the nanoscale, and (e) comparative assessment of the plasmonic behavior of AuNiO NPs towards AgNiO NPs with regards to their increasing size.

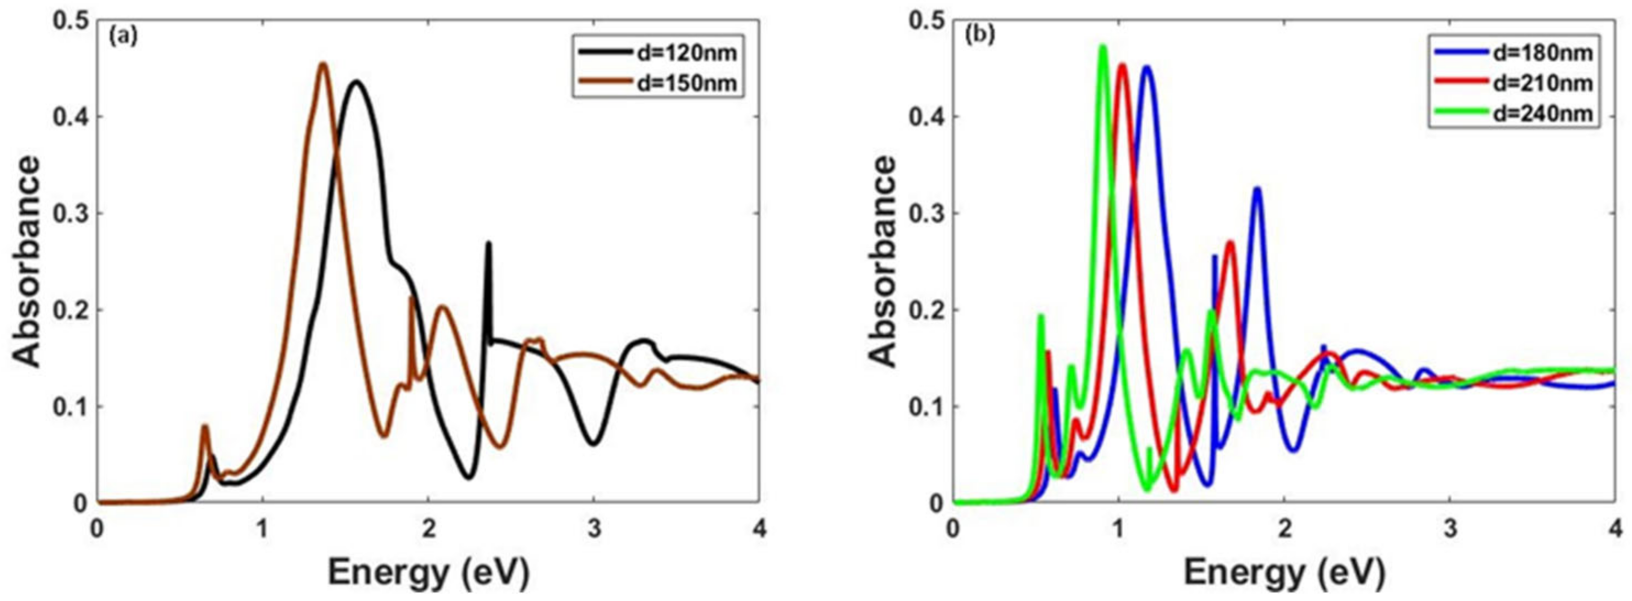
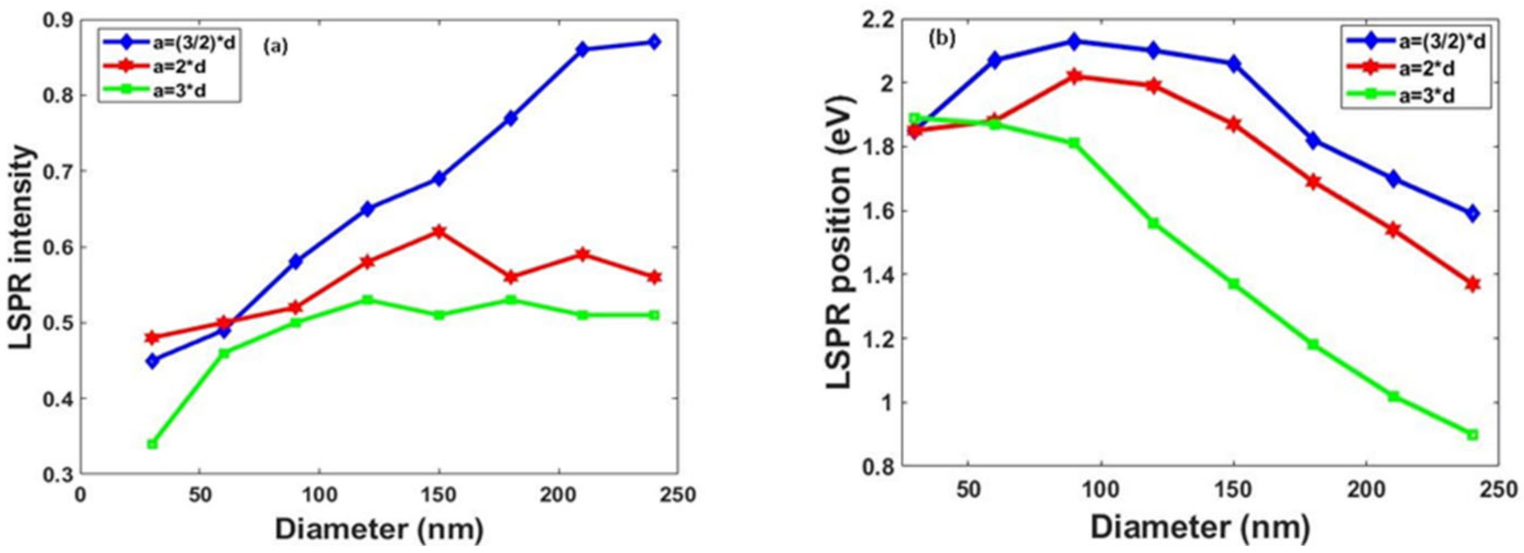
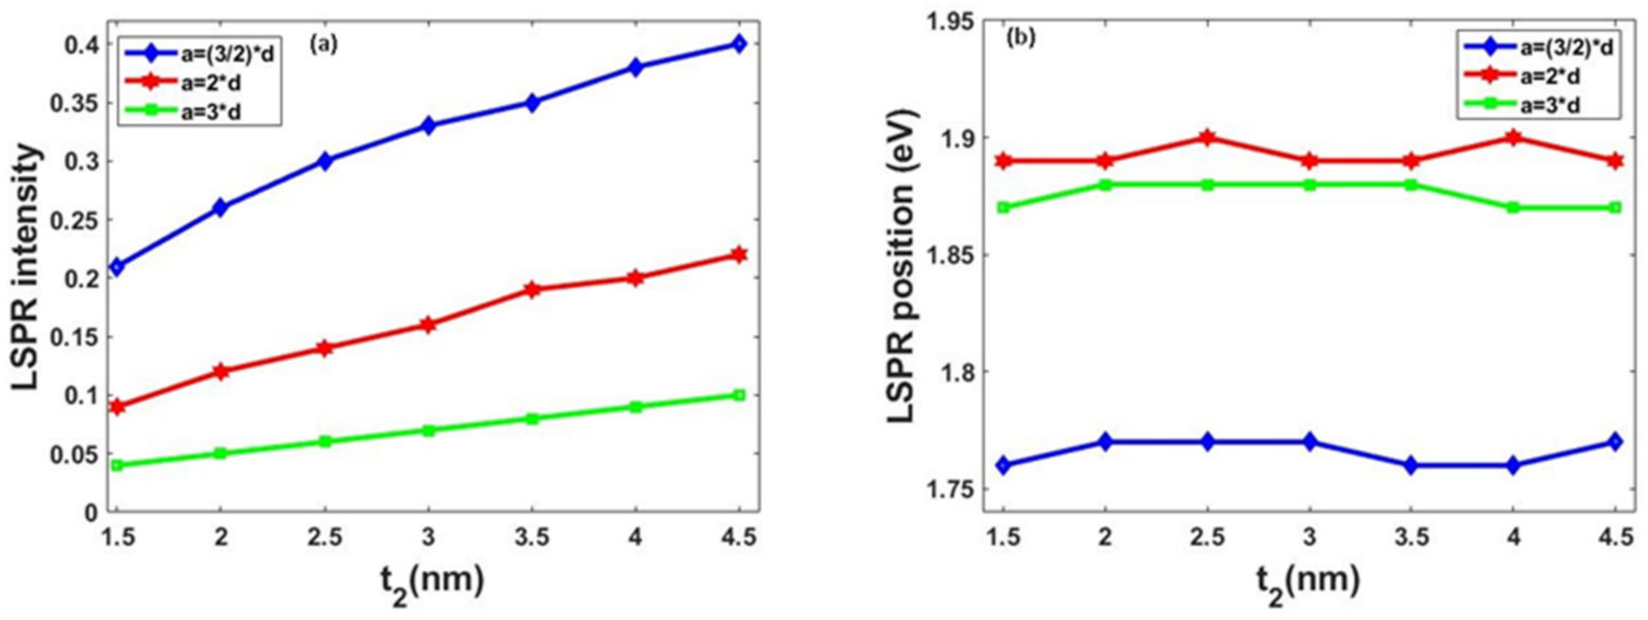
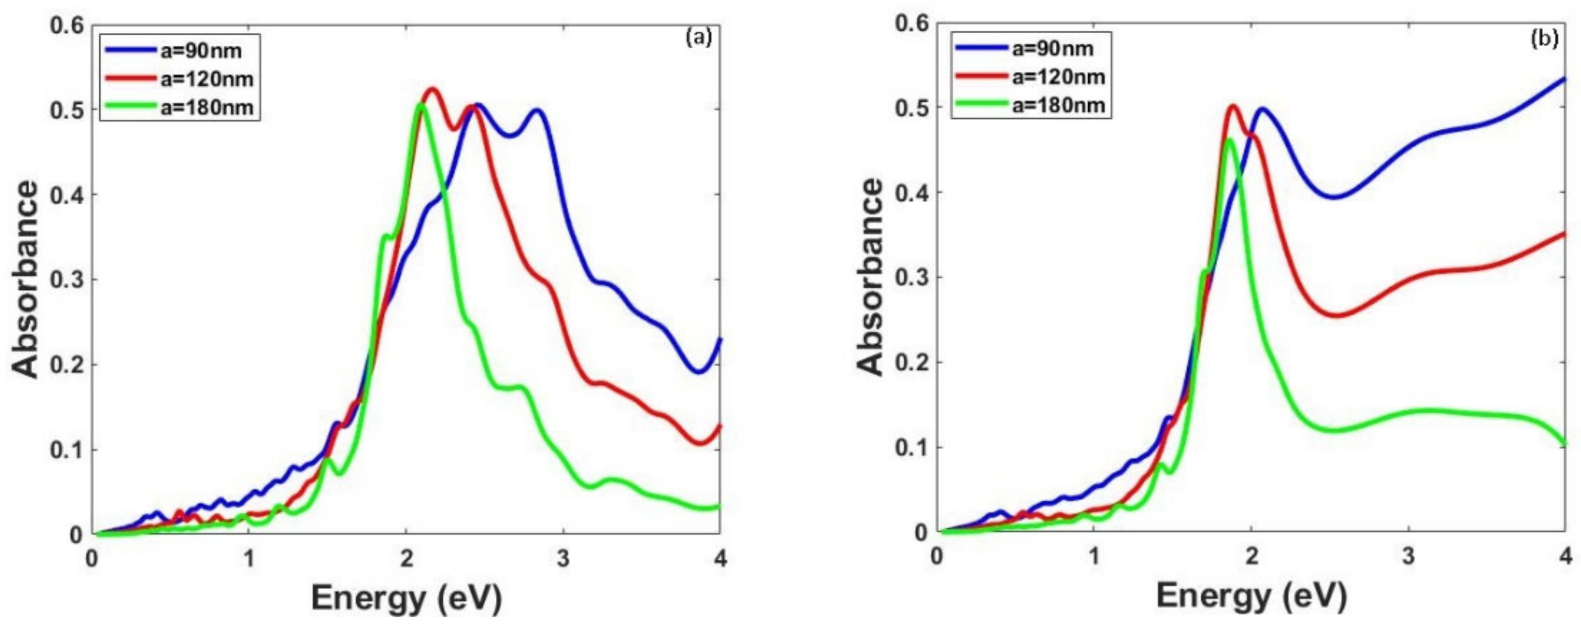
3.1. Plasmonic Behavior with Respect to the Increased Diameter for NPs of d = 30 nm–240 nm

Three (3) different conditions between diameter (d) and lattice constant (a): a = (3/2)d, a = 2d and a = 3d; were fully investigated. This is because experimental self-assembled Au NPs show similar distributions [27]. The absorbance is fairly increased with the increase of diameter for almost all diameter values and conditions, and is in good agreement with the experimental results of [29] since over 10 nm the extinction spectra show features well correlated with size. From the number of data simulated, it is observed that with the increase of diameter, LSPRs are redshifted for the majority of cases. It is worth to mention that with the increase of lattice constant with diameter, especially for a = 3d, LSPRs become sharper, and this could lead to highly sensitive sensors [30]. Figure 2 illustrates the dependence of LSPRs on the bigger values of lattice constant over diameter (a = 3d) of the embedding medium NiO. In this case, besides the LSPRs resonances, there are additional absorbance peaks due to the fact that the periodicity of the structure (a) becomes comparable to the incident wavelength.
For the first three (3) simulations and d = 30 nm, 60 nm, and 90 nm, respectively, resonances are not well defined, not offering a safe conclusion, and consequently not included in the study. For the other simulations examined, specifically for d = 120 nm to 240 nm with increasing step of 30 nm, the absorbance spectra are depicted in Figure 2a,b respectively.
Both figures illustrate the red shift and well formation of resonances with the increasing values of diameter. Despite that absorbance values are stable and measured at approximately 0.45 a.u., for all five (5) graphs, the energy values are shifted from 1.38 eV to 0.9 eV once the diameter values are increased.
LSPR intensity and position is presented in Figure 3a,b, accordingly. LSPR intensity trend has significantly increasing features, at least for a = (3/2)d, but this increase is not that steep when it comes for a = 2d and a = 3d. In addition, LSPR position graph depicts that the smaller the NPs become, the broader the LSPRs. LSPR positions are redshifted while NPs size is increasing for all three (3) cases studied.
Concerning the redshift of LSPRs, it is known that the size parameter and the depolarization field lead to a redshift in the plasmon resonance. The blueshifts of LSPRs might be owed to interparticle coupling and a sample’s homogeneity. Those LSPRs which have no or a slight shift even after doubling the annealing time is due to the fact that the particles become larger, but not so much to decrease the resonance frequency [31].

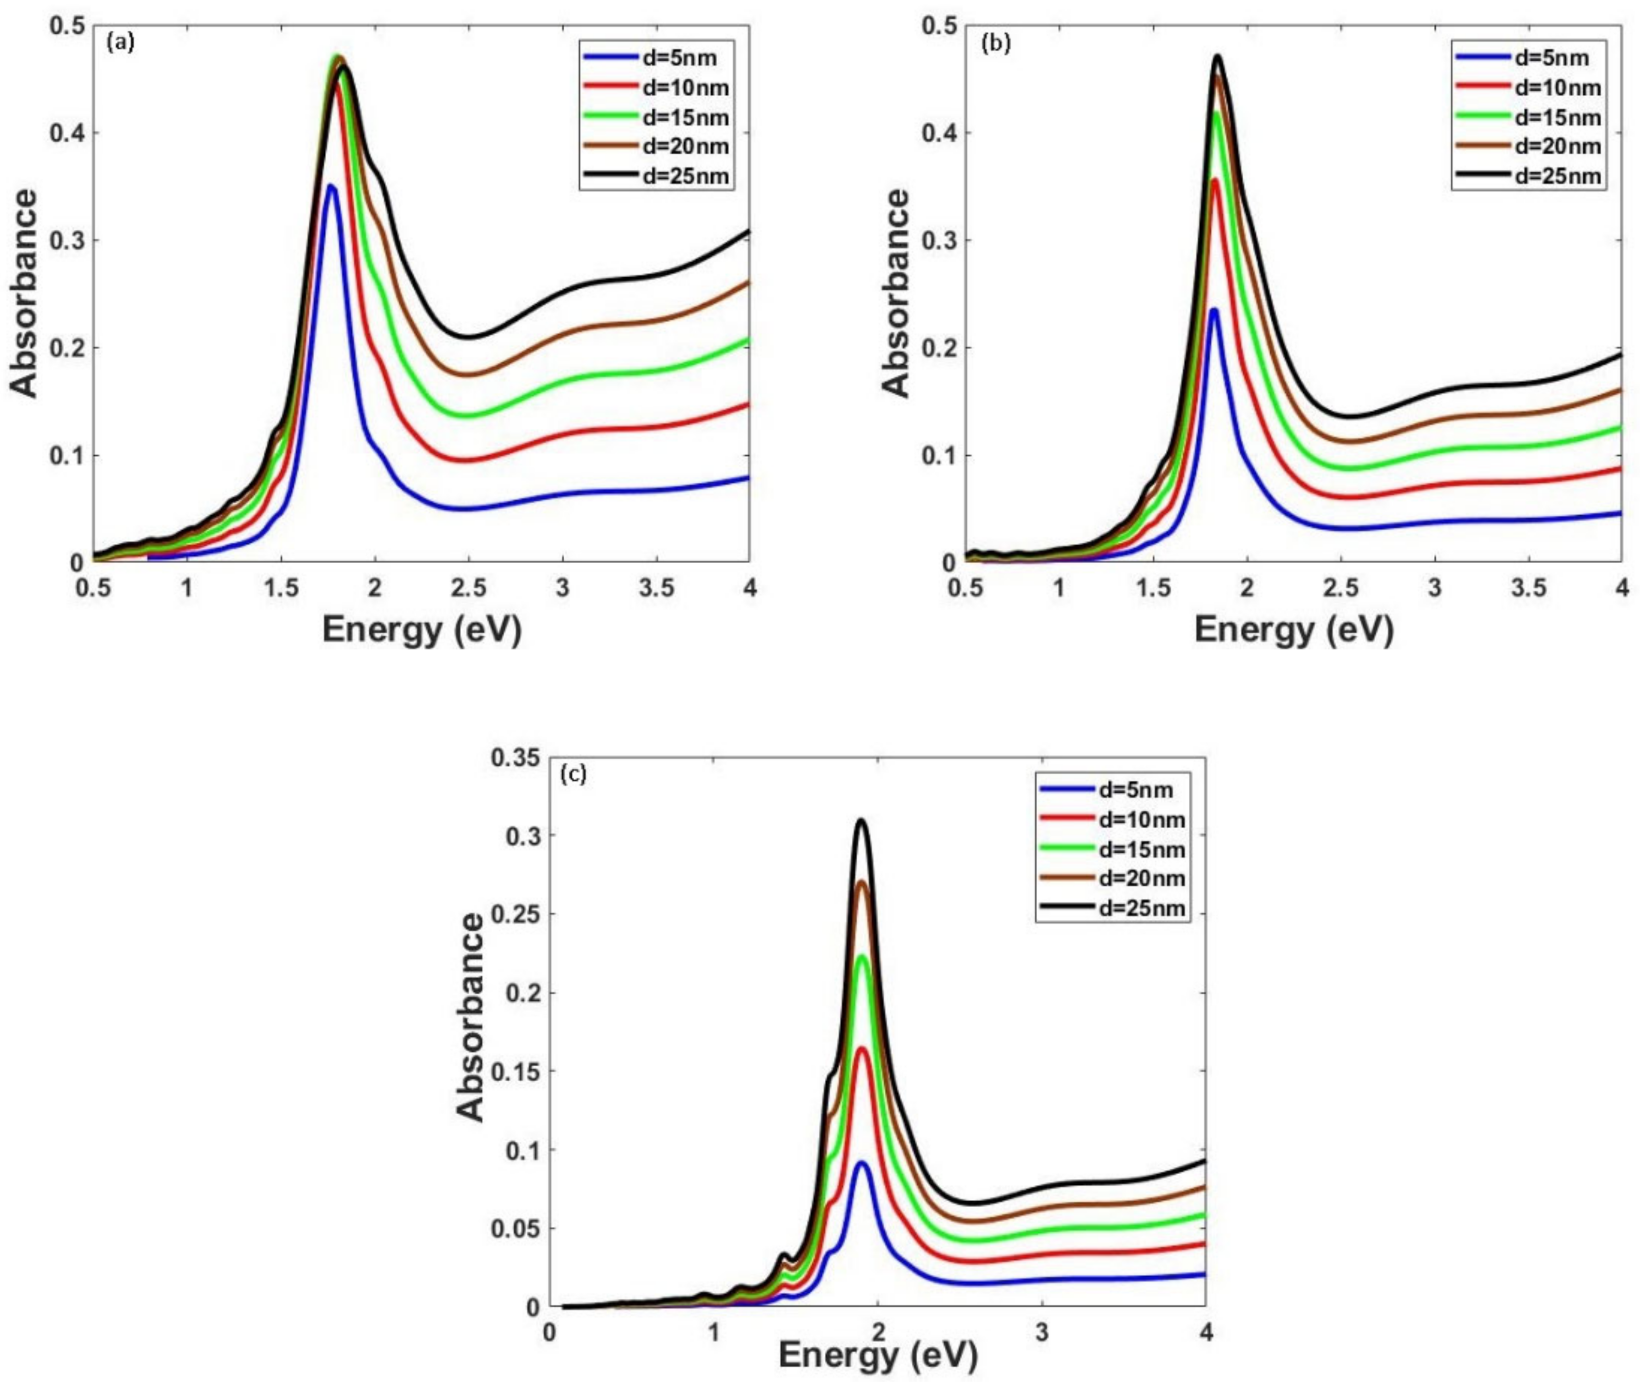
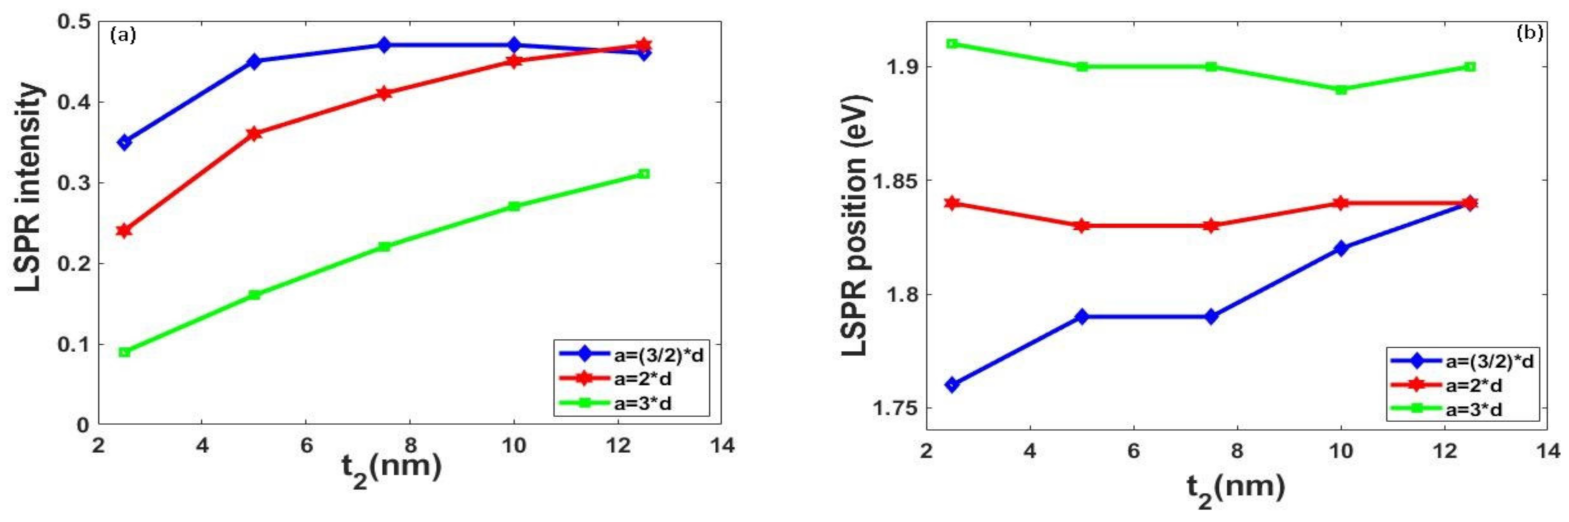
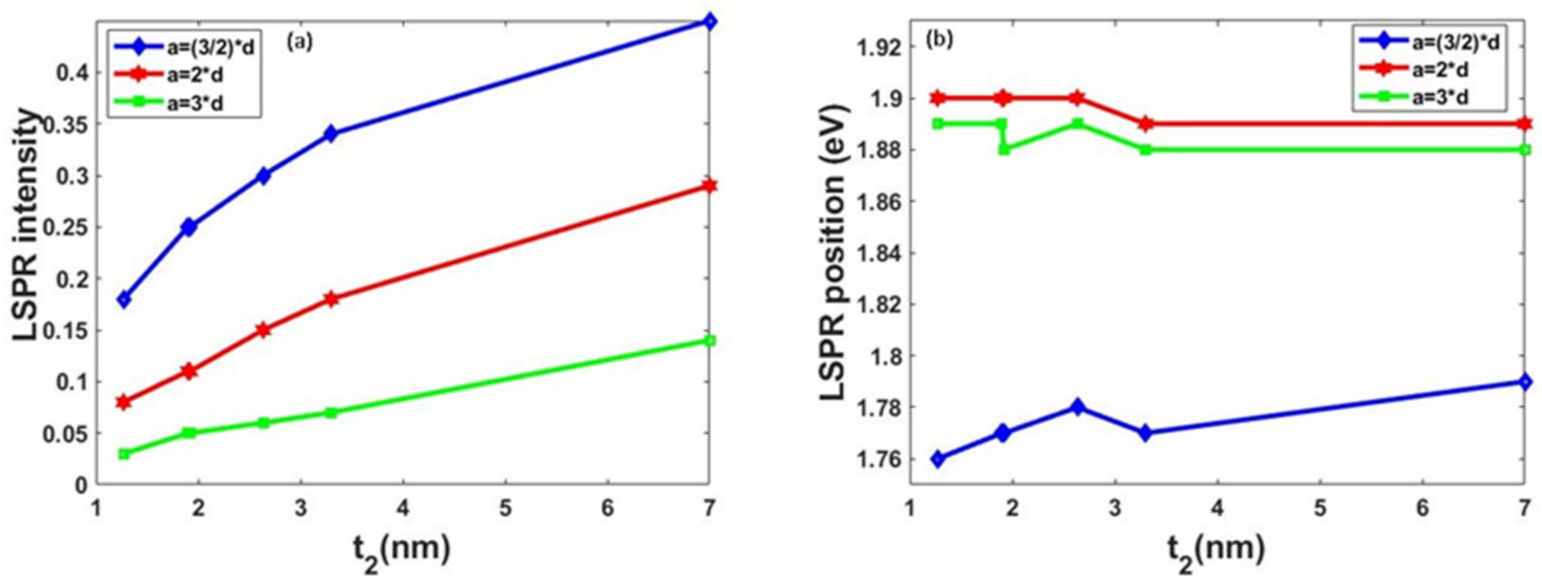
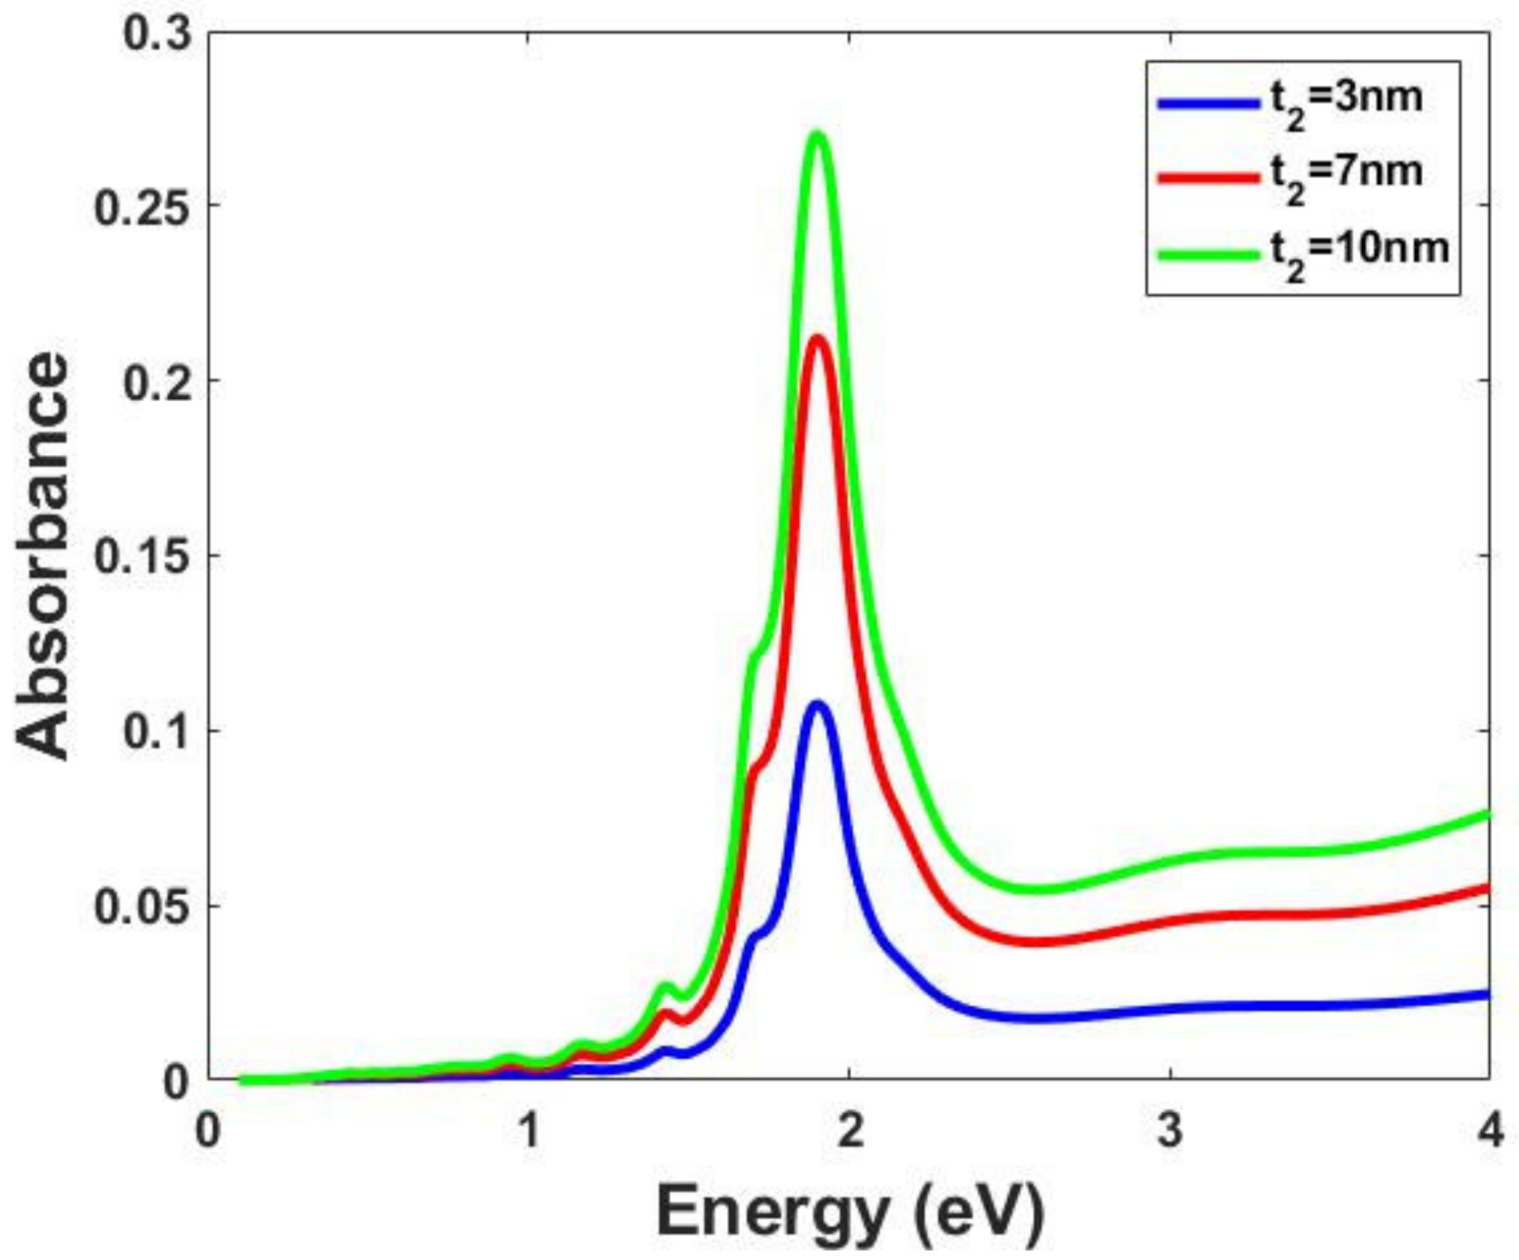
3.2. Plasmonic Behavior with Respect to the Increased Diameter for NPs of d = 2.54 nm–25 nm

Motivated by [32] negotiating the formation of LSPRs due to the presence of Au films by depositing the films at elevated temperatures, this work advances the analysis of LSPRs size dependence for smaller, compared to those reported in Section 3.1 NPs. Two sets of measurements were simulated. For the first set, diameter values ranged from 5 nm to 25 nm, and for the second set, the diameter values were accordingly: d = 2.54 nm, 3.8 nm, 3.84 nm, 5.27 nm, 6.6 nm, and 14 nm, as reported in [32]. Especially for the second set of values, (t2) thickness was first simulated for t2 = d/2 and secondly random relation between d and t2 was applied. The scope of these two different scenarios was not only to compare the results derived but also to investigate how a non-linear relation between thickness and diameter may affect the intensity of LSPRs. The results produced concerning the characteristics of resonances are of significant interest. In particular, for a = 3d (Figure 4c) the biggest absorbance values drop down is observed, when compared for a= (3/2)d and a = 2d. The max absorbance value, for d = 25 nm and a = 3d, is 0.31 a.u, the lowest value of all absorbance values. The increase of absorbance values is observed for all three (3) conditions between a and d investigated with regards to the increase in diameter, and practically no shift of resonances is noticed.
For d = 5 nm to 25 nm and t2 = d/2, LSPR intensity features depicted in Figure 5a show similar characteristics to those for the NPs as reported in Section 3.1, but the increase in absorbance for d = 5 nm to 25 nm is significantly raised, as illustrated in Figure 3a.
LSPR position shift, depicted in Figure 5b, behaves in a totally different manner, related to the LSPR intensity features of NPs reported in Section 3.1, resulting some blueshift of resonances at least for a = (3/2)d and a = 2d.
The absorbance spectra of NPs for d = 2.54 nm, 3.8 nm, 3.84 nm, 5.27 nm, 6.6 nm, 14 nm, and t2 = d/2 initially and secondly when random relation relates d and a were also exploited to further understand the origin of resonances due to diameter values changes.
Simulation results do confirm that the absorbance is increased with the increase of thickness independently of any relation that may connect thickness with diameter.
Computational results also support the experimental ones since the position of the LSPRs shows an almost monotonous increase with the increasing nanoparticle size. Figure 6a,b present the LSPR intensity and LSPR position trend over the increase of thickness for d = 2.54 nm, 3.8 nm, 3.84 nm, 5.27 nm, 6.6 nm, 14 nm, and t2 = d/2.
The LSPR intensity and position over t2 depicted in Figure 5a,b and Figure 6a,b, behave similarly, meaning that LSPRs with increasing values of absorbance are induced due to the presence of Au NPs when the size of the latest is moderate. When diameter ranges from 2.54 nm to 25 nm, the absorbance rate is growing linearly with t2. On the contrary, a further increase in diameter starting from d = 30 nm leads to the opposite results of the reduction in the absorbance, and in some cases, the steer dropdown of the LSPR position as illustrated in Figure 3b. This is observed when lattice constant has the biggest values against diameter (a = 3d). Besides that, when thickness is independent of diameter, the absorbance spectrum shows limited deviation from the original graph when t2 depends on d.
Summarizing the theoretical results, the optical properties of NPs, the diameter of which ranges among 2.5 nm−25 nm, are in a different way than those of NPs when d = 30 nm−240 nm. Although LSPR intensity exhibits a growing trend for all NPs, and in some cases the absorbance value of the largest NP is doubled the absorbance values of the smallest NP Figure 5a and Figure 6a, LSPR position values either remain constant, or show very limited decrease, at least not showing dramatic drop down when it comes for the NPs of d = 30 nm−240 nm. The importance of the results delivered is applied to the fact that the size and shape of metallic NPs are significant parameters towards the tailoring of resonances.

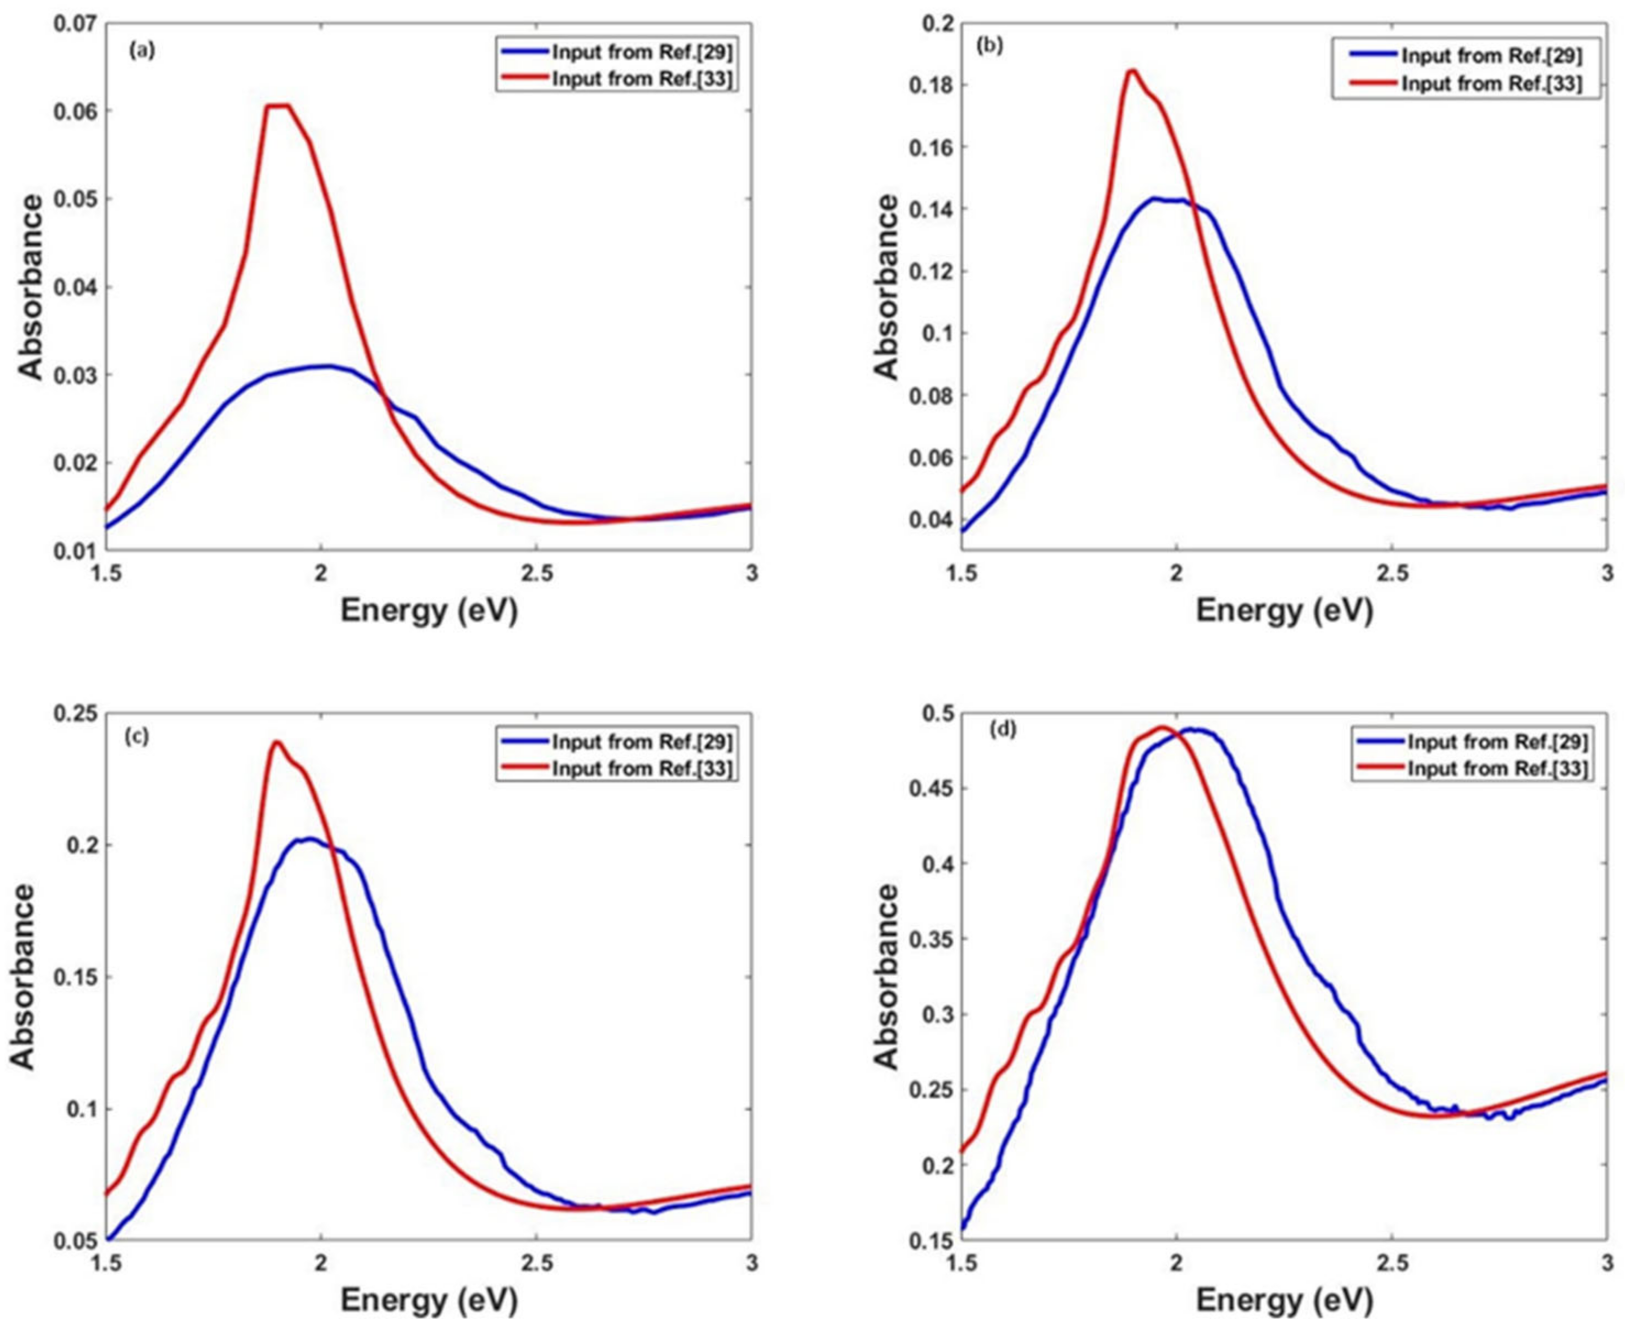
3.3. Plasmonic Behavior with Respect to the Formation of Au NPs into Precursor NiO Environment

The theoretical approach for LSPRs of Au NPs surrounded by NiO under incomplete vacuum conditions reported in [27] is attempted in the context of this part. Special focus was given to the films with initial thickness of 3 nm, 7 nm, and 10 nm. The outcomes of [27] exhibit the formation of well-defined LPRS along with increasing values of the absorbance.
Figure 7 illustrates the simulated results of resonances for Au NPs of t2 = 3 nm, 7 nm, and 10 nm, which confirm the experimental results in terms of the increasing thickness values against a significant increase in the absorbance values. All three (3) resonances are also well defined.
The LSPRs of experimental results are located at about 2.1–2.3 eV. The Blue-shift of resonances simulated to 1.9eV may be attributed to the presence of substrate SiO2.
To further capitalize the behavior of the Au films of t2 = 3 nm, Au NPs of t2 = 1.5 nm to 4.5 nm, with increasing step of 0.5 nm, were also tested. The results show a very moderate increase of LSPR position, but LSPR intensity increases at least for a = (3/2)d and a = 2d as presented in Figure 8a,b.

3.4. Plasmonic Behavior Comparison of NPs against Bulk Materials

Interesting results also derived from the comparative study of Au bulk materials against those in the nanoscale. In particular, values of the real and imaginary part of complex refractive index, N = n + ik, as function of diameter (d), were first exported from [29] and then compared to the values of Au as reported in [33].
The Au NPs of d = 2 nm, 7 nm, 10 nm and 50 nm Figure 9a–d, respectively, were examined. The general conclusion resulted for all four (4) cases is the blue shift of resonances for the NPs along with a considerable increase in absorbance with the increase in diameter. This blue shift brings the calculations based on input values from [29] closer to the experimental data of [27].
When increasing the diameter values, (Figure 9d), the shift between resonances tends to disappear. However, for NPs with a very small diameter, the absorbance becomes significantly smaller.
The bigger differences between the two figures in Figure 9a are due to the small value of absorbance. The differences are much smaller for the transmittance. More specifically, the transmission drops from 0.91 to 0.81, for 1.5 and 4 eV, respectively. While the differences between two inputs [29,33] are less than 5%.

3.5. Plasmonic Comparison of AuNiO against AgNiO

Plasmonic properties of AuNiO NPs, examined in Section 3.1, against those of AgNiO are studied in this section. Noble metals Ag and Au are chosen in purpose, since they both exhibit strong plasmonic responses under visible illumination [34,35,36].
So, any further understanding of their behavior may support and fasten the scientific effort for the discovery or synthesis of new materials and new devices. Comparison results revealed that Au shows a better plasmonic behavior in terms of LSPRs formation, as illustrated in Figure 10a,b.
In particular, the presence of Ag in the NiO environment is responsible for two (2) resonances, at least for a = 90 nm and a = 120 nm, opposed to the presence of Au, responsible for one resonance. The increase of lattice constant values and consequently the increase of diameter values is responsible for the redshift of resonances for both metals.
Absorbance values show no differences for both metals, but a redshift of LSPRs position for Au resonances is monitored against Ag resonances. Au NPs are better formed against those of Ag NPs. The more intense SPRs of Ag combined with the better compatibility and easier synthesis of Au NPs indicate that these novel structures could be highly suitable for surface enhanced Raman scattering [37]. Additionally, the enhancement of many physical properties due to LSPRs in, for example, the light-emitting diodes (LEDs) devices is an important issue; therefore, nanostructures like those of Ag are more likely of being a potential candidate in applications [1].

4. Conclusions

In this work, we comparatively study the plasmonic behavior of different size simulated Au NPs into NiO environment, the diameter values of which range from d = 2.54 nm to 240 nm, with regards to the increasing values of absorbance and LSPR induction. This work has been performed, with respect to the RCWA theory, satisfactorily reproducing the experimental results of relevant articles, also oriented into the plasmonic behavior of Au NPs. Interesting results were exported for all cases examined. Au NPs between 30 nm−240 nm result the redshift of their resonances in the UV-Vis spectrum once their size is increasing, performance not applied when investigating Au NPs sizing between 2.54 nm−25 nm. For that geometry, NPs present opposite behavior features in terms of resonances intensity and position. The simulation comparison results for bulk and NPs for Au practically exhibit no absorbance shift when it comes for bigger sized NPs. Last but not least, the tunable LSPRs characteristics for both noble Au and Ag examined do support all previous results that the controllable tuning of the size of materials ranging into the nanoscale does affect the existence and presence of LSPRs, a significant parameter towards the design of new materials and new technological applications.

Author Contributions

Conceptualization, P.P.; methodology, M.S. and P.P.; software, M.T. and A.G.C.; validation, M.T. and A.S.; formal analysis, M.T., A.G.C. and A.S.; investigation, M.T.; resources, M.S. and P.P.; data curation, M.T. and M.S.; writing—original draft preparation, M.T.; writing—review and editing, A.G.C., M.S. and P.P.; visualization, A.S. and S.G.; supervision, M.S. and P.P.; project administration, S.G.; funding acquisition, M.S. All authors have read and agreed to the published version of the manuscript.

Funding

This work was partially financed by the European Union and Greek national funds through the Operational Program Competitiveness, Entrepreneurship and Innovation, under the call RESEARCH–CREATE–INNOVATE (Project code: T1EDK-04659).

Institutional Review Board Statement

Not applicable.

Informed Consent Statement

Not applicable.

Data Availability Statement

Data sharing not applicable.

Conflicts of Interest

The authors declare no conflict of interest.

Sample Availability

Samples of the compounds are available from the authors.

References

  1. Stamatelatos, A.; Tsarmpopoulou, M.; Chronis, A.G.; Kanistras, N.; Anyfantis, D.I.; Violatzi, E.; Geralis, D.; Sigalas, M.M.; Poulopoulos, P.; Grammatikopoulos, S. Optical interpretation for plasmonic adjustment of nanostructured Ag-NiO thin films. Int. J. Mod. Phys. B 2021, 35, 2150093. [Google Scholar] [CrossRef]
  2. Hutter, E.; Fendler, J.H. Exploitation of localized surface plasmon resonance. Adv. Mater. 2004, 16, 1685–1706. [Google Scholar] [CrossRef]
  3. Haes, A.J.; Hall, W.P.; Chang, L.; Klein, W.L.; Van Duyne, R.P. A Localized surface plasmon resonance biosensor: First steps toward an assay for Alzheimer’s disease. Nano Lett. 2004, 4, 1029–1034. [Google Scholar] [CrossRef]
  4. Guo, C.; Sun, T.; Cao, F.; Liu, Q.; Ren, Z. Metallic nanostructures for light trapping in energy-harvesting devices. Light Sci. Appl. 2014, 3, e161. [Google Scholar]
  5. Zhu, W.; Esteban, R.; Borisov, A.G.; Baumberg, J.J.; Nordlander, P.; Lezec, H.J.; Aizpurua, J.; Crozier, K.B. Quantum mechanical effects in plasmonic structures with subnanometre gaps. Nat. Commun. 2016, 7, 11495. [Google Scholar] [CrossRef]
  6. Yang, Q.; Guo, X.; Wang, W.; Zhang, Y.; Xu, S.; Lien, D.H.; Wang, Z.L. Enhancing sensitivity of a single ZnO micro-/nanowire photodetector by piezo-phototronic effect. ACS Nano 2010, 4, 6285–6291. [Google Scholar] [CrossRef]
  7. Pan, C.; Dong, L.; Zhu, G.; Niu, S.; Yu, R.; Yang, Q.; Liu, Y.; Wang, Z.L. High-resolution electroluminescent imaging of pressure distribution using a piezoelectric nanowire LED array. Nat. Photonics 2013, 7, 752–758. [Google Scholar] [CrossRef]
  8. Tatsuma, T.; Katagi, Y.; Watanabe, S.; Akiyoshi, K.; Kawawaki, T.; Nishi, H.; Kazuma, E. Direct output of electrical signals from LSPR sensors on the basis of plasmon-induced charge separation. Chem. Commun. 2015, 51, 6100. [Google Scholar] [CrossRef] [Green Version]
  9. Yao, M.; Shen, P.; Liu, Y.; Chen, B.; Guo, W.; Ruan, S.; Shen, L. Performance improvement of polymer solar cells by surface-energy-induced dual plasmon resonance. ACS Appl. Mater. Interfaces 2016, 8, 6183–6189. [Google Scholar] [CrossRef]
  10. Bernardi, M.; Palummo, M.; Grossman, J.C. Extraordinary sunlight absorption and one nanometer thick photovoltaics using two-dimensional monolayer materials. Nano Lett. 2013, 13, 3664–3670. [Google Scholar] [CrossRef]
  11. Kocyigit, A.; Orak, I.; Çaldıran, Z.; Turut, A. Current–voltage characteristics of Au/ZnO/n-Si device in a wide range temperature. J. Mater. Sci. Mater. Electron. 2017, 28, 17177–17184. [Google Scholar] [CrossRef]
  12. Belleti, E.; Bevilaqua, V.R.; Brito, A.M.M.; Modesto, D.A.; Lanfredi, A.J.C.; Viviani, V.R.; Nantes-Cardoso, I.L. Synthesis of bioluminescent gold nanoparticle–luciferase hybrid systems for technological applications. Photochem. Photobiol. Sci. 2021, 20, 1439–1453. [Google Scholar] [CrossRef] [PubMed]
  13. Pallavicini, P.; Chirico, G.; Taglietti, A. Harvesting light to produce heat: Photothermal nanoparticles for technological applications and biomedical devices. Chem. Eur. J. 2021, 27, 15361–15374. [Google Scholar] [CrossRef] [PubMed]
  14. Xiao, T.; Huang, J.; Wang, D.; Meng, T.; Yang, X. Au and Au-Based nanomaterials: Synthesis and recent progress in electrochemical sensor applications. Talanta 2020, 206, 120210. [Google Scholar] [CrossRef] [PubMed]
  15. JinJung, H.; Koutavarapu, R.; Seulki, L.; HyunKim, J.; ChulChoib, H.; Myong-yong, C. Enhanced photocatalytic activity of Au-doped Au@ZnO core-shell flower-like nanocomposites. J. Alloy. Compd. 2018, 735, 2058–2066. [Google Scholar] [CrossRef]
  16. Burtch, N.C.; Heinen, J.; Bennett, T.D.; Dubbeldam, D.; Allendorf, M.D. Mechanical properties in metal–organic frameworks: Emerging opportunities and challenges for device functionality and technological applications. Adv. Mater. 2018, 30, 1704124. [Google Scholar] [CrossRef]
  17. Cui, X.; Qin, F.; Ruan, O.; Zhuo, Z.; Wang, J. Circular gold nanodisks with synthetically tunable diameters and thicknesses. Adv. Funct. Mater. 2018, 28, 1705516. [Google Scholar] [CrossRef]
  18. Humayuna, M.; Fu, Q.; Zheng, Z.; Li, H.; Luo, W. Improved visible-light catalytic activities of novel Au/P-doped g-C3N4 photocatalyst for solar fuel production and mechanism. Appl. Catal. A Gen. 2018, 568, 139–147. [Google Scholar] [CrossRef]
  19. Moharam, M.G.; Gaylord, T.K. Rigorous coupled-wave analysis of metallic surface-relief gratings. J. Opt. Soc. Am. 1986, 3, 1780. [Google Scholar] [CrossRef]
  20. Stamatelatos, A.; Sousanis, A.; Chronis, A.G.; Sigalas, M.M.; Grammatikopoulos, S.; Poulopoulos, P. Analysis of localized surface plasmon resonances in gold nanoparticles surrounded by copper oxides. J. Appl. Phys. 2018, 123, 083103. [Google Scholar] [CrossRef]
  21. Pappas, S.D.; Grammatikopoulos, S.; Poulopoulos, P.; Trachylis, D.; Velgakis, M.J.; Politis, C. Growth and optical properties of thin NiO films. J. Surf. Interfaces Mater. 2014, 2, 233–237. [Google Scholar] [CrossRef]
  22. Manohar Majhi, S.; Gautam Kumar, N.; Hu-Jun, L.; Ho-Geun, S.; Cheul-Ro, L.; In-Hwan, L.; Yeon-Tae, Y. Au@NiO core-shell nanoparticles as a p-type gas sensor: Novel synthesis, characterization, and their gas sensing properties with sensing mechanism. Sens. Actuators B Chem. 2018, 268, 223–231. [Google Scholar] [CrossRef]
  23. Mattei, G.; Mazzoldi, P.; Post, M.L.; Buso, D.; Guglielmi, M.; Martucci, A. Cookie-like Au/NiO nanoparticles with optical gas-sensing properties. Adv. Mater. 2007, 19, 561–564. [Google Scholar] [CrossRef]
  24. Ntemogiannis, D.; Tsarmpopoulou, M.; Chronis, A.; Anyfantis, D.; Barnasas, A.; Grammatikopoulos, S.; Sigalas, M.; Poulopoulos, P. On the localized surface plasmonic resonances of AgPd alloy nanoparticles by experiment and theory. Coatings 2021, 11, 893. [Google Scholar] [CrossRef]
  25. Dunklin, J.R.; Bodinger, C.; Forcherio, G.T.; Roper, D.K. Plasmonic extinction in gold nanoparticle-polymer films as film thickness and nanoparticle separation decrease below resonant wavelength. J. Nanophotonics 2017, 11, 016002. [Google Scholar] [CrossRef]
  26. Maurer, T.; Nicolas, R.; Lévêque, G.; Subramanian, P.; Proust, J.; Béal, J.; Schuermans, S.; Vilcot, J.-P.; Herro, Z.; Kazan, M.; et al. Enhancing LSPR sensitivity of Au gratings through graphene coupling to Au film. Plasmonics 2014, 9, 507–512. [Google Scholar] [CrossRef] [Green Version]
  27. Grammatikopoulos, S.; Stamatelatos, A.; Delimitis, A.; Sousanis, A.; Chrisanthopoulou, A.; Trachylis, D.; Politis, C.; Poulopoulos, P. Growth of Au nanoparticles in NiO via short annealing of precursor material thin film and optimization of plasmonics. Phys. Status Solidi A 2017, 214, 1700303. [Google Scholar] [CrossRef]
  28. Mie, G. Beiträge zur Optik trüber Medien, speziell kolloidaler Metallösungen. Ann. Phys. 1908, 330, 377. [Google Scholar] [CrossRef]
  29. Scaffardi, L.B.; Pellegri, N.; Sanctis, O.; Tocho, J.O. Sizing gold nanoparticles by optical extinction spectroscopy. Nanotechnology 2005, 16, 158–163. [Google Scholar] [CrossRef]
  30. Crossland, E.J.W.; Noel, N.; Sivaram, V.; Leijtens, T.; Alexander-Webber, J.A.; Snaith, H.J. Mesoporous TiO2 single crystals delivering enhanced mobility and optoelectronic device performance. Nature 2013, 495, 215–219. [Google Scholar] [CrossRef]
  31. Chronis, A.G.; Stamatelatos, A.; Grammatikopoulos, S.; Sigalas, M.M.; Karoutsos, V.; Maratos, D.M.; Lysandrou, S.P.; Trachylis, D.; Politis, C.; Poulopoulos, P. Microstructure and plasmonic behavior of self-assembled silver nanoparticles and nanorings. J. Appl. Phys. 2019, 125, 023106. [Google Scholar] [CrossRef]
  32. Grammatikopoulos, S.; Pappas, S.D.; Dracopoulos, V.; Poulopoulos, P.; Fumagalli, P.; Velgakis, M.J.; Politis, C. Self-assembled Au nanoparticles on heated corning glass by Dc magnetron sputtering: Size-dependent surface plasmon resonance tuning. J. Nanoparticle Res. 2013, 15, 1446. [Google Scholar] [CrossRef] [Green Version]
  33. Palik, E.D. Handbook of Optical Constants of Solids; Academic Press: London, UK, 1998. [Google Scholar]
  34. Liu, P.; Yang, B.; Liu, G.; Wu, R.; Zhang, C.; Wan, F.; Li, S.; Yang, J.; Gao, Y.; Zhou, C. Improving power conversion efficiency of perovskite solar cells by cooperative LSPR of gold-silver dual nanoparticles. Chin. Phys. B 2017, 26, 058401. [Google Scholar] [CrossRef]
  35. Sarina, S.; Waclawi, E.R.; Zhu, H. Photocatalysis on supported gold and silver nanoparticles under ultraviolet and visible light irradiation. Green Chem. 2013, 15, 1814–1833. [Google Scholar] [CrossRef]
  36. Pavaskar, P.; Kai Hsu, I.; Theiss, J.; Hsuan Hung, W.; Cronin, S.B. A microscopic study of strongly plasmonic Au and Ag island thin films. J. Appl. Phys. 2013, 113, 034302. [Google Scholar] [CrossRef] [Green Version]
  37. Peña-Rodríguez, O.; Pal, U. Enhanced plasmonic behavior of bimetallic (Ag-Au) multilayered spheres. Nanoscale Res. Lett. 2011, 6, 279. [Google Scholar] [CrossRef] [Green Version]
Figure 1. Side and Top view of the AuNiO examined system.
Solids 03 00005 g001
Figure 2. Size-dependent LSPRs for a = 3d and (a) d = 120 nm & 150 nm; (b) d = 180 nm–240 nm.
Solids 03 00005 g002
Figure 3. Size dependent LSPRs (a) intensity; (b) position for d = 30 nm–240 nm.
Solids 03 00005 g003
Figure 4. Size dependent LSPRs for d = 5 nm–25 nm and (a) a = (3/2)d; (b) a = 2d; (c) a = 3d.
Solids 03 00005 g004
Figure 5. Size dependent LSPRs (a) intensity; (b) position for d = 5 nm–25 nm.
Solids 03 00005 g005
Figure 6. Size dependent LSPRs (a) intensity; (b) LSPRs position for d = 2.54 nm, 3.8 nm, 3,84 nm, 5.27 nm, 6.6 nm, 14 nm.
Solids 03 00005 g006
Figure 7. LSPRs formation for Au NPs when t2 = 3 nm, 7 nm, 10 nm.
Solids 03 00005 g007
Figure 8. (a) Absorbance changes; (b) Energy changes over t2 when t2 = 1.5 nm–4.5 nm.
Solids 03 00005 g008
Figure 9. Absorbance spectrum over Energy for Ag NPs, when d = 2, 7, 10 and 50 nm, for the cases (ad), respectively. Comparison between input [29] and input [33].
Solids 03 00005 g009
Figure 10. Absorbance spectrum over energy for (a) Ag in NiO environment; (b) Au in NiO environment.
Solids 03 00005 g010
Publisher’s Note: MDPI stays neutral with regard to jurisdictional claims in published maps and institutional affiliations.

