Article

MOF@chitosan Composites with Potential Antifouling Properties for Open-Environment Applications of Metal-Organic Frameworks

1
Institut für Anorganische Chemie und Strukturchemie, Heinrich-Heine-Universität, D-40204 Düsseldorf, Germany
2
Institut für Pharmazeutische Biologie und Biotechnologie, Heinrich-Heine-Universität, D-40204 Düsseldorf, Germany
*
Author to whom correspondence should be addressed.
Solids 2022, 3(1), 35-54; https://doi.org/10.3390/solids3010004
Submission received: 28 December 2021 / Revised: 20 January 2022 / Accepted: 21 January 2022 / Published: 27 January 2022

Abstract

:
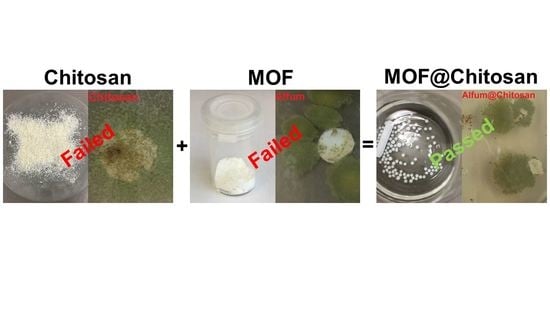
Metal-organic frameworks (MOFs) are promising materials for a myriad of applications because of their easy synthesis and large variability through the organic linker. For open-environment applications, the organic content can, however, give rise to fouling, that is, biofilm formation. Biofilms can destroy the MOF and reduce the sorption capacity. Therefore, it is necessary to formulate MOFs for open-environment application to avoid the growth of microorganisms. Chitosan is a polysaccharide biopolymer, obtained from chitin shells of shrimps by alkaline deacetylation, and has known fungistatic properties. Here, chitosan is used as a matrix for MOF@chitosan composites with different aluminum-based MOFs to implement the fungistatic effect of chitosan to MOFs. The obtained composites with the highest possible MOF loadings of up to 90% were tested according to DIN EN ISO 846 to examine the fungistatic material properties against the fungi Chaetomium globosum and Aspergillus falconensis.

Graphical Abstract

1. Introduction

Metal-organic frameworks (MOFs) consist of metal clusters, also called secondary building units (SBUs), and bridging organic ligands, also called linkers [1,2]. MOFs are microporous materials with highly tunable properties through their broad variability of metals and linkers [3,4] and a wide field of potential applications [5], such as gas separation [6,7], and storage [8], drug delivery [9,10], catalysis [11], heat transformation, etc. [12,13,14,15,16,17,18,19,20]. Still, for realistic applications, the initially microcrystalline MOF powders must be formulated or shaped into composites with polymers [21,22,23,24,25]. Furthermore, for the application of porous MOFs under ambient, open-environment conditions in the presence of air and moisture, not only must their hydrothermal stability be considered but also their resistance to antifouling needs to be addressed. A particularly relevant case for the antifouling behavior of MOFs is their use for cyclic water sorption from air for dehumidification [26], including water-harvesting. A recently advocated potential open-environment application is the use of porous materials to capture and release (‘harvest’) water vapor under atmospheric conditions without external power sources as a promising methodology for obtaining drinking water in arid or desert regions of the world. The potential of metal-organic frameworks to adsorb and desorb water for fresh water production in regions with medium or high humidity conditions during the night was probably first investigated by Kim et al. [27] and Trapani et al. in 2016 [28], and followed-up by Yaghi and others in 2017, until now [29,30]. So far, the antifouling properties of MOFs have rarely been addressed; Cu-BTC (HKUST-1; Hong Kong University of Science and Technology) and derivative materials were found to inhibit the spore growth of Aspergillus niger, Aspergillus oryzae, and Fusarium oxysporum [31], as well as Fusarium solani and Penicillium chrysogenum [32]. Another approach is the use of silver-based materials, like Ag-MOFs [33].
Most promising MOFs for cyclic water sorption applications are aluminum-based MOFs (Al-MOFs), such as aluminum fumarate (Alfum, Basolite® A520) [34,35,36,37], CAU-10-H (Christian-Albrechts-Universität) [38,39,40], CAU-23 [41], MIL-160 (Matériaux de l’Institut Lavoisier, Material Institute Lavoisier) [42,43], and MIL-53-TDC [44,45] because of their proven hydrothermal stability [45,46], low metal toxicity, and good water uptake characteristics. The hydrothermal stability has been demonstrated for some Al-MOFs over more than 40 cycles, e.g., Alfum [37], CAU-10-H [47], MIL-160 [42], and MIL-100 [48]. Yet, it must also be ensured that the largely organic MOFs will not be prone to fouling through the colonialization and digestion by fungal organism.
Chitosan (CTS) is derived from a natural, non-toxic, biodegradable polymer as the deacetylated derivative of chitin, which is the main constituent of the shell or exoskeleton of insects, crabs, and shrimp [49,50]. As such, chitosan is obtained from the chitin shells of shrimps by alkaline deacetylation. Chitosan offers antifouling effects [51], both against bacteria and against fungi. The antifouling effect depends on the degree of deacetylation and mostly on the molecular weight [52]. MOF@chitosan composite materials are already tested for inter alia, the extraction of ions from aqueous systems [53], the treatment of waste water [54], the use as bio-compatible nanocarriers [55], the separation of water-ethanol mixtures [56], the storage of CO2 [57], or the adsorption of pharmaceutical products [58]. MOFs for chitosan composites are MIL-101(Cr) [59], MIL-101(Fe) [60], MIL-68(Al) [53], MIL-100(Fe) [55], NH2-MIL-88 [61], MIL-125 [62], or UiO-66 (Universitetet i Oslo) [54]. Antifouling properties of these MOF@chitosan composites were, however, not investigated.
Organic materials can be especially suitable habitats for microorganisms living on their surfaces. Many microorganisms tend to form biofilms, attracting other microorganisms to colonize a material’s surface using quorum sensing [63]. Fungi can appear as symbionts, decomposers, or pathogens living in biofilms [64]. Fungi, especially of the genus Aspergillus, Chaetomium, and Penicillium, can act as opportunistic pathogens causing severe mycosis [65,66,67,68,69,70]. Further, these species are known for their abilities to produce mycotoxins. Due to their spores, these fungi are ubiquitous. High humidity offers appropriate biotopes. Also, medical devices, such as vapor chambers or steam sterilization machines, are possible biotopes for fungi, increasing infection risks [71,72]. From a biofilm, fungi can sporulate, i.e., release massive amounts of spores that can induce allergic asthma by constant immune response [65,73].
To prevent fungal colonization, antifungal agents can be added [74]. Another approach is to design materials with surfaces where microorganisms are not able to grow [75].
Here we investigate the antifouling properties of Al-MOF@chitosan composites with the MOFs Alfum and MIL-160 (Figure 1, further chemical details on the MOFs are given in Section S1, Supplementary Information) against the fungi Chaetomium globosum and Aspergillus falconensis, thereby also focusing on retaining the MOF porosity. The composites with polyvinylalcohol (PVA) and Silikophen® were tested as references. The DIN EN ISO (Deutsches Institut für Normung, European Norm, International Organization for Standardization) standard for the action of microorganisms on plastics was followed, which describes how tests must be carried out to determine the resistance of materials against microorganisms [76]. Chaetomium globosum is one of five fungi named in the DIN EN ISO standard and Aspergillus falconensis was chosen because of its lower toxicity compared to Aspergillus niger, which is also named in the ISO standard.

2. Material and Methods

2.1. Materials and Instrumentation

All chemicals were used as received by suppliers (see Section S1 in the Supplementary Information). The aluminum fumarate was received from BASF, known as Basolite® A520. Aluminum chloride hexahydrate, AlCl3·6H2O, was purchased from Fluka Analytical; 2,5-furandicarboxylic acid, ‘chitosan medium molecular weight’, Mowiol 20–98 (PVA) Mw ~125.000, and Tween80 from Sigma Aldrich; NaOH and ethanol (p. a.) from Chem Solute; ethanol (p. a.) from Riedel de Haën; acetic acid (99.9%) and acetone from VWR Chemical; and sodium triphosphate, glutaraldehyde (25 aq.), and agar from Alfa Aesar. Silikophen® P50/X was obtained from Evonik; xylene (p. a.) and DMF from Fischer Chemical; NaNO3 (p. a.), KCl (p. a.), and KH2PO4 (p. a.) from Appli Chem; K2HPO4 (p. a.) and MgSO4 * 7 H2O (p. a.) from Merck; FeSO4·7 H2O (99.5%) from Grüssing (the CAS numbers are given in Table S1 in the Supplementary Information).
Powder X-ray diffractometry (PXRD) was performed at ambient temperature on a Bruker D2 phaser (Bruker, Billerica, MA, USA) using Cu-Kα radiation (λ = 1.54182 Å) between 5° < 2θ < 50° with a scan rate of 0.0125 s−1 (300 W, 30 kV, 10 mA) and a step size of 0.15 and 0.05° per step, giving a typical total measurement time of 6 min for a diffractogram. In Figures S3 and S4, the PXRDs of the neat MOFs were also measured with a Rigaku Miniflex 600 (Rigaku, Tokio; Japan) using Cu-Kα radiation (λ = 1.54182 Å) between 5° < 2θ < 50° with a scan rate of 0.083 s−1 (600 W, 40 kV, 15 mA) and a step size of 0.01° per step, giving a total measurement time of 10 min for a diffractogram. Analyses of the diffractograms were carried out with Match 3.11 software. All PXRD patterns are collected in Section S5 in the Supplementary Information. The broadening of the PXRDs, obtained on the Bruker D2 phaser, is related to the short measurement time, which was selected due to the high number of samples.
Thermogravimetric analysis (TGA) was measured on a Netzsch TG209 F3 Tarsus (Netzsch, Selb, Germany) device under synthetic air atmosphere, ramping 10 K min−1 to 600 °C. TGA curves are given in Section S7 in the Supplementary Information.
SEM images were acquired on a JEOL JSM-6510 Advanced electron microscope (Jeol, Akishima, Japan) with a LaB6 cathode at 5–20 keV. The microscope was equipped with an Xflash 410 (Bruker, Billerica, MA, USA) silicon drift detector. SEM images are presented in Section S8 in the Supplementary Information.
Surface areas (Brunauer-Emmett-Teller [77], BET) were determined by nitrogen (purity 99.999%, 5.0) sorption experiments at T = 77 K, using liquid nitrogen and ca. 20–50 mg of sample and performing on a Quantachrome Autosorp 6 (Quantachrome, Odelzhausen, Germany) instrument within a partial pressure range of pp0−1 = 10−3 − 1 bar. Each sample was degassed under a vacuum (<10−2 mbar) at 120 °C for ca. 3 h prior to measurement. All surface areas (BET) were calculated from five adsorption points applying Rouquerol plots (r > 0.998). For pressure ranges of five-point BET calculations of each MOF, see Section S9 in the Supplementary Information. All N2 sorption isotherms are shown in Section S9 in the Supplementary Information.
Water sorption experiments were performed on a Quantachrome VStar4 (Quantachrome, Odelzhausen, Germany) instrument within a partial pressure range of pp0−1 = 10−3 − 1 bar. Each sample was degassed under a vacuum (<10−3 mbar) at 120 °C for ca. 3 h prior to measurement, using a FloVac (Quantachrome, Odelzhausen, Germany) degasser. All water sorption isotherms are depicted in Section S10 in the Supplementary Information.
FT-IR spectra were measured in KBr-mode on a Bruker TENSOR 37 IR (Bruker, Billerica, MA, USA) spectrometer in the range of 4000–400 cm−1. All IR spectra are depicted in Section S6 in the Supplementary Information.
Conventional drying was carried out using a vacuum oven (Vacutherm oven, Heraeus, Hanau, Germany) and a Büchi glass oven B-560 (Büchi, Flawil, Switzerland).
Supercritical drying was carried out using an ethanol-washed sample still dispersed in ethanol in an automated critical point dryer Leica EM CPD300 (Leica, Wetzlar, Germany) which was set to perform 99 exchange cycles of CO2 at slow speed and 100% stirring.
The samples for the tests for microbial metabolism were prepared on a laminar air flow bench of the type Laminar Air Flow (Heraeus, Hanau, Germany). For this, petri dishes, needles, and an inoculating loop (SARSTEDT, Nümbrecht, Germany) were used. The tests were carried out in an Incu-Line Incubator (VWR, Radnor, PA, USA) and examined with an eyepiece microscope (WILD HEERBRUGG, Heerbrugg, Switzerland).

2.2. Syntheses

2.2.1. MIL-160 Synthesis

MIL-160 was synthesized under reflux according to the literature Cadiau et al. [42]. Instead of 1 eq NaOH, we used 2 eq NaOH to ensure full deprotonation of the linker 2,5-furandicarboxylic acid. 2,5-Furandicarboxylic acid (4.68 g, 30 mmol, 1 eq) and sodium hydroxide (2.4 g, 60 mmol, 2 eq) were dissolved in water (150 mL). Aluminum chloride hexahydrate (7.24 g, 30 mmol, 1 eq) was added and the mixture refluxed (24 h, 100 °C). After centrifugation, the product was washed three times with water (160 mL), centrifuged, and redispersed each time. Finally, the product was dried overnight (80 °C, 1–10 mbar), yielding a white powder (3.9 g, 66% yield, BET = 1186 m2 g−1) (further details in Section S2, Supplementary Information).

2.2.2. Chitosan Bead Synthesis

Chitosan beads were synthesized according to the literature of Bodmeier et al. and Wu et al. [78,79]. Chitosan solutions were prepared with different concentrations by dissolving chitosan flakes in 2 wt-% (weight-%) acetic acid. Thus, the following four concentrations of 6, 20, 30, and 40 g L−1 were obtained. For preparing beads, the chitosan solutions were taken up with a 1 mL syringe and added dropwise to a 10 wt-% Na5P3O10 solution. Subsequently, the particles were washed with water and dried overnight (80 °C, 1–10 mbar) (further details in Section S2, Supplementary Information).

2.2.3. Synthesis of MOF@chitosan

MOF@chitosan beads were synthesized according to the literature of Zhuo et al. [58]. Different MOF loadings were prepared, up to a maximum of 90 wt-%. Composite materials were prepared with chitosan solutions of 6 or 20 g L−1 (corresponding to 10 and 20 or 3 and 6 mL of solution, cf. Table 1). The solid MOF was added into the chitosan solution (chitosan dissolved in 2 wt-% acetic acid) and stirred for 3 h. This mixture, drawn in portions of 1 mL in a 1 mL syringe and from there the portion of 1 mL, was added quickly dropwise (within 30 s) into a 10 wt-% Na5P3O10 solution with constant stirring at room temperature for 15 min. The synthesized beads were collected and washed with Milli-Q water and dried overnight (80 °C, 1–10 mbar) (further details in Table 1 and Section S3, Supplementary Information). Figure 2 illustrates the synthesis process.

2.2.4. Synthesis of MOF@PVA

MOF@PVA beads were synthesized according to a synthesis of Khabzina et al. [80] with MOF loadings of up to 80 wt-%. A PVA solution (60 g L−1) was prepared by dissolving PVA powder in water at 80 °C for 24 h by constant stirring until a homogeneous solution was obtained. Then the MOF (480 mg) was added into the PVA solution (120 mg in 2 mL water) and stirred for 24 h to get a homogeneous suspension. The MOF@PVA suspension was, dropwise, added into liquid nitrogen to form composite beads. These beads were collected and stored in acetone for 24 h, followed by washing three times with acetone (150 mL) and drying overnight (80 °C, 1–10 mbar) (further details in Table 1 and Section S3, Supplementary Information).

2.2.5. Synthesis of MOF@Silikophen®

MOF@Silikophen® composites were synthesized according to the literature of Jeremias et al. [37]. Silikophen® P50/X (10 mL) was dissolved in xylene (30 mL). MOF tablets were prepared by using an IR-press with 2 tons of surface pressure (further details in Section S3, Supplementary Information). MOF tablets were dipped into the Silikophen® solution, removed after 20 s, and dried at RT in air over night. Afterwards, the tablets were tempered according to the following program: 2 h/50 °C; 2 h/105 °C; 3 h/250 °C; and then cooled to RT (further details in Table 1 and Section S3, Supplementary Information).

2.3. Antifouling Tests

The procedure is based on method A of DIN EN ISO 846 (10/1997) (testing for resistance to fungi) [76], using a low-carbon nutrient medium. The composition of the nutrient medium can be taken from Table S5 in the Supplementary Information. The mineral salts are dissolved in 2000 mL of water and form the basis for the fungus tests. A total of 1000 mL of this stock mineral salt solution is mixed with 0.1 g of a non-toxic wetting agent (Tween80). The carbon source-free (incomplete) culture medium for the actual tests is obtained by adding 10 g agar (20 g L−1) to 500 mL of the stock mineral salt solution. The fungus tests were carried out according to the following protocol:
First, the samples were immersed for 1 min in an ethanol-water mixture (70:30), air dried, and stored in a closed container at RT until use. The test specimens were disinfected before the test by means of water-steam sterilization (121 °C, 2 bar). The complete culture medium was filled after heating in sterile petri dishes and cured. The samples were placed as flat as possible on the incomplete nutrient medium. Spores of the fungi to be used were taken from the respective spore turf and combined with the mineral salt solution with a wetting agent additive to form a spore suspension. The spore suspensions were placed on the incomplete nutrient media and the petri dishes were sealed. The samples were incubated with the fungi at 24 ± 1 °C for up to four weeks.
The preparation of a spore suspension was carried out with the following fungi: Chaetomium globosum and Aspergillus falconensis (further details in Section S4, Supplementary Information).
Method A of the DIN EN ISO 846 [76] test describes five fungi (Aspergillus niger, Penicillium funiculosum, Paecilomyces varioti, Gliocladium virens, and Chaetomium globosum). Our labs only support risk group 1 organisms, according to the TRBA 460 “Classification of fungi in risk groups”; therefore, we decided to test our composites with two fungi classified as risk group 1 organisms: Aspergillus falconensis (as a substitute for Aspergillus niger, which belongs to risk group 2) and Chaetomium globosum. To better assess whether the used chitosan is digested or overgrown, the two mentioned fungi were examined individually (unlike the DIN EN ISO standard).
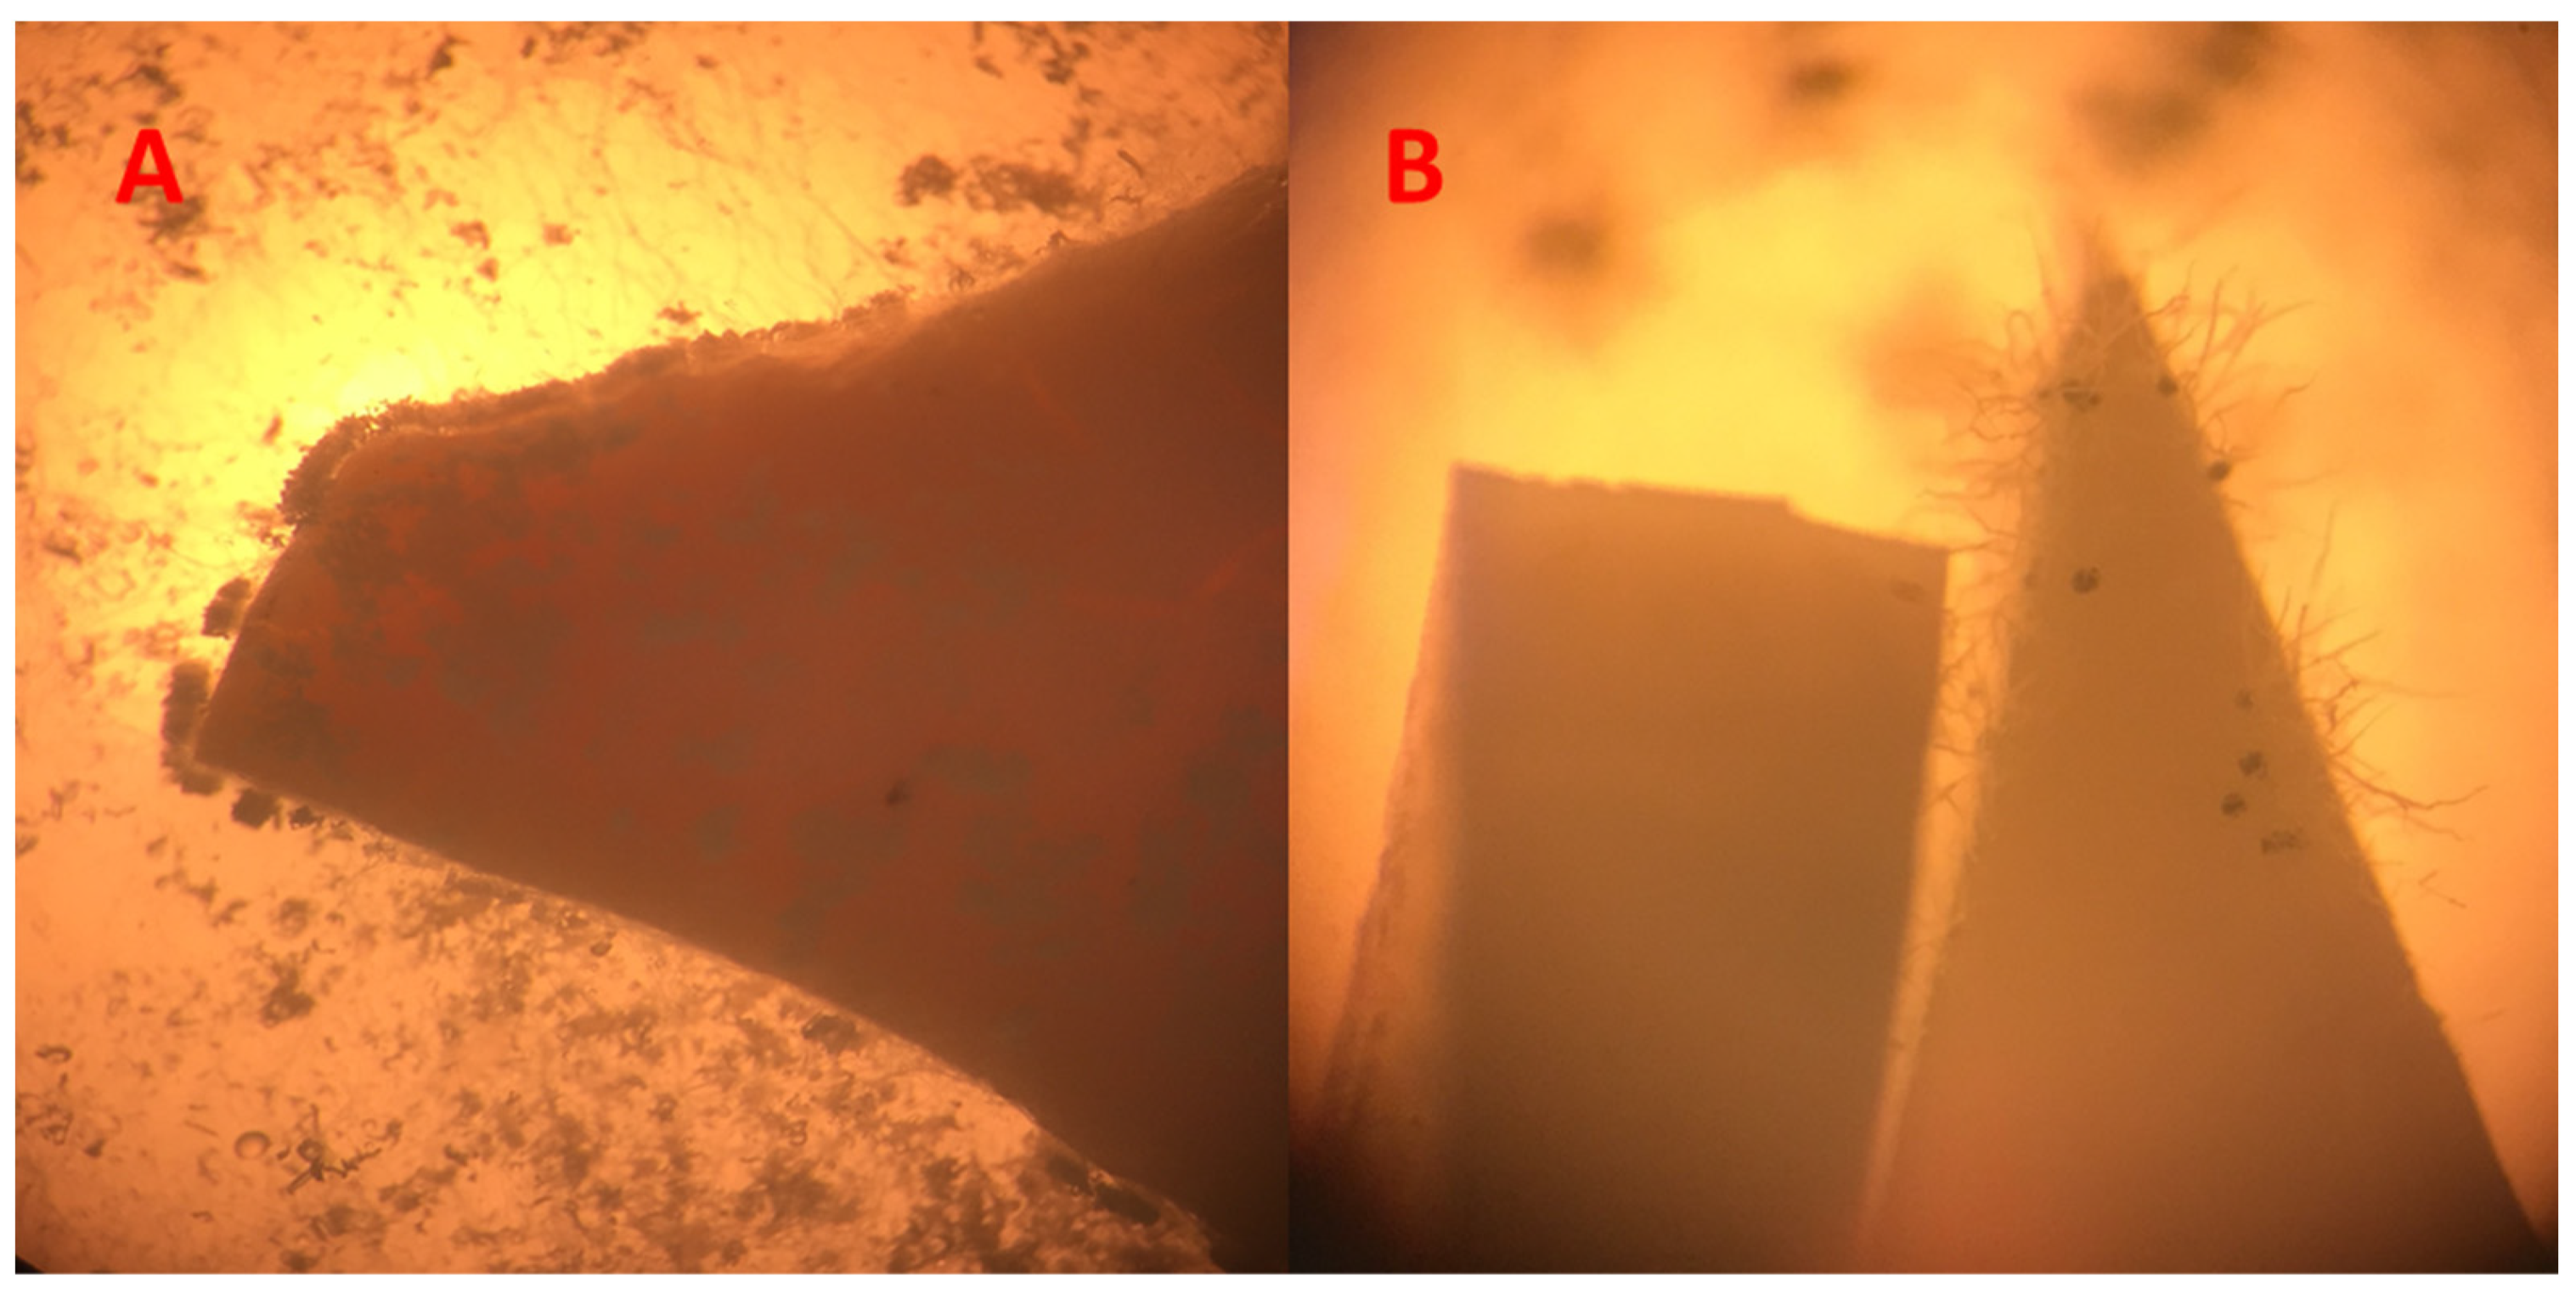
Figure 3 shows two examples of two used composites that did not pass the overgrow tests. Due to the morphological appearances of the fungi, they could be distinguished easily from the composites.
All samples were tableted to obtain a uniform shape and surface area for the fungi growth and to facilitate visual assessment. This ensured that fungi growth would not be influenced by the shape or surface area of powders versus granules with larger and smaller outer-surface areas. However, during surface sterilization, some tablets degraded. Pieces of such degraded tablets were still used.
The evaluation of the samples was carried out by means of visual classification, which is also specified in the DIN EN ISO standard (cf. Table 2). Over the time of 15 or 27 days, photographic images of the antifouling tests were taken 1 to 6 days apart (Section S11, Supplementary Information). The basis for the assessment was always the final image of the test series (day 15 for Chaetomium globosum and day 27 for Aspergillus falconensis; Section S11, Supplementary Information) and the associated microscopic observation of the growth intensity (Table 2). Growth experiments with Aspergillus falconensis were carried out in triplicate to ensure reproducibility.

3. Results and Discussion

The aluminum fumarate (Alfum) used for the composite materials was supplied by BASF as Basolite® A520. The synthesis of MIL-160 was based on a procedure by Cadiau et al. [42], except that twice the amount of sodium hydroxide was used to achieve complete deprotonation of the 2,5-furandicarboxylic acid. For comparison with the MOF@chitosan composites, both Alfum and MIL-160 were characterized by PXRD (Figures S3 and S4), SEM (Figures S17 and S18), IR (Figure S8), N2-sorption (Figures S26 and S27), H2O-sorption (Figures S34 and S35), and TGA (Figure S11, Supplementary Information).
The used chitosan (medium molecular weight) was purchased from Sigma Aldrich, with a specified molecular weight dispersion of 190 to 310 kDa and a degree of deacetylation of 75–85% (from the data sheet of the manufacturer). The chitosan was received as flakes, which have a white-beige to brownish color. The crosslinked chitosan particles with different chitosan concentrations had BET-surface areas between 144 and 233 m2 g−1.

3.1. MOF@chitosan Composites

The soluble chitosan was crosslinked in the presence of the MOF, and to precipitate the MOF@chitosan composite Glutaraldehyde (1 mL of an 83 g L−1 solution) and sodium triphosphate (Na5P3O10, 10 wt-% solution) were tested as crosslinkers. Glutaraldehyde bonds connect covalently to chitosan (Figure S42, Supplementary Information), whereas Na5P3O10 connects the chitosan chains by ionic bonds through the protonated amino group (Figure 2). Na5P3O10 proved to be the better crosslinker, due to its non-toxicity and easier handling, regarding synthesis, compared to glutaraldehyde. Hence, the use of glutaraldehyde was not pursued any further, also because of its toxicity. Furthermore, the syntheses of the composite materials with glutaraldehyde required considerably more time for the gelation and aging so that only monoliths, no beads, could be obtained and MOF loadings up to 90% could not be achieved (Section S2 and S3, Supplementary Information).
The composite formation does not affect the particle size of the MOF. The MOF peak widths in the PXRD patterns (albeit already high due to instrument effects; see below) did not change. The higher background is related to the amount of amorphous chitosan inside the composite. There should be no change in MOF particle size because ultrasound, which is known to decrease the particle size, was not used for composite formation.

3.1.1. Alfum@chitosan

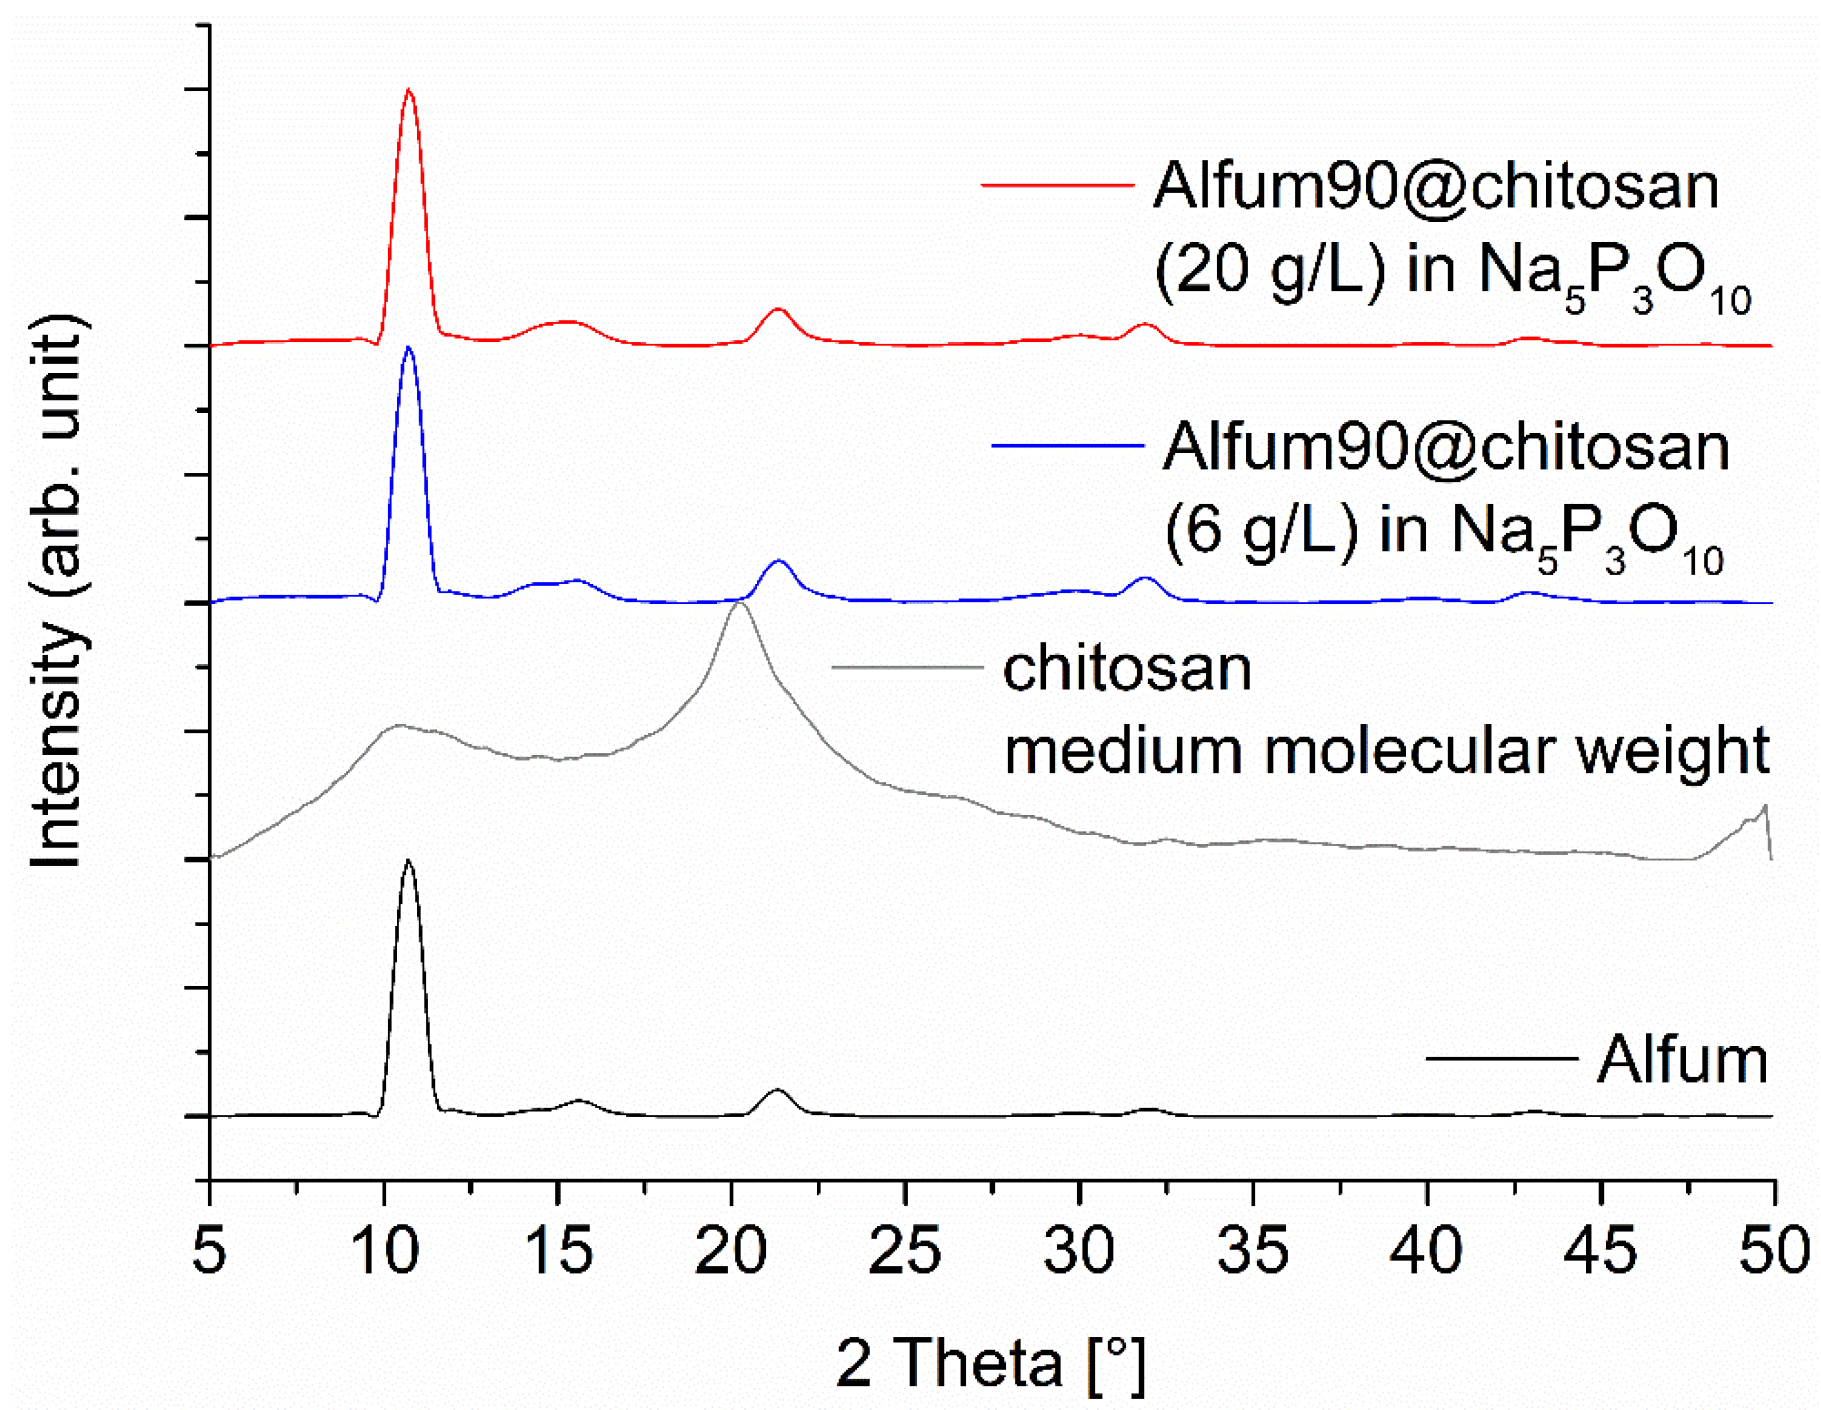
For the Alfum@chitosan composites, several syntheses were carried out in which the MOF content was systematically varied, and two different chitosan concentrations (6 and 20 g L−1) were used. The MOF content was 60, 80, and 90 wt-% in relation to the all the composite material. Even higher loading was not possible because the volume of the chitosan solution eventually became too low and no longer produced a homogeneous dispersion; therefore, it became impossible to add it dropwise into the Na5P3O10 solution. The diffraction patterns of the Alfum@chitosan composites confirm the retention of MOF crystallinity (Figure 4 and Figure S5, Supplementary Information).
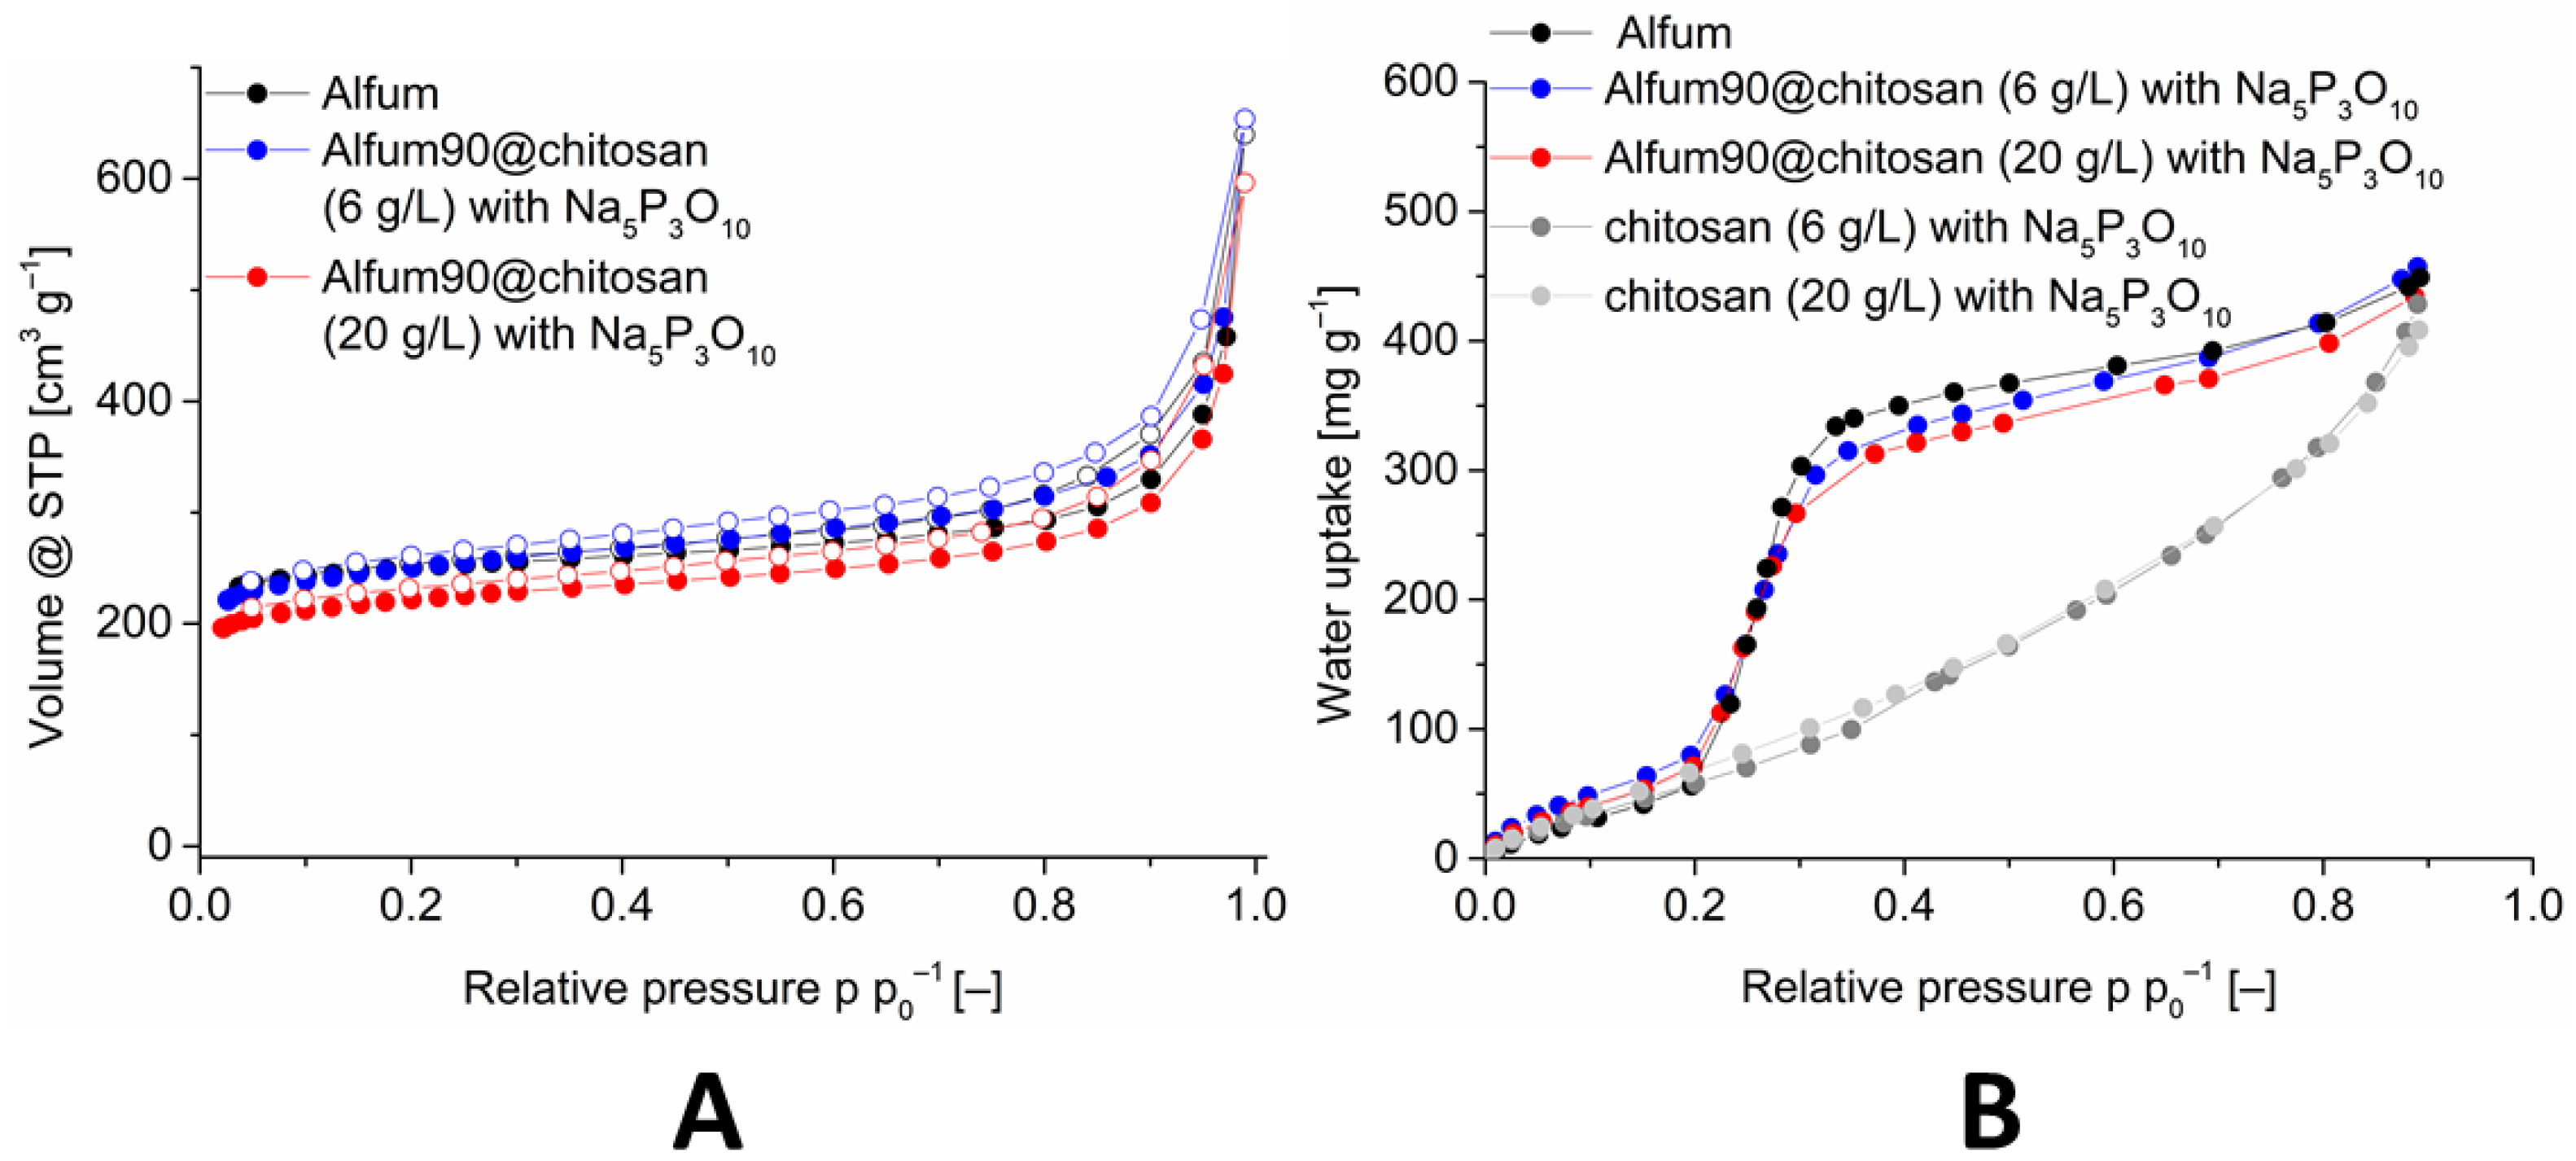
The pore accessibility of Alfum within the Alfum@chitosan composite materials was investigated by nitrogen and water sorption (Figure 5, Figures S29 and S37, Supplementary Information).
The porosity, that is, BET-surface areas, pore volumes and water uptake values decrease disproportionately high with the decrease in the Alfum in the composite. Table 3 lists the porosity data in comparison with the calculated (expected) values, which are mass-corrected for the wt-% of the MOFs and the chitosan in the composite. The measured values also become much lower than the calculated (expected) BET-surface areas and the water uptake values. Thus, the composite materials with 60% MOF have a significantly lower surface than the materials with 80% and 90% MOF. Only when the composite was dried supercritically for activation prior to the sorption measurements the expected BET-surface area could be obtained. During the normal thermal/vacuum drying process, the beads of the Alfum@chitosan composite shrink considerably (decrease in diameter from 3.5 mm to 3.0 mm (20 g L−1) and 2.5 mm to 2.4 mm (6 g L−1), Figure S41, Supplementary Information) whereas during supercritically drying the beads retain the original size but become mechanically fragile. Hence, the solvent plays a role of a pore-forming agent by creating an interfacial volume between the MOF and the chitosan layer. When the solvent is removed by thermal/vacuum drying, the chitosan layer apparently covers and blocks part of the pores. Supercritical drying retains the interfacial volume and, thereby, prevents pore blocking but at the expense of mechanical stability. The beads break apart. The composite material with 90% MOF and a chitosan concentration of 6 g L−1 provides the best result with a BET-surface area of 964 m2 g−1.
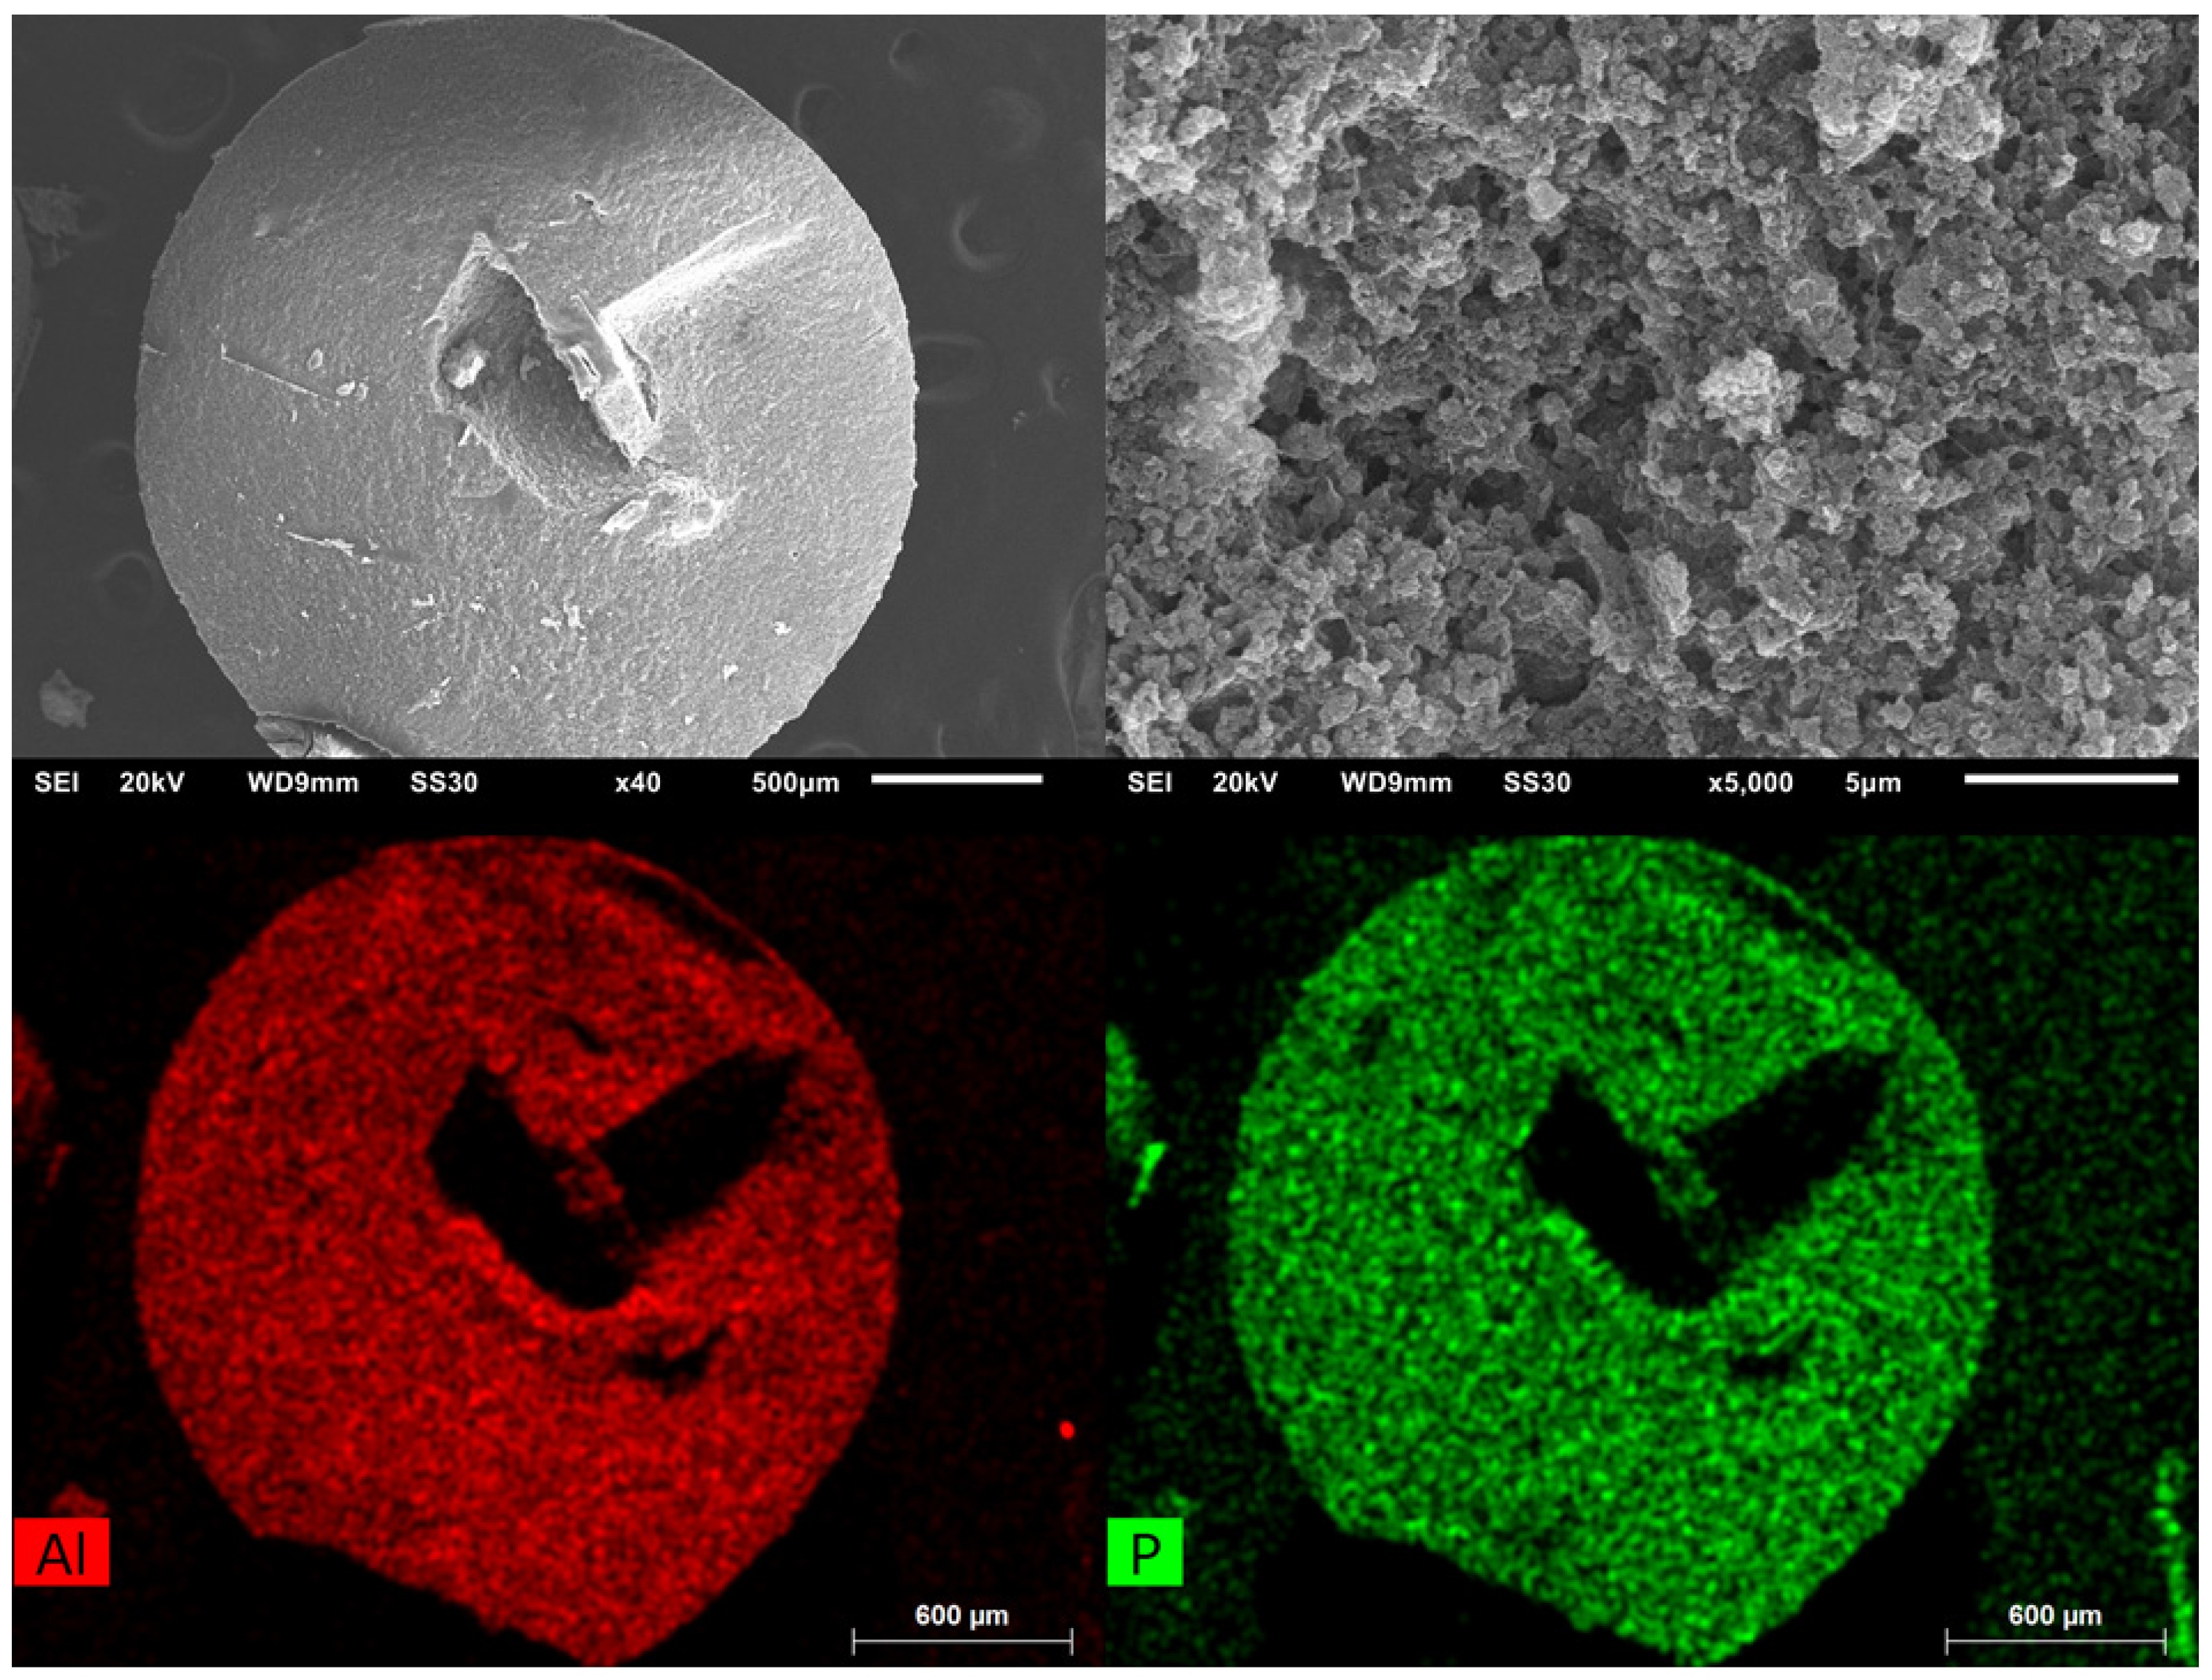
Scanning electron microscopy (SEM) images with energy-dispersive X-ray spectroscopic (EDX) element mapping (Figure 6) reveal a very good superposition, which suggests that both aluminum and phosphorus (from cross-linked chitosan) are evenly distributed in the bead.
A magnified view of the surface of the beads does not allow differentiation between the agglomerated particles of Alfum and the chitosan since Alfum does not have a well-defined morphology.

3.1.2. MIL-160@chitosan

The MIL-160 composite materials were prepared and characterized like the composite materials with Alfum. The same percentages of MOF and chitosan were used to ensure comparability. The PXRDs of the composite materials point out the reflexes of the MIL-160. Only the diffractogram of the spheres with 60% has a stronger background due to the high amorphous content of chitosan, shown in the ESI. The PXRDs of 80% and 90% composite materials do not have a strong background and correlate with the MOF content, shown in Figure 7 for the composite material with 90% MIL-160. In addition, the reflections match the MOF and the diffractogram has no impurities.
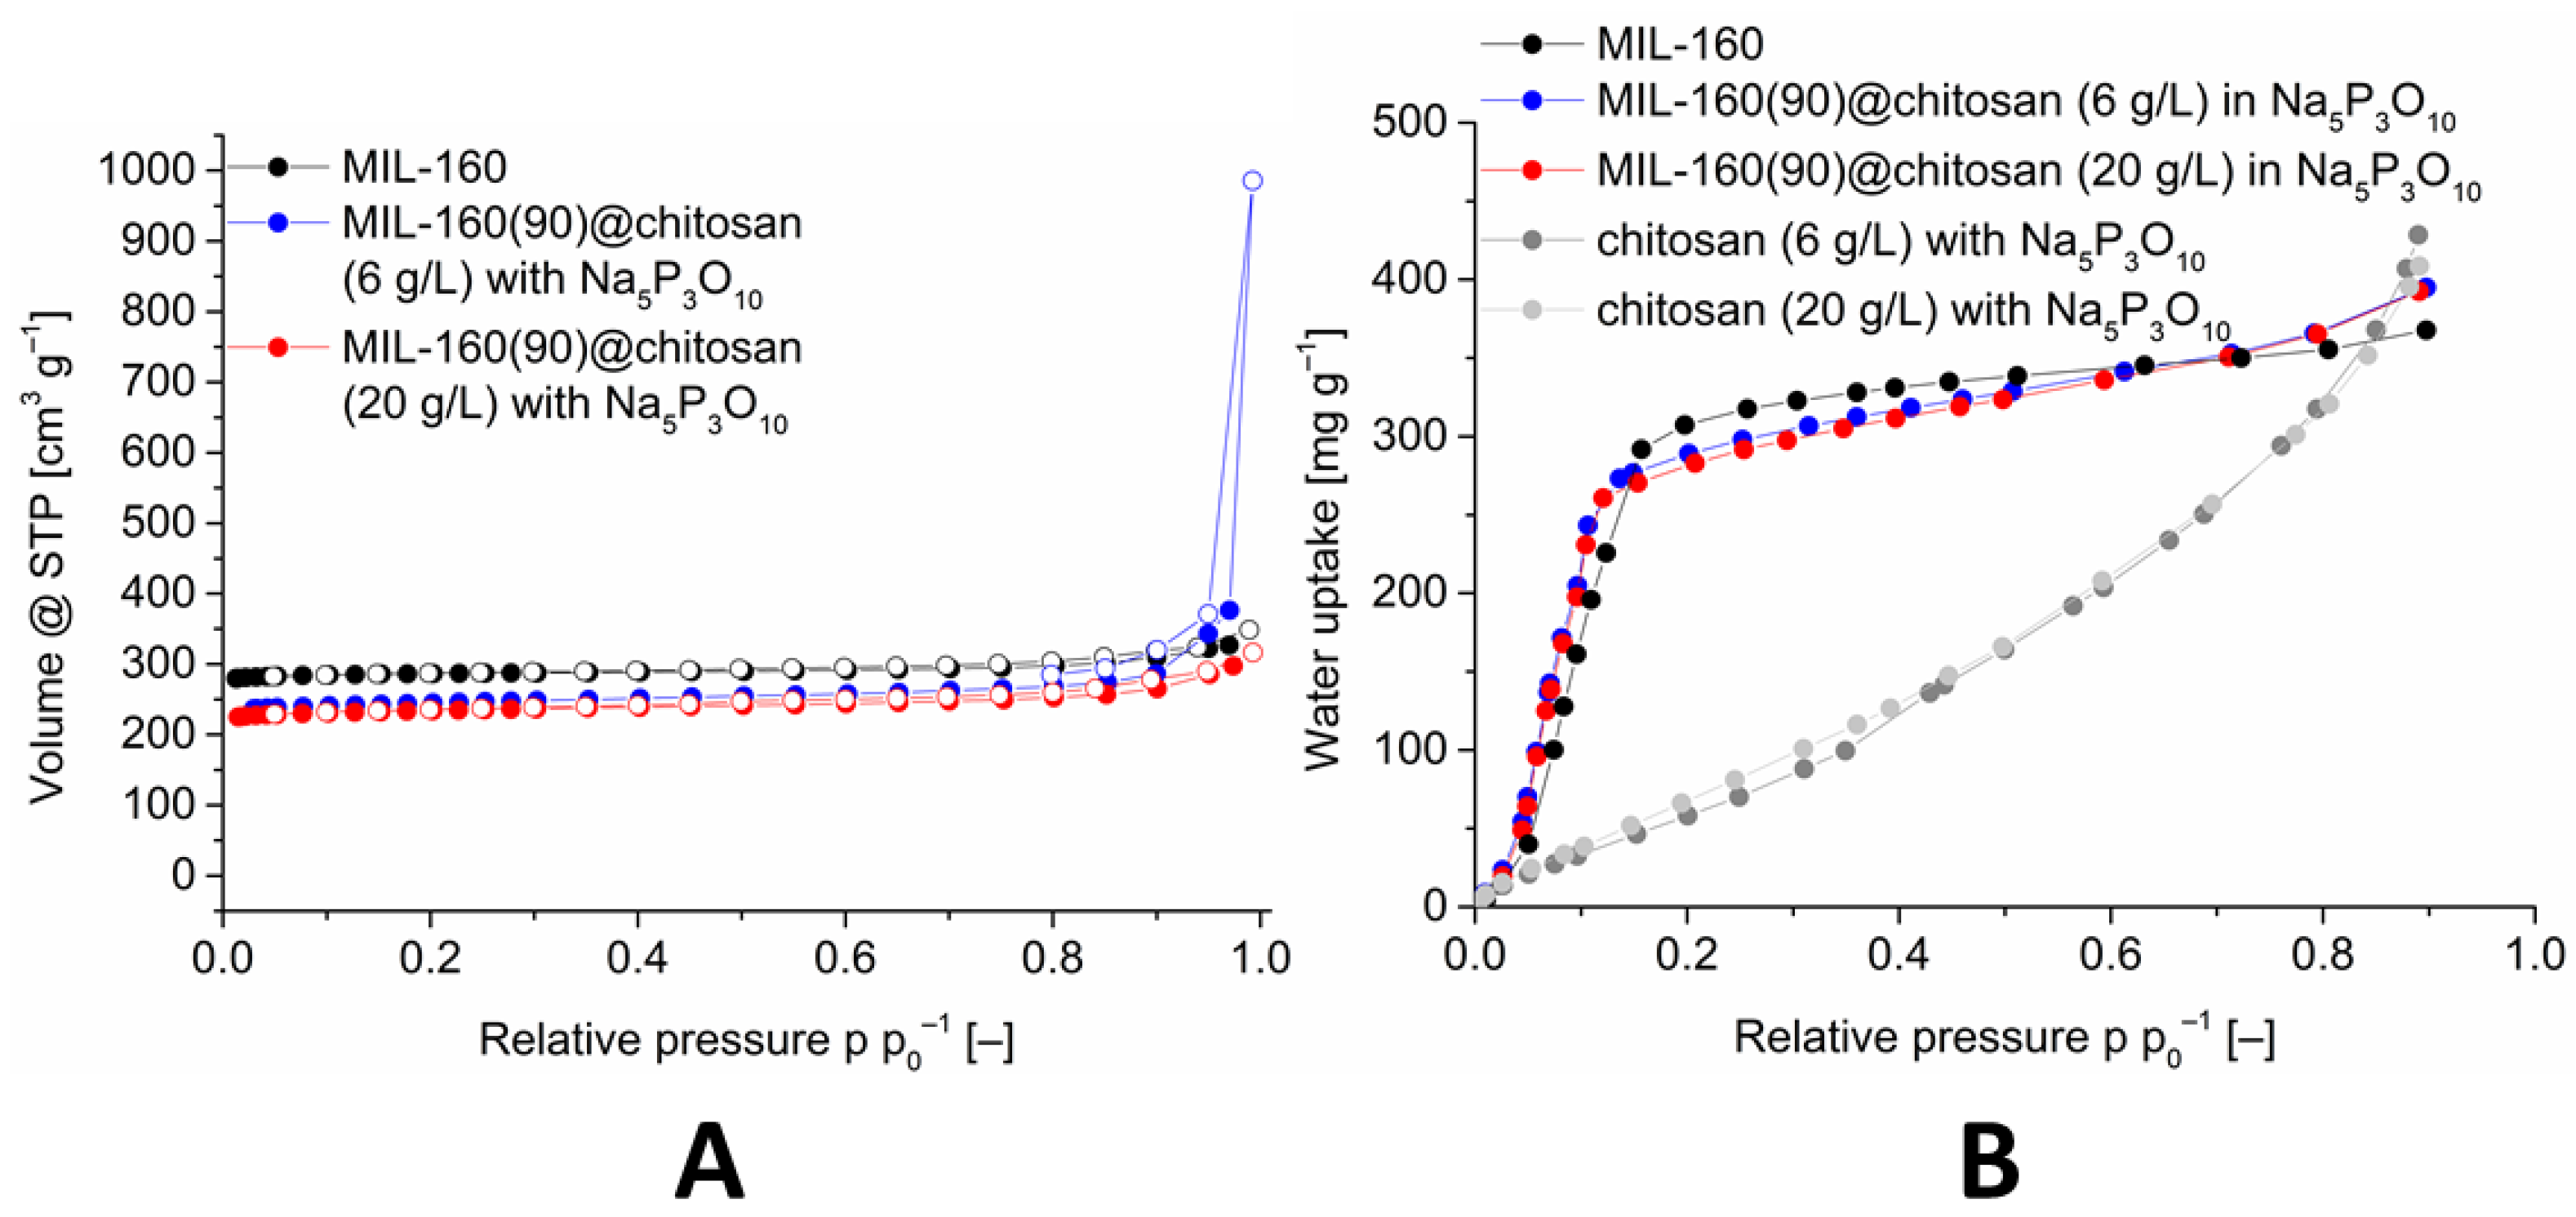
The sorption properties were investigated analogously to the other composite materials with nitrogen sorption and water sorption. The nitrogen sorptions are shown in Figure 8.
The nitrogen adsorption isotherms and the associated BET-surface areas correlate with the percentage of MOF (cf. Table 3). Thus, the composite materials with 60% MOF have a significantly lower surface area than the materials with 80% and 90% MOF. The composite material with 90% MOF and a chitosan concentration of 6 g L−1 gives the best result with a BET-surface area of 1068 m2 g−1. The associated water sorption isotherms are shown in Figure 8 and in the ESI and were measured for the composite materials with an MOF content of 80% and 90%. The S-shaped water sorption isotherm with little-to-no uptake at low p p0−1 and a sudden rise in a small p p0−1 interval correspond to Type V isotherms [77] and are typical for the adsorption of water vapor at MOFs [15].
The maximum adsorption of the composite material is above the maximum uptake of MIL-160. This can be attributed to the polymer because it has a higher water uptake at a relative pressure of 0.9. This higher uptake is characteristic for polymers, and it is due to swelling. To verify the cross-linking of the composite and the MOF in the material, an EDX mapping for aluminum and phosphorus was performed and presented in Figure 9.
The EDX mapping shows that, in the complete area of the sphere, aluminum, and thus MOF and phosphorus, and thus cross-linked chitosan, are present. The lower amounts of Al and P in the middle right of the mapping is due to the particle geometry. The hollow in the middle of the particle blocks the X-rays, and they cannot be detected. In addition to the analytical methods described, TGA and IR, shown in the ESI, were recorded on selected samples.

3.2. MOF@PVA Composites and MOF@Silikophen® Composites

The MOF@PVA composite materials, as well as the Silikophen® composite materials, were used as reference materials for the antifouling tests of MOF@chitosan. Silikophen® is a phenylmethylpolysiloxane resin and, unlike the chitosan and PVA polymers, was not used as a matrix but as a coating. For coating, tablets of the two MOFs were pressed and immersed for 20 s in a Silikophen®-xylene mixture, then dried in the air, transferred to a Büchi glass oven, and tempered. The PVA and Silikophen® composites were characterized by PXRD (Figures S8 and S9), SEM (Figures S22–S25), N2-sorption (Figures S32 and S33), H2O-sorption (Figure S40), and TGA (Figure S16).

3.3. Antifouling Tests

The evaluation of the samples was conducted by visual examination according to DIN EN ISO 846 [76]. Chaetomium globosum grows faster than Aspergillus falconensis and can fully overgrow composites within 15 days (Section S11, Supplementary Information), so that incubation with Chaetomium globosum was stopped after this time while incubation with Aspergillus falconensis was continued for 27 days. Table 4 lists the results of the microbial metabolism tests with Aspergillus falconensis. None of composites exhibited an inhibitory effect toward Chaetomium globosum. Fully overgrown and colonized composites with Chaetomium globosum were observed in all samples (Section S11, Supplementary Information).
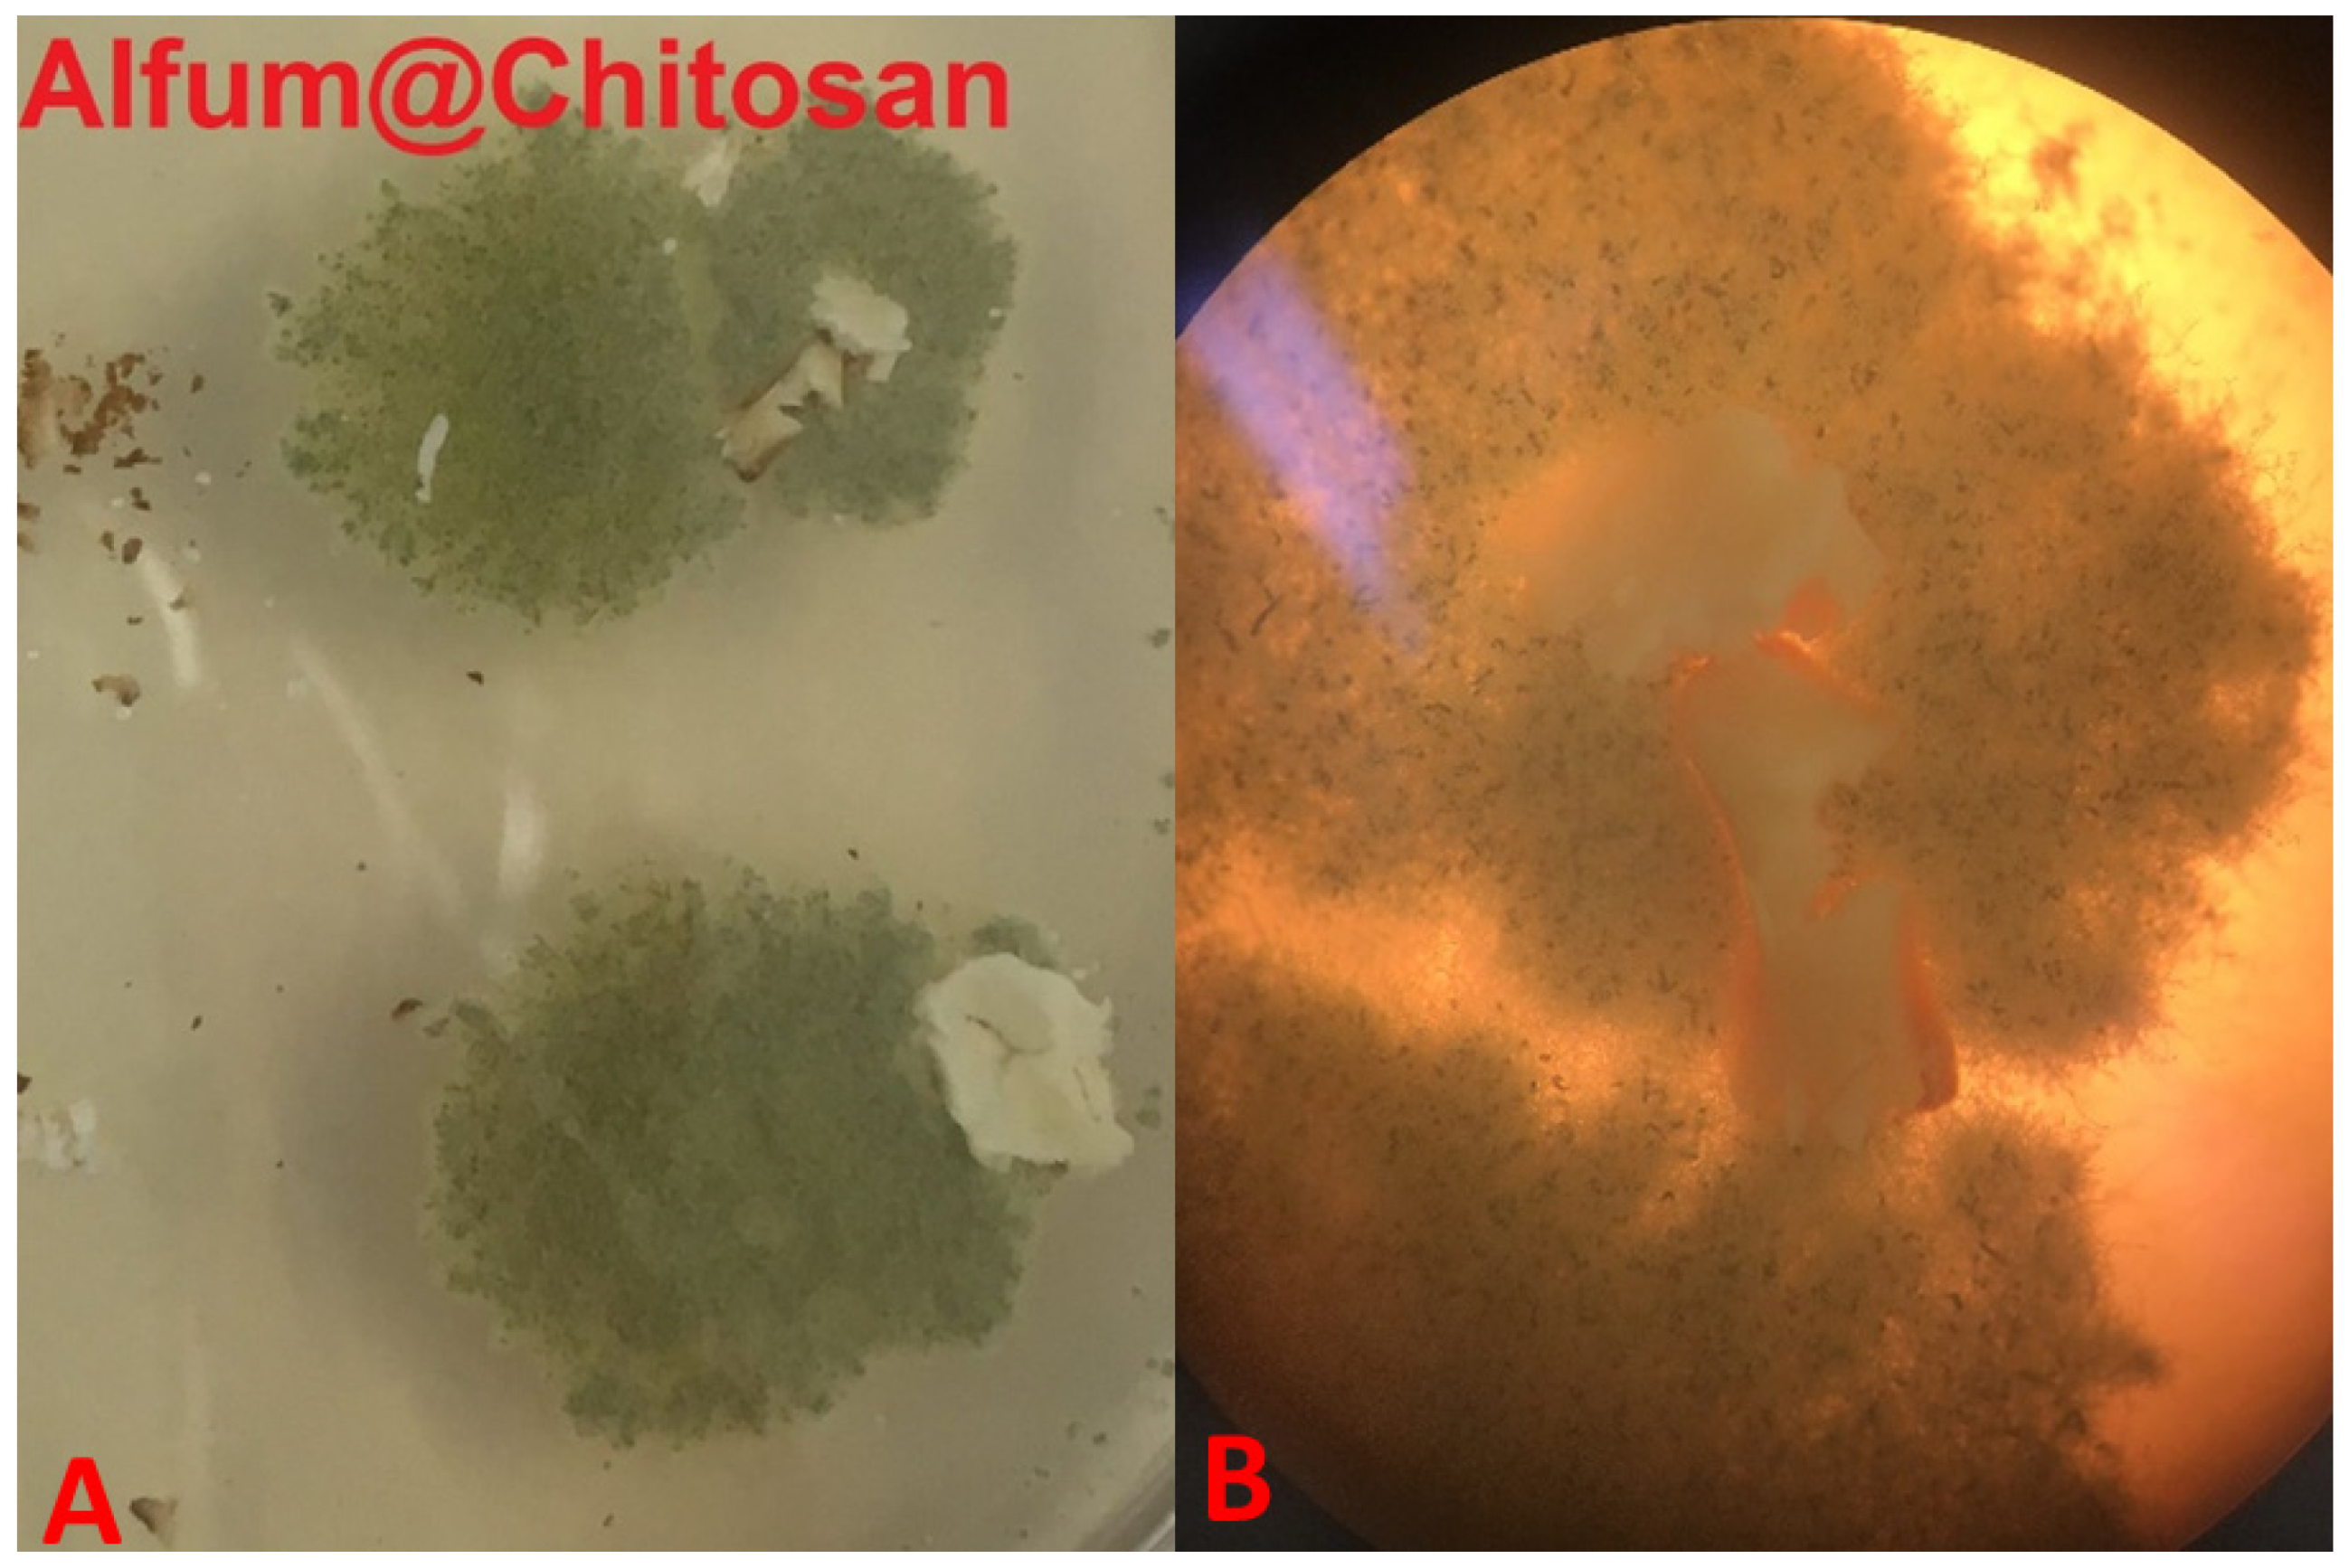
Figure 10, Figure 11 and Figure 12 show examples of the spread of the fungus Aspergillus falconensis on different samples and the respective assessment according to the DIN EN ISO standard.
In all figures, the growth of the fungus is clearly recognizable and due to the green color of the fungus it can be distinguished from the white composite material (cf.). Visually, no growth of the fungus can be seen on top of the material surface in Figure 10. This is also confirmed by the microscopic image. The fungus grows to the vertical edges of the composite material but does not overgrow it. An overgrowth of the composite material, as it is needed for the categories 2–5 (Table 2), can be seen for Alfum and crosslinked chitosan alone (Figure 11) and the PVA and Silikophen® composites (Figure 12).
It is noteworthy that the separate Alfum MOF and chitosan did not show an inhibitory effect towards Aspergillus falconensis. Only the combination of Alfum and chitosan exhibited a higher resistance to the fungus. The distance from the start of fungus growth to the composite materials plays a major role and may explain the slight differences between the three replicate experiments. It is difficult to ensure that the composite materials always grow the same distance from where the fungus is placed on the nutrient medium because the fungus does not grow in a defined direction. During incubation, we ensured that all tablets had a chance to get in contact with the fungus by adding water to prevent the nutrient medium from running dry and making it useless for examination over the time of 15 or 27 days.
The reference composite material Alfum@PVA shows a low degree of overgrowth, and it can also be clearly seen that the sample is not central to fungal growth. The composite Alfum@Silikophen® is assigned to category 5, as over 50% of the sample surface is covered with the fungus. From this it can be concluded that the Silikophen® binder has no anti-fouling effect and thus serves well as a comparison material.
We observed that the Aspergillus falconensis can experience two quite different growth states. The fungus can strongly overgrow the Alfum@PVA and MIL-160@Silikophen® composites. For the MOF@chitosan composite, no growth is visible under microscopic observation, hence the material can be considered fungistatic and does not serve as a nutrient for microorganisms.

4. Conclusions

In this work, we were able to synthesize porous MOF@chitosan composite materials with different loadings. Alfum and MIL-160 were embedded in a chitosan matrix for the first time. The chitosan cross-linking was carried out in situ with Na5P3O10, whereby the chitosan concentrations were systematically varied in order to ensure a homogeneous dispersion necessary for the synthesis and thus to obtain the desired properties of the composite materials. Spherical particles could be obtained by the very reproducible drop casting method.
In addition, tests were performed on the microbial metabolism of the composites. An anti-fouling effect of the chitosan composites against Aspergillus falconensis could be detected whereas Chaetomium globosum proved to be more aggressive and could overgrow the chitosan composite materials. Further, the chitosan composite materials show a significantly higher resistance to Aspergillus falconensis than the composites with PVA and Silikophen®. All MOF@chitosan composite materials could be classified as “inert” or “fungistatic” against Aspergillus falconensis. Another interesting observation was the behavior of pure MOF tablets where MIL-160 had a higher resistance than Alfum. In follow-up work, this suggests the need to investigate different MOF linkers and Al-MOFs with a wider variety of linkers for their fungistatic effects.

Supplementary Materials

The following are available online https://www.mdpi.com/article/10.3390/solids3010004/s1. S1. Materials and equipment, S2. MOF and Chitosan Synthesis, S3 Composite Synthesis, S4 Antifouling Tests, S5 PXRD Measurements, S6 Infrared spectra, S7 Thermogravimetric Analysis (TGA), S8 Scanning electron microscopy (SEM), S9 Nitrogen sorption experiments (T = 77 K), S10 Water sorption experiments (T = 293 K), S11 Antifouling tests series (images), S12 Images of the MOF@chitosan composites, S13 Reaction scheme of chitosan and glutaraldehyde, S14 Graphics, S15 References.

Author Contributions

Conceptualization: C.J. (Christian Jansen) and C.J. (Christoph Janiak); methodology: C.J. (Christian Jansen); validation: C.J. (Christian Jansen) and N.M.T.-C.; formal analysis: C.J. (Christian Jansen), N.M.T.-C., C.S., and A.S.; investigation: C.J. (Christian Jansen), N.M.T.-C., C.S., and A.S.; resources: P.P. and C.J. (Christoph Janiak); data curation: C.J. (Christian Jansen); visualization: C.J. (Christian Jansen); writing—original draft preparation: C.J. (Christian Jansen); writing—review and editing: C.J. (Christian Jansen), P.P., and C.J. (Christoph Janiak); Supervision: C.J. (Christoph Janiak); project administration: P.P. and C.J. (Christoph Janiak); funding acquisition: P.P. and C.J. (Christoph Janiak). All authors have read and agreed to the published version of the manuscript.

Funding

C.J. (Christoph Janiak) is indebted to the DFG for funding within the priority program SPP 1928 “COORNET” (grant Ja466–43/1).

Data Availability Statement

The data presented in this study are available on request from the corresponding author.

Conflicts of Interest

The authors declare that they have no known competing financial interests or personal relationships that could have appeared to influence the work reported in this paper.

References

  1. Batten, S.R.; Champness, N.R.; Chen, X.-M.; Garcia-Martinez, J.; Kitagawa, S.; Öhrström, L.; O’Keeffe, M.; Paik Suh, M.; Reedijk, J. Terminology of metal–organic frameworks and coordination polymers (IUPAC Recommendations 2013). Pure Appl. Chem. 2013, 85, 1715–1724. [Google Scholar] [CrossRef] [Green Version]
  2. Zhou, H.-C.J.; Kitagawa, S. Metal-organic frameworks (MOFs). Chem. Soc. Rev. 2014, 43, 5415–5418. [Google Scholar] [CrossRef] [PubMed] [Green Version]
  3. Farha, O.K.; Hupp, J.T. Rational design, synthesis, purification, and activation of metal-organic framework materials. Acc. Chem. Res. 2010, 43, 1166–1175. [Google Scholar] [CrossRef] [PubMed] [Green Version]
  4. Taddei, M. When defects turn into virtues: The curious case of zirconium-based metal-organic frameworks. Coord. Chem. Rev. 2017, 343, 1–24. [Google Scholar] [CrossRef] [Green Version]
  5. Evans, J.D.; Garai, B.; Reinsch, H.; Li, W.; Dissegna, S.; Bon, V.; Senkovska, I.; Fischer, R.A.; Kaskel, S.; Janiak, C.; et al. Metal–organic frameworks in Germany: From synthesis to function. Coord. Chem. Rev. 2019, 380, 378–418. [Google Scholar] [CrossRef] [Green Version]
  6. Nuhnen, A.; Dietrich, D.; Millan, S.; Janiak, C. Role of Filler Porosity and Filler/Polymer Interface Volume in Metal-Organic Framework/Polymer Mixed-Matrix Membranes for Gas Separation. ACS Appl. Mater. Interfaces 2018, 10, 33589–33600. [Google Scholar] [CrossRef]
  7. Aykac Ozen, H.; Ozturk, B. Gas separation characteristic of mixed matrix membrane prepared by MOF-5 including different metals. Sep. Purif. Technol. 2019, 211, 514–521. [Google Scholar] [CrossRef]
  8. He, Y.; Zhou, W.; Qian, G.; Chen, B. Methane storage in metal-organic frameworks. Chem. Soc. Rev. 2014, 43, 5657–5678. [Google Scholar] [CrossRef]
  9. Karimzadeh, Z.; Javanbakht, S.; Namazi, H. Carboxymethylcellulose/MOF-5/Graphene oxide bio-nanocomposite as antibacterial drug nanocarrier agent. BioImpacts 2019, 9, 5–13. [Google Scholar] [CrossRef]
  10. Abánades Lázaro, I.; Forgan, R.S. Application of zirconium MOFs in drug delivery and biomedicine. Coord. Chem. Rev. 2019, 380, 230–259. [Google Scholar] [CrossRef] [Green Version]
  11. Rogge, S.M.J.; Bavykina, A.; Hajek, J.; Garcia, H.; Olivos-Suarez, A.I.; Sepúlveda-Escribano, A.; Vimont, A.; Clet, G.; Bazin, P.; Kapteijn, F.; et al. Metal-organic and covalent organic frameworks as single-site catalysts. Chem. Soc. Rev. 2017, 46, 3134–3184. [Google Scholar] [CrossRef] [PubMed] [Green Version]
  12. Solovyeva, M.V.; Gordeeva, L.G.; Aristov, Y.I. “MIL-101(Cr)–methanol” as working pair for adsorption heat transformation cycles: Adsorbent shaping, adsorption equilibrium and dynamics. Energy Convers. Manag. 2019, 182, 299–306. [Google Scholar] [CrossRef]
  13. Hastürk, E.; Ernst, S.-J.; Janiak, C. Recent advances in adsorption heat transformation focusing on the development of adsorbent materials. Curr. Opin. Chem. Eng. 2019, 24, 26–36. [Google Scholar] [CrossRef]
  14. Gordeeva, L.G.; Aristov, Y.I. Adsorptive heat storage and amplification: New cycles and adsorbents. Energy 2019, 167, 440–453. [Google Scholar] [CrossRef]
  15. Liu, X.; Wang, X.; Kapteijn, F. Water and Metal-Organic Frameworks: From Interaction toward Utilization. Chem. Rev. 2020, 120, 8303–8377. [Google Scholar] [CrossRef] [PubMed]
  16. Steinert, D.M.; Ernst, S.-J.; Henninger, S.K.; Janiak, C. Metal-Organic Frameworks as Sorption Materials for Heat Transformation Processes. Eur. J. Inorg. Chem. 2020, 2020, 4502–4515. [Google Scholar] [CrossRef]
  17. Jeremias, F.; Fröhlich, D.; Janiak, C.; Henninger, S.K. Water and methanol adsorption on MOFs for cycling heat transformation processes. New J. Chem. 2014, 38, 1846–1852. [Google Scholar] [CrossRef] [Green Version]
  18. Rieth, A.J.; Wright, A.M.; Rao, S.; Kim, H.; LaPotin, A.D.; Wang, E.N.; Dincă, M. Tunable Metal-Organic Frameworks Enable High-Efficiency Cascaded Adsorption Heat Pumps. J. Am. Chem. Soc 2018, 140, 17591–17596. [Google Scholar] [CrossRef] [Green Version]
  19. Elsayed, E.; AL-Dadah, R.; Mahmoud, S.; Elsayed, A.; Anderson, P.A. Aluminium fumarate and CPO-27(Ni) MOFs: Characterization and thermodynamic analysis for adsorption heat pump applications. Appl. Therm. Eng. 2016, 99, 802–812. [Google Scholar] [CrossRef]
  20. AL-Dadah, R.; Mahmoud, S.; Elsayed, E.; Youssef, P.; Al-Mousawi, F. Metal-organic framework materials for adsorption heat pumps. Energy 2020, 190, 116356. [Google Scholar] [CrossRef]
  21. O’Neill, L.D.; Zhang, H.; Bradshaw, D. Macro-/microporous MOF composite beads. J. Mater. Chem. 2010, 20, 5720. [Google Scholar] [CrossRef]
  22. Rowe, M.D.; Thamm, D.H.; Kraft, S.L.; Boyes, S.G. Polymer-modified gadolinium metal-organic framework nanoparticles used as multifunctional nanomedicines for the targeted imaging and treatment of cancer. Biomacromolecules 2009, 10, 983–993. [Google Scholar] [CrossRef] [PubMed]
  23. Hastürk, E.; Höfert, S.-P.; Topalli, B.; Schlüsener, C.; Janiak, C. Shaping of MOFs via freeze-casting method with hydrophilic polymers and their effect on textural properties. Microporous Mesoporous Mater. 2020, 295, 109907. [Google Scholar] [CrossRef]
  24. Hastürk, E.; Schlüsener, C.; Quodbach, J.; Schmitz, A.; Janiak, C. Shaping of metal-organic frameworks into mechanically stable monoliths with poly(vinyl alcohol) by phase separation technique. Microporous Mesoporous Mater. 2019, 280, 277–287. [Google Scholar] [CrossRef]
  25. Gökpinar, S.; Ernst, S.-J.; Hastürk, E.; Möllers, M.; El Aita, I.; Wiedey, R.; Tannert, N.; Nießing, S.; Abdpour, S.; Schmitz, A.; et al. Air-Con Metal–Organic Frameworks in Binder Composites for Water Adsorption Heat Transformation Systems. Ind. Eng. Chem. Res. 2019, 58, 21493–21503. [Google Scholar] [CrossRef]
  26. Tsobnang, P.K.; Hastürk, E.; Fröhlich, D.; Wenger, E.; Durand, P.; Ngolui, J.L.; Lecomte, C.; Janiak, C. Water Vapor Single-Gas Selectivity via Flexibility of Three Potential Materials for Autonomous Indoor Humidity Control. Cryst. Growth Des. 2019, 19, 2869–2880. [Google Scholar] [CrossRef]
  27. Kim, S.-I.; Yoon, T.-U.; Kim, M.-B.; Lee, S.-J.; Hwang, Y.K.; Chang, J.-S.; Kim, H.-J.; Lee, H.-N.; Lee, U.-H.; Bae, Y.-S. Metal–organic frameworks with high working capacities and cyclic hydrothermal stabilities for fresh water production. Chem. Eng. J. 2016, 286, 467–475. [Google Scholar] [CrossRef]
  28. Trapani, F.; Polyzoidis, A.; Loebbecke, S.; Piscopo, C.G. On the general water harvesting capability of metal-organic frameworks under well-defined climatic conditions. Microporous Mesoporous Mater. 2016, 230, 20–24. [Google Scholar] [CrossRef]
  29. Kim, H.; Yang, S.; Rao, S.R.; Narayanan, S.; Kapustin, E.A.; Furukawa, H.; Umans, A.S.; Yaghi, O.M.; Wang, E.N. Water harvesting from air with metal-organic frameworks powered by natural sunlight. Science 2017, 356, 430–434. [Google Scholar] [CrossRef] [Green Version]
  30. Hanikel, N.; Prévot, M.S.; Fathieh, F.; Kapustin, E.A.; Lyu, H.; Wang, H.; Diercks, N.J.; Glover, T.G.; Yaghi, O.M. Rapid Cycling and Exceptional Yield in a Metal-Organic Framework Water Harvester. ACS Cent. Sci. 2019, 5, 1699–1706. [Google Scholar] [CrossRef]
  31. Bouson, S.; Krittayavathananon, A.; Phattharasupakun, N.; Siwayaprahm, P.; Sawangphruk, M. Antifungal activity of water-stable copper-containing metal-organic frameworks. R. Soc. Open Sci. 2017, 4, 170654. [Google Scholar] [CrossRef] [PubMed] [Green Version]
  32. Celis-Arias, V.; Loera-Serna, S.; Beltrán, H.I.; Álvarez-Zeferino, J.C.; Garrido, E.; Ruiz-Ramos, R. The fungicide effect of HKUST-1 on Aspergillus niger, Fusarium solani and Penicillium chrysogenum. New J. Chem. 2018, 42, 5570–5579. [Google Scholar] [CrossRef]
  33. Firouzjaei, M.D.; Shamsabadi, A.A.; Aktij, S.A.; Seyedpour, S.F.; Sharifian Gh, M.; Rahimpour, A.; Esfahani, M.R.; Ulbricht, M.; Soroush, M. Exploiting Synergetic Effects of Graphene Oxide and a Silver-Based Metal-Organic Framework to Enhance Antifouling and Anti-Biofouling Properties of Thin-Film Nanocomposite Membranes. ACS Appl. Mater. Interfaces 2018, 10, 42967–42978. [Google Scholar] [CrossRef] [PubMed]
  34. Alvarez, E.; Guillou, N.; Martineau, C.; Bueken, B.; Van de Voorde, B.; Le Guillouzer, C.; Fabry, P.; Nouar, F.; Taulelle, F.; Vos, D.D.; et al. The structure of the aluminum fumarate metal-organic framework A520. Angew. Chem. 2015, 54, 3664–3668. [Google Scholar] [CrossRef] [PubMed]
  35. Leung, E.; Müller, U.; Trukhan, N.; Mattenheimer, H.; Cox, G.; Blei, S. Process for Preparing Porous Metal-Organic Framework Based on Aluminium Fumarate. U.S. Patent 2012/0082864 A1, 30 September 2011. [Google Scholar]
  36. Kummer, H.; Jeremias, F.; Warlo, A.; Füldner, G.; Fröhlich, D.; Janiak, C.; Gläser, R.; Henninger, S.K. A Functional Full-Scale Heat Exchanger Coated with Aluminum Fumarate Metal–Organic Framework for Adsorption Heat Transformation. Ind. Eng. Chem. Res. 2017, 56, 8393–8398. [Google Scholar] [CrossRef]
  37. Jeremias, F.; Fröhlich, D.; Janiak, C.; Henninger, S.K. Advancement of sorption-based heat transformation by a metal coating of highly-stable, hydrophilic aluminium fumarate MOF. RSC Adv. 2014, 4, 24073–24082. [Google Scholar] [CrossRef] [Green Version]
  38. Reinsch, H.; Waitschat, S.; Stock, N. Mixed-linker MOFs with CAU-10 structure: Synthesis and gas sorption characteristics. Dalton Trans. 2013, 42, 4840–4847. [Google Scholar] [CrossRef]
  39. Fröhlich, D.; Pantatosaki, E.; Kolokathis, P.D.; Markey, K.; Reinsch, H.; Baumgartner, M.; van der Veen, M.A.; de Vos, D.E.; Stock, N.; Papadopoulos, G.K.; et al. Water adsorption behaviour of CAU-10-H: A thorough investigation of its structure–property relationships. J. Mater. Chem. A 2016, 4, 11859–11869. [Google Scholar] [CrossRef] [Green Version]
  40. Lenzen, D.; Bendix, P.; Reinsch, H.; Fröhlich, D.; Kummer, H.; Möllers, M.; Hügenell, P.P.C.; Gläser, R.; Henninger, S.; Stock, N. Scalable Green Synthesis and Full-Scale Test of the Metal-Organic Framework CAU-10-H for Use in Adsorption-Driven Chillers. Adv. Mater. 2018, 30. [Google Scholar] [CrossRef]
  41. Lenzen, D.; Zhao, J.; Ernst, S.-J.; Wahiduzzaman, M.; Ken Inge, A.; Fröhlich, D.; Xu, H.; Bart, H.-J.; Janiak, C.; Henninger, S.; et al. A metal-organic framework for efficient water-based ultra-low-temperature-driven cooling. Nat. Commun. 2019, 10, 3025. [Google Scholar] [CrossRef]
  42. Cadiau, A.; Lee, J.S.; Damasceno Borges, D.; Fabry, P.; Devic, T.; Wharmby, M.T.; Martineau, C.; Foucher, D.; Taulelle, F.; Jun, C.-H.; et al. Design of hydrophilic metal organic framework water adsorbents for heat reallocation. Adv. Mater. 2015, 27, 4775–4780. [Google Scholar] [CrossRef]
  43. Permyakova, A.; Skrylnyk, O.; Courbon, E.; Affram, M.; Wang, S.; Lee, U.-H.; Valekar, A.H.; Nouar, F.; Mouchaham, G.; Devic, T.; et al. Synthesis Optimization, Shaping, and Heat Reallocation Evaluation of the Hydrophilic Metal-Organic Framework MIL-160(Al). Chem. Sus. Chem. 2017, 10, 1419–1426. [Google Scholar] [CrossRef] [PubMed]
  44. Tschense, C.B.L.; Reimer, N.; Hsu, C.-W.; Reinsch, H.; Siegel, R.; Chen, W.-J.; Lin, C.-H.; Cadiau, A.; Serre, C.; Senker, J.; et al. New Group 13 MIL-53 Derivates based on 2,5-Thiophenedicarboxylic Acid. Z. Anorg. Allg. Chem. 2017, 643, 1600–1608. [Google Scholar] [CrossRef] [Green Version]
  45. Tannert, N.; Ernst, S.-J.; Jansen, C.; Bart, H.-J.; Henninger, S.K.; Janiak, C. Evaluation of the highly stable metal–organic framework MIL-53(Al)-TDC (TDC = 2,5-thiophenedicarboxylate) as a new and promising adsorbent for heat transformation applications. J. Mater. Chem. A 2018, 6, 17706–17712. [Google Scholar] [CrossRef]
  46. Gaab, M.; Trukhan, N.; Maurer, S.; Gummaraju, R.; Müller, U. The progression of Al-based metal-organic frameworks—From academic research to industrial production and applications. Microporous Mesoporous Mater. 2012, 157, 131–136. [Google Scholar] [CrossRef]
  47. Fröhlich, D.; Henninger, S.K.; Janiak, C. Multicycle water vapour stability of microporous breathing MOF aluminium isophthalate CAU-10-H. Dalton Trans. 2014, 43, 15300–15304. [Google Scholar] [CrossRef] [Green Version]
  48. Jeremias, F.; Khutia, A.; Henninger, S.K.; Janiak, C. MIL-100(Al, Fe) as water adsorbents for heat transformation purposes—a promising application. J. Mater. Chem. 2012, 22, 10148–10151. [Google Scholar] [CrossRef]
  49. Wisser, D.; Wisser, F.M.; Raschke, S.; Klein, N.; Leistner, M.; Grothe, J.; Brunner, E.; Kaskel, S. Biological Chitin-MOF Composites with Hierarchical Pore Systems for Air-Filtration Applications. Angew. Chem. 2015, 54, 12588–12591. [Google Scholar] [CrossRef]
  50. Percot, A.; Viton, C.; Domard, A. Optimization of chitin extraction from shrimp shells. Biomacromolecules 2003, 4, 12–18. [Google Scholar] [CrossRef]
  51. Islam, S.; Bhuiyan, M.A.R.; Islam, M.N. Chitin and Chitosan: Structure, Properties and Applications in Biomedical Engineering. J. Polym. Environ. 2017, 25, 854–866. [Google Scholar] [CrossRef]
  52. Goy, R.C.; de Britto, D.; Assis, O.B.G. A review of the antimicrobial activity of chitosan. Polimeros 2009, 19, 241–247. [Google Scholar] [CrossRef]
  53. Asiabi, M.; Mehdinia, A.; Jabbari, A. Spider-web-like chitosan/MIL-68(Al) composite nanofibers for high-efficient solid phase extraction of Pb(II) and Cd(II). Microchim. Acta 2017, 184, 4495–4501. [Google Scholar] [CrossRef]
  54. Fu, Q.; Wen, L.; Zhang, L.; Chen, X.; Pun, D.; Ahmed, A.; Yang, Y.; Zhang, H. Preparation of Ice-Templated MOF-Polymer Composite Monoliths and Their Application for Wastewater Treatment with High Capacity and Easy Recycling. ACS Appl. Mater. Interfaces 2017, 9, 33979–33988. [Google Scholar] [CrossRef]
  55. Hidalgo, T.; Giménez-Marqués, M.; Bellido, E.; Avila, J.; Asensio, M.C.; Salles, F.; Lozano, M.V.; Guillevic, M.; Simón-Vázquez, R.; González-Fernández, A.; et al. Chitosan-coated mesoporous MIL-100(Fe) nanoparticles as improved bio-compatible oral nanocarriers. Sci. Rep. 2017, 7, 43099. [Google Scholar] [CrossRef] [PubMed]
  56. Li, Q.; Liu, Q.; Zhao, J.; Hua, Y.; Sun, J.; Duan, J.; Jin, W. High efficient water/ethanol separation by a mixed matrix membrane incorporating MOF filler with high water adsorption capacity. J. Membr. Sci. 2017, 544, 68–78. [Google Scholar] [CrossRef]
  57. Singo, M.C.; Molepo, X.C.; Oluwasina, O.O.; Daramola, M.O. Chitosan-impregnated Sod-Metal Organic Frameworks (Sod-ZMOF) for CO2 Capture: Synthesis and Performance Evaluation. Energy Procedia 2017, 114, 2429–2440. [Google Scholar] [CrossRef]
  58. Zhuo, N.; Lan, Y.; Yang, W.; Yang, Z.; Li, X.; Zhou, X.; Liu, Y.; Shen, J.; Zhang, X. Adsorption of three selected pharmaceuticals and personal care products (PPCPs) onto MIL-101(Cr)/natural polymer composite beads. Sep. Purif. Technol. 2017, 177, 272–280. [Google Scholar] [CrossRef]
  59. Liu, L.; Ge, J.; Yang, L.-T.; Jiang, X.; Qiu, L.-G. Facile preparation of chitosan enwrapping Fe3O4 nanoparticles and MIL-101(Cr) magnetic composites for enhanced methyl orange adsorption. J. Porous Mater. 2016, 23, 1363–1372. [Google Scholar] [CrossRef]
  60. Asiabi, M.; Mehdinia, A.; Jabbari, A. Electrospun biocompatible Chitosan/MIL-101 (Fe) composite nanofibers for solid-phase extraction of Δ9-tetrahydrocannabinol in whole blood samples using Box-Behnken experimental design. J. Chromatogr. A 2017, 1479, 71–80. [Google Scholar] [CrossRef] [Green Version]
  61. Sivakumar, P.; Priyatharshni, S.; Nagashanmugam, K.B.; Thanigaivelan, A.; Kumar, K. Chitosan capped nanoscale Fe-MIL-88B-NH 2 metal-organic framework as drug carrier material for the pH responsive delivery of doxorubicin. Mater. Res. Express 2017, 4, 85023. [Google Scholar] [CrossRef]
  62. Liang, X.-X.; Wang, N.; Qu, Y.-L.; Yang, L.-Y.; Wang, Y.-G.; Ouyang, X.-K. Facile Preparation of Metal-Organic Framework (MIL-125)/Chitosan Beads for Adsorption of Pb(II) from Aqueous Solutions. Molecules 2018, 23, 1524. [Google Scholar] [CrossRef] [PubMed] [Green Version]
  63. Kirisits, M.J.; Parsek, M.R. Does Pseudomonas aeruginosa use intercellular signalling to build biofilm communities? Cell. Microbiol. 2006, 8, 1841–1849. [Google Scholar] [CrossRef] [PubMed]
  64. Ramage, G.; Rajendran, R.; Gutierrez-Correa, M.; Jones, B.; Williams, C. Aspergillus biofilms: Clinical and industrial significance. FEMS Microbiol. Lett. 2011, 324, 89–97. [Google Scholar] [CrossRef] [Green Version]
  65. Greenberger, P.A. Allergic bronchopulmonary aspergillosis. J. Allergy Clin. Immunol. 2002, 110, 685–692. [Google Scholar] [CrossRef] [PubMed] [Green Version]
  66. Ustianowski, A.P.; Sieu, T.P.M.; Day, J.N. Penicillium marneffei infection in HIV. Curr. Opin. Infect. Dis. 2008, 21, 31–36. [Google Scholar] [CrossRef]
  67. Duong, T.A. Infection Due to Penicillium marneffei, an Emerging Pathogen: Review of 155 Reported Cases. Clin. Infect. Dis. 1996, 23, 125–130. [Google Scholar] [CrossRef] [Green Version]
  68. Supparatpinyo, K.; Khamwan, C.; Baosoun, V.; Nelson, K.E.; Sirisanthana, T. Disseminated Penicillium marneffei infection in Southeast Asia. Lancet 1994, 344, 110–113. [Google Scholar] [CrossRef]
  69. Naidu, J.; Singh, S.M.; Pouranik, M. Onychomycosis caused by Chaetomium globosum Kunze. Mycopathologia 1991, 113, 31–34. [Google Scholar] [CrossRef]
  70. Abbott, S.P.; Sigler, L.; McAleer, R.; McGough, D.A.; Rinaldi, M.G.; Mizell, G. Fatal cerebral mycoses caused by the ascomycete Chaetomium strumarium. J. Clin. Microbiol. 1995, 33, 2692–2698. [Google Scholar] [CrossRef] [Green Version]
  71. McFeters, G.A.; Bazin, M.J.; Mirelman, D.; Bryers, J.D.; Mitchell, R.; Caldwell, D.E.; Schubert, R.H.W.; Characklis, W.G.; Tanaka, T.; Lund, D.B.; et al. Biofilm Development and Its Consequences. In Microbial Adhesion and Aggregation: Report of the Dahlem Workshop on Microbial Adhesion and Aggregation Berlin 1984, January 15–20; Marshall, K.C., Ed.; Springer: Berlin/Heidelberg, Germany, 1984; pp. 108–124. ISBN 978-3-642-70139-9. [Google Scholar] [CrossRef]
  72. Characklis, W.G. Bioengineering report: Fouling biofilm development: A process analysis. Biotechnol. Bioeng. 1981, 23, 1923–1960. [Google Scholar] [CrossRef]
  73. Herxheimer, H.; Hyde, H.; Williams, D. Allergic asthma caused by fungal spores. Lancet 1966, 1, 572–573. [Google Scholar] [CrossRef]
  74. Baillie, G.S.; Douglas, L.J. Matrix polymers of Candida biofilms and their possible role in biofilm resistance to antifungal agents. J. Antimicrob. Chemother. 2000, 46, 397–403. [Google Scholar] [CrossRef] [PubMed] [Green Version]
  75. Teughels, W.; van Assche, B.; Sliepen, I.; Quirynen, M. Effect of material characteristics and/or surface topography on biofilm development. Clin. Oral Imp. Res. 2006, 17, 68–81. [Google Scholar] [CrossRef] [PubMed]
  76. Deutsches Institut für Normung. DIN EN ISO 846 Plastics—Evaluation of the Action of Microorganisms; Beuth: Berlin, Germany, 2018. [Google Scholar]
  77. Thommes, M.; Kaneko, K.; Neimark, A.V.; Olivier, J.P.; Rodriguez-Reinoso, F.; Rouquerol, J.; Sing, K.S.W. Physisorption of gases, with special reference to the evaluation of surface area and pore size distribution (IUPAC Technical Report). Pure Appl. Chem. 2015, 87, 1051–1069. [Google Scholar] [CrossRef] [Green Version]
  78. Bodmeier, R.; Oh, K.-H.; Pramar, Y. Preparation and Evaluation of Drug-Containing Chitosan Beads. Drug Dev. Ind. Pharm. 1989, 15, 1475–1494. [Google Scholar] [CrossRef]
  79. Wu, S.-J.; Liou, T.-H.; Yeh, C.-H.; Mi, F.-L.; Lin, T.-K. Preparation and characterization of porous chitosan-tripolyphosphate beads for copper(II) ion adsorption. J. Appl. Polym. Sci. 2013, 127, 4573–4580. [Google Scholar] [CrossRef]
  80. Khabzina, Y.; Dhainaut, J.; Ahlhelm, M.; Richter, H.-J.; Reinsch, H.; Stock, N.; Farrusseng, D. Synthesis and Shaping Scale-up Study of Functionalized UiO-66 MOF for Ammonia Air Purification Filters. Ind. Eng. Chem. Res. 2018, 57, 8200–8208. [Google Scholar] [CrossRef]
Figure 1. Schematic formation of (a) aluminum fumarate (Alfum) from Al3+ and fumarate and (b) MIL-160 from Al3+ and 2,5-furandicarboxylate (see Section S1, Figures S1 and S2, Supplementary Information for further details).
Solids 03 00004 g001
Figure 2. Synthesis process of the MOF@chitosan composites and reaction scheme of the crosslinking process below (both with Na5P3O10).
Solids 03 00004 g002
Figure 3. Image (A) shows overgrown composites with Chaetomium globosum; Image (B) shows several spores of Aspergillus falconensis, including heads. (64-fold enlargement of two composites during the growth tests).
Solids 03 00004 g003
Figure 4. PXRD patterns of Alfum90@chitosan composites for a MOF content of 90 wt-%, prepared with different chitosan concentrations. The diffraction patterns for 60 and 80 wt-% Alfum@chitosan are shown in Figure S5 (Supplementary Information). The broad contribution from amorphous chitosan is only seen at lower MOF wt-% (Figure S5). The broadening of the PXRDs is related to the short measurement time of 6 min on the Bruker D2 phaser, which was used due to the large number of samples and is not related to a low crystallinity of the MOF (cf. Figure S3 in the Supplementary Information with the sharper reflexes measured on a Rigaku Miniflex). The PXRD of Alfum was obtained from the purchased MOF from BASF.
Solids 03 00004 g004
Figure 5. Image (A): Nitrogen sorption (77 K) isotherm of Alfum90@chitosan composites with different chitosan concentrations, in comparison with Alfum. Image (B): Water adsorption (293 K) isotherms of Alfum90@chitosan composites with different chitosan concentrations, in comparison with Alfum and crosslinked chitosan. The isotherms for 60 and 80 wt-% Alfum@chitosan are shown in Figures S29 and S37 (Supplementary Information).
Solids 03 00004 g005
Figure 6. SEM images of Alfum80@chitosan at different magnifications (left: overview, right: close-up). EDX-element mapping for aluminum and phosphorus (bottom) for the particle in the overview at top left. The dark features in the element maps, that is, the lower amount of Al and P in the center and to the upper right of the bead are due to X-ray blocking by the groove in the bead surface so that the generated element-specific X-rays cannot be detected.
Solids 03 00004 g006
Figure 7. PXRD patterns of MIL-160(90)@chitosan composites for a MOF content of 90 wt-%, prepared with different chitosan concentrations. The diffraction patterns for 60 and 80 wt-% MIL-160@chitosan are shown in Figure S6 (Supplementary Information). The broad contribution from amorphous chitosan is only seen at lower MOF wt-% (Figure S6). The broadening of the PXRDs are related to the short measurement time of 6 min on the Bruker D2 phaser, which was used due to the large number of samples and is not related to a low crystallinity of the MOF (cf. Figure S4 in the Supplementary Information with the sharper reflexes measured on a Rigaku Miniflex).
Solids 03 00004 g007
Figure 8. Image (A): Nitrogen sorption (77 K) isotherm of MIL-160(90)@chitosan composites with different chitosan concentrations, in comparison with MIL-160. Image (B): Water adsorption (293 K) isotherms of MIL-160(90)@chitosan composites with different chitosan concentrations, in comparison with MIL-160 and crosslinked chitosan. The isotherms for 60 and 80 wt-% MIL-160@chitosan are shown in Figures S30 and S38 (Supplementary Information).
Solids 03 00004 g008
Figure 9. SEM images of MIL-160(90)@chitosan at different magnifications (left: overview; right: close-up). EDX-mapping measurement for aluminum and phosphorus (bottom). The dark features in the element maps, that is, the lower amounts of Al and P in the center and to the upper right of the bead are due to X-ray blocking by the groove in the bead surface so that the generated element-specific X-rays cannot be detected.
Solids 03 00004 g009
Figure 10. Pictures of the Alfum80@chitosan composite materials in the fungus test with Aspergillus falconensis. (Image (A): Visual naked-eye observation; Image (B): microscopic image).
Solids 03 00004 g010
Figure 11. Representative pictures of Alfum and crosslinked chitosan materials in the fungus test with Aspergillus falconensis. (Visual naked-eye observation). The diameter of the pressed white composite pellet is 1.3 cm.
Solids 03 00004 g011
Figure 12. Pictures of the Alfum@PVA and Alfum@Silikophen® materials in the fungus test with Aspergillus falconensis. (Visual naked-eye observations).
Solids 03 00004 g012
Table 1. Details of the relative and absolute MOF and polymer amounts.
CompositeCrosslinker aMOF AmountPolymer Amount Solution Volume and Concentration
MOF60@ChitosanNa5P3O1060% 40%20 or 6 mL,
(180 mg)(120 mg)6 or 20 g L−1
MOF80@ChitosanNa5P3O1080%20%10 or 3 mL,
(240 mg)(60 mg)6 or 20 g L−1
MOF90@ChitosanNa5P3O1090%10%10 or 3 mL,
(540 mg)(60 mg)6 or 20 g L−1
MOF@PVA-80%20%2 mL,
(480 mg)(120 mg)60 g L−1
MOF@Silikophen®-Highlow only on surface b10 mL of Silikophen in 30 mL of xylene
a 10 wt% solution. b Amount of polymer cannot be determined due to the dip coating process.
Table 2. Evaluation of the growth strength for the visual assessment, based on DIN EN ISO 846.
MethodCategoryGrowth Intensity, ObservationAssessment of the Sample Material
A0no growth visible under microscopic observationmaterial does not serve as a nutrient for microorganisms; it is “inert” or “fungistatic”
1no growth visible with the naked eye, but clearly visible under the microscope at 50 times magnificationmaterial contains nutrients or is only slightly soiled, so that only slight growth is possible
2growth visible to the naked eye, up to 25% of the sample surface overgrownmaterial is not resistant to fungal attack and contains nutrients for the development of microorganisms
3growth visible to the naked eye, up to 50% of the sample surface overgrown
4significant growth, over 50% of the sample surface overgrown
5strong growth, entire sample surface overgrown
Table 3. BET-surface areas, pore volumes, and water uptake values of the composite materials and the educts.
Educt/Composite MaterialsCTS
Conc. [g L−1]
BET-Surface
[m2 g−1]
Pore Volume
[cm3 g−1] a
Water Uptake [mg g−1] at 0.9 p p0−1
Meas.
(% of Calc.)
Calc. bMeas.
(% of Calc)
Calc. bMeas.
(% of Calc.)
Calc. a
chitosan6144-0.30-428-
chitosan20230-0.46-408-
chitosan30220-0.45---
chitosan40202-0.40---
Alfum (Basolite® A520)-988-0.51-449-
Alfum60@chitosan620 (3)6500.23 (53)0.43--
Alfum60@chitosan20294 (43)6850.18 (37)0.49--
Alfum60@chitosan30202 (30)6810.16 (33)0.49--
Alfum60@chitosan4026 (4)6740.43 (91)0.47--
Alfum80@chitosan6474 (58)8190.29 (62)0.47393 (88)445
Alfum80@chitosan20587 (70)8360.35 (70)0.50468 (106)441
Alfum80@chitosan d.s. c6844 (103)8190.67 (143)0.47--
Alfum80@chitosan d.s. c20893 (107)8360.58 (116)0.50--
Alfum90@chitosan6964 (107)9040.54 (110)0.49457 (102)447
Alfum90@chitosan20856 (94)9120.48 (94)0.51434 (98)445
MIL-160-1186-0.48-368-
MIL-160(60)@chitosan632 (4)7690.22 (54)0.41--
MIL-160(60)@chitosan20138 (17)8040.47 (100)0.47--
MIL-160(80)@chitosan6720 (74)9780.34 (77)0.44347 (91)380
MIL-160(80)@chitosan20610 (61)9950.29 (60)0.48370 (98)376
MIL-160(80)@chitosan d.s. c6858 (88)9780.46 (105)0.44--
MIL-160(80)@chitosan d.s. c20918 (92)9950.47 (98)0.48--
MIL-160(90)@chitosan61068 (99)10820.44 (96)0.46395 (106)374
MIL-160(90)@chitosan20964 (88)10900.41 (85)0.48392 (105)372
a Pore volume at 0.9 p p0−1. b The calculated (expected) mass-corrected BET surfaces (1), pore volumes (2), and the water uptake values (3) were derived as the sum of the mass-weighted SBET, Vpore, or H2O uptake of the MOFs and SBET, Vpore, or H2O uptake of the chitosan with the following three formulas:   S B E T c a l c = w t - % M O F * S B E T M O F + w t - % C h i t o s a n * S B E T C h i t o s a n (1); V p o r e c a l c = w t - % M O F * V p o r e M O F + w t - % C h i t o s a n * V p o r e C h i t o s a n (2); H 2 O   u p t a k e c a l c = w t - % M O F * H 2 O   u p t a k e M O F + w t - % C h i t o s a n * H 2 O   u p t a k e C h i t o s a n (3). with SBET(Alfum) = 988 m2 g−1, SBET(MIL-160) = 1186 m2 g−1, etc. c d.s. = dried supercritically for activation prior to sorption measurements.
Table 4. Comparison of the results of the tests for microbial metabolism for Aspergillus falconensis.
Composite MaterialAspergillus falconensis
n = 3
123
chitosan medium molecular weight355
chitosan crosslinked with Na5P3O10055
Alfum60@chitosan000
Alfum80@chitosan000
Alfum90@chitosan200
MIL-160(60)@chitosan200
MIL-160(80)@chitosan100
MIL-160(90)@chitosan200
Alfum355
MIL-160111
Alfum@PVA233
MIL-160@PVA022
Alfum@Silikophen®555
MIL-160@Silikophen®122
Publisher’s Note: MDPI stays neutral with regard to jurisdictional claims in published maps and institutional affiliations.