Article

Thermoelectric Properties of Pnma and Rocksalt SnS and SnSe

by
Joseph M. Flitcroft
,
Ioanna Pallikara
and
Jonathan M. Skelton
*
Department of Chemistry, University of Manchester, Oxford Road, Manchester M13 9PL, UK
*
Author to whom correspondence should be addressed.
Solids 2022, 3(1), 155-176; https://doi.org/10.3390/solids3010011
Submission received: 15 February 2022 / Revised: 7 March 2022 / Accepted: 8 March 2022 / Published: 17 March 2022
(This article belongs to the Special Issue Feature Papers of Solids 2021)

Abstract

:
Thermoelectric materials convert waste heat to electricity and are part of the package of technologies needed to limit global warming. The tin chalcogenides SnS and SnSe are promising candidate thermoelectrics, with orthorhombic SnSe showing some of the highest figures of merit Z T reported to date. As for other Group IV chalcogenides, SnS and SnSe can form rocksalt phases under certain conditions, but the thermoelectric properties of these phases are largely unexplored. We have applied a fully ab initio modelling protocol to compare the Z T of the orthorhombic and rocksalt phases of SnS and SnSe. Electronic structures from hybrid density-functional theory were used to calculate the three electrical transport properties, including approximate models for the electron relaxation times, and lattice dynamics calculations were performed to model the phonon spectra and lattice thermal conductivities. We obtained good estimates of the Z T of the well-studied orthorhombic phases. The rocksalt phases were predicted to show larger electrical conductivities and similar Seebeck coefficients to the orthorhombic phases, resulting in higher thermoelectric power factors, but these were offset by larger thermal conductivities. These results therefore motivate further investigation of the recently discovered “ π -cubic” phases of SnS and SnSe, which are based on distorted rocksalt supercells, to establish their thermoelectric performance.

1. Introduction

The growing worldwide demand for energy and the urgent need to reduce anthropogenic greenhouse gas emissions to limit global warming are among the most important challenges in contemporary science. Meeting ambitious climate goals requires a package of technologies including clean energy sources, energy storage systems, and means to improve the efficiency of energy-intensive processes. It is estimated that around 60% of the energy used globally is currently wasted as heat [1], which has led to significant interest in thermoelectric (TE) power.
Thermoelectric generators (TEGs) harness the Seebeck effect in a TE material to extract electrical energy from a temperature gradient [2]. TEGs are solid-state devices with no moving parts and, as such, have diverse applications from powering remote sensing devices, to recovering energy from exhaust gases in combustion engines, to repurposing decommissioned oil rigs as geothermal power plants [2,3].
The performance of a TE material is typically expressed by the dimensionless figure of merit Z T [1,2]:
Z T = S 2 σ T κ el + κ latt
where S is the Seebeck coefficient, σ is the electrical conductivity, and κ el and κ latt are the electronic and lattice (phonon) components of the thermal conductivity κ . S, σ , and κ el depend on the electronic structure of the material and are interdependent through the carrier concentration n, such that the best balance is typically found in heavily-doped semiconductors [1]. κ latt depends on the structure and chemical bonding and is generally minimised in materials composed of heavy elements, with weak chemical bonding [4] and/or with strongly anharmonic lattice dynamics associated with structural features such as phase transitions [5,6,7] and active lone pairs [8].
These requirements together have historically led to a focus on “heavy” chalcogenide materials. The current industry-standard TE for room-temperature applications is Bi2Te3 ( Z T ≃ 1 from 350–450 K) [2], due to its favourable electronic structure and intrinsically low lattice thermal conductivity. Engineered PbTe is a leading candidate for high-temperature applications ( Z T ≃ 2.2 with endotaxial nanostructuring with SrTe [9]), due to a “convergence” of the band structure leading to multiple band extrema at elevated temperatures and strongly anharmnonic lattice dynamics [10,11]. However, the environmental toxicity of Pb and the rarity of Te means that both materials are unsuitable for mass-produced TEGs and are restricted to niche applications. There has therefore been significant research effort devoted to exploring alloys such as Bi2(S, Se, Te)3 [12,13] and Pb(S, Se, Te) [14,15], as well as other chalcogenide systems [16,17,18].
Following the surprise discovery of a high figure of merit in bulk SnSe [19,20], the tin monochalcogenides SnS and SnSe are regarded as highly promising alternatives. Due to their favourable electrical properties, both materials have been extensively studied for optoelectronic applications including in photovoltaics [21,22,23,24,25] and photodetectors [26,27]. Both SnS and SnSe naturally adopt a layered orthorhombic Pnma structure that undergoes a second-order phase transition to a higher-symmetry Cmcm phase at high temperature [28]. The strong intrinsic phonon anharmonicity associated with this transition leads to an ultra-low thermal conductivity [5,6,29], which is despite the tin chalcogenides being composed of lighter elements and possessing stronger chemical bonding than the comparable telluride PbTe [30]. SnS has also been studied as a potential TE [31,32,33], and a Z T of one has been obtained for doped polycrystals [33], but the performance has yet to match that of SnSe. However, studies of Sn(S1−xSex) alloys have found that Se-rich alloys can potentially show higher performance than pure SnSe [34,35,36].
Whereas orthorhombic SnS and SnSe have been extensively studied, both monochalcogenides can form alternative cubic rocksalt (RS) and “ π ” phases whose thermoelectric properties are less well characterised. Epitaxial growth of RS SnS and SnSe on NaCl substrates was reported as early as the 1960s [37,38]. “Cubic” SnS was subsequently prepared in nanoparticulate form and proposed to be a zincblende (ZB) phase based on the morphology [39,40]. However, the ZB phase was predicted to be unstable in theoretical calculations, sparking a debate that was eventually settled when a new π phase based on a distorted rocksalt structure was identified and solved in 2016 [41,42]. An analogous π phase of SnSe has since been prepared and characterised [43]. Subsequent calculations confirmed that π -SnS is a low-energy metastable phase, RS SnS is dynamically unstable in bulk but can be stabilised under pressure or epitaxial strain, and ZB SnS is both energetically and dynamically unstable [44]. Recently, further calculations to investigate the SnS and SnSe phase diagrams established that the RS structure is a low-energy metastable phase of SnSe and is predicted to form in bulk over a narrow range of temperatures and pressures [45].
Since the RS phases of SnS and SnSe can potentially be prepared—e.g., by epitaxial growth on a suitable contact material in a device—it is of interest to compare their thermoelectric properties to the corresponding orthorhombic phases. Indeed, a recent computational study on rocksalt SnSe suggested it may show similar band convergence to PbTe together with a low lattice thermal conductivity, both of which are indicative of good thermoelectric performance [46]. In this work, we have used first-principles theoretical modelling to compare the structural dynamics, electronic structure, and transport properties of the Pnma and RS phases of SnS and SnSe. We utilise electronic structures from hybrid density-functional theory (DFT) with semi-classical Boltzmann transport calculations, including approximate models for the electron relaxation times, to estimate the electrical properties, and we compute phonon spectra and determine the lattice thermal conductivities using the single-mode relaxation time approximation. The resulting fully ab initio protocol for predicting the Z T yields results for the orthorhombic phases that are in good agreement with experiments. We predict that the rocksalt phases would show higher electrical conductivities and comparable Seebeck coefficients to the orthorhombic phases, resulting in higher thermoelectric power factors S 2 σ , but that these would generally be offset by larger electrical and lattice thermal conductivities. Our results suggest that if RS SnS can be stabilised at a geometry close to its equilibrium lattice constant it may show a larger Z T than the Pnma phase, and this strongly motivates further investigation of the thermoelectric properties of the rocksalt-derived π phases of both chalcogenides.

2. Computational Modelling

Calculations were performed using pseudopotential plane wave density functional (DFT) as implemented in the Vienna Ab initio Simulation Package (VASP) code [47].
Electron exchange and correlation were described using the PBEsol generalised gradient approximation (GGA) functional [48] with the DFT-D3 dispersion correction [49]. The ion cores were modelled using projector-augmented wave (PAW) pseudopotentials [50,51] with the Sn 5s, 5p, and 4d and the S 3s/3p and Se 4s/4p electrons treated as valence states. The valence wavefunctions were described using a plane wave basis with a 600 eV kinetic energy cutoff. The electronic Brillouin zones were sampled using Γ -centred Monkhorst–Pack k -point meshes [52] with 4 × 8 × 8 subdivisions for the Pnma structures and 10 × 10 × 10/6 × 6 × 6 subdivisions for the rocksalt primitive/conventional cells. The electronic wavefunctions were optimised to a tolerance of 10 8 eV on the total energy.
Optimised equilibrium structures of Pnma and RS SnS and SnSe were taken from our previous study [45]. Since the equilibrium structure of RS SnS possesses phonon instabilities [44,45], we also investigated a compressed structure with a 5% smaller lattice constant (14.3% smaller volume) for which the imaginary mode becomes real.
Lattice dynamics calculations were performed using the Phonopy package [53]. Second-order (harmonic) force constants, computed using the supercell finite-differences approach with 1 × 6 × 6 expansions of the Pnma unit cells and 3 × 3 × 3 expansions of the rocksalt conventional cells, were taken from our previous work [45]. A transformation matrix was applied to convert from the rocksalt conventional to the corresponding primitive cell during post-processing. Atom-projected phonon density of states (PDoS) curves were computed by interpolating the phonon frequencies onto regular Γ -centred q -point grids with 8 × 48 × 48 and 32 × 32 × 32 subdivisions for the Pnma and RS phases, respectively, and using the linear tetrahedron method for Brillouin zone integration. Phonon dispersions were computed by evaluating the frequencies at strings of q -points passing through the high-symmetry points in the Pnma and RS Brillouin zones.
Electronic transport calculations were performed using the AMSET code [54]. Initial electronic structure calculations were performed using the HSE 06 hybrid functional [55] to obtain accurate bandgaps. Uniform band structures and sets of Kohn–Sham wavefunction coefficients were then computed using PBEsol + D3 and denser 8 × 16 × 16 and 20 × 20 × 20 k -point meshes for the Pnma and RS structures, respectively, and the bandgaps increased to the HSE 06 values using appropriate scissors operators. AMSET computes electronic relaxation times by summing scattering rates from four different processes, namely acoustic deformation potential (ADP), piezoelectric (PIE), polar optical phonon (POP), and ionised impurity (IMP) scattering. For ADP scattering, deformation potentials were computed by performing a series of single-point energy calculations on deformed structures generated using AMSET with HSE 06, and elastic constants were computed using PBEsol + D3 and the finite-differences routines in VASP. PIE scattering is not relevant to any of the materials considered here as the Pnma and RS ( F m 3 ¯ m ) space groups are centrosymmetric and the piezoelectric moduli vanish. For POP scattering, high-frequency and static dielectric constants ε and ε s = ε + ε ionic were determined using the density-functional perturbation theory (DFPT) and finite-difference routines in VASP [56], and the POP frequencies ω po were determined as a weighted average of the phonon frequencies at q = Γ , obtained using Phonopy, with the infrared (IR) activities computed using Born effective charges Z * from DFPT [57]. As described in the text, for the RS phases, we also computed ε , ε s , and Z * using HSE 06, with the finite-field method used to determine ε and ε s [58,59]. Finally, for IMP scattering, the required ε s were determined as for the POP scattering. For all of these calculations, we switched to Sn PAW pseudopotentials with the Sn 4d electrons in the core. We found this had no significant impact on the calculated electronic structures or bandgaps, but by reducing the number of valence electrons per formula unit by a factor of two it made the HSE 06 calculations significantly less demanding.
Thermal conductivity calculations were performed using the Phono3py code [60]. The thermal conductivities of Pnma SnS and SnSe were taken from another of our previous studies, which used a very similar technical setup [61]. A comparison of the optimised lattice parameters computed for these two structures in this work and [61] is provided as Supplemental Materials. Third-order (anharmonic) force constants for the RS models were computed in 2 × 2 × 2 expansions of the conventional cell and combined with the second-order force constants from the larger 3 × 3 × 3 expansions. The force constants were calculated using PBEsol + D3 and with additional support grids with 8 × the number of points as the standard charge density grids to ensure accurate forces. The thermal conductivities were then computed from modal properties evaluated on 28 × 28 × 28 sampling meshes.

3. Results and Discussion

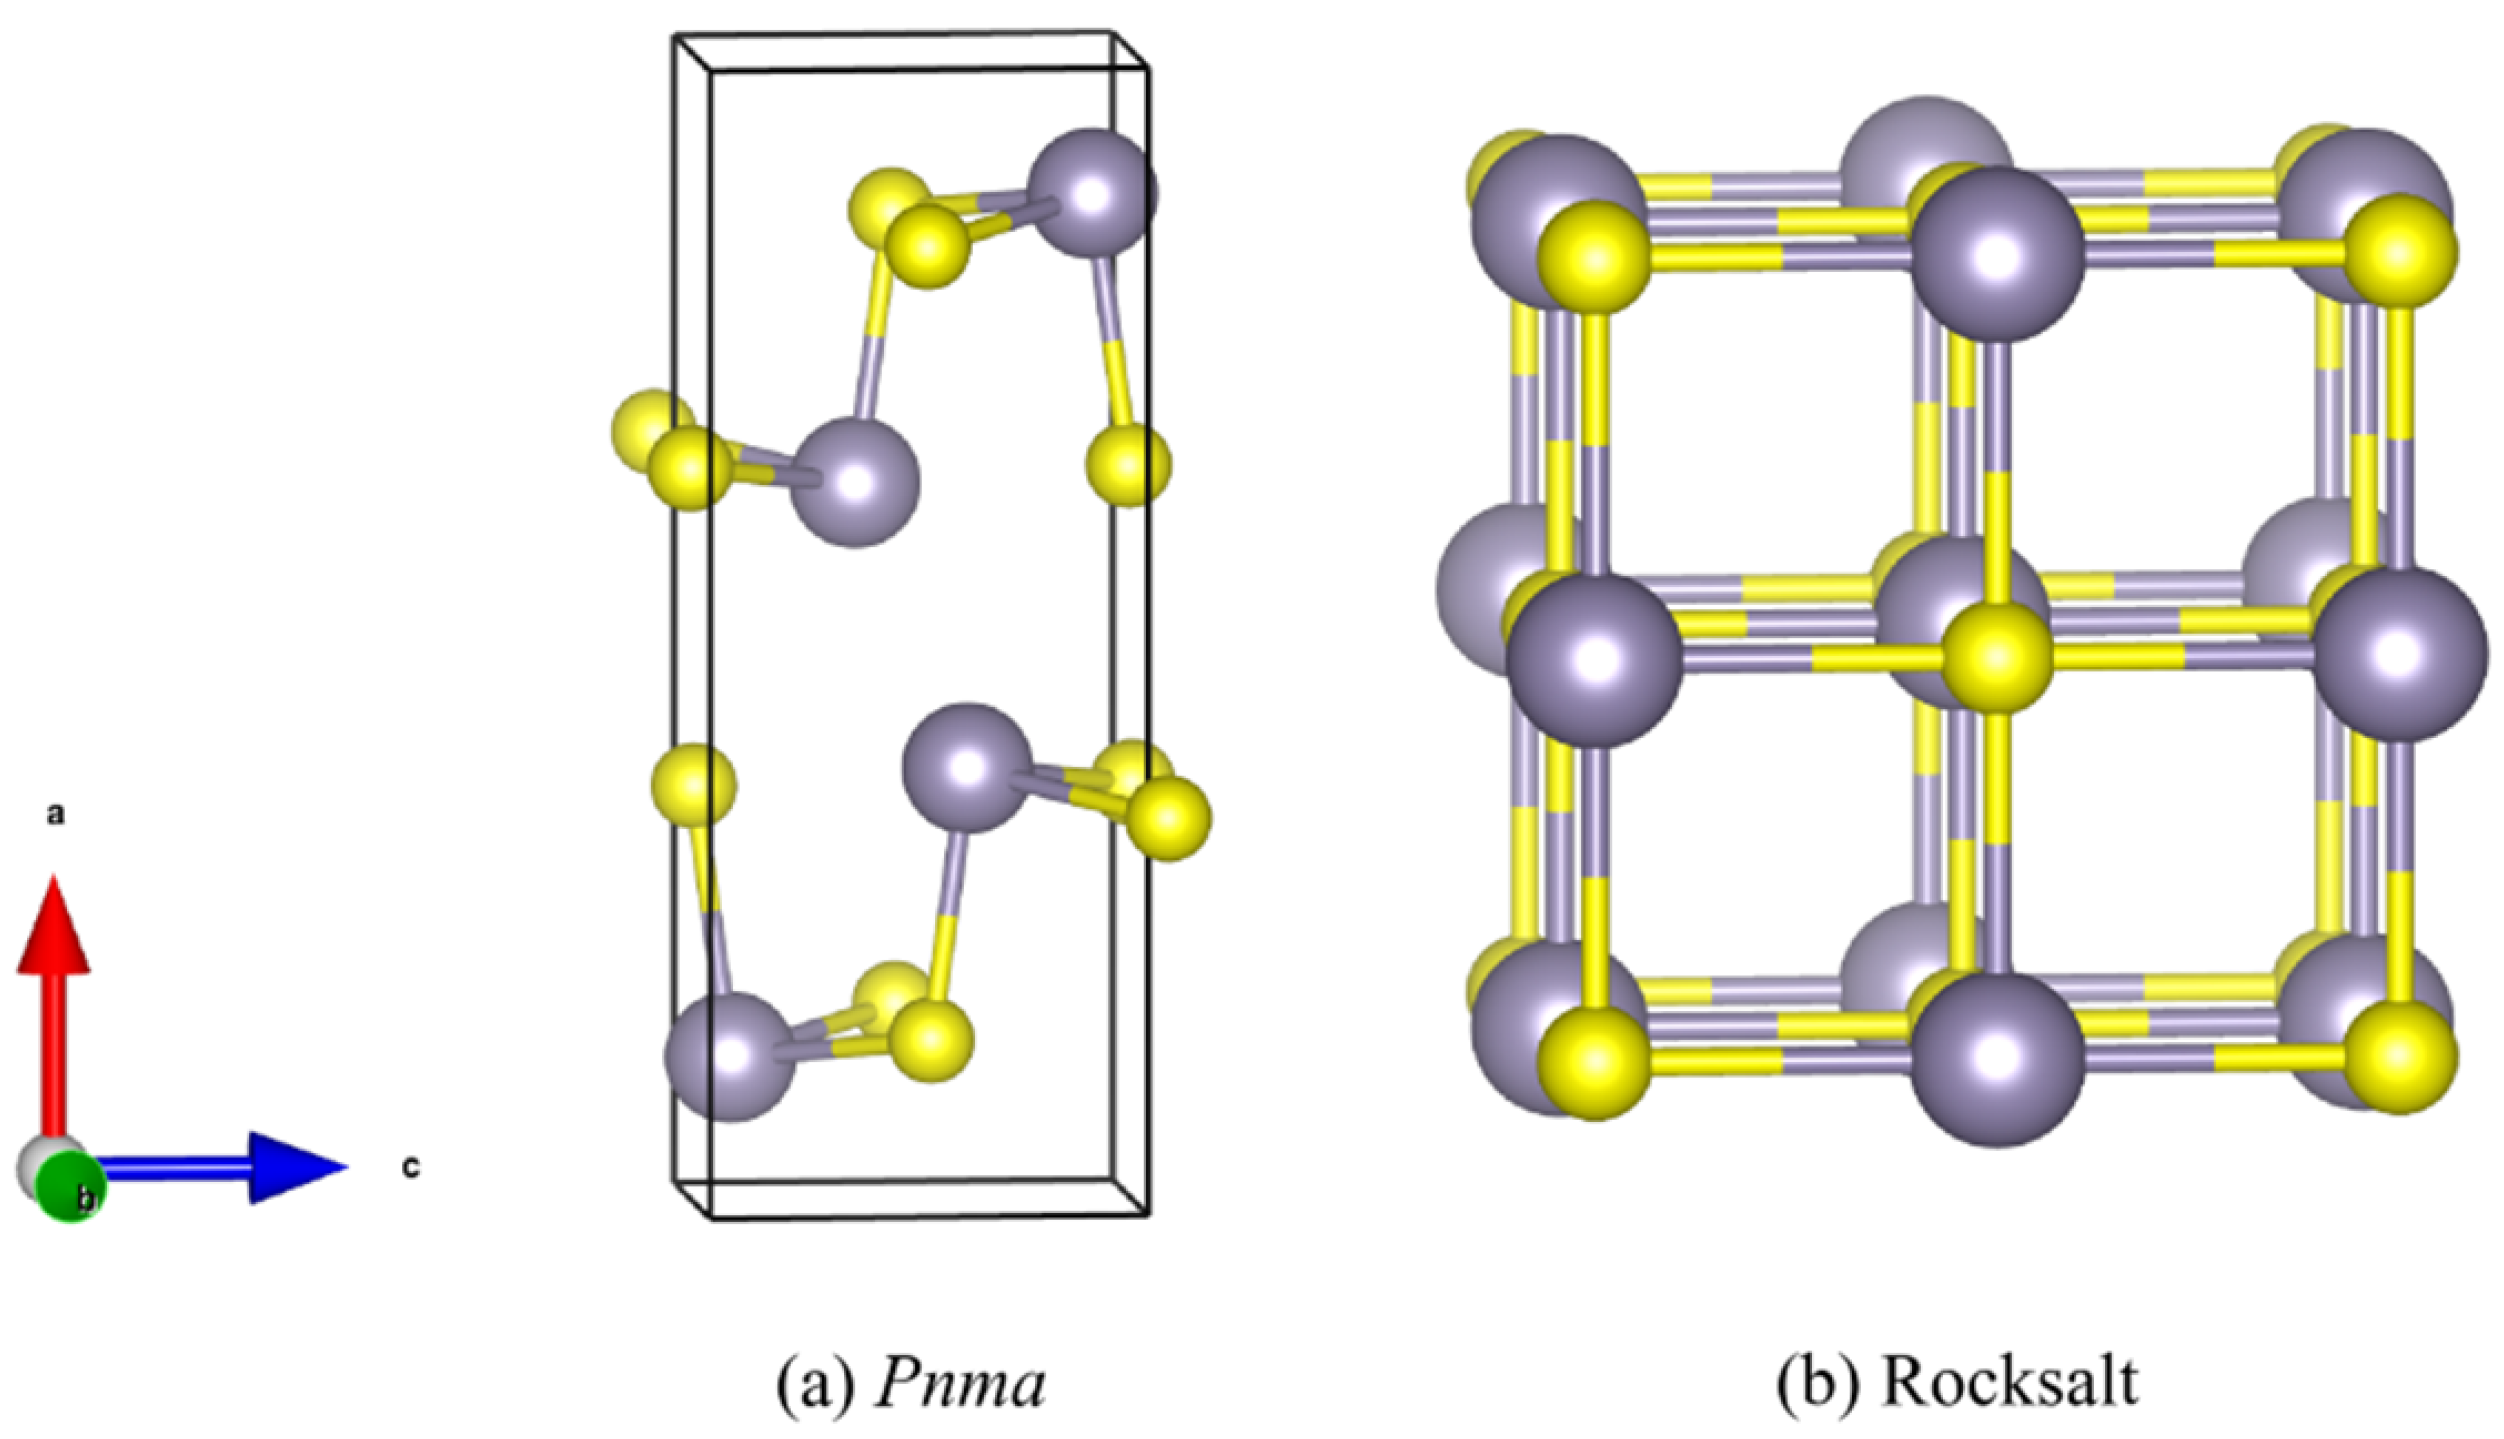
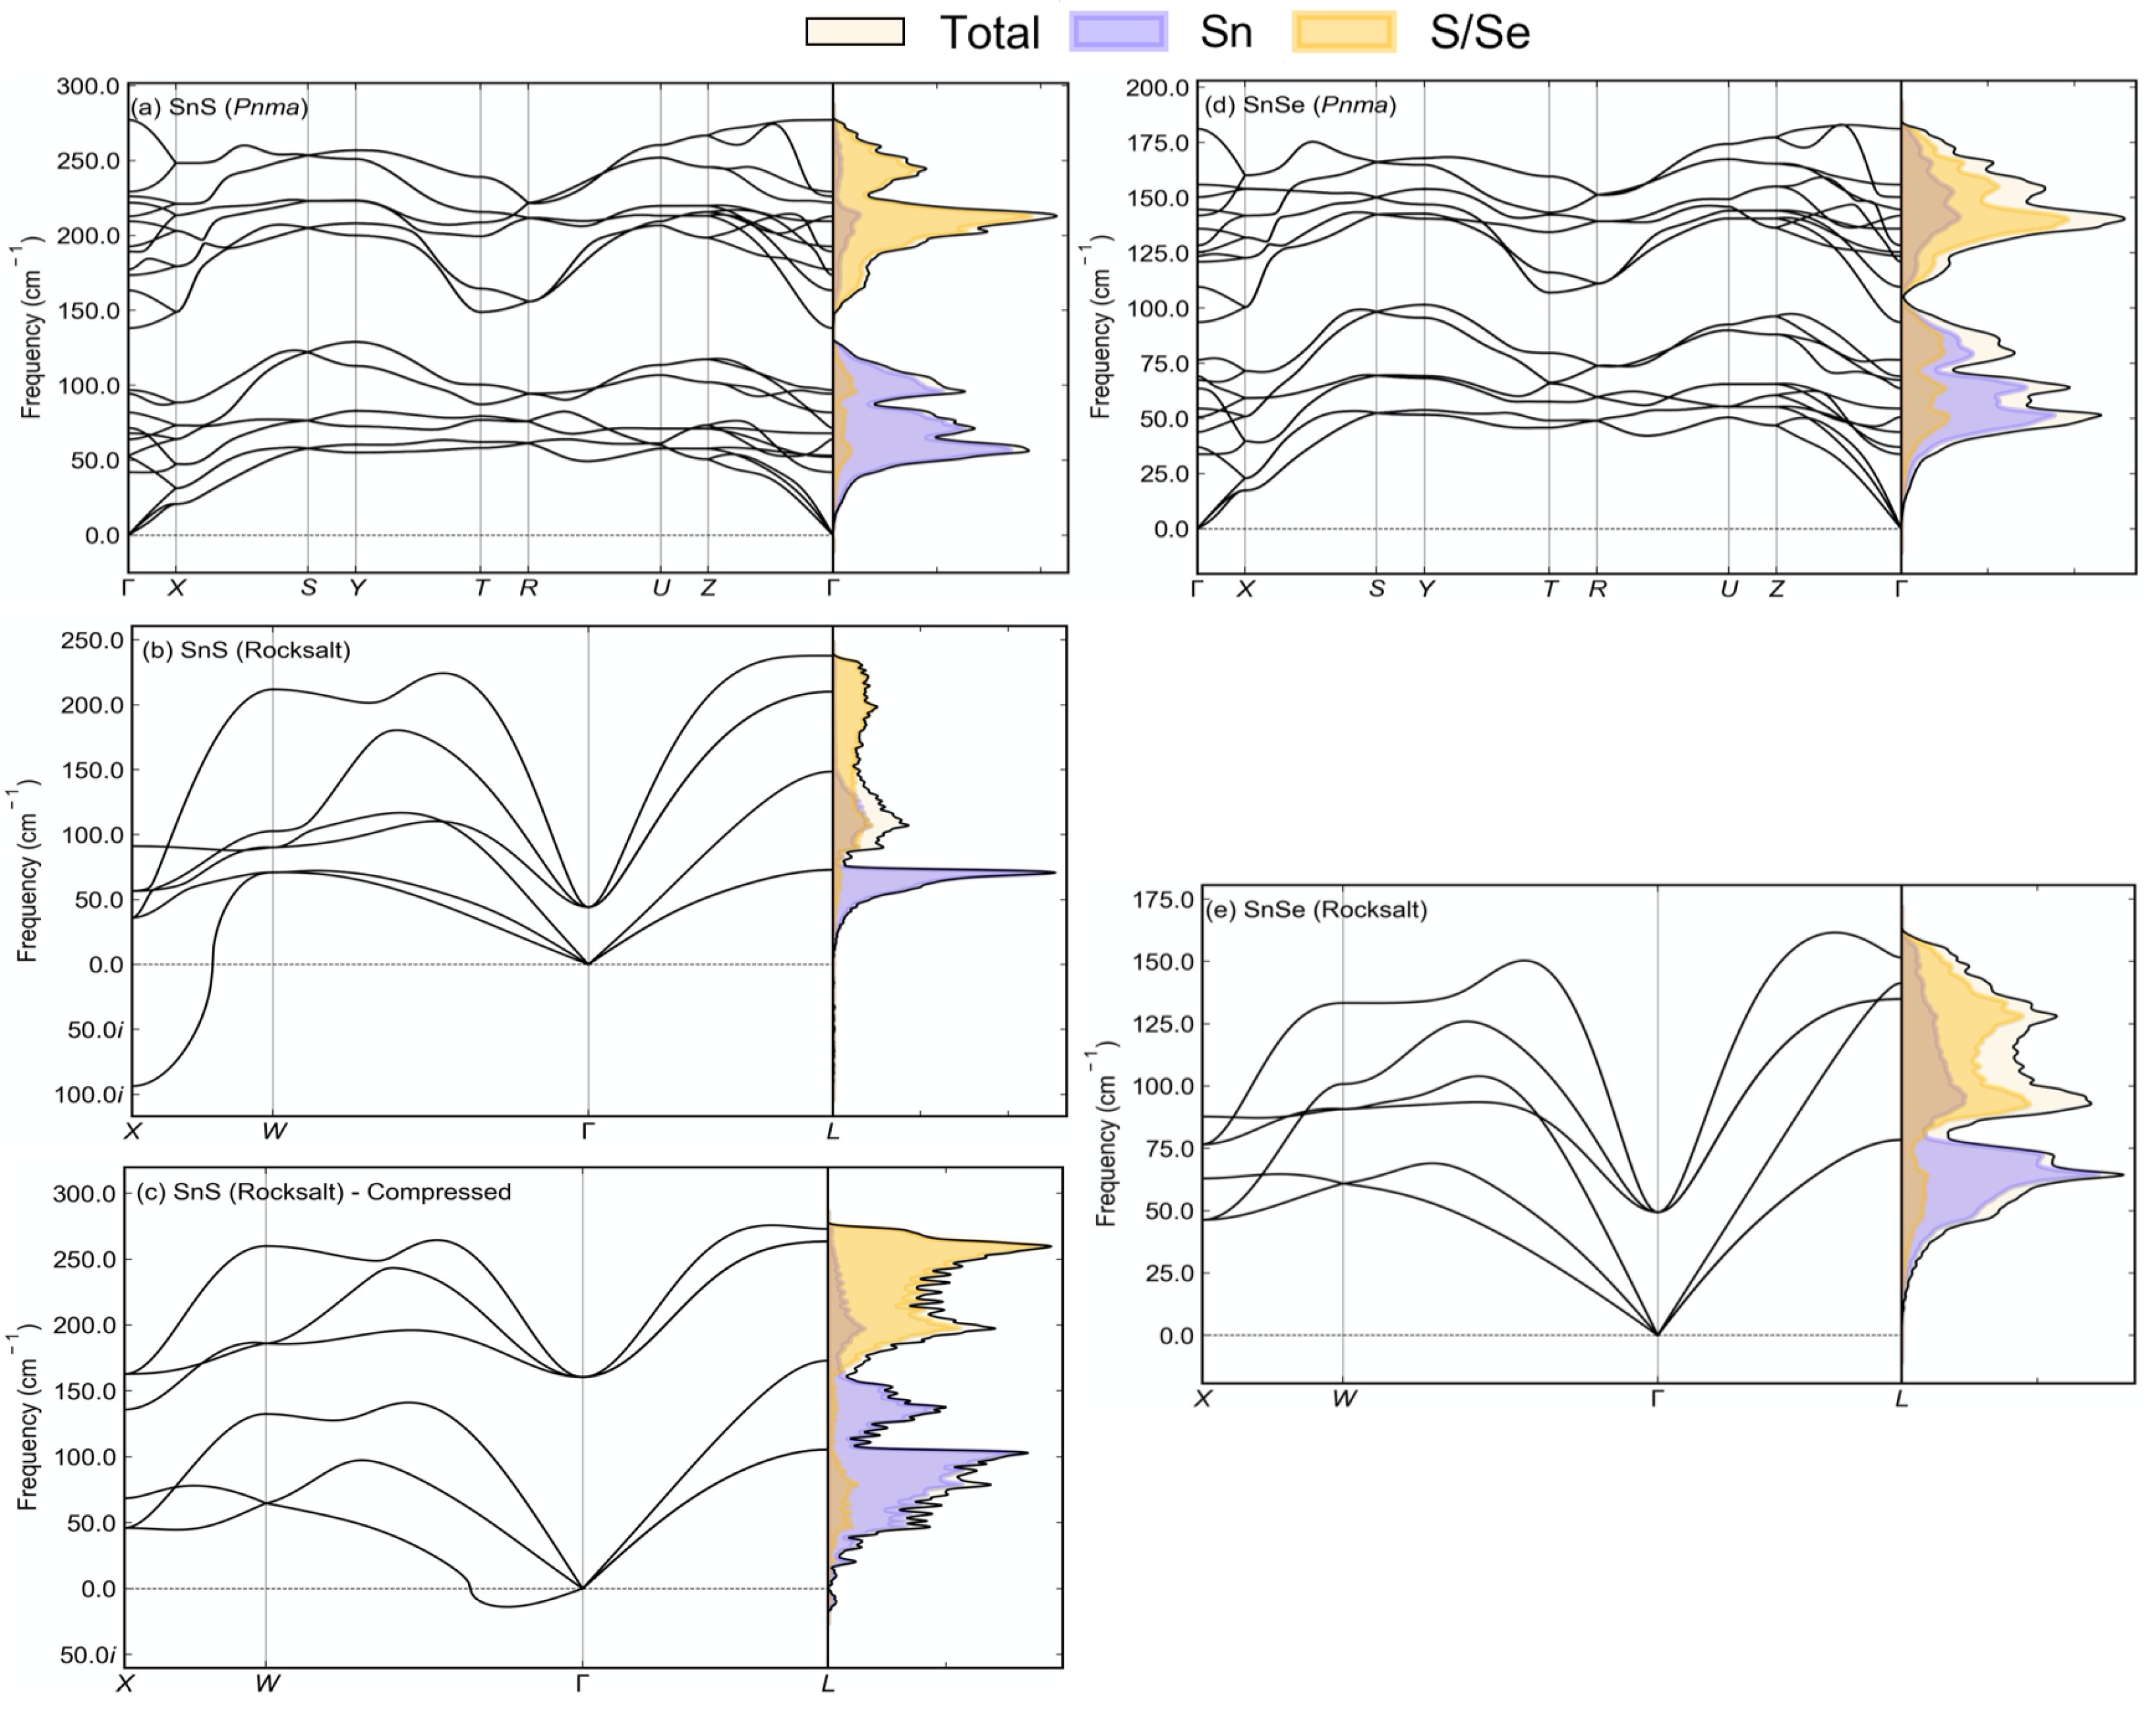
3.1. Structure and Lattice Dynamics

Representative structures of the orthorhombic Pnma and cubic rocksalt (RS) structures of the tin monochalcogenides are shown in Figure 1. The RS structure has an octahedral bonding environment in which each Sn(II) cation has six nearest-neighbour chalcogen ions with equal Sn–Ch bond lengths. The Pnma structure can be thought of as a distortion of the RS structure where alternate layers are misaligned along one direction to produce a pseudo-2D layered structure. Within each layer, the Sn(II) cations adopt a distorted local geometry with three bonds to neighbouring chalcogen ions and a stereochemically active Sn 5s lone pair that projects into the interlayer spacing to facilitate a dispersive (van der Waals) interaction between layers.
The optimised lattice parameters of the five structures obtained with PBEsol + D3 are collected in Table 1. The Pnma lattice constants are a good match for the 295 K neutron-scattering measurements in [28], namely a = 11.143, b = 3.971, and c = 4.336 Å for SnS (0.15–3.1% smaller) and a = 11.501, b = 4.153, and c = 4.445 Å for SnSe (0.7–2.5% smaller). These discrepancies may in part be due to the fact that the DFT calculations are “athermal”, i.e., the optimised structures are those at 0 K without corrections for the vibrational zero-point energy, whereas the experimental measurements at finite temperature may include a small amount of thermal expansion. It is interesting to note that the mismatch between the measured and optimised lattice parameters is anisotropic and is consistently smallest along the b axes and largest along the c axes. As seen in molecular dynamics simulations, the interatomic distances along this direction are substantially affected by the incipient PnmaCmcm phase transition, which, given its second-order nature, leads to structural changes that begin to manifest even at room temperature [63]. Nonetheless, we still consider the discrepancies with experimental measurements to be acceptable, and we therefore do not consider this to be too big an issue.
While we would not necessarily expect a good match between optimised bulk lattice constants and those of epitaxial thin films, the optimised lattice constants for equilibrium and compressed RS SnS are 1.5 smaller than the value of 5.8 Å measured for RS SnS grown epitaxially on NaCl in [38], and the optimised lattice constant for RS SnSe is only 1.3% smaller than the 5.99 Å reported in [37].
The calculated phonon dispersion and atom-projected density of states (PDoS) curves of the five structures are shown in Figure 2. The Pnma structure has eight atoms in the unit cell, resulting in 24 branches at each phonon wavevector q , whereas the higher-symmetry rocksalt structure has a smaller two-atom primitive cell and only six branches in the dispersion. The DoS curves show distinct low- and high-frequency components corresponding respectively to the motion of the Sn and chalcogen atoms, resulting in the appearance of a “phonon bandgap” in the Pnma dispersions. The separation is more pronounced in the sulphides than in the selenides, which reflects the smaller mass difference and more covalent bonding in the selenides. The upper limit of the frequency spectrum is 25 cm 1 higher in the Pnma phases of both chalcogenides than in the corresponding equilibrium RS structures, although compression of RS SnS leads to a stiffening of the optic modes, which is most noticeable around q = Γ .
As found in previous studies [44,45], the equilibrium structure of RS SnS shows a prominent imaginary mode at q = X, which hardens and becomes real under compression, whereas RS SnSe is predicted to be dynamically stable. (We note that the dispersion of compressed SnS shows a small imaginary mode along the Γ -W path, which we ascribe to an interpolation artefact as a result of the finite supercell size used to compute the force constants.) The contrasting stability of the equilibrium rocksalt SnS and SnSe structures can be explained using the revised lone pair model proposed by Walsh et al. [64] The interaction between the Sn 5s and chalcogen p orbitals produces high-energy antibonding orbitals that can interact with the Sn 5p and indirectly mediate a coupling between the Sn 5s and 5p states. This interaction is forbidden by symmetry in the octahedral coordination coordination environment in the RS phase, but is supported by the distorted local geometry in the Pnma structure. The lower-energy Sn 3p orbitals are more closely matched in energy to the Sn 5s, which results in a strong orbital interaction and a stronger propensity to distort away from the symmetric RS structure. Conversely, the poorer energy match between the Sn 5s and Se 4p orbitals results in a weaker preference for the distorted Pnma structure, so RS SnSe is both dynamically stable and considerably closer in energy to the orthorhombic phase [45]. The same structural chemistry is seen in the bismuth chalcogenides, where Bi2S3 preferentially adopts a low-symmetry orthorhombic Pnma phase while Bi2Se3 and Bi2Te3 are more stable in a rhombohedral R 3 ¯ m phase with the Bi cations in an octahedral bonding environment [13]. On the other hand, compression shortens the Sn–S bond lengths and introduces a barrier to the structural distortion, which causes the imaginary mode to harden and become real.

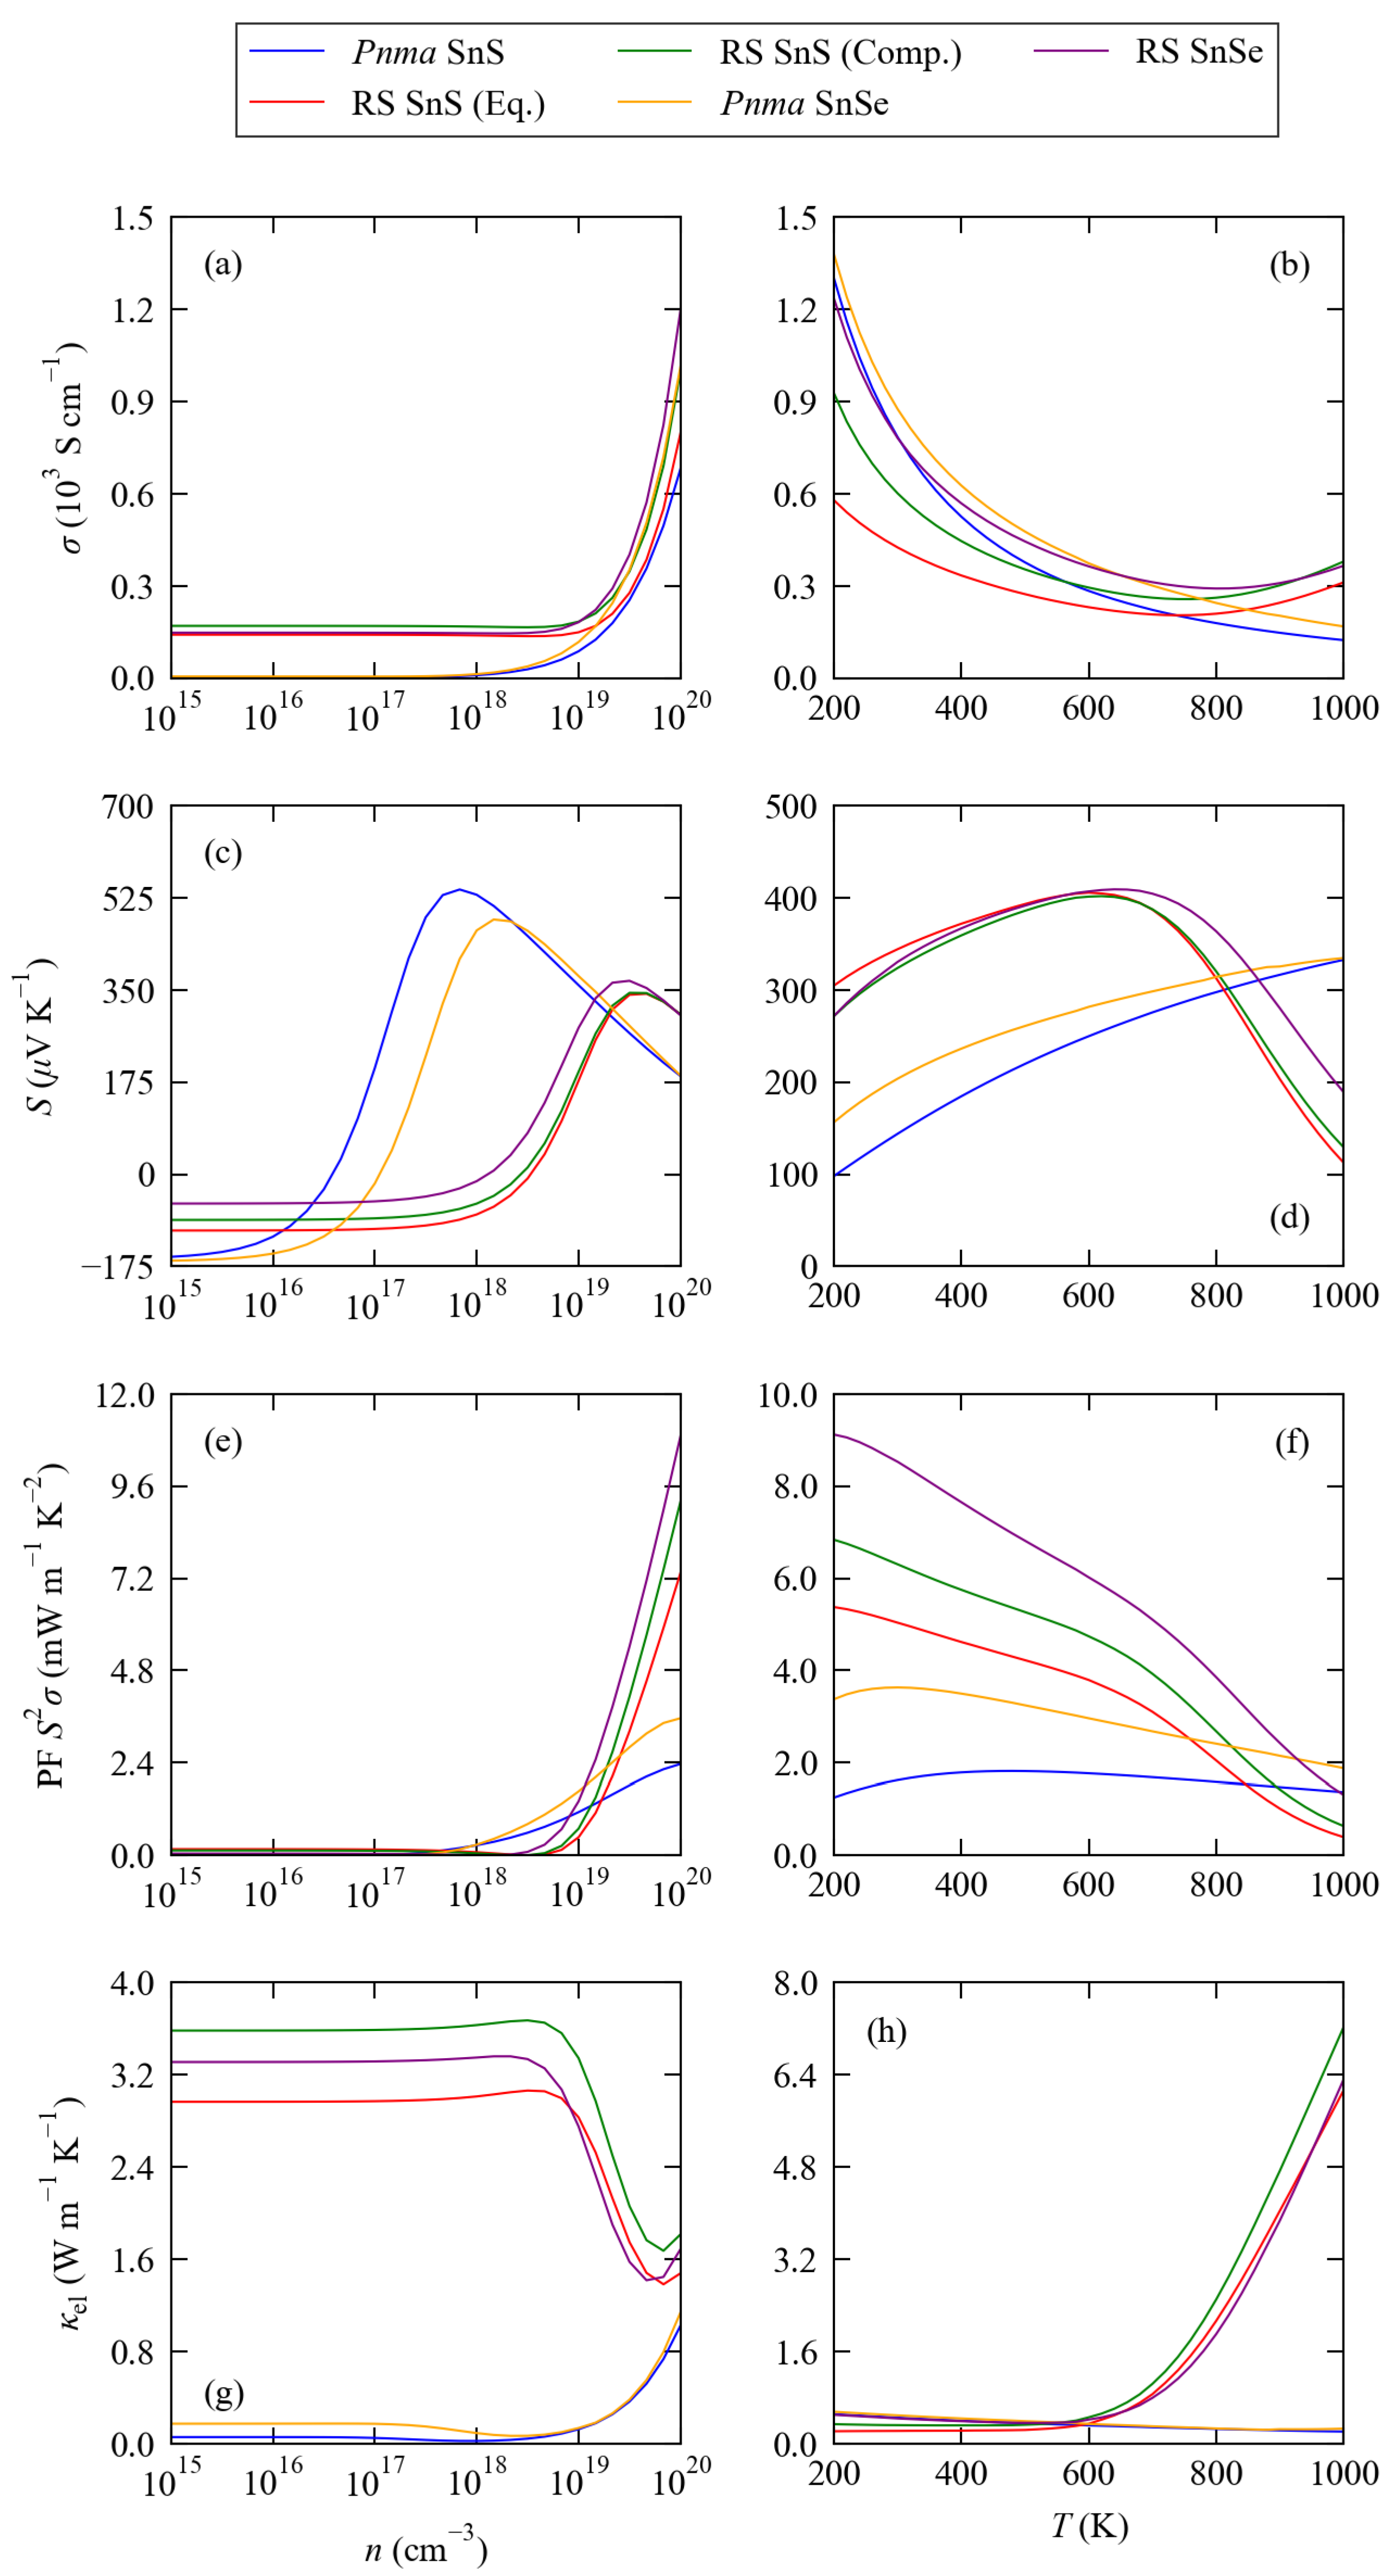
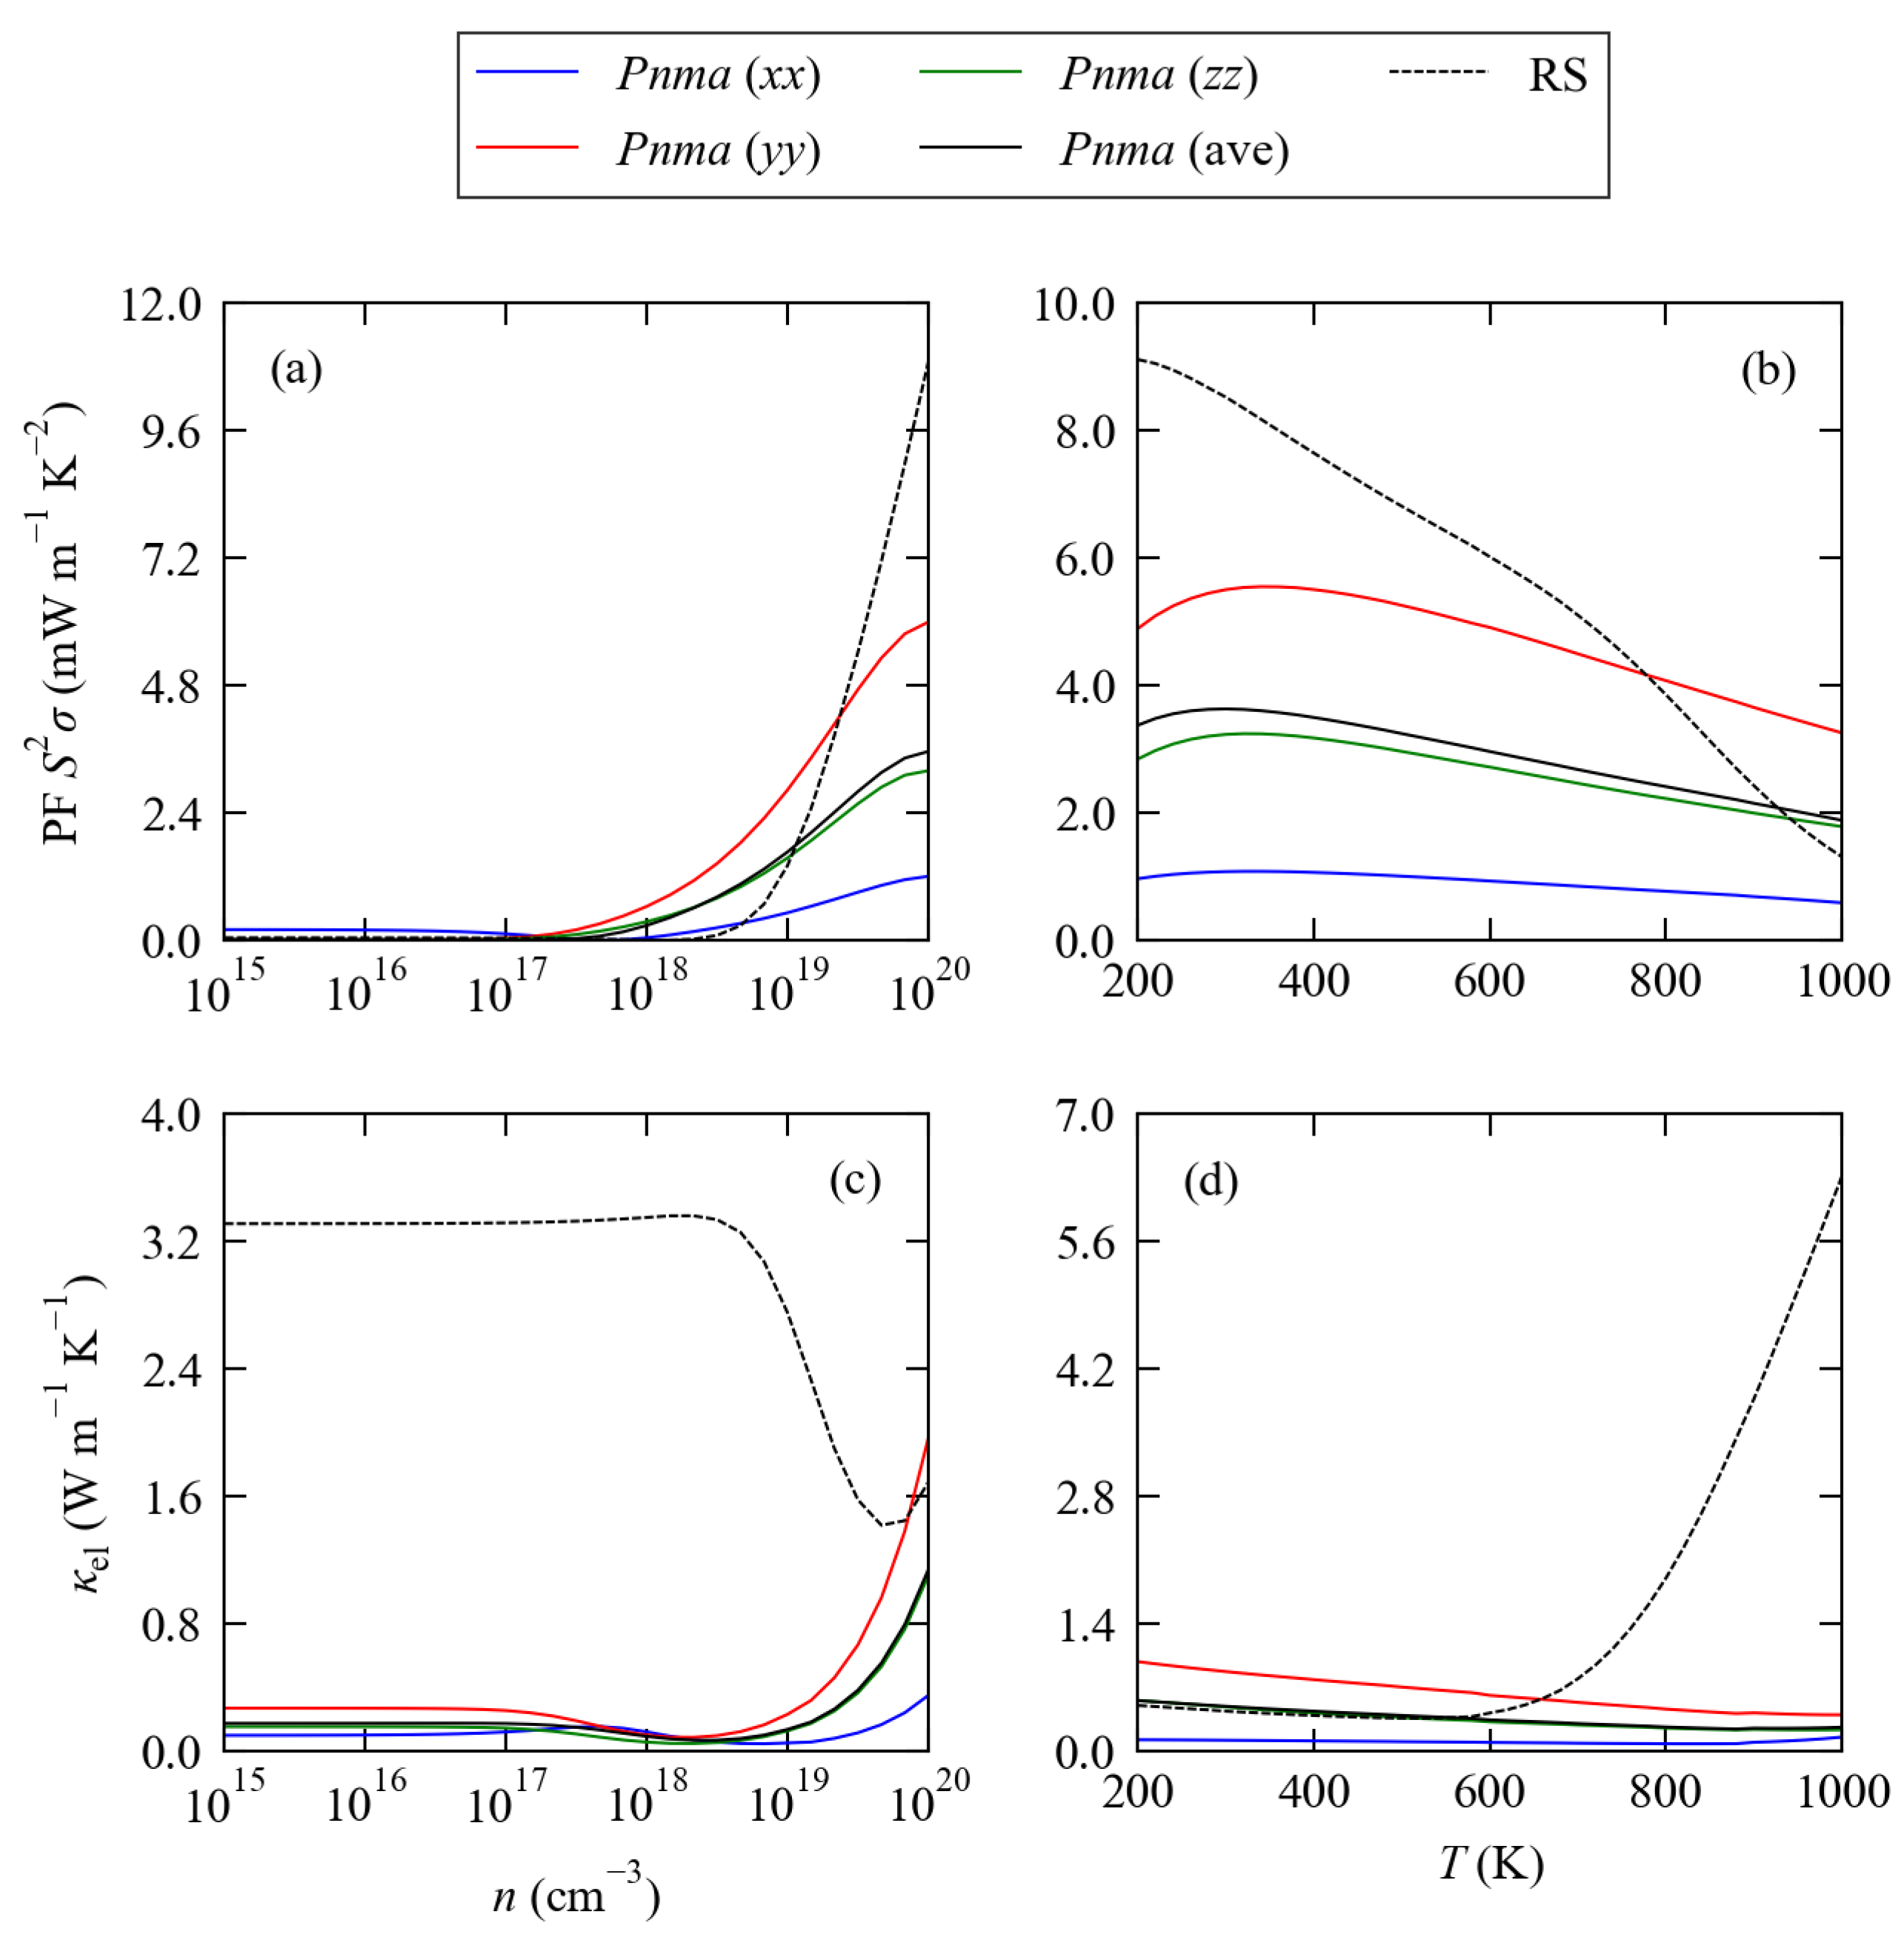
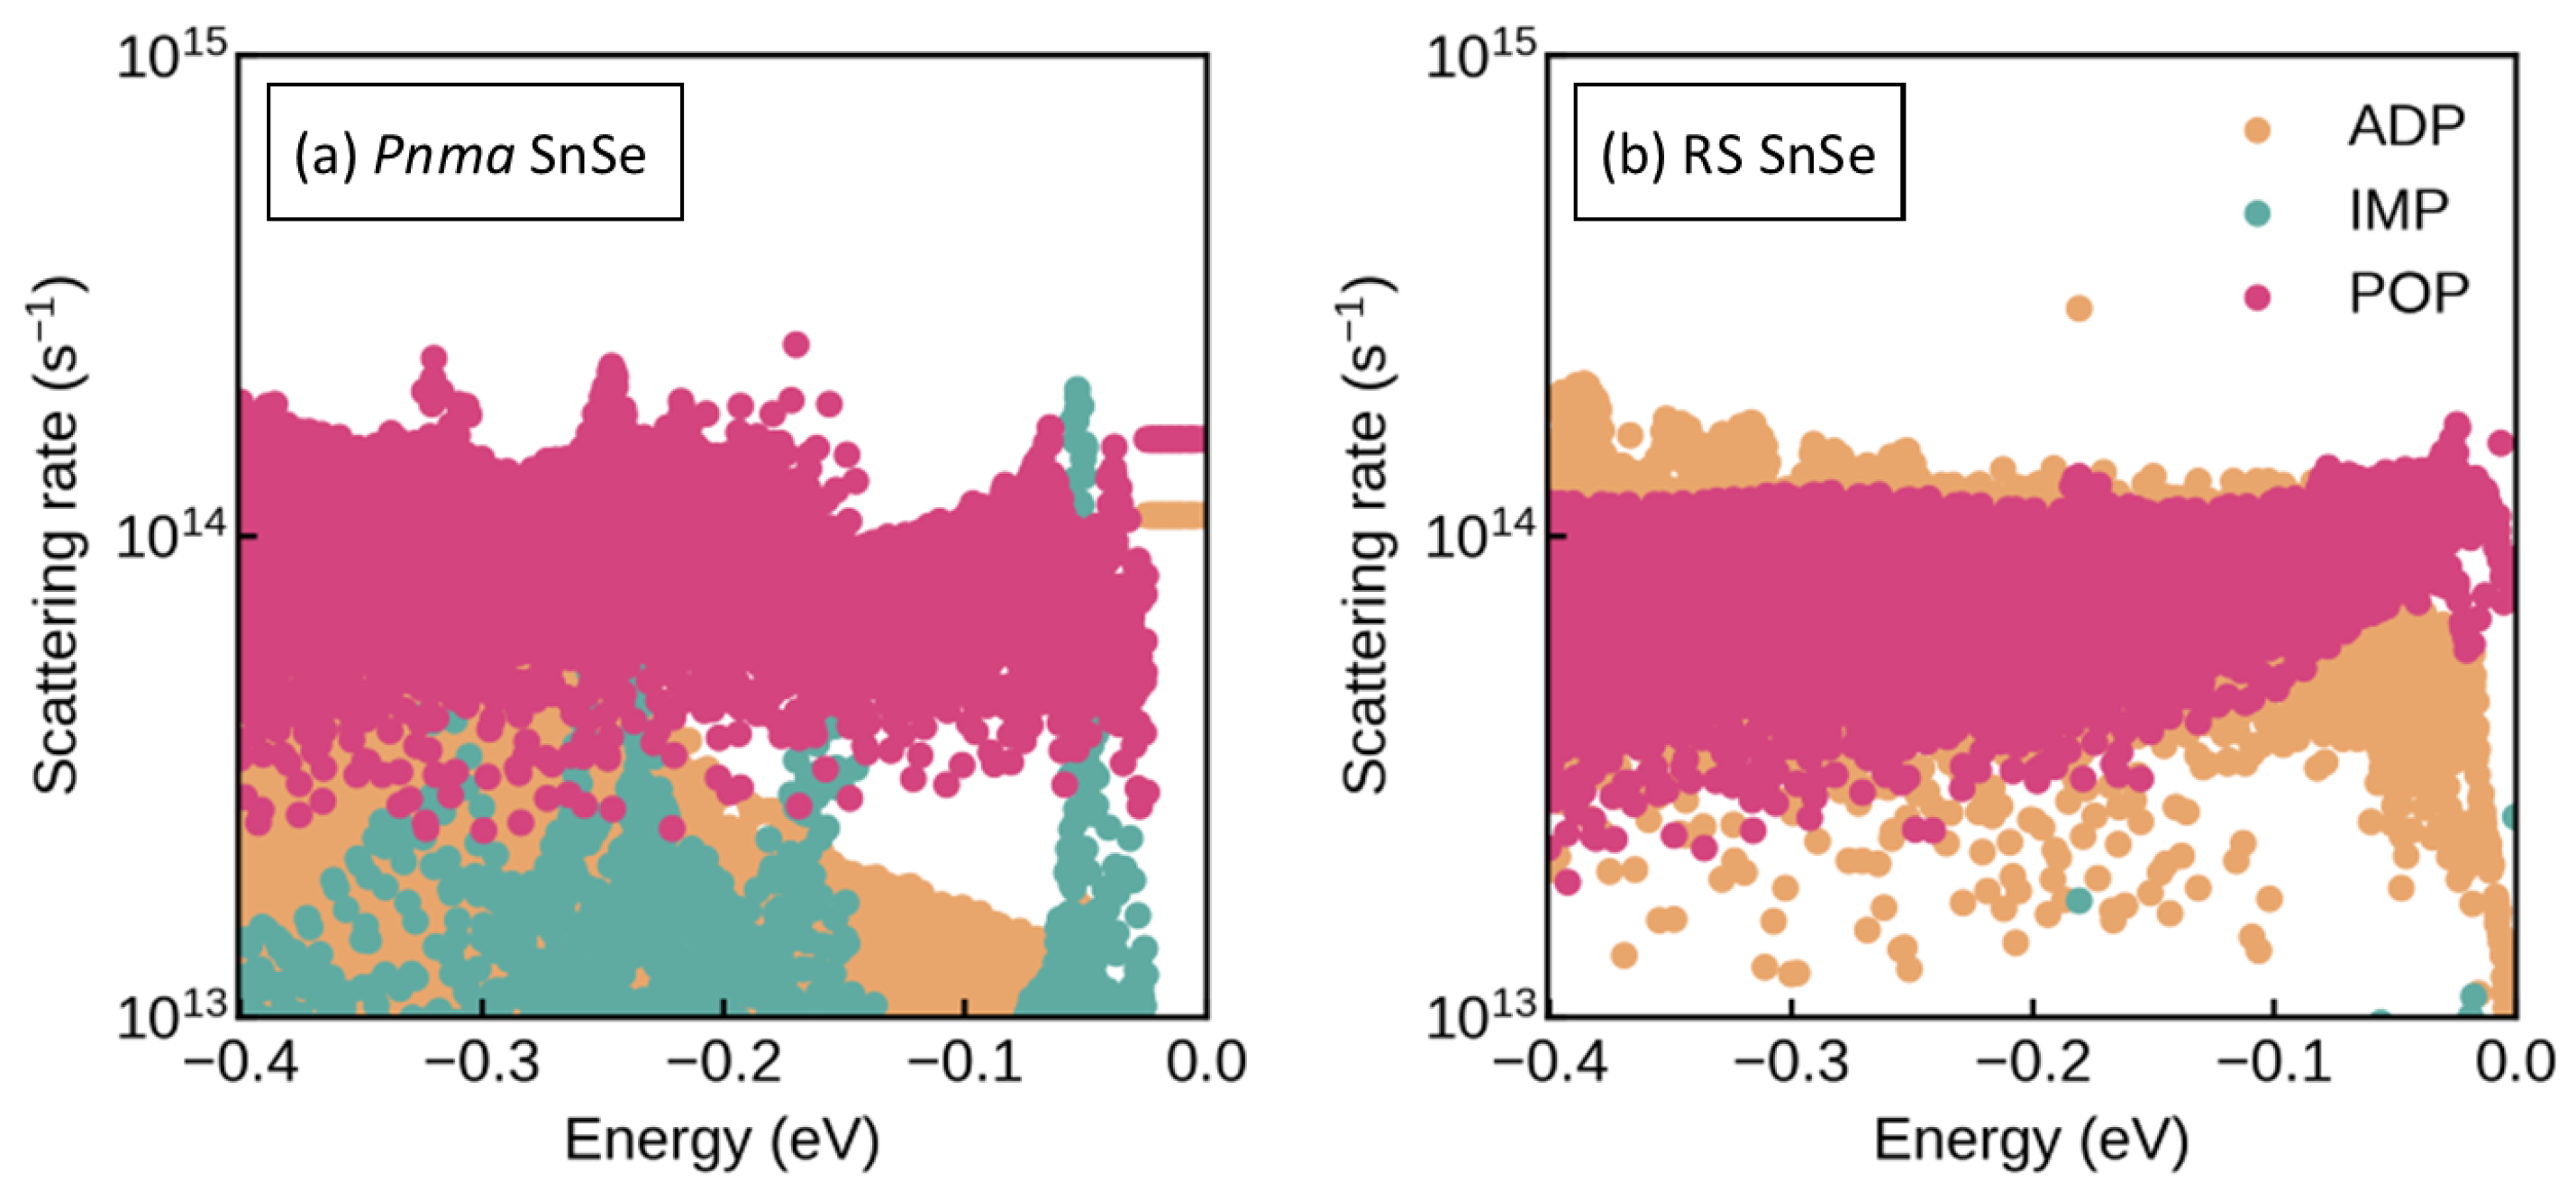
3.2. Electronic Structure and Transport Properties

The general features of the electronic band dispersion and density of states (DoS) curves of the Pnma and rocksalt phases of SnS and SnSe were discussed in our previous work [45], and we provide the calculated HSE 06 band structures of the five structures examined in this work as Supplemental Materials. The two Pnma structures are indirect gap semiconductors with the valence band maximum and conduction band minimum (VBM/CBM) close to the k = Z and Γ wavevectors, respectively. Using the HSE 06 hybrid functional, we obtained bandgaps of 0.93 eV and 0.82 eV for SnS and SnSe, which agree well with experimental measurements of 1.06 ± 0.15 eV and 0.86 eV [19,65]. The smallest direct gaps are considerably larger at 1.41 eV and 1.27 eV, respectively. The three rocksalt phases have a direct bandgap at k = L, as in the rocksalt-structured Pb chalcogenides [66]. We calculated a gap of 0.65 eV for both the equilibrium and compressed RS SnS structures and a gap of 0.6 eV for RS SnSe. All three RS structures were also predicted to have an indirect gap ∼50–130 meV smaller than the direct gaps, which is not seen along the calculated dispersion path, although the differences between the two are much smaller than in the Pnma phases.
Using semi-classical Boltzmann transport theory, the electrical transport properties can be determined from the spectral conductivity Σ and the nth-order moments of the generalised transport coefficients L n , defined as [54,67]:
Σ ( ϵ , T ) = j 1 8 π 3 ν k j ν k j τ k j ( T ) δ ϵ ϵ k j d k
L n ( T ) = e 2 Σ ( ϵ , T ) ϵ ϵ F n f 0 ( ϵ , T ) ϵ d ϵ
ϵ k j , ν k j , and τ k j are the energies, group velocities, and relaxation times of electrons with wavevector k and band index j, e is the elementary charge, and f 0 ( ϵ , T ) is the Fermi–Dirac distribution given by:
f 0 ( ϵ , T ) = 1 exp ϵ ϵ F / k B T + 1
where ϵ F is the Fermi energy and k B is the Boltzmann constant. The three electrical properties in Equation (1) can then be obtained as:
σ = L 0
S = 1 e T L 1 L 0
κ el = 1 e 2 T L 1 2 L 0 L 2
where the explicit temperature dependence of the transport properties and the L n has been omitted for brevity.
The electron relaxation times τ k j in Equation (2) are computed as the sum of four scattering processes, namely acoustic deformation potential (ADP), piezoelectric (PIE), polar optical phonon (POP), and ionised impurity (IMP) scattering:
1 τ k j ( T ) = 1 τ k j ADP ( T ) + 1 τ k j PIE ( T + 1 τ k j POP ( T ) + 1 τ k j IMP ( T )
Full details of how the four scattering rates (inverse lifetimes) in Equation (8) are calculated can be found in [54].
The σ , S , and κ el are 3 × 3 tensors for which the three diagonal elements correspond to transport along the Cartesian x, y, and z directions. To more easily compare the three compounds, we also computed the scalar averages σ , S, and κ el :
σ = 1 3 Tr σ = 1 3 σ x x + σ y y + σ z z
S = 1 3 Tr S = 1 3 S x x + S y y + S z z
κ el = 1 3 Tr κ el = 1 3 κ x x + κ y y + κ z z
We first investigated the calculated power factor S 2 σ (PF), i.e., the numerator in Equation (1), and electronic thermal conductivity κ el of the Pnma and RS phases of SnSe as a function of temperature from 200–1000 K and at hole carrier concentrations n from 10 15 –10 20 cm 3 (see the Supplemental Materials).
For undoped SnSe, typical n are on the order of 2 × 10 17 cm 3 , and concentrations of up to 4 × 10 19 cm 3 can be achieved with hole doping [20,68]. Our initial survey of the calculated properties clearly shows that n on the order of 10 18 cm 3 and above are required to obtain a reasonable power factor, and, therefore, that doping is required to obtain good thermoelectric performance. At larger carrier concentrations, we predict the RS phase to support an up to 4 × larger PF than the Pnma phase, but this would be partially negated by a higher κ el , which appears in the denominator of Equation (1).
At carrier concentrations approaching the largest n = 10 20 cm 3 in our calculations, the Pnma phase shows a significant increase in the electronic thermal conductivity. Furthermore, at low n the κ el increases with temperature while at higher n, the reverse trend is observed. According to the Wiedemann–Franz law, in metals and degenerate semiconductors κ el is proportional to the electrical conductivity σ according to:
κ el = π 2 3 k B e 2 σ T = L σ T
where L is the Lorentz number and the explicit T dependence of κ el and σ has again been omitted. These observations therefore suggest that at around n ≃ 10 19 cm 3  Pnma SnSe becomes degenerated and the conductivity switches from a semiconductor- to metallic-like temperature dependence. This has been observed experimentally in hole-doped SnSe [20]. RS SnSe shows similar behaviour to the Pnma phase up to ∼500 K, whereas at higher temperatures, the κ el peaks at carrier concentrations around 10 18 –10 19 cm 3 and then falls as n is increased further.
A similar analysis for the Pnma and equilibrium/compressed rocksalt phases of SnS yielded similar qualitative conclusions.
To compare the five structures, Figure 3 shows the three electrical properties σ , S, and κ el as a function of carrier concentration at a fixed T = 800 K and as a function of temperature at a fixed n = 2.15 × 10 19 cm 3 .
Comparing the PFs S 2 σ to the electrical conductivities and Seebeck coefficients shows that the dependence on n is primarily governed by the large increase in σ with carrier concentration. The two Pnma phases show a larger maximum Seebeck coefficient than the three RS structures, but the S peaks at a smaller n and falls at larger carrier concentrations, whereas the Seebeck coefficients of the RS phases peak at larger n. Together with their generally larger maximum σ , this results in the RS structures showing larger PFs than the Pnma phases at higher carrier concentrations. Interestingly, our calculations predict the Seebeck coefficients of the two Pnma phases to be negative at low hole carrier concentrations and to become positive for n ≃ 10 16 –10 17 cm 3 .
The κ el of the RS structures is predicted to be large for n up to ∼10 19 cm 3 , but falls sharply at higher carrier concentrations. With reference to the substantial increase in the conductivity of the RS phases with n, and given that we would expect an increasingly degenerate behaviour at higher carrier concentrations, this is in apparent violation of the Wiedemann–Franz law (Equation (12)). To investigate further, we compared the κ el obtained for the five structures using Equations (7) and (12) as a function of temperature and carrier concentration (see the Supplemental Materials). We found that the Wiedemann–Franz model predicted a 20–40% increase in the κ el of the Pnma structures and a reduction of up to 80% in the κ el of the RS phases at higher temperatures and carrier concentrations. We note, however, that the Lorentz number in Equation (12) can vary between systems and with temperature, and calculations for hole-doped SnSe, based on a multi-band model, predict a value ∼20% smaller at 300 K and ∼25% smaller at ∼800 K [69]. This would account for a large part of the increased κ el of the Pnma phases predicted with this method.
In spite of these issues, as we discuss in Section 3.4 below, we found that the two different models for κ el ultimately had a relatively small impact on the predicted maximum thermoelectric figures of merit calculated using Equation (1).
With a fixed n = 2.15 × 10 19 cm 3 , the conductivities of the Pnma phases show a metallic-like reduction with temperature as noted previously. The σ of the RS phases show a similar fall at low-to-moderate T, but increase again at high temperatures. The result is that whereas the two RS SnS models are predicted to have significantly lower σ than Pnma SnS at 200 K, they have ∼2 × higher conductivities at 1000 K. At this carrier concentration, the Seebeck coefficients of the Pnma phases increase with temperature and converge toward very similar values at T = 1000 K. The S of the three RS phases, on the other hand, all peak around 600 K and fall sharply above this temperature, such that they are significantly smaller than those of the Pnma phases at 1000 K. This sharp reduction in the Seebeck coefficient at higher temperature results in the RS phases showing smaller S than the corresponding Pnma phases at 1000 K and is clearly reflected in a reduction in the power factors. Finally, a comparison of the κ el as a function of temperature again highlights the much larger electrical thermal conductivities of the RS structures compared to the Pnma phases. Taken together, these results indicate that RS SnSe would require a larger carrier concentration (heavier doping) for its high-temperature thermoelectric performance to be competitive with the Pnma phase. Whereas the electrical properties suggest RS SnSe may show better performance at lower temperatures, this depends on any differences in the lattice thermal conductivity κ latt , which we address in Section 3.3 below. Similar qualitative conclusions can be made for SnS.
Whereas the cubic symmetry of the rocksalt structure means that the three diagonal components of the conductivity, Seebeck, and electrical thermal conductivity tensors are equivalent and equal to the average, the anisotropic bonding in the orthorhombic Pnma structure results in a significant directional dependence of all three quantities. Figure 4 shows the x x , y y , and z z components of the power factors and κ el of Pnma SnSe as a function of n and T, as in Figure 3, together with the isotropic averages for the Pnma and RS phases (cf. Equations (9)–(11)). In the Pnma structure, the x x , y y , and z z components of the tensors correspond to transport along the crystallographic a, b, and c directions, respectively (cf. Figure 1). Similar analyses comparing the directional anisotropy in the σ , S , PF, and κ el of the Pnma phases of both SnS and SnSe to the average values of the Pnma and RS phases shown in Figure 3 are provided as Supplemental Materials. We found that the Pnma structures have distinct “easy” and “hard” axes for transport, corresponding respectively to the b axes along which the bonding is strongest and the layered a axes. This leads to a large anisotropy in the electrical conductivity both as a function of carrier concentration and temperature. On the other hand, the Seebeck coefficients are strongly anisotropic at small n, but converge at carrier concentrations above ∼10 18 cm 3 . The anisotropy in the σ with temperature and the similar S at larger n are both consistent with experimental measurements [20]. The directional dependencies are reflected in the power factors, although since appreciable PFs are only obtained at larger carrier concentrations, the PFs largely follow the anisotropy in the conductivity. However, the electronic thermal conductivity also reflects the anisotropy in σ , as would be expected from Equation (12), and this may serve to limit the directional variation in the thermoelectric figures of merit.
Finally, it is of interest to examine the relative impact of the acoustic deformation potential, piezoelectric, polar optic phonon, and ionised impurity scattering mechanisms on the electron relaxation times τ k j (cf. Equation (8)). Figure 5 shows the calculated scattering rates (i.e., the inverse lifetimes τ k j 1 ) as a function of the electronic state energy up to 0.4 eV below the Fermi energy ϵ = ϵ F for n = 2.15 × 10 19 cm 3 and T = 800 K. For the Pnma phase, our calculations predict that POP scattering is dominant, with contributions from ADP and IMP scattering in states close to the Fermi energy. For RS SnSe, on the other hand, POP scattering dominates close to ϵ F , whereas at lower energies, the POP and ADP scattering have similar rates, and IMP scattering does not seem to play a significant role. Piezoelectric scattering is not relevant to either of the Pnma or RS structures because they are both centrosymmetric and the piezoelectric moduli therefore vanish. A similar analysis of the calculated scattering rates of the three SnS structures (see the Supplemental Materials) leads to similar qualitative conclusions.
We noted during our calculations that the high-frequency and static dielectric constants of the three rocksalt phases computed with PBEsol + D3 were considerably larger than those of the Pnma phases, which we tentatively attributed to the near-metallic electronic structures obtained for the equilibrium RS SnS and SnSe structures with this method [45]. Since the ε and ε s are used to calculate the POP and IMP scattering rates, we also computed transport properties with the dielectric properties of these structures calculated using HSE 06 (see the Supplemental Materials). In general, we found that the HSE 06 dielectric constants led to an increase in the conductivities and electronic thermal conductivities while leaving the Seebeck coefficients largely unchanged. While at some carrier concentrations and temperatures, the calculated σ was increased by a factor of two, κ el was increased by a similar factor, so we would not expect a significant overall effect on the calculated figures of merit (cf. Equation (1)). We also note that using the different dielectric constants did not affect the reduction in κ el at large n predicted using Equation (7).
The transport properties predicted from these calculations are generally a reasonable match to the experiments. As one of the current flagship chalcogenide thermoelectrics, the transport properties of Pnma SnSe have been studied extensively. The doped samples in [20] achieved carrier concentrations around 4 × 10 19 cm 3 . This study reported Seebeck coefficients of 160 μ V K 1 and 300 μ V K 1 at 300 K and 773 K, with little variation along the three crystallographic axes, and we obtained similar values of ∼150 μ V K 1 and 250 μ V K 1 at 300 K and 780 K with n = 4.64 × 10 19 cm 3 . The measured conductivities of 1486 S cm 1 and 148 S cm 1 along the bonding direction at the two temperatures are on the same order of magnitude as the 2178/3006 S cm 1 and 641/918 S cm 1 calculated for n = 3.16 × 10 19 /4.64 × 10 19 cm 3 . With the higher carrier concentration, we calculated PFs of 56.8 μ W cm 1 K 2 and 53.9 μ W cm 1 K 2 at 300 K and 780 K. The former compares reasonably well to the measured value of 40 μ W cm 1 K 2 at 300 K, whereas the latter is nearly 4 × larger than the measured 14 μ W cm 1 K 2 at 773 K. The measurement in [68] on polycrystalline samples with n ≃ 10 19 cm 3 yielded conductivities in the range of 140–180 S cm 1 and 120–130 S cm 1 at 423 K and 783 K, a Seebeck coefficient of 342 μ V K 1 at 673 K, and PFs on the order of 10 μ W cm 1 K 2 from 473–783 K. At the same carrier concentration, we obtained comparable averaged σ of 287 S cm 1 and 122 S cm 1 at 420 K and 780 K, a similar S of 360 μ V K 1 at 680 K, and power factors between 17.2 μ W cm 1 K 2 and 24.7 μ W cm 1 K 2 . SnS has been comparatively less well studied, but the experiments on polycrystalline samples in [31] with n ≃ 2 × 10 18 cm 3 suggest a maximum Seebeck coefficient of 500 μ V K 1 at 600 K, at which temperature the conductivity is ∼3 S cm 1 and the power factor is 0.75 μ W cm 1 K 2 . With n = 2.15 × 10 18 cm 3 , we predicted an averaged S and σ of 433 μ V K 1 and 33 S cm 1 , giving a PF of 6.2 μ W cm 1 K 2 .
We therefore conclude that the protocol in [54] gives reasonable predictions of the Seebeck coefficients in these systems, but tends to overestimate the electrical conductivity. The fact that the S are well reproduced suggests the calculated electronic structures are reasonable, so we might attribute the overestimation of the σ either to approximations in the models used to calculate the electronic relaxation times in Equation (2) or to errors in calculating the requisite material properties. However, it is also worth noting that our calculations are based on perfect bulk crystals, whereas real materials are likely to contain defects such as grain boundaries that could limit the electrical transport. Our model also does not consider the effect of temperature on the structure through, e.g., thermal expansion at finite temperature. This could in principle be addressed by using the quasi-harmonic approximation to model the thermal expansion, as in our previous study [45], or, more simply, by fixing the cell volumes to experimentally measured values at appropriate temperatures. Using either method would, however, require calculations on multiple structures, which would significantly increase the computational workload. In any case, we would hope that any fundamental issues in the transport calculations would have a similar effect on all five systems and, therefore, that the results would remain comparable, which was the main focus of this study.

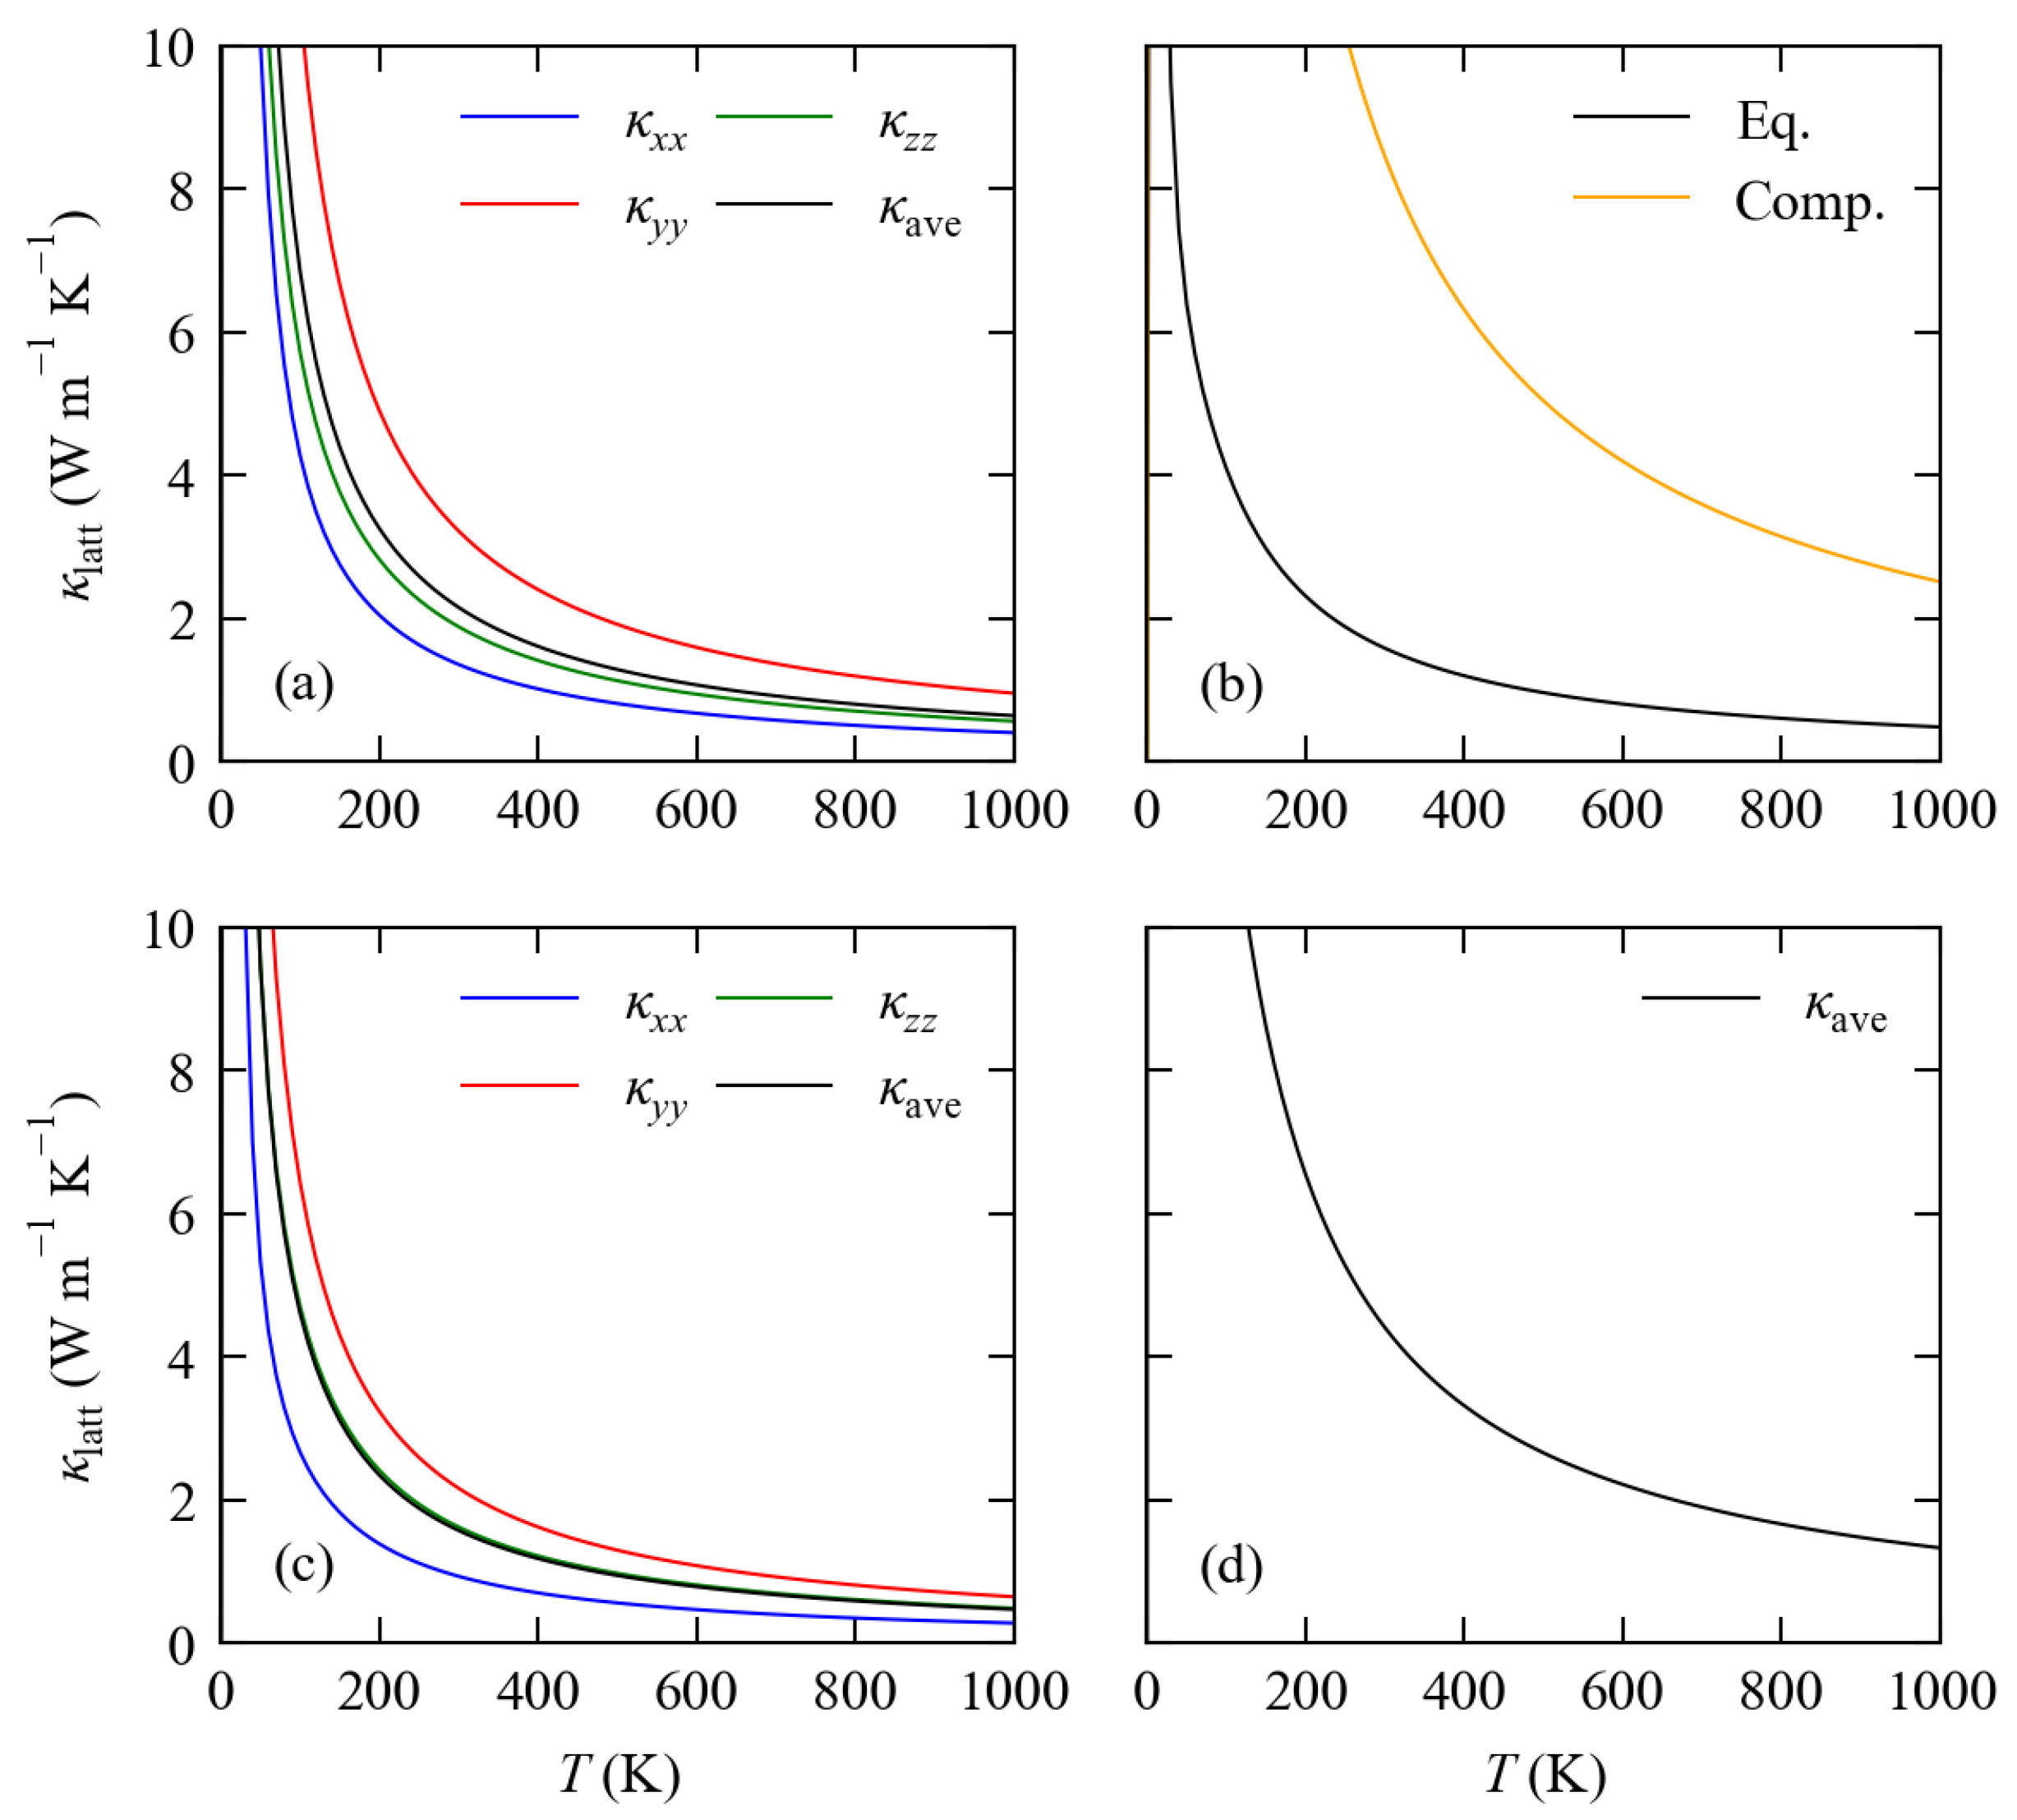
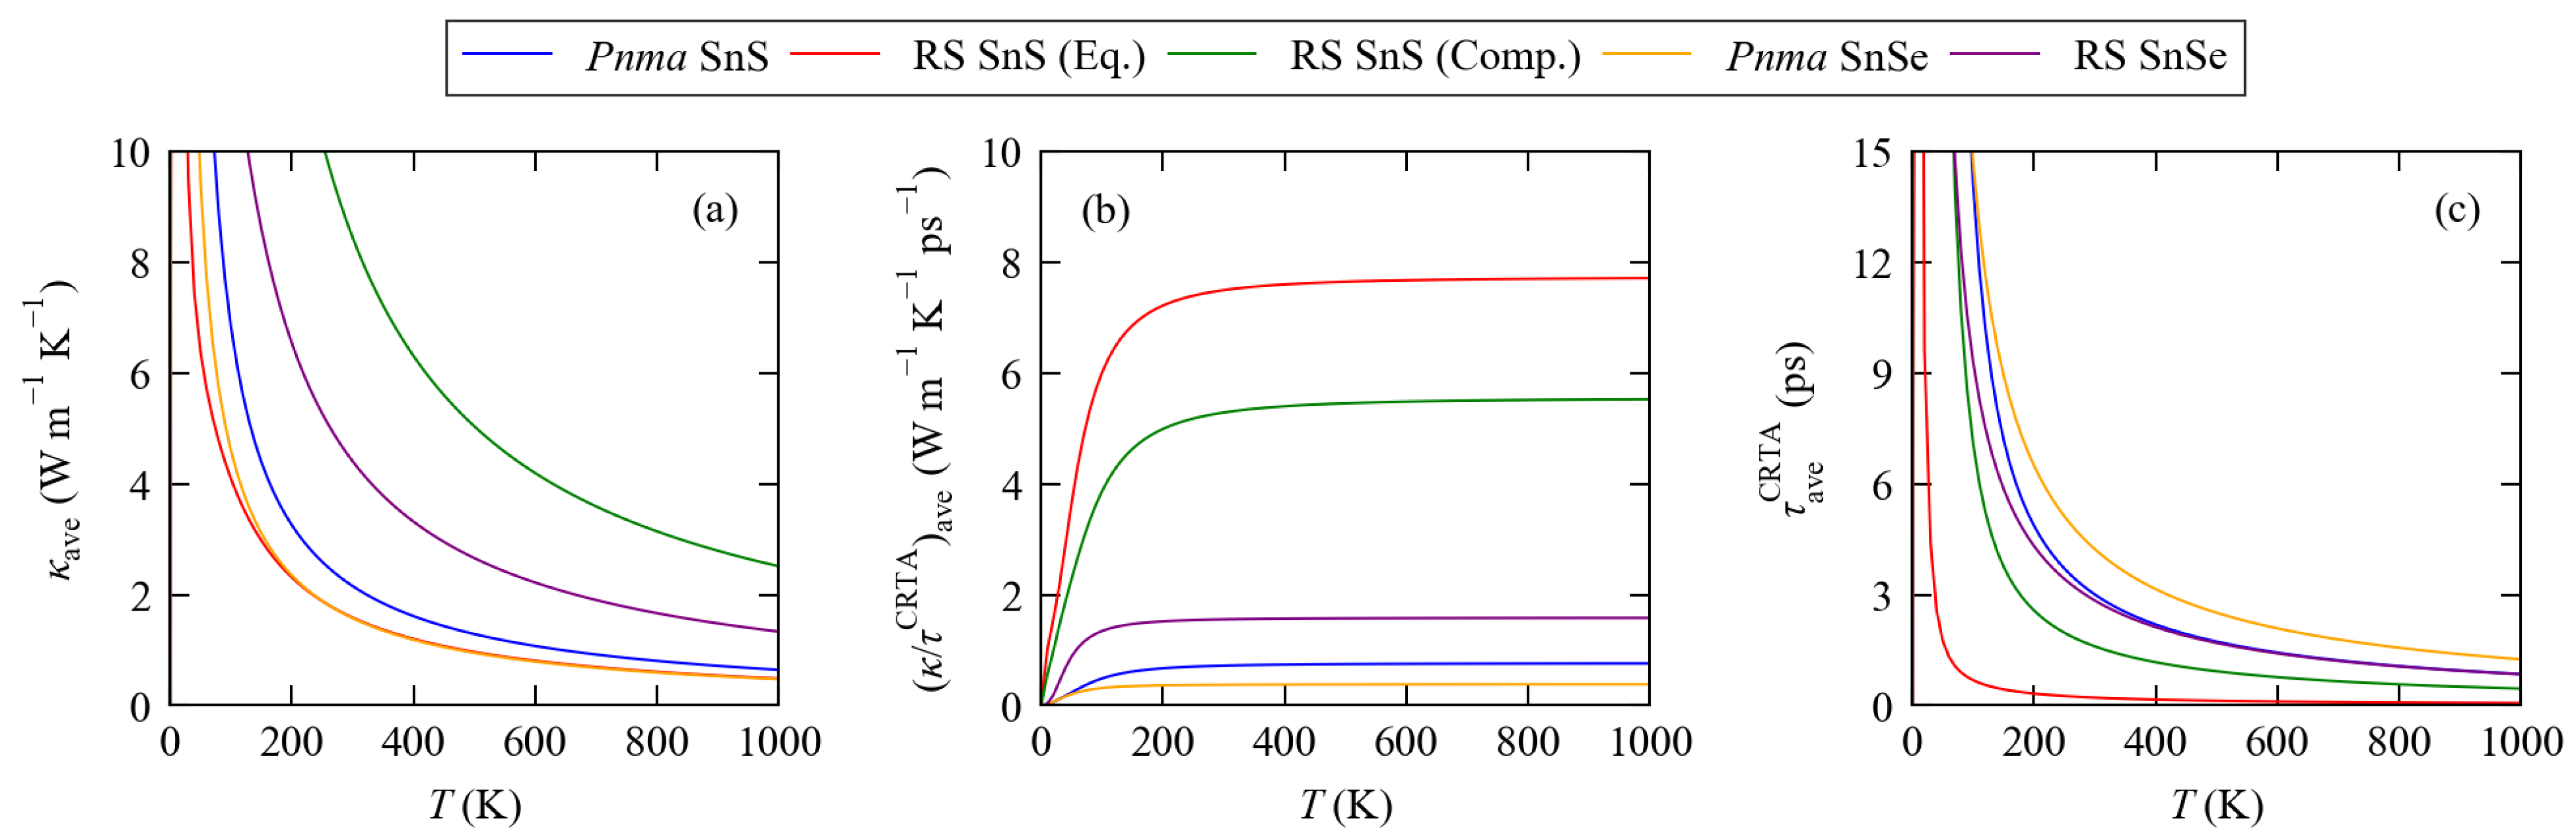
3.3. Lattice Thermal Conductivity

To compute the κ latt in Equation (1), we used the single-mode relaxation time approximation (RTA) model [60]. The macroscopic thermal conductivity κ latt was computed as the sum of contributions from individual phonon modes with wavevector q and band index j as:
κ latt = 1 N q j κ q j ( T ) = 1 N V q j C q j ( T ) ν q j ν q j τ q j ( T )
V is the unit cell volume, and N is the number of wavevectors included in the summation, which is equivalent to the number of unit cells in the crystal. C q j are the modal heat capacities calculated according to:
C q j ( T ) = q j ω q j k B T 2 exp ω q j / k B T [ exp ω q j / k B T 1 ] 2
ν q j are the mode group velocities, which are the derivatives of the frequencies ω q j with respect to the wavevector:
ν q j = ω q j q
τ q j are the phonon lifetimes, calculated as the inverse of the phonon linewidths Γ q j :
τ q j ( T ) = 1 2 Γ q j ( T )
The calculation of the linewidths requires the harmonic phonon frequencies ω q j and eigenvectors W q j together with the third-order force constants, and the method is documented in detail in [60].
We previously demonstrated that the RTA model predicts lattice thermal conductivities for Pnma SnS and SnSe in reasonable agreement with experiments [61], albeit with a tendency to overestimate as observed with the calculated electrical conductivities in Section 3.2. Figure 6 compares the temperature dependence of the κ latt of the five models examined in this study, and values at T = 800 K are listed in Table 2. As for the electrical transport properties, we considered the principal x x , y y , and z z components of the κ latt tensors of the two Pnma phases, corresponding to heat transport along the a, b, and c axes, respectively (cf. Figure 1), together with the scalar average calculated as:
κ latt = 1 3 Tr κ latt = 1 3 κ x x + κ y y + κ z z
where the explicit temperature dependence has been omitted for brevity. For the rocksalt phases, we only considered the average, as in these systems, the three diagonal components are equivalent by symmetry and equal to the average.
The thermal conductivity shows a steep temperature dependence, which is particularly apparent for the rocksalt phases. As with the electrical transport properties, the Pnma phases show the largest κ latt along the strongly bonded b axes with much lower thermal conductivities along the layered a directions. In Pnma SnS and SnSe, the ratios of κ y y and κ x x are 2.35 and 2.3, respectively. Our calculations predict the thermal conductivity of rocksalt SnSe to be ∼2–5 × larger than along any of the axes in the corresponding Pnma structure. On the other hand, the κ latt of the equilibrium structure of RS SnS is predicted to be ∼25% smaller than the average for Pnma SnS. The thermal conductivity in the rocksalt-structured Pb chalcogenides is strongly volume dependent [66], as the bond distances are straightforwardly related to the lattice constant and cell volume such that compression and expansion of the lattice strengthens and weakens the chemical bonding, respectively. The same phenomenon is evident here in the ∼5 × larger predicted κ latt of the compressed rocksalt SnS structure compared to the equilibrium structure. Noting that the equilibrium RS SnS structure is dynamically unstable, the higher predicted κ latt of the compressed RS SnS and RS SnSe structures compared to the corresponding Pnma phases would serve to further negate the higher power factors predicted by the transport calculations in Section 3.2.
We note in passing that our results for RS SnSe are inconsistent with the modelling study in [46], which modelled the thermal conductivity using a similar approach to the present study but predicted κ latt to be smaller than the average for the Pnma phase. The study noted that a small displacement of the Se atoms along the <111> direction (i.e., a rhombohedral distortion) was applied to remove imaginary modes in the phonon dispersion, and given that the imaginary mode in equilibrium RS SnS appears to result in a very low lattice thermal conductivity this may explain the discrepancy. Based on a previous comparison of how different DFT functionals predict the quasi-harmonic lattice dynamics of the Pb chalcogenides, it is possible that the imaginary modes are an artefact of the tendency of the PBE functional to overestimate the unit cell volume [70], but the lattice constant of 6.06 A is similar to our predicted value of 5.99 Å. It is possible that RS SnSe possesses an incipient structural distortion that manifests under thermal expansion at elevated temperature—such a phenomenon has been proposed to occur in PbTe, but is heavily disputed [71,72,73,74]. However, we also note that the calculations in [46] used a smaller plane wave cutoff and a smaller supercell for calculating the second-order force constants of RS SnSe, which could also lead to differences in the calculated phonon dispersion and thermal conductivity.
Conceptually, it is useful to discuss the differences in the thermal transport between the five systems in terms of differences in the group velocities ν q j and the lifetimes τ q j . This distinction can be made using the constant relaxation time approximation (CRTA) model developed in [61,75]. In this model, κ latt are written as the product of a harmonic term and a weighted average lifetime τ CRTA :
κ latt = τ CRTA × 1 N q j κ q j τ q j = τ CRTA × 1 N V q j C q j ν q j ν q j
We note that both the harmonic and lifetime terms are implicitly temperature dependent, the latter through the temperature dependence of the C q j . Comparing τ CRTA and the harmonic term in the summand then allows the difference in κ latt to be attributed quantitatively to differences in the harmonic term (mainly the group velocities) and the phonon lifetimes.
Figure 7 compares the averaged κ latt as a function of temperature for the five models to the corresponding averaged harmonic function κ / τ CRTA and lifetime τ CRTA , and values of the harmonic and lifetime terms at T = 800 K are also included in Table 2 for comparison.
In general, the harmonic κ / τ CRTA function saturates rapidly with temperature as C q j tend to the Dulong–Petit limit, and the sharp decrease in τ CRTA with temperature primarily determines the temperature dependence of κ latt . As discussed in our previous study [61], we found that the lower predicted κ latt of Pnma SnSe results from a balance of a smaller harmonic term and a longer lifetime. This CRTA analysis also provides insight into the anomalously small κ latt computed for the equilibrium RS SnS structure—for this structure, κ / τ CRTA is predicted to be larger than for the compressed phase, while τ CRTA is predicted to be significantly smaller than for all the other systems including both Pnma phases. Since κ / τ CRTA primarily reflects the differences in group velocities, which are given by the slope of the phonon dispersion, we attributed the former anomaly to the distortion of the band structure due to the presence of the imaginary mode (cf. Figure 2). The dynamical instability may also have the effect of increasing the third-order force constants, which could explain the extremely short τ CRTA . On the other hand, both the compressed RS SnS and RS SnSe structures show larger κ / τ CRTA and shorter τ CRTA than the corresponding Pnma phases, highlighting a significant difference in the lattice dynamics of the two structure types.

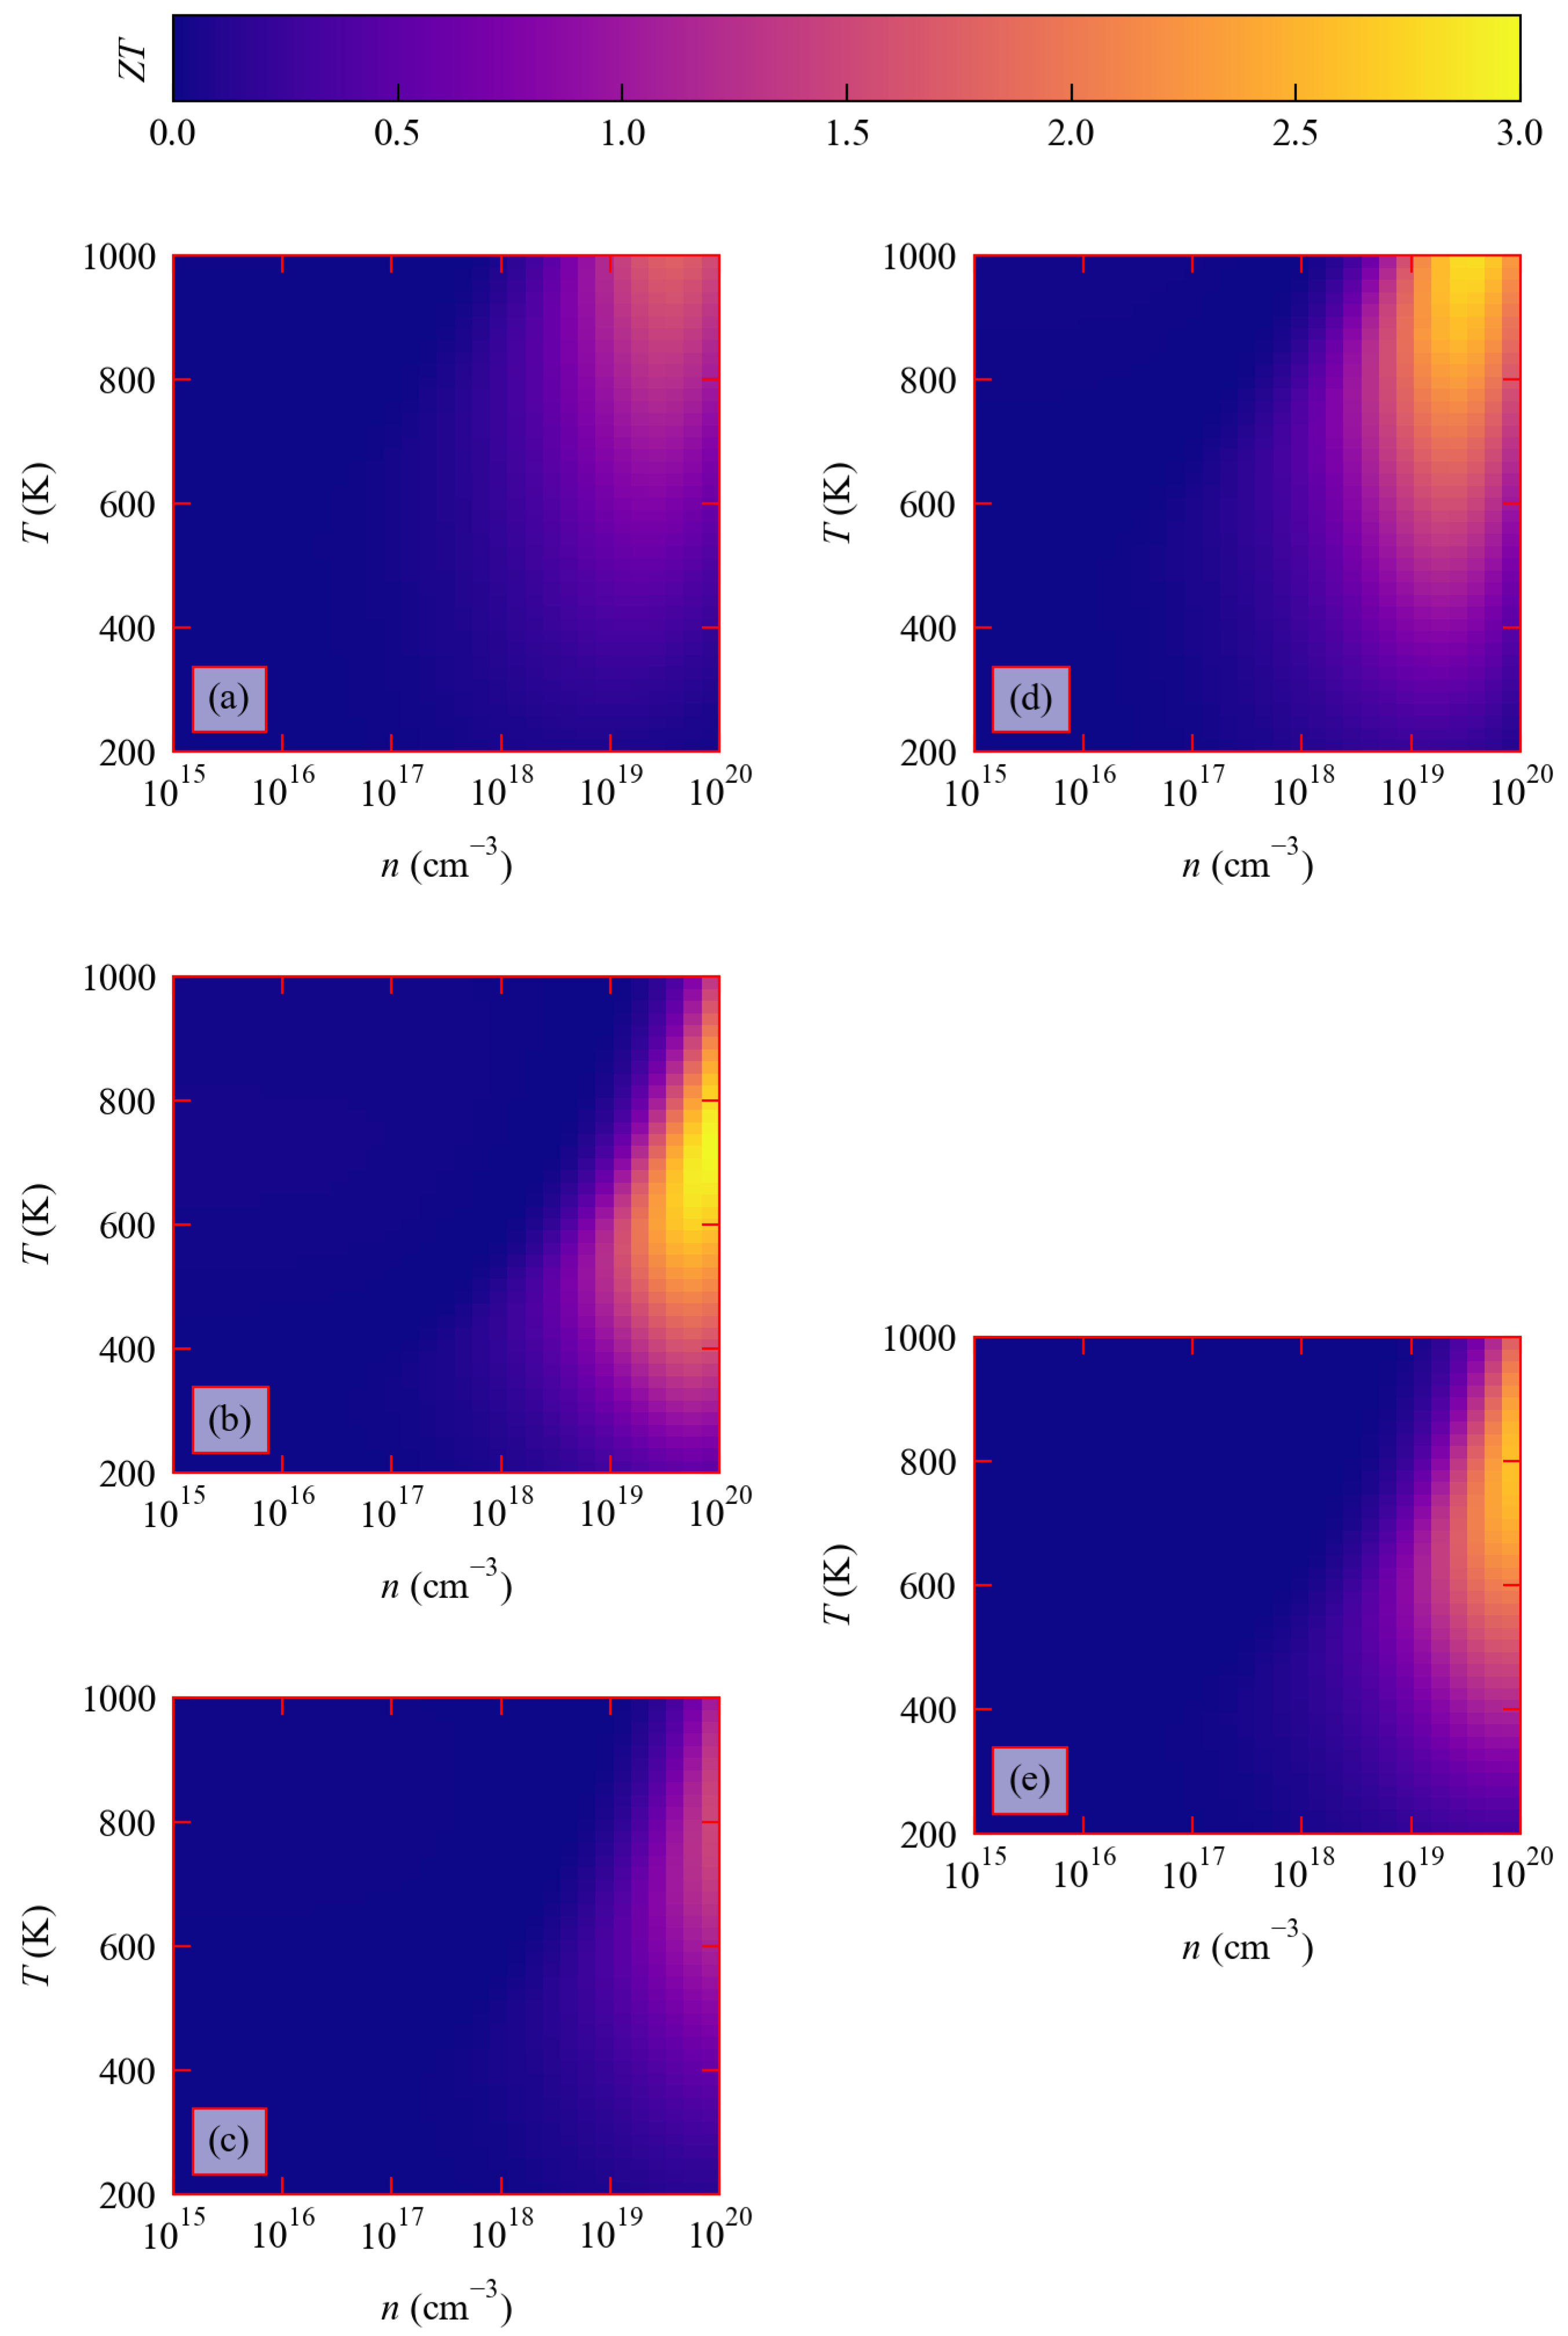
3.4. Thermoelectric Figure of Merit

We now combine the calculated electrical properties from Section 3.2 with the lattice thermal conductivities from Section 3.3 to calculate the thermoelectric figure of merit Z T as a function of carrier concentration and temperature using Equation (1) (Figure 8).
As observed in Section 3.2, these plots clearly show that achieving high figures of merit for all five systems requires high carrier concentrations to optimise the electrical transport. The analysis also shows that Z T is generally maximised at higher temperatures, which can be attributed mainly to the sharp reduction in κ latt with temperature highlighted in Section 3.3. For the Pnma phases, the optimum Z T appears to be obtained for carrier concentrations in the region of 10 19 cm 3 and close to the maximum T = 1000 K examined in our calculations. This optimum n balances the Seebeck coefficient, conductivity, and electrical thermal conductivity, while the optimum T is because at these carrier concentrations, higher temperatures maximise S, compensating the reduced σ , while also minimising κ latt . For the RS phases, the optimum Z T scores were predicted to occur at the maximum carrier concentration of 10 20 cm 3 we investigated, but at lower temperatures. In these systems, unlike the Pnma phases, the Seebeck coefficient remains high at larger n, but κ el increases significantly at higher temperatures. Since the RS phases generally have higher lattice thermal conductivities than the Pnma phases, the optimum temperature is determined mainly as a balance between the two contributions to the thermal conductivity.
We note in passing that combining the predicted electrical transport properties with the calculated lattice thermal conductivity implicitly assumes that κ latt is independent of n, i.e., that the required doping levels do not introduce impurities at a level that would materially disrupt the heat transport through phonons.
From each of the plots in Figure 8, we extracted a maximum Z T , which we summarise together with the corresponding carrier concentration/temperature and the properties from Equation (1) in Table 3.
For the two Pnma phases, we predict maximum averaged Z T values of 1.75 and 2.81, respectively. The latter compares favourably to the Z T of 3.1 for polycrystalline SnSe reported in [68], whereas our prediction for SnS is considerably higher than the value of 1.1 reported for polycrystalline SnS [31,33]. For both systems we predict the optimum Z T is obtained for n = 4.64 × 10 19 cm 3 and T = 1000 K. The carrier concentrations are comparable to those achieved in the studies on SnSe in [20,68], but are larger than the 2 × 10 18 cm 3 and 2 × 10 19 cm 3 obtained for SnS in [31,32]. Studies on both materials also showed the best Z T at elevated temperature, which is again consistent with our predictions. As for the constituent properties, there is significant anisotropy in the figure of merit, with the Z T along the layering a and strongly-bonded b axes calculated to be 1.96 and 1.24 for SnS and 3.15 and 1.85 for SnSe. This is consistent with the single-crystal measurements in [19,20], although the maximum reported Z T scores of ∼2 and 2.6 along the b axis are smaller than the maximum predicted in our calculations. We note however that 1000 K is above the phase transition temperatures of both Pnma SnS and SnSe, which may lead to a discrepancy between our predictions and measurements. It is also of note that the optimal figure of merit in polycrystalline SnSe reported in [68] was obtained by purification to remove tin oxides, and this or similar issues could explain why the experimental studies on SnS have so far reported considerably lower Z T scores than our predicted maximum [31,32,33].
For the equilibrium and compressed rocksalt SnS structures, our calculations predict maximum Z T scores of 2.99 and 1.48, respectively. These are both obtained for our maximum calculated carrier concentration of 10 20 cm 3 , but at lower temperatures of 720 K and 800 K compared to Pnma SnS. Both RS structures are predicted to have 3–4 × higher electrical conductivities than the Pnma phase and comparable Seebeck coefficients, resulting in much larger power factors. This, plus the low predicted κ latt , leads to the large predicted Z T of the equilibrium RS SnS structure. On the other hand, the high κ latt of compressed RS SnS, when combined with its high κ el , results in a total thermal conductivity ∼4 × higher than the Pnma phase and a smaller Z T . For RS SnSe, we predict a maximum Z T of 2.6 with n = 10 20 cm 3 at T = 800 K. In this case, σ is around 3 × higher than Pnma SnSe and the Seebeck coefficient is again comparable, but the higher κ el and κ latt results in an overall lower figure of merit. Since 10 20 cm 3 is the largest of the n considered in the transport calculations in Section 3.2, it is possible that the Z T of the RS phases could be enhanced further with higher doping levels. However, since experiments on the Pnma phases have so far only reported carrier concentrations on the order of 10 19 cm 3 , such high doping levels may not be achievable in practice.
Given the deviation in the predicted κ el from the Wiedemann–Franz law, we performed a similar analysis to determine the maximum Z T with the electronic thermal conductivity computed using Equation (12) (see the Supplemental Materials). As expected, given that this predicted a larger κ el for the Pnma phases, the average Z T scores of Pnma SnS and SnSe decrease to 1.5 and 2.13, respectively. However, despite the marked reduction in the κ el of the RS phases at some carrier concentrations, the maximum figures of merit are largely unchanged. The Z T of the equilibrium and compressed RS SnS structures decrease and increase to 2.81 and 1.56, respectively, while the maximum predicted Z T of RS SnSe decreases to 2.33. Given this, plus the fact that the Z T of Pnma SnSe obtained using the κ el from Equation (7) is in better agreement with experiments, we consider the results in Table 3 to be robust to this anomaly.

4. Discussion

In this study, we have compared the thermoelectric performance of the well-characterised Pnma phases of SnS and SnSe to the less well studied rocksalt structures.
By combining the protocol for modelling electronic transport properties in [54], including approximate models for the electron scattering rates, with the relaxation time approximation for the lattice thermal conductivity in [60], we were able to make a fully ab initio prediction of the thermoelectric figures of merit Z T . Comparison with the large body of experimental studies on SnS and SnSe suggested that these calculations gave very good estimates of the Seebeck coefficient, but tended to overestimate the electrical conductivity and the thermal conductivity. While this may occur for a variety of reasons, the cancellation of errors results in a good overall prediction of Z T , and we therefore consider this approach to be suitable for use in a predictive capacity.
Our calculations predict that, provided that carrier concentrations on the order of 10 20 cm 3 can be obtained by doping, the rocksalt phases may show larger electrical conductivities and comparable Seebeck coefficients to the orthorhombic phases, but the resulting enhanced power factors are likely to be negated by higher thermal conductivities. Since the phonon contributions to the thermal conductivity are generally large in these systems, there may be scope to further improve Z T by using structural modifications to suppress the heat transport through the lattice [1,9]. Based on our results, we would conclude that rocksalt SnSe is unlikely to show superior thermoelectric performance to the Pnma phase, and whereas some improvement on the relatively poorer Z T of Pnma SnS might be possible in an alternative RS structure, it would require stabilising it in a geometry close to the equilibrium structure. Given that there is experimental evidence to indicate that RS SnS can be grown epitaxially [37,38], this could plausibly be achieved in a thin film device using a suitable contact material. It is also possible that the RS phase could be stabilised with suitable doping or atomic substitution—e.g., partial replacement of Sn with Pb, since the analogous PbS and PbSe adopt the RS structure—but we are not aware of any experimental data that would support this suggestion. On the other hand, it is worth noting that maintaining an RS structure with an incipient dynamical instability under the high temperatures in working thermoelectric generators may be difficult to achieve in practice.
However, both SnS and SnSe have been prepared in π -cubic phases that are closely related to the rocksalt structure [42,43,45], but with distortions that have been predicted to reduce the lattice thermal conductivity [76], and our results therefore motivate an in-depth investigation to establish the thermoelectric performance of these systems.

Supplementary Materials

The following are available online at https://www.mdpi.com/article/10.3390/solids3010011/s1: Table S1—comparison of the lattice parameters of Pnma SnS and SnSe obtained in this work to those in [45]; Table S2—predicted maximum figures of merit Z T of the five structures examined in this work with the electronic thermal conductivity determined using the Wiedemann–Franz law; Figure S1—calculated power factor and κ el of the Pnma and equilibrium/compressed RS SnS structures as a function of temperature and carrier concentration; Figures S2–S6—comparison of the electrical conductivity of the five structures examined in this work with the κ el determined using Equations (7) and (12), Figures S7 and S8—anisotropy in the electrical transport properties of SnS and SnSe; Figure S9—calculated electron scattering rates for the three SnS structures examined in this work, Figure S10—comparison of the electrical transport properties of the three rocksalt structures examined in this work obtained with dielectric properties calculated using the PBEsol + D3 GGA and HSE 06 hybrid functionals.

Author Contributions

Conceptualisation—J.M.S.; methodology—J.M.F. and I.P.; formal analysis and investigation—J.M.F., I.P. and J.M.S.; data curation—J.M.F., I.P. and J.M.S.; writing—J.M.F., I.P. and J.M.S.; funding acquisition—J.M.S. All authors have read and agreed to the published version of the manuscript.

Funding

J.M.S. and J.M.F. are currently supported by UK Research and Innovation (UKRI; Grant No. MR/T043121/1). The majority of our calculations were performed on the U.K. national ARCHER 2 HPC facility through our membership of the UK Materials Chemistry Consortium (MCC), which is funded by the UK Engineering and Physical Sciences Research Council (EPSRC; Grant No. EP/R029431).

Institutional Review Board Statement

Not applicable.

Informed Consent Statement

Not applicable.

Data Availability Statement

Raw data from this study, including optimised structures, input and output files for the Phonopy, Phono3py, and AMSET codes, and sample input files for the Vienna Ab initio Simulation Package, will be made available to download free of charge from an online repository at doi:10.17632/72pcztbg63.

Acknowledgments

I.P. is grateful to the University of Manchester for the support of a studentship. A subset of the calculations in this work were performed on the University of Manchester Computational Shared Facility (CSF) HPC system, which is maintained by UoM Research IT.

Conflicts of Interest

The authors declare no conflict of interest.

References

  1. Tan, G.; Zhao, L.D.; Kanatzidis, M.G. Rationally Designing High-Performance Bulk Thermoelectric Materials. Chem. Rev. 2016, 116, 12123–12149. [Google Scholar] [CrossRef] [PubMed]
  2. Freer, R.; Powell, A.V. Realising the potential of thermoelectric technology: A Roadmap. J. Mater. Chem. C 2020, 8, 441–463. [Google Scholar] [CrossRef]
  3. Yan, Q.; Kanatzidis, M.G. High-performance thermoelectrics and challenges for practical devices. Nat. Mater. 2021. [Google Scholar] [CrossRef] [PubMed]
  4. Zeier, W.G.; Zevalkink, A.; Gibbs, Z.M.; Hautier, G.; Kanatzidis, M.G.; Snyder, G.J. Thinking Like a Chemist: Intuition in Thermoelectric Materials. Angew. Chem. Int. Ed. 2016, 55, 6826–6841. [Google Scholar] [CrossRef] [PubMed]
  5. Li, C.W.; Hong, J.; May, A.F.; Bansal, D.; Chi, S.; Hong, T.; Ehlers, G.; Delaire, O. Orbitally driven giant phonon anharmonicity in SnSe. Nat. Phys. 2015, 11, 1063–1069. [Google Scholar] [CrossRef]
  6. Aseginolaza, U.; Bianco, R.; Monacelli, L.; Paulatto, L.; Calandra, M.; Mauri, F.; Bergara, A.; Errea, I. Phonon Collapse and Second-Order Phase Transition in Thermoelectric SnSe. Phys. Rev. Lett. 2019, 122, 075901. [Google Scholar] [CrossRef] [Green Version]
  7. Aseginolaza, U.; Bianco, R.; Monacelli, L.; Paulatto, L.; Calandra, M.; Mauri, F.; Bergara, A.; Errea, I. Strong anharmonicity and high thermoelectric efficiency in high-temperature SnS from first principles. Phys. Rev. B 2019, 100, 214307. [Google Scholar] [CrossRef] [Green Version]
  8. Nielsen, M.D.; Ozolins, V.; Heremans, J.P. Lone pair electrons minimize lattice thermal conductivity. Energy Environ. Sci. 2013, 6, 570–578. [Google Scholar] [CrossRef]
  9. Biswas, K.; He, J.; Blum, I.D.; Wu, C.I.; Hogan, T.P.; Seidman, D.N.; Dravid, V.P.; Kanatzidis, M.G. High-performance bulk thermoelectrics with all-scale hierarchical architectures. Nature 2012, 489, 414–418. [Google Scholar] [CrossRef] [PubMed]
  10. Gibbs, Z.M.; Kim, H.; Wang, H.; White, R.L.; Drymiotis, F.; Kaviany, M.; Jeffrey Snyder, G. Temperature dependent band gap in PbX (X = S, Se, Te). Appl. Phys. Lett. 2013, 103, 262109. [Google Scholar] [CrossRef]
  11. Delaire, O.; Ma, J.; Marty, K.; May, A.F.; McGuire, M.A.; Du, M.H.; Singh, D.J.; Podlesnyak, A.; Ehlers, G.; Lumsden, M.D.; et al. Giant anharmonic phonon scattering in PbTe. Nat. Mater. 2011, 10, 614–619. [Google Scholar] [CrossRef] [PubMed] [Green Version]
  12. Liu, W.; Lukas, K.C.; McEnaney, K.; Lee, S.; Zhang, Q.; Opeil, C.P.; Chen, G.; Ren, Z. Studies on the Bi2Te3–Bi2Se3–Bi2S3 system for mid-temperature thermoelectric energy conversion. Energy Environ. Sci. 2013, 6, 552–560. [Google Scholar] [CrossRef]
  13. Cen, J.; Pallikara, I.; Skelton, J.M. Structural Dynamics and Thermal Transport in Bismuth Chalcogenide Alloys. Chem. Mater. 2021, 33, 8404–8417. [Google Scholar] [CrossRef]
  14. Korkosz, R.J.; Chasapis, T.C.; Lo, S.h.; Doak, J.W.; Kim, Y.J.; Wu, C.I.; Hatzikraniotis, E.; Hogan, T.P.; Seidman, D.N.; Wolverton, C.; et al. High ZT in p-Type (PbTe)1−2x(PbSe)x(PbS)x Thermoelectric Materials. J. Am. Chem. Soc. 2014, 136, 3225–3237. [Google Scholar] [CrossRef]
  15. Ginting, D.; Lin, C.C.; Rhyee, J.S. Synergetic Approach for Superior Thermoelectric Performance in PbTe-PbSe-PbS Quaternary Alloys and Composites. Energies 2020, 13, 72. [Google Scholar] [CrossRef] [Green Version]
  16. Li, S.; Li, X.; Ren, Z.; Zhang, Q. Recent progress towards high performance of tin chalcogenide thermoelectric materials. J. Mater. Chem. A 2018, 6, 2432–2448. [Google Scholar] [CrossRef]
  17. Shi, Y.; Sturm, C.; Kleinke, H. Chalcogenides as thermoelectric materials. J. Solid State Chem. 2019, 270, 273–279. [Google Scholar] [CrossRef]
  18. Yu, Y.; Cagnoni, M.; Cojocaru-Mirédin, O.; Wuttig, M. Chalcogenide Thermoelectrics Empowered by an Unconventional Bonding Mechanism. Adv. Funct. Mater. 2020, 30, 1904862. [Google Scholar] [CrossRef] [Green Version]
  19. Zhao, L.D.; Lo, S.H.; Zhang, Y.; Sun, H.; Tan, G.; Uher, C.; Wolverton, C.; Dravid, V.P.; Kanatzidis, M.G. Ultralow thermal conductivity and high thermoelectric figure of merit in SnSe crystals. Nature 2014, 508, 373–377. [Google Scholar] [CrossRef] [PubMed]
  20. Zhao, L.D.; Tan, G.; Hao, S.; He, J.; Pei, Y.; Chi, H.; Wang, H.; Gong, S.; Xu, H.; Dravid, V.P.; et al. Ultrahigh power factor and thermoelectric performance in hole-doped single-crystal SnSe. Science 2016, 351, 141–144. [Google Scholar] [CrossRef] [PubMed] [Green Version]
  21. Sinsermsuksakul, P.; Sun, L.; Lee, S.W.; Park, H.H.; Kim, S.B.; Yang, C.; Gordon, R.G. Overcoming Efficiency Limitations of SnS-Based Solar Cells. Adv. Energy Mater. 2014, 4, 1400496. [Google Scholar] [CrossRef]
  22. Yun, H.S.; Park, B.w.; Choi, Y.C.; Im, J.; Shin, T.J.; Seok, S.I. Efficient Nanostructured TiO2/SnS Heterojunction Solar Cells. Adv. Energy Mater. 2019, 9, 1901343. [Google Scholar] [CrossRef]
  23. Cho, J.Y.; Kim, S.; Nandi, R.; Jang, J.; Yun, H.S.; Enkhbayar, E.; Kim, J.H.; Lee, D.K.; Chung, C.H.; Kim, J.; et al. Achieving over 4% efficiency for SnS/CdS thin-film solar cells by improving the heterojunction interface quality. J. Mater. Chem. A 2020, 8, 20658–20665. [Google Scholar] [CrossRef]
  24. Abd El-Rahman, K.; Darwish, A.; El-Shazly, E. Electrical and photovoltaic properties of SnSe/Si heterojunction. Mater. Sci. Semicond. Process. 2014, 25, 123–129. [Google Scholar] [CrossRef]
  25. Shi, W.; Gao, M.; Wei, J.; Gao, J.; Fan, C.; Ashalley, E.; Li, H.; Wang, Z. Tin Selenide (SnSe): Growth, Properties, and Applications. Adv. Sci. 2018, 5, 1700602. [Google Scholar] [CrossRef] [PubMed] [Green Version]
  26. Ouyang, B.; Chang, C.; Zhao, L.D.; Wang, Z.L.; Yang, Y. Thermo-photoelectric coupled effect induced electricity in N-type SnSe:Br single crystals for enhanced self-powered photodetectors. Nano Energy 2019, 66, 104111. [Google Scholar] [CrossRef]
  27. Xu, H.; Hao, L.; Liu, H.; Dong, S.; Wu, Y.; Liu, Y.; Cao, B.; Wang, Z.; Ling, C.; Li, S.; et al. Flexible SnSe Photodetectors with Ultrabroad Spectral Response up to 10.6 μm Enabled by Photobolometric Effect. ACS Appl. Mater. Interfaces 2020, 12, 35250–35258. [Google Scholar] [CrossRef]
  28. Chattopadhyay, T.; Pannetier, J.; Von Schnering, H.G. Neutron diffraction study of the structural phase transition in SnS and SnSe. J. Phys. Chem. Solids 1986, 47, 879–885. [Google Scholar] [CrossRef]
  29. Skelton, J.M.; Burton, L.A.; Parker, S.C.; Walsh, A.; Kim, C.E.; Soon, A.; Buckeridge, J.; Sokol, A.A.; Catlow, C.R.A.; Togo, A.; et al. Anharmonicity in the High-Temperature Cmcm Phase of SnSe: Soft Modes and Three-Phonon Interactions. Phys. Rev. Lett. 2016, 117, 075502. [Google Scholar] [CrossRef] [PubMed] [Green Version]
  30. Heremans, J.P. The ugly duckling. Nature 2014, 508, 327–328. [Google Scholar] [CrossRef]
  31. Tan, Q.; Zhao, L.D.; Li, J.F.; Wu, C.F.; Wei, T.R.; Xing, Z.B.; Kanatzidis, M.G. Thermoelectrics with earth abundant elements: Low thermal conductivity and high thermopower in doped SnS. J. Mater. Chem. A 2014, 2, 17302–17306. [Google Scholar] [CrossRef]
  32. Zhou, B.; Li, S.; Li, W.; Li, J.; Zhang, X.; Lin, S.; Chen, Z.; Pei, Y. Thermoelectric Properties of SnS with Na-Doping. ACS Appl. Mater. Interfaces 2017, 9, 34033–34041. [Google Scholar] [CrossRef]
  33. Cai, B.; Zhao, L.D.; Li, J.F. High thermoelectric figure of merit ZT > 1 in SnS polycrystals. J. Mater. 2020, 6, 77–85. [Google Scholar] [CrossRef]
  34. Han, Y.M.; Zhao, J.; Zhou, M.; Jiang, X.X.; Leng, H.Q.; Li, L.F. Thermoelectric performance of SnS and SnS–SnSe solid solution. J. Mater. Chem. A 2015, 3, 4555–4559. [Google Scholar] [CrossRef]
  35. Wei, T.R.; Li, Z.; Sun, F.H.; Pan, Y.; Wu, C.F.; Farooq, M.U.; Tang, H.; Li, F.; Li, B.; Li, J.F. Thermoelectric SnS and SnS-SnSe solid solutions prepared by mechanical alloying and spark plasma sintering: Anisotropic thermoelectric properties. Sci. Rep. 2017, 7, 43262. [Google Scholar] [CrossRef]
  36. Lin, C.C.; Lydia, R.; Yun, J.H.; Lee, H.S.; Rhyee, J.S. Extremely Low Lattice Thermal Conductivity and Point Defect Scattering of Phonons in Ag-doped (SnSe)1−x(SnS)x Compounds. Chem. Mater. 2017, 29, 5344–5352. [Google Scholar] [CrossRef]
  37. Mariano, A.N.; Chopra, K.L. Polymorphism In Some IV–VI Compounds Induced By High Pressure And Thin-Film Epitaxial Growth. Appl. Phys. Lett. 1967, 10, 282–284. [Google Scholar] [CrossRef]
  38. Bilenkii, B.F.; Mikolaichuk, A.G.; Freik, D.M. Struktur und optische Eigenschaften von epitaxialen SnTe-, SnSe- und SnS-Schichten. Phys. Status Solidi B 1968, 28, K5–K7. [Google Scholar] [CrossRef]
  39. Greyson, E.; Barton, J.; Odom, T. Tetrahedral Zinc Blende Tin Sulfide Nano- and Microcrystals. Small 2006, 2, 368–371. [Google Scholar] [CrossRef] [PubMed]
  40. Ahmet, I.Y.; Hill, M.S.; Johnson, A.L.; Peter, L.M. Polymorph-Selective Deposition of High Purity SnS Thin Films from a Single Source Precursor. Chem. Mater. 2015, 27, 7680–7688. [Google Scholar] [CrossRef] [Green Version]
  41. Rabkin, A.; Samuha, S.; Abutbul, R.E.; Ezersky, V.; Meshi, L.; Golan, Y. New Nanocrystalline Materials: A Previously Unknown Simple Cubic Phase in the SnS Binary System. Nano Lett. 2015, 15, 2174–2179. [Google Scholar] [CrossRef] [PubMed]
  42. Abutbul, R.E.; Garcia-Angelmo, A.R.; Burshtein, Z.; Nair, M.T.S.; Nair, P.K.; Golan, Y. Crystal structure of a large cubic tin monosulfide polymorph: An unraveled puzzle. CrystEngComm 2016, 18, 5188–5194. [Google Scholar] [CrossRef] [Green Version]
  43. Abutbul, R.E.; Segev, E.; Samuha, S.; Zeiri, L.; Ezersky, V.; Makov, G.; Golan, Y. A new nanocrystalline binary phase: Synthesis and properties of cubic tin monoselenide. CrystEngComm 2016, 18, 1918–1923. [Google Scholar] [CrossRef] [Green Version]
  44. Skelton, J.M.; Burton, L.A.; Oba, F.; Walsh, A. Chemical and Lattice Stability of the Tin Sulfides. J. Phys. Chem. C 2017, 121, 6446–6454. [Google Scholar] [CrossRef] [PubMed]
  45. Pallikara, I.; Skelton, J.M. Phase stability of the tin monochalcogenides SnS and SnSe: A quasi-harmonic lattice dynamics study. Phys. Chem. Chem. Phys. 2021, 23, 19219–19236. [Google Scholar] [CrossRef]
  46. Xie, Y.; Zhou, Y.; Gong, X.G. The intrinsic low lattice thermal conductivity in the rock salt SnSe. Comput. Mater. Sci. 2018, 148, 54–59. [Google Scholar] [CrossRef]
  47. Kresse, G.; Hafner, J. Ab initio molecular dynamics for liquid metals. Phys. Rev. B 1993, 47, 558–561. [Google Scholar] [CrossRef] [PubMed]
  48. Perdew, J.P.; Ruzsinszky, A.; Csonka, G.I.; Vydrov, O.A.; Scuseria, G.E.; Constantin, L.A.; Zhou, X.; Burke, K. Restoring the Density-Gradient Expansion for Exchange in Solids and Surfaces. Phys. Rev. Lett. 2008, 100, 136406. [Google Scholar] [CrossRef] [Green Version]
  49. Grimme, S.; Antony, J.; Ehrlich, S.; Krieg, H. A consistent and accurate ab initio parametrization of density functional dispersion correction (DFT-D) for the 94 elements H-Pu. J. Chem. Phys. 2010, 132, 154104. [Google Scholar] [CrossRef] [PubMed] [Green Version]
  50. Blöchl, P.E. Projector augmented-wave method. Phys. Rev. B 1994, 50, 17953–17979. [Google Scholar] [CrossRef] [Green Version]
  51. Kresse, G.; Joubert, D. From ultrasoft pseudopotentials to the projector augmented-wave method. Phys. Rev. B 1999, 59, 1758–1775. [Google Scholar] [CrossRef]
  52. Monkhorst, H.J.; Pack, J.D. Special points for Brillouin-zone integrations. Phys. Rev. B 1976, 13, 5188–5192. [Google Scholar] [CrossRef]
  53. Togo, A.; Tanaka, I. First principles phonon calculations in materials science. Scr. Mater. 2015, 108, 1–5. [Google Scholar] [CrossRef] [Green Version]
  54. Ganose, A.M.; Park, J.; Faghaninia, A.; Woods-Robinson, R.; Persson, K.A.; Jain, A. Efficient calculation of carrier scattering rates from first principles. Nat. Commun. 2021, 12, 2222. [Google Scholar] [CrossRef]
  55. Krukau, A.V.; Vydrov, O.A.; Izmaylov, A.F.; Scuseria, G.E. Influence of the exchange screening parameter on the performance of screened hybrid functionals. J. Chem. Phys. 2006, 125, 224106. [Google Scholar] [CrossRef] [PubMed]
  56. Gajdoš, M. and Hummer, K. and Kresse, G. and Furthmüller, J.; Bechstedt, F.. Linear optical properties in the projector-augmented wave methodology. Phys. Rev. B 2006, 73, 045112. [Google Scholar] [CrossRef] [Green Version]
  57. Porezag, D.; Pederson, M.R. Infrared intensities and Raman-scattering activities within density-functional theory. Phys. Rev. B 1996, 54, 7830–7836. [Google Scholar] [CrossRef]
  58. Nunes, R.W.; Gonze, X. Berry-phase treatment of the homogeneous electric field perturbation in insulators. Phys. Rev. B 2001, 63, 155107. [Google Scholar] [CrossRef] [Green Version]
  59. Souza, I.; Íñiguez, J.; Vanderbilt, D. First-Principles Approach to Insulators in Finite Electric Fields. Phys. Rev. Lett. 2002, 89, 117602. [Google Scholar] [CrossRef] [Green Version]
  60. Togo, A.; Chaput, L.; Tanaka, I. Distributions of phonon lifetimes in Brillouin zones. Phys. Rev. B 2015, 91, 094306. [Google Scholar] [CrossRef] [Green Version]
  61. Skelton, J.M. Approximate models for the lattice thermal conductivity of alloy thermoelectrics. J. Mater. Chem. C 2021, 9, 11772–11787. [Google Scholar] [CrossRef]
  62. Momma, K.; Izumi, F. VESTA3 for three-dimensional visualization of crystal, volumetric and morphology data. J. Appl. Crystallogr. 2011, 44, 1272–1276. [Google Scholar] [CrossRef]
  63. Lu, Y.; Zheng, F.w.; Yang, Y.; Zhang, P.; Zhang, D.B. Phase stabilities of Cmcm and Pnma SnSe studied by phonon quasiparticle approach. Phys. Rev. B 2019, 100, 054304. [Google Scholar] [CrossRef]
  64. Walsh, A.; Payne, D.J.; Egdell, R.G.; Watson, G.W. Stereochemistry of post-transition metal oxides: Revision of the classical lone pair model. Chem. Soc. Rev. 2011, 40, 4455–4463. [Google Scholar] [CrossRef] [Green Version]
  65. Whittles, T.J.; Burton, L.A.; Skelton, J.M.; Walsh, A.; Veal, T.D.; Dhanak, V.R. Band Alignments, Valence Bands, and Core Levels in the Tin Sulfides SnS, SnS2, and Sn2S3: Experiment and Theory. Chem. Mater. 2016, 28, 3718–3726. [Google Scholar] [CrossRef] [Green Version]
  66. Skelton, J.M.; Parker, S.C.; Togo, A.; Tanaka, I.; Walsh, A. Thermal physics of the lead chalcogenides PbS, PbSe, and PbTe from first principles. Phys. Rev. B 2014, 89, 205203. [Google Scholar] [CrossRef] [Green Version]
  67. Madsen, G.K.; Carrete, J.; Verstraete, M.J. BoltzTraP2, a program for interpolating band structures and calculating semi-classical transport coefficients. Comput. Phys. Commun. 2018, 231, 140–145. [Google Scholar] [CrossRef] [Green Version]
  68. Zhou, C.; Lee, Y.K.; Yu, Y.; Byun, S.; Luo, Z.Z.; Lee, H.; Ge, B.; Lee, Y.L.; Chen, X.; Lee, J.Y.; et al. Polycrystalline SnSe with a thermoelectric figure of merit greater than the single crystal. Nat. Mater. 2021, 20, 1378–1384. [Google Scholar] [CrossRef] [PubMed]
  69. Zhao, L.D.; Chang, C.; Tan, G.; Kanatzidis, M.G. SnSe: A remarkable new thermoelectric material. Energy Environ. Sci. 2016, 9, 3044–3060. [Google Scholar] [CrossRef]
  70. Skelton, J.M.; Tiana, D.; Parker, S.C.; Togo, A.; Tanaka, I.; Walsh, A. Influence of the exchange-correlation functional on the quasi-harmonic lattice dynamics of II-VI semiconductors. J. Chem. Phys. 2015, 143, 064710. [Google Scholar] [CrossRef] [Green Version]
  71. Božin, E.S.; Malliakas, C.D.; Souvatzis, P.; Proffen, T.; Spaldin, N.A.; Kanatzidis, M.G.; Billinge, S.J.L. Entropically Stabilized Local Dipole Formation in Lead Chalcogenides. Science 2010, 330, 1660–1663. [Google Scholar] [CrossRef] [PubMed]
  72. Kastbjerg, S.; Bindzus, N.; Søndergaard, M.; Johnsen, S.; Lock, N.; Christensen, M.; Takata, M.; Spackman, M.A.; Brummerstedt Iversen, B. Direct Evidence of Cation Disorder in Thermoelectric Lead Chalcogenides PbTe and PbS. Adv. Funct. Mater. 2013, 23, 5477–5483. [Google Scholar] [CrossRef]
  73. Keiber, T.; Bridges, F.; Sales, B.C. Lead Is Not Off Center in PbTe: The Importance of r-Space Phase Information in Extended X-Ray Absorption Fine Structure Spectroscopy. Phys. Rev. Lett. 2013, 111, 095504. [Google Scholar] [CrossRef] [Green Version]
  74. Knight, K.S. A high-resolution neutron powder diffraction investigation of galena PbS between 10 K and 350 K: No evidence for anomalies in the lattice parameters or atomic displacement parameters in galena or altaite PbTe at temperatures corresponding to the saturation of cation disorder. J. Physics Condens. Matter. 2014, 26, 385403. [Google Scholar] [CrossRef]
  75. Tang, J.; Skelton, J.M. Impact of noble-gas filler atoms on the lattice thermal conductivity of CoSb3 skutterudites: First-principles modelling. J. Phys. Condens. Matter. 2021, 33, 164002. [Google Scholar] [CrossRef] [PubMed]
  76. Skelton, J.M.; Burton, L.A.; Jackson, A.J.; Oba, F.; Parker, S.C.; Walsh, A. Lattice dynamics of the tin sulphides SnS2, SnS and Sn2S3: Vibrational spectra and thermal transport. Phys. Chem. Chem. Phys. 2017, 19, 12452–12465. [Google Scholar] [CrossRef] [PubMed] [Green Version]
Figure 1. Representative structures of the Pnma (a) and rocksalt (b) phases of SnS and SnSe. These images were prepared using the VESTA software [62].
Solids 03 00011 g001
Figure 2. Calculated phonon dispersion and density of states (DoS) of Pnma SnS (a), equilibrium and compressed rocksalt SnS (b,c), Pnma SnSe (d), and rocksalt SnSe (e). On each DoS plot, the total DoS is shown in black and projections onto the Sn and S/Se atoms are shown as blue and orange shaded areas.
Solids 03 00011 g002
Figure 3. Comparison of the calculated electrical conductivity σ (a,b), Seebeck coefficient S (c,d), power factor S 2 σ (PF) (e,f), and electronic thermal conductivity κ el (g,h) of the five structures examined in this work. For each structure, we show the scalar averages computed using Equations (9)–(11). The four properties are compared as a function of carrier concentration n for a fixed T = 800 K (a,c,e,g) and as a function of temperature for a fixed n = 2.15 × 10 19 cm 3 (b,d,f,h).
Solids 03 00011 g003
Figure 4. Anisotropy in the electronic transport of SnSe. The plots show the diagonal x x , y y , and z z components of the power factor S 2 σ (PF) (a,b) and electronic thermal conductivity κ el (c,d) of the orthorhombic Pnma phase of SnSe together with the isotropic averages calculated using Equations (9)–(11). The isotropic averages of the rocksalt phase, for which the three diagonal components are equal, are also shown for comparison. As in Figure 3, both properties are shown as a function of carrier concentration n for a fixed T = 800 K (a,c) and as a function of temperature for a fixed n = 2.15 × 10 19 cm 3 (b,d).
Solids 03 00011 g004
Figure 5. Calculated scattering rates τ k j 1 as a function of energy ϵ k j for the electronic states in Pnma (a) and rocksalt SnSe (RS) (b) for a carrier concentration n = 2.15 × 10 19 cm 3 and temperature T = 800 K. The energy zero is set to ϵ = ϵ F . Rates are shown separately for the three scattering mechanisms relevant to the two phases of SnSe, viz. acoustic deformation potential (ADP), polar optic phonon (POP), and ionised impurity (IMP) scattering.
Solids 03 00011 g005
Figure 6. Calculated lattice thermal conductivity κ latt as a function of temperature for Pnma SnS (a), equilibrium and compressed rocksalt SnS (b), Pnma SnSe (c), and rocksalt SnSe (d). For the Pnma phases, the principal κ x x , κ y y , and κ z z components of the κ latt tensor, corresponding to transport along the a, b, and c axes, respectively, are shown together with the diagonal average κ ave = 1 3 κ x x + κ y y + κ z z . For the rocksalt phases, the three diagonal components and the average are equivalent by symmetry, so we only show κ ave . The data for Pnma SnS and SnSe is from [61], but the three principal components have been relabelled to match the orientation of the unit cells in this study.
Solids 03 00011 g006
Figure 7. Analysis of the lattice thermal conductivity κ latt of the five structures examined in this work using the constant relaxation time approximation (CRTA) model defined in Equation (18). The three subplots compare the κ latt (a) to the harmonic term κ / τ CRTA (b) and the weighted average lifetime τ CRTA (c) as a function of temperature. For the two Pnma phases, we analyse the averaged κ latt computed using Equation (17).
Solids 03 00011 g007
Figure 8. Thermoelectric figures of merit Z T for the Pnma SnS (a), equilibrium and compressed rocksalt SnS (b,c), Pnma SnSe (d), and rocksalt SnSe (e) calculated using Equation (1) as a function of carrier concentration n and temperature T.
Solids 03 00011 g008
Table 1. Optimised lattice parameters of the five structures examined in this work. Eq.—equilibrium; Comp.—compressed.
a (Å)b (Å)c (Å)V3)
SnS (Pnma)11.0003.9654.202183.2
SnS (RS, Eq.)5.712--186.3
SnS (RS, Comp.)5.426--159.8
SnSe (Pnma)11.3504.1244.335202.9
SnSe (RS)5.912--206.7
Table 2. Calculated thermal conductivities of the five structures examined in this work at T = 800 K. Each row lists the three diagonal components κ x x , κ y y , and κ z z of the κ latt tensor together with the diagonal average κ ave = 1 3 κ x x + κ y y + κ z z and its decomposition into harmonic and lifetime components, κ / τ CRTA ave and τ CRTA , according to Equation (18). The data for Pnma SnS and SnSe is from [61] with the κ x x , κ y y , and κ z z relabelled to be consistent with the orientation of the unit cells in this work.
κ (W m−1 K−1) κ / τ CRTA ave τ CRTA
κ xx κ yy κ zz κ ave (W m−1 K−1 ps−1)(ps)
SnS (Pnma)0.5081.1960.7080.8040.7551.065
SnS (RS, Eq.)0.606--0.6067.6990.079
SnS (RS, Comp.)3.142--3.1425.5120.570
SnSe (Pnma)0.3540.8140.6130.5930.3801.561
SnSe (RS)1.665--1.6651.5781.055
Table 3. Predicted maximum thermoelectric figures of merit Z T for the five systems examined in this work, extracted from Figure 8. For each system, we list the carrier concentration n and temperature T at which the maximum Z T was obtained together with the properties from Equation (1), namely the electrical conductivity σ , the Seebeck coefficient S, the power factor S 2 σ (PF), the electronic and lattice contributions to the thermal conductivity κ el / κ latt , and the total thermal conductivity κ tot .
nT ZT σ SPF S 2 σ κ (W m−1 K−1)
(cm−3)(K)(S cm−1)( μ V K−1)(mW m−1 K−2) κ el κ latt κ tot
SnS (Pnma)4.64 × 10 19 10001.752522721.870.430.641.07
SnS (RS, Eq.)10 20 7202.998852977.841.220.491.70
SnS (RS, Comp.)10 20 8001.489993039.191.822.514.33
SnSe (Pnma)4.64 × 10 19 10002.813482742.620.460.470.93
SnSe (RS)10 20 8002.60119630210.901.691.333.02
Publisher’s Note: MDPI stays neutral with regard to jurisdictional claims in published maps and institutional affiliations.

