1. Introduction
In 2025, forests covered approximately 31.8% of the world’s total land area [
1], playing an important role in various aspects of the environment, maintaining biodiversity and regulating water cycles [
2]. It is also important to emphasize that, each year, the world’s forests absorb 2.4 billion tons of CO
2, accounting for one-third of the CO
2 emitted by the combustion of fossil fuels [
3].
In addition, forests play an important role in reducing soil erosion and the occurrence of flash floods, landslides, droughts, and other natural disasters. However, in the context of increasing global warming, manifested through frequent occurrences of extremely high air temperatures and long-lasting heat waves, wildfires represent a significant challenge and are gradually becoming a global issue [
4,
5]. According to Oom and Pereira (2013), approximately 3% of forests worldwide experience fires each year [
6]. The consequences of wildfires are multiple and range from direct damage, such as the destruction of forest resources, degradation of biodiversity, release of harmful gases into the atmosphere, potential casualties, and population displacement, to significant economic losses in agricultural production, as well as damage to buildings and infrastructure [
7]. The increasing frequency and severity of wildfires have increased interest in researching this issue at a global scale in order to prevent and control these natural disasters.
According to the EM-DAT database (2026) (which records natural disasters that meet one of the following criteria: 10 or more fatalities, 100 or more injuries, a declared state of emergency due to a natural disaster, or request for international aid), 336 wildfires were recorded worldwide between 2001 and 2025 [
8]. These fires resulted in 2341 fatalities and 17,573 injuries, with economic losses estimated at approximately USD 170.3 billion. During this period, the highest number of wildfires occurred in North America (93), followed by Europe (73), South America (49), Asia (46), Africa (26), and Australia and Oceania (25). According to the Food and Agriculture Organization (2025), wildfires remain the greatest threat to the world’s forests, affecting an average of 127 million hectares of forests per year [
9]. The Global Fire Atlas identified approximately 13.3 million individual wildfires worldwide between 2003 and 2013 [
10]. At the global scale, the temporal and spatial distribution of wildfires is uneven. Data from the Fire Information for Resource Management System and Global Wildfire Information System indicate that the highest numbers of wildfires occur in August and October worldwide, while in Europe specifically, this is in August, followed by April [
11,
12]. The lowest numbers of wildfires occur during December, January, and February, which are the winter months in the northern hemisphere. In terms of location, the highest numbers of wildfires are registered in areas where global forests are widespread, such as Central Africa, the Amazon Basin in South America, the northern part of North America, Southeast and East Asia, and the Mediterranean area. Recent research has indicated that wildfires in the Mediterranean area account for more than 80% of the total forest area burned on the European continent [
13].
Contemporary research on wildfires often has a multidisciplinary approach, from investigating causes and patterns of occurrence and spread to analyzing trends [
14,
15,
16,
17]. It also includes research on biological, ecological, and socioeconomic aspects, including assessment of impact on public health [
18,
19,
20,
21,
22,
23]. From a geographical perspective, many studies focus on how climatic, soil and anthropogenic factors, air pollutants, climate change and solar activity influence the occurrence of wildfires [
24,
25,
26]. The utilization of Geographic Information Systems (GIS) and remote sensing has become essential to wildfire risk assessment, wildfire management, zoning risk areas, and modeling the spread of fires [
27,
28,
29,
30,
31,
32,
33,
34]. Moreover, significant attention has been paid to cascading natural hazards, including the occurrence of floods and flash floods after wildfires.
2. Literature Review
Research on wildfires has been the subject of numerous studies that have examined various aspects of this pressing issue worldwide. Based on satellite wildfire data from 2003 to 2023, Chen et al. (2026) indicate a continued global decline in fire activity, especially at low-to-mid latitudes in both hemispheres, although some regions are evidencing an accelerated increase [
35]. Notably, increased wildfire activity has been observed in the northern part of North America, the northeastern part of Eurasia, and central Africa, primarily associated with a warmer climate, and in South Asia and China due to intensive agricultural burning. Conversely, fire activity has declined in the southeastern part of South America, some areas of Africa and Southeastern Asia, and the northwestern part of Eurasia. In Europe, research on wildfires is based on the application of modern spatiotemporal models to analyze the frequency and patterns of fire spread, particularly in the Mediterranean Basin [
13] and southeastern Europe [
16]. Certain studies have focused on specific countries, such as Portugal [
36], Greece [
37], and Serbia [
38,
39]. Studies focusing on Asia indicate an increasing trend in wildfire occurrence across South and Southeast Asia. Based on data from the Moderate Resolution Imaging Spectroradiometer (MODIS) (2003–2016) and Visible Infrared Imaging Radiometer Suite (VIIRS) (2012–2016), it was found that the highest number of recorded wildfires in South Asia occurred in India, followed by Pakistan and other countries. In Southeast Asia, the highest number of wildfires was recorded in Indonesia, followed by Myanmar and Laos [
40]. In addition, it is important to highlight research on the impact of climate change, projected for the period 2019–2100, on future wildfire regimes in two large boreal study areas in central Russia and western Canada using three global climate models. Projections indicate that future fire weather severity will increase significantly in these boreal regions, with some climate change scenarios estimating a 400–500% increase in daily severity ratings [
41]. Recent studies of wildfires in North and South America indicate an increase in their frequency, and highlight the March 2024–February 2025 season, when fires in the Canadian boreal forests [
42] and in the Amazonia and the Pantanal–Chiquitano basins [
43] led to record global carbon emissions. Research based on a combination of various satellite images for assessing burned areas and terrestrial ecosystem models to simulate fuel quantities and the impact of fires on ecosystem dynamics indicate that Africa as a continent represents a global hotspot for wildfires [
44]. Geographical studies highlight Central Africa in particular as a critical region for biomass burning and greenhouse gas emissions from wildfires [
45], with over 60% of such emissions occurring in Angola, DR Congo, Sudan, and the Central African Republic [
46]. According to Haque et al. (2023), interest in wildfire research in Australia has increased following the so-called “Black Summer” of 2019–2020, during which 12 million hectares were destroyed and biodiversity was severely impacted [
47].
Statistical studies of wildfires implement various quantitative indices to assess wildfire danger levels and environmental impacts, as well as sophisticated spatiotemporal models to analyze the patterns of wildfire occurrence. Conventional indices, such as the Canadian Fire Weather Index (FWI) and the differenced normalized burn ratio (dNBR) provide daily risk estimates [
48,
49,
50]. Jolly et al. (2015) calculated global wildfire danger from 1979 to 2013 by applying the US Burning Index (BI), Canadian Fire Weather Index (FWI), and Australian (or McArthur) Forest Fire Danger Index (FFDI), using National Centers for Environmental Prediction (NCEP) and European Centre for Medium-Range Weather Forecasts (ECMWF) data [
51]. In addition, the Drought Code (DC), part of the FWI system, can also be applied, based on an approach that balances daily precipitation and evaporation [
52]. However, it is important to emphasize that many indices have limitations regarding spatial accuracy and the holistic integration of non-meteorological covariates, which restricts their applicability [
53]. One of the primary methodologies employed in a number of studies is the point process approach, which treats wildfires as discrete events in the spatiotemporal domain in order to assess the impact of climatic and ecological covariates [
10]. More recent studies have linked spatial statistics and machine learning components. Techniques such as Bayesian network and log-Gaussian Cox process models are applied, which allow the capture of spatiotemporal aggregation structures through random effects [
54,
55,
56,
57,
58]. In addition, researchers have also utilized Gibbs point process models, such as the Geyer saturation process and the Strauss hardcore process, to examine multiscale clustering and inhibition in fire phenomena [
58]. Furthermore, the application of multi-criteria decision analysis, particularly the analytic hierarchy process, has been widespread in wildfire risk assessment studies, including those evaluating wildfire susceptibility in northern Türkiye [
59] and the prioritization of factors contributing to wildfire risk in Brazil [
32].
In recent years, machine-learning-based approaches to studying wildfires have also gained significant support in the development of predictive models. Systematic reviews indicate that machine learning now accounts for approximately 25% of all methodologies used in wildfire risk assessments, with the Random Forest (RF) algorithm emerging as the dominant technique due to its accuracy [
60,
61]. In addition, support vector machines and artificial neural networks are often used due to their robustness in handling high-dimensional datasets (such as topography, meteorological parameters, and vegetation), while convolutional neural networks enable automated processing of visual data from ground-based sensors, drones, and satellites [
61]. The widespread application of machine learning and deep learning in wildfire research is also confirmed by numerous studies. For instance, Symeonidis et al. (2025) used four machine learning models (Extreme Gradient Boosting (XGBoost), Gradient Boosting Machines (GBM), Light Gradient Boosting Machine (LightGBM), and Categorical Boosting (CatBoost)) to create wildfire susceptibility maps in Greece, analyzing data from wildfires that occurred between 2000 and 2024 [
37]. In Serbia, recent studies have utilized three deep and machine learning models (Deep Neural Network (DNN), Kolmogorov–Arnold Networks (KANs), and XGBoost) for spatial prediction of wildfire vulnerability [
39] and two models (Random Forest (RF) and Logistic Regression (LR)) for mapping the probability of wildfire occurrence in Eastern Serbia [
62]. Durlević et al. (2026) applied two machine learning models (RF and XGBoost) and two deep learning models (DNN and KAN) with Sentinel-2 and VIIRS images, in combination with GIS, to distinguish countries in Southeast Europe based on their degree of susceptibility to wildfires [
38]. Additionally, Safariallahkheili et al. (2025) developed a web-based geospatial artificial intelligence system (GeoXAI) to investigate wildfire susceptibility in Berlin and Brandenburg in Germany, by combining ecological, topographic, and meteorological features derived from high-resolution geospatial data to train an RF model [
63]. In order to study wildfires in Iran, Bahadori et al. (2023) generated wildfire susceptibility maps using deep learning (Recurrent Neural Network and Long Short-Term Memory (LSTM)) with MODIS and Landsat-8 satellite images for areas in western Iran affected by fires in 2021 [
64]. In addition. Noroozi et al. (2024) identified wildfire-prone areas in the Firuzabad region of Fars province using Bayesian and RF methodologies [
31]. Akıncı et al. (2024) conducted a comprehensive evaluation of six different machine learning algorithms (K-Nearest Neighbors (KNN), Support Vector Machines (SVM), tree-based Conditional Inference Trees (CTREE), RF, GBM, and XGBoost) to map wildfire susceptibility in Antalya Province in Türkiye [
65]. Jamshed et al. (2022) used an LSTM model to make weekly wildfire forecasts and calculate the associated fire area in hectares in Pakistan using historical wildfire data provided by Global Forest Watch [
66]. Larsen et al. (2021) implemented a Fully Convolutional Network (FCN) for real-time fire smoke detection in satellite imagery for Australia, which is important for health risk assessment [
67]. In North America, Moghim and Mehrabi (2024) used two machine learning algorithms (LR and RF) to predict wildfires in the United States and Canada in 2024 [
68]. Lastly, in Africa, Seddouki et al. (2023) compared three machine learning algorithms (XGBoost, RF, and SVM) to predict wildfire susceptibility in Tetouan Province in northern Morocco [
69].
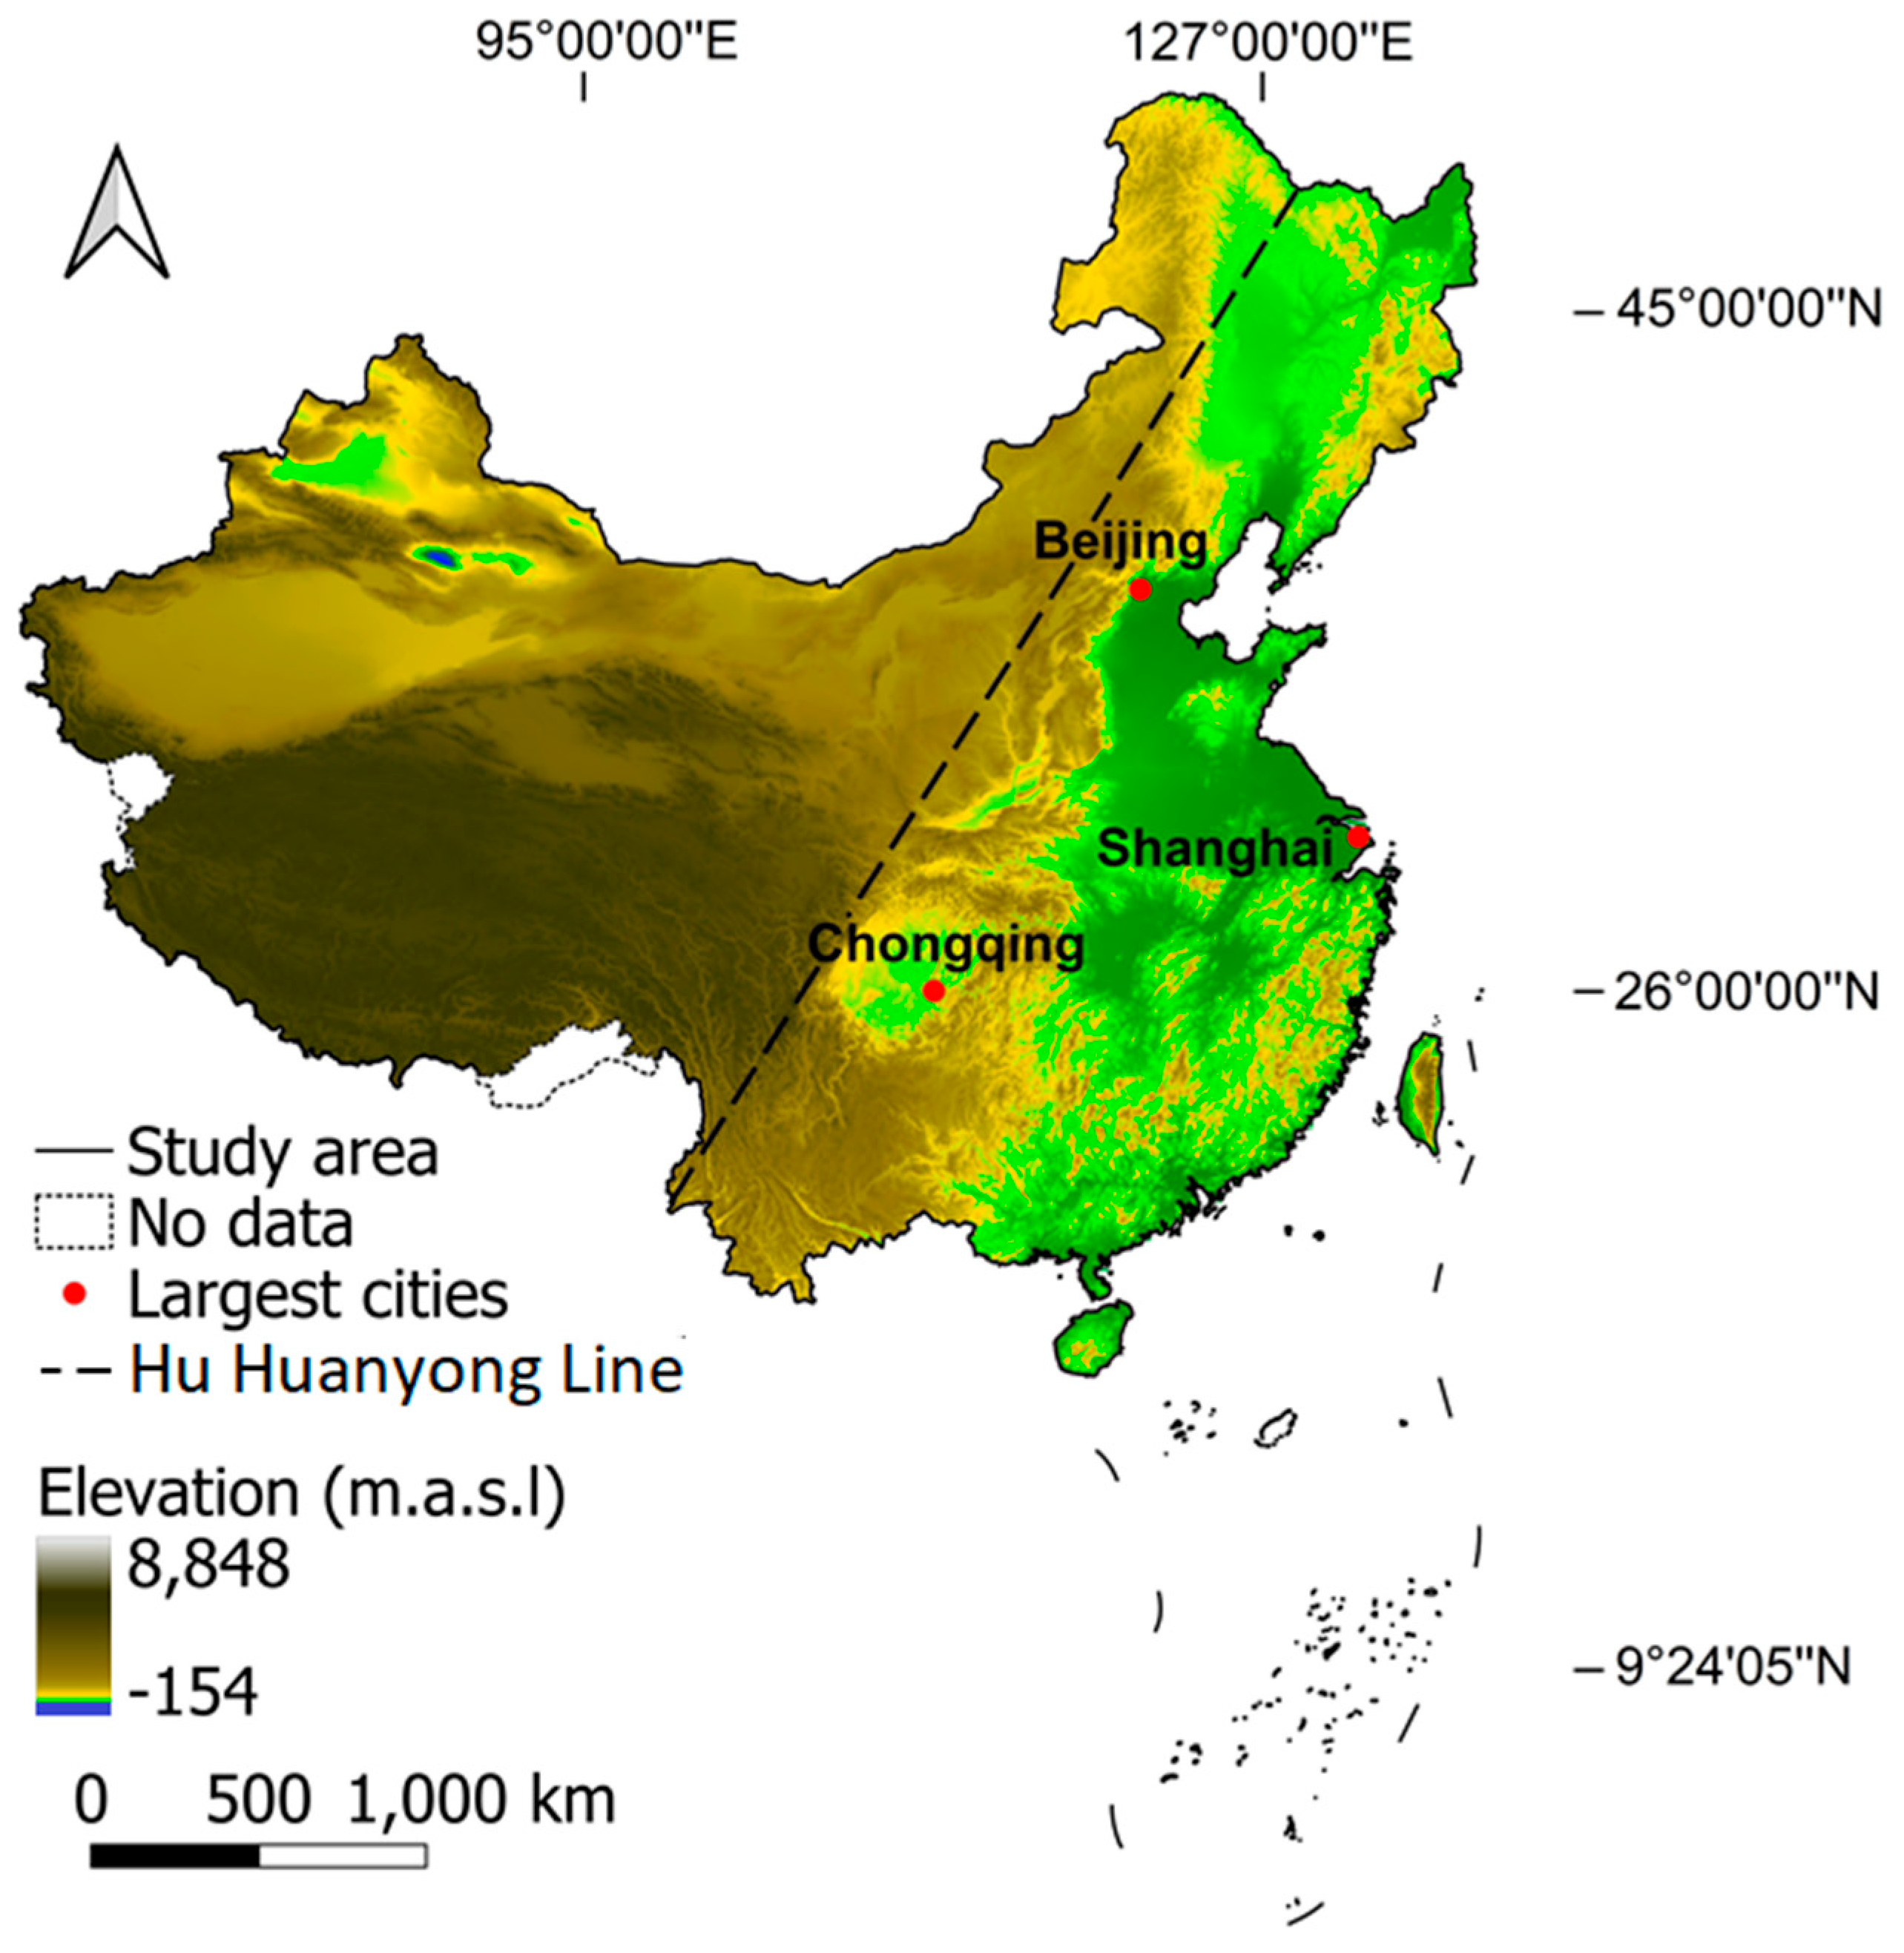
According to Lu et al. (2023), there were a total of 1317 wildfires recorded in China between 2011 and 2020, which burned a total of 155,700 ha of forest and caused 543 fatalities [
70]. China’s forest resources are primarily located in the northeast (the Daxinganling, Xiaoxinganling, and Changbai mountain ranges), southwest (Hengduan range), and the great bend of the Yarlung Zangbo River. These regions are significant areas for wildfire risk research due to the widespread distribution of coniferous and broadleaf mixed forests, as well as subtropical evergreen broadleaf forests [
70]. In recent years, studies for predicting wildfires in China have focused on employing machine learning in creating probability models. Thus, Shao et al. (2022) analyzed 96,594 wildfire samples collected from 2001 to 2019 to produce wildfire zonation maps that clearly identified monthly trends using a Fully Convolutional Network (FCN) model [
71]. They also applied spatial autocorrelation to examine the spatial aggregation of active wildfire hotspots throughout China. Chen et al. (2023) focused their research on improving wildfire probability modeling in the northwest region of Sichuan by integrating variables such as weather, fuel, topography, infrastructure, and other factors using two machine learning methods: RF and XGBoost [
72]. He et al. (2024) forecasted wildfire risk in six eastern Chinese provinces by optimizing a ConvLSTM model using various data sources (satellite-monitored wildfire products, terrestrial and human activities, simulated meteorological elements, and high-resolution vegetation imagery) for the period 2012–2022 [
73]. In addition, Jiang et al. (2024) developed a Convolutional Neural Network (CNN) model based on over 11,000 wildfires recorded in Guangdong Province (2011–2021), incorporating four categories of wildfire-driven factors: topography, vegetation, weather, and human activity [
74].
In addition to the aforementioned studies, which mainly deal with wildfire research in specific areas of China, this study aims to provide a comprehensive survey of the entire territory of China.
The main objectives and contributions of this study are:
Development of a national wildfire inventory;
Application of machine learning, deep learning, and transformer-based models for spatial wildfire prediction;
Production of wildfire susceptibility maps at a 500 m spatial resolution;
Identification of the provinces most susceptible to wildfires across China;
SHAP-based analysis of predictor importance and nonlinear relationships under the pronounced geographical asymmetry between eastern and western China.
This is the first study that analyzes wildfire patterns at the national scale in China using machine learning, deep learning, and transformer-based models. Specific spatial patterns have been identified as a result of the heterogeneity of natural and anthropogenic conditions across all regions of China.
4. Results and Discussion
This section provides an evaluation of model performance and a comparative analysis of the applied machine learning, deep learning, and transformer-based approaches for wildfire susceptibility prediction. The results are organized to provide a structured examination of model behavior, beginning with threshold-free performance evaluation of the model probability maps under real spatial distribution conditions, followed by threshold optimization, error analysis, predictor importance assessment, and cross-model consistency evaluation.
Model performance is analyzed from both probabilistic and classification perspectives to ensure a comprehensive understanding of predictive capability. Special attention is given to the effects of class imbalance, probability calibration, spatial generalization, and decision threshold selection, which are critical factors in wildfire susceptibility modeling applications.
In addition, this section includes a spatial modeling analysis of wildfire susceptibility, enabling the visualization of spatial distribution patterns across the study area. Based on the modeled probabilities, the most susceptible administrative units within the territory of China are identified and ranked according to their wildfire susceptibility levels.
4.1. Classification Performance
Model classification performance was evaluated using conventional binary classification metrics, namely accuracy, precision, recall,
F1 score, ROC-AUC, and PR-AUC. These indicators offer complementary perspectives on predictive behavior, especially in the presence of class imbalance and spatial autocorrelation, which are characteristic of wildfire datasets [
117].
Figure 10 illustrates the ROC curves obtained from the threshold-free evaluation of the model probability maps against the wildfire inventory raster under real spatial distribution conditions. The results indicate that all models retained meaningful discriminative capability under the more conservative validation setting. Among the evaluated approaches, the tree-based ensemble models, particularly RF and XGBoost, achieved the strongest ROC-AUC performance, while Fourier MLP also showed competitive performance, and the DNN, FT Transformer, and KAN models exhibited somewhat lower but still informative discrimination ability.
Precision–recall (PR-AUC) analysis, shown in
Figure 11, provides additional insight into model effectiveness under class-imbalanced conditions. Compared with ROC-AUC, PR-AUC is more sensitive to the proportion of wildfire samples and therefore provides a stricter assessment of model behavior for the fire class. The results confirm that the models maintain useful precision–recall trade-offs under the original highly imbalanced spatial distribution, although the obtained values are more conservative than those expected from a random pixel-level split.
Table 4 presents the comparative threshold-free performance of the evaluated model probability maps under real spatial distribution conditions. The evaluation was performed by comparing the predicted probability rasters against the wildfire inventory raster. The results indicate that all models retained meaningful discriminative capability, with ROC-AUC values ranging from 0.871 to 0.910. RF achieved the highest ROC-AUC, followed by XGBoost and Fourier MLP. In contrast, PR-AUC values were substantially lower because they were computed under the original highly imbalanced spatial distribution, where wildfire pixels represent only a very small fraction of the full raster domain.
Overall, the results indicate that all evaluated models demonstrate stable ranking and discrimination capability under real spatial distribution conditions, while the low PR-AUC values reflect the extreme rarity of wildfire pixels in the full raster domain rather than poor discrimination alone.
4.2. Threshold Optimization
In addition to probabilistic predictions, classification performance is influenced by the selection of an appropriate decision threshold. Since wildfire datasets are characterized by class imbalance and spatial heterogeneity, the conventional threshold value of 0.5 does not necessarily provide optimal classification behavior. To address this issue, threshold optimization was performed on the validation subset by evaluating model outputs across a range of threshold values. The optimal threshold was selected using the F
1 score criterion, which balances precision and recall and is commonly applied in imbalanced classification problems [
118]. The F
1 score used for threshold optimization is defined in Equation (3):
where
TP,
FP, and
FN denote true positives, false positives, and false negatives, respectively. The F
1 score represents the harmonic mean of precision and recall, providing a balanced measure of classification performance under imbalanced conditions.
The final class label
ŷi is obtained by applying a decision threshold
t to the predicted probability
pi, as defined in Equation (4):
The thresholds reported in
Table 5 were used exclusively to derive binary predictions for the confusion matrix analysis. They were not used to define the final wildfire susceptibility classes, which were based on calibrated probability outputs.
It should be emphasized that the optimized thresholds were used only for comparative binary classification and confusion matrix analysis. They were not used as direct operational cut-off values for defining the final wildfire susceptibility classes across the full spatial domain. The final susceptibility maps were interpreted as calibrated probability surfaces and subsequently classified into susceptibility categories for spatial analysis.
The results confirmed that optimal decision thresholds are model-dependent and reflect differences in probability calibration and score distribution across algorithms. Therefore, identical probability values should not be interpreted equivalently across different modeling paradigms. This confirms that threshold optimization is useful for fair model comparison, while final wildfire susceptibility mapping should rely primarily on calibrated probability outputs rather than binary thresholded predictions.
4.3. Confusion Matrix Analysis
To provide a detailed assessment of classification behavior, model performance was further examined using confusion matrices. It is important to emphasize that evaluation was not conducted on the complete spatial dataset, but on the curated machine learning dataset constructed for model training and validation [
119]. The dataset was generated through a controlled sampling procedure designed to ensure a balanced representation of classes. Specifically, an approximately equal number of samples corresponding to wildfire presence (Fire) and wildfire absence (No Fire) were selected. This balancing strategy was intentionally applied to mitigate the severe class imbalance inherent to wildfire occurrence data, where non-fire pixels dominate the spatial domain.
Consequently, the confusion matrices reflect model behavior under balanced classification conditions rather than real-world fire frequency. This evaluation perspective isolates class discrimination capability from spatial event rarity. Under such conditions, performance metrics primarily characterize class separation behavior rather than event prevalence. Across models, results indicate consistent patterns of predictive behavior. Most algorithms demonstrate high recall for the Fire class, indicating strong sensitivity to wildfire-prone conditions. This behavior is to be expected, given the threshold optimization procedure, which prioritizes detection performance and F1 score maximization. Tree-based ensemble models, particularly XGBoost and RF, exhibit a favorable balance between false positives and false negatives. Deep learning models display slightly higher variance, while Fourier MLP and FT Transformer models demonstrate competitive detection characteristics with distinct error distributions.
Overall, confusion matrix analysis confirms that the models achieve stable class separation, with errors primarily arising from transitional environmental gradients where environmental predictors exhibit overlapping characteristics between fire and non-fire samples [
39].
Figure 12 presents the confusion matrices obtained using the optimized decision thresholds.
The observed misclassification patterns motivate further examination of predictor contributions and model decision mechanisms. To better understand the drivers of model behavior, feature importance analysis was conducted.
4.4. Spatial Modeling of Wildfire Susceptibility
Spatial modeling of wildfire susceptibility is the key component of modern approaches to the risk assessment and management of natural disasters. The incorporation of GIS, remote sensing, and artificial intelligence methods facilitates the verification of spatial patterns in wildfire occurrence and the detection of highly susceptible areas at high spatial resolutions [
77,
120].
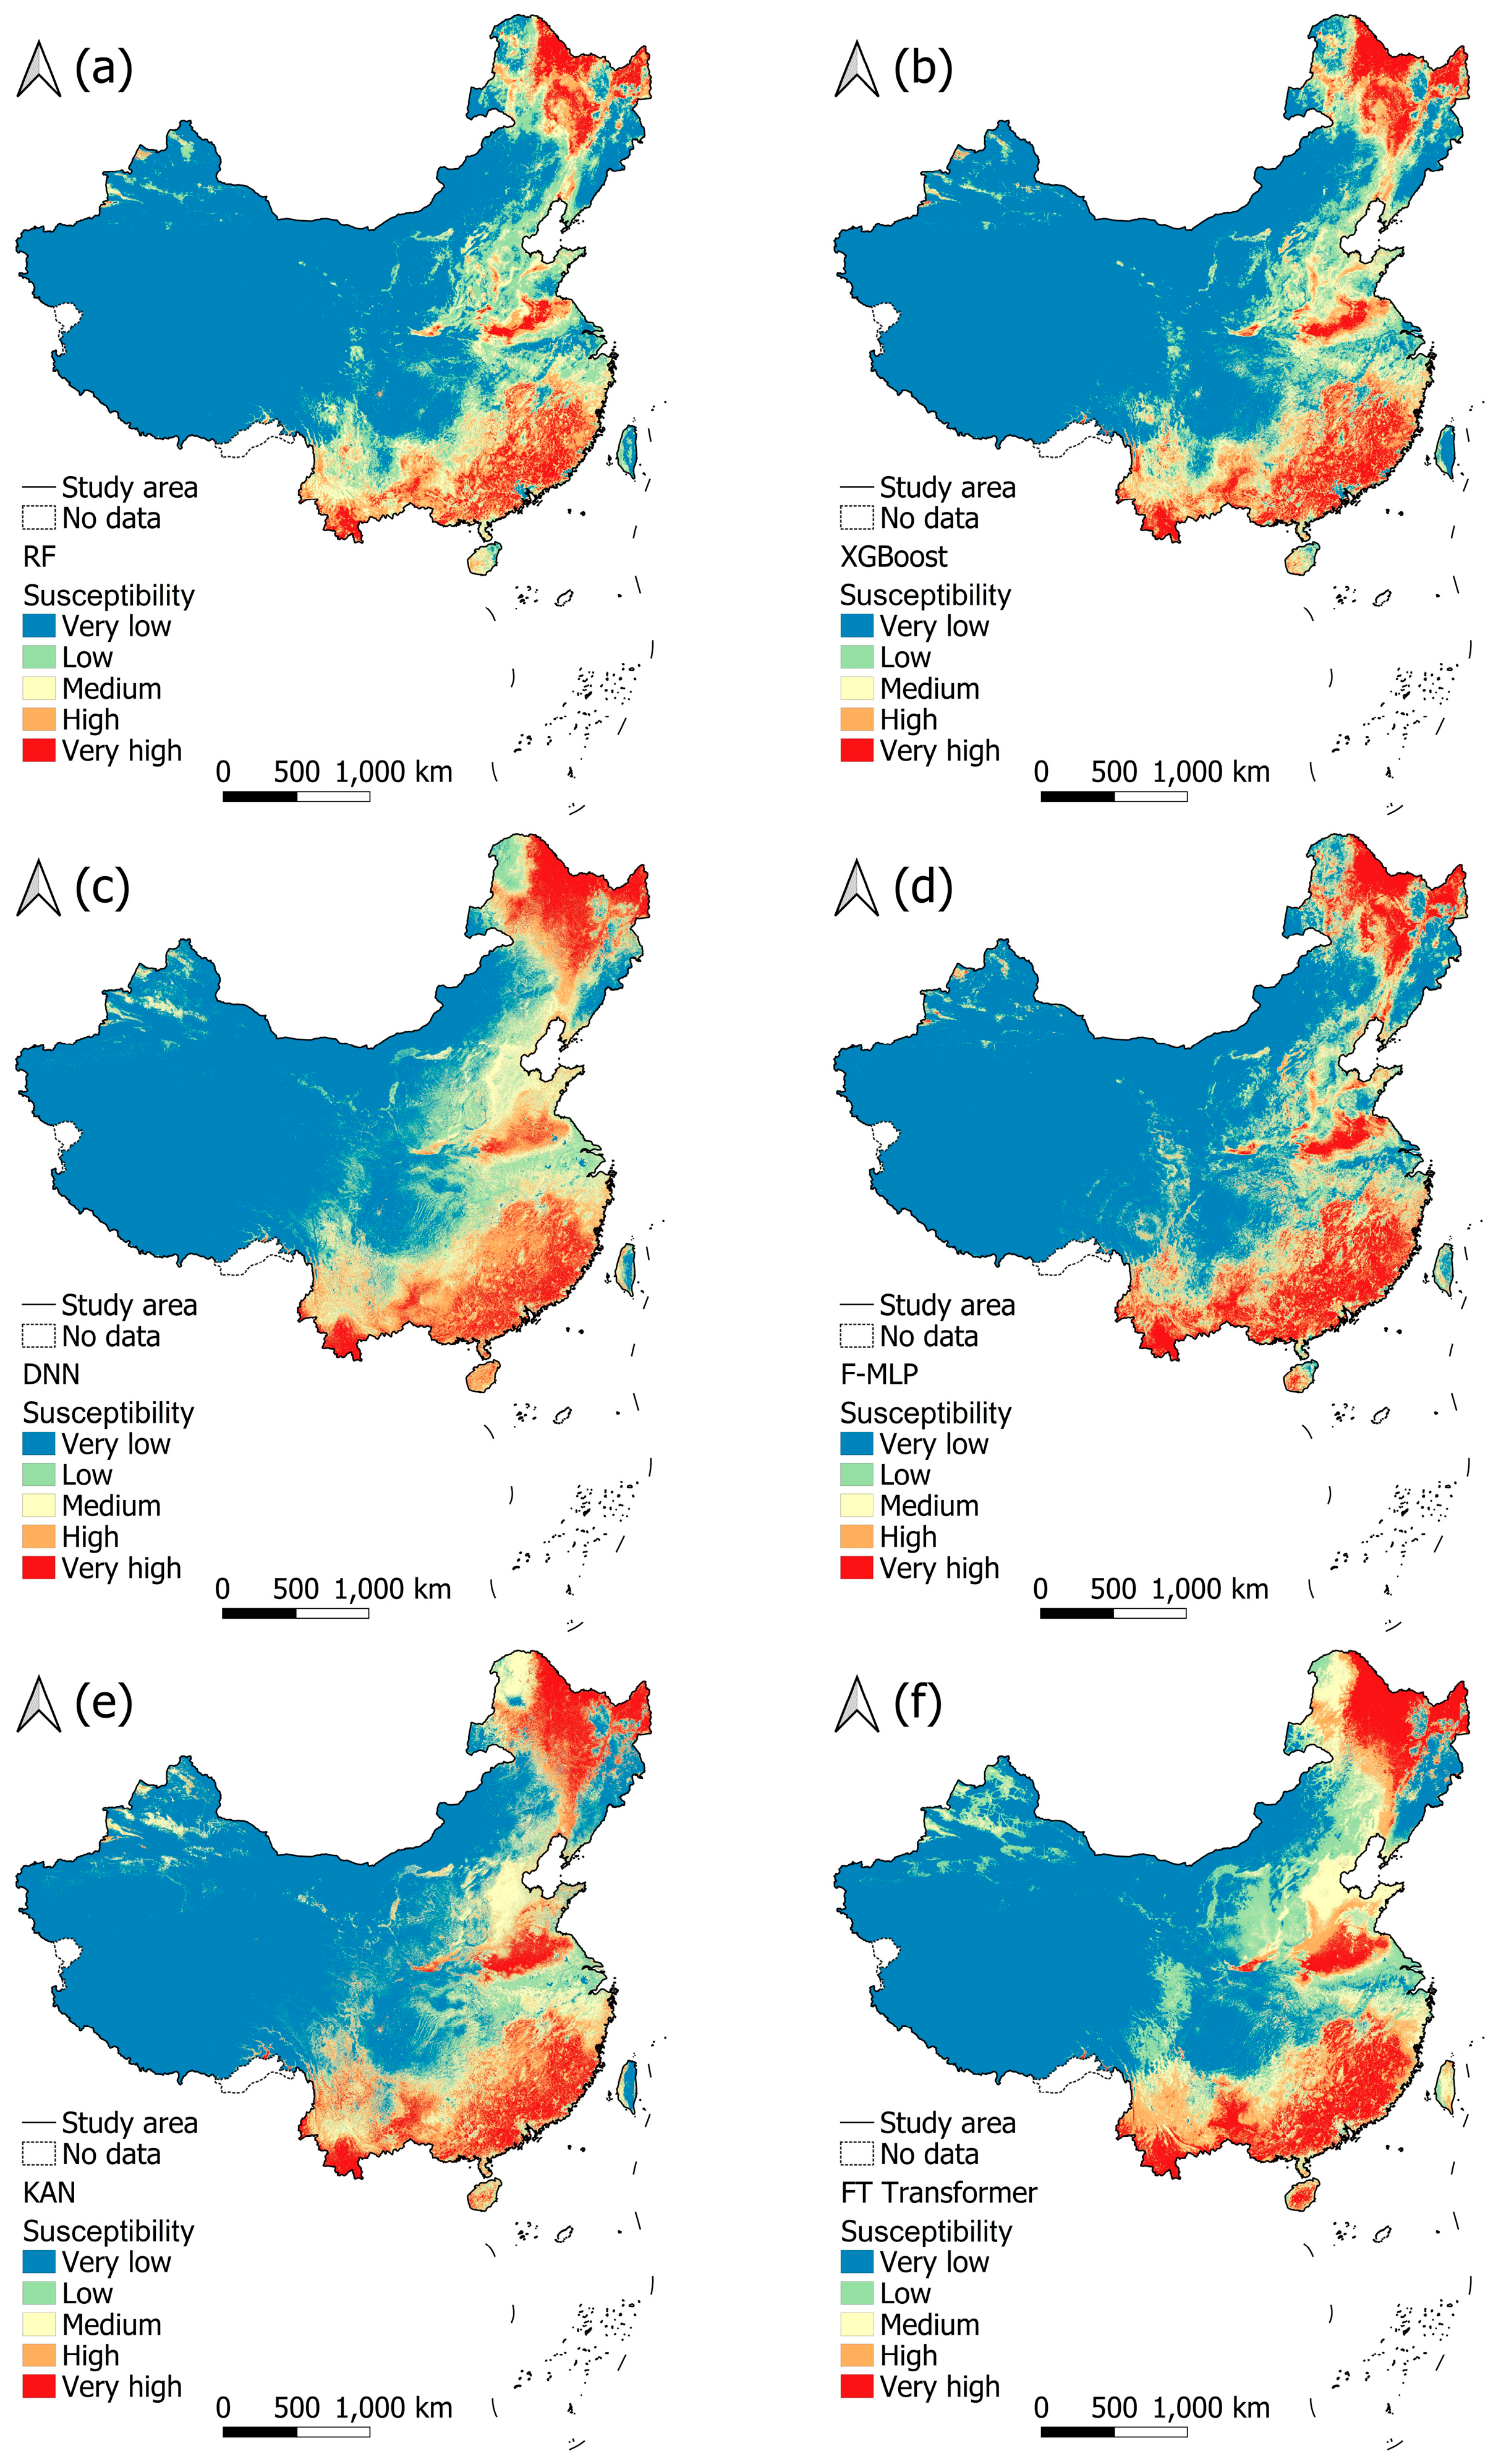
In this research, spatial wildfire occurrence probability was modeled using multiple machine learning, deep learning, and transformer-based models (
Figure 13). The continuous susceptibility values (0–1) were classified into five classes using the equal interval method—very low (0.0–0.2), low (0.2–0.4), medium (0.4–0.6), high (0.6–0.8), and very high (0.8–1.0)—to ensure consistent interpretation and comparison of the outputs from all applied models.
The models were applied to the integrated set of geospatial predictors, which include topographic, climatic, hydrological, vegetational, and anthropogenic factors. The modeling results were presented in the form of raster maps with a spatial resolution of 500 × 500 m, which enabled detailed spatial analysis of wildfire susceptibility across the territory of China. The modeling results were divided into five types of sensitivity: very low, low, medium, high, and very high wildfire occurrence probability [
115]. Such a classification approach is often applied in research on the assessment of hazard zones due to the fact that it allows for simpler clarification of the findings and their use in spatial planning. The individual models indicate a relatively stable distribution of susceptibility categories. For example, the RF model classified approximately 62.1% of the territory as an area with very low wildfire susceptibility, while around 5.8% was identified as an area with very high risk (
Table 6). Similar spatial patterns were also identified in other models, including XGBoost, DNN, and the transformer architecture.
The variations between the models are primarily related to their different abilities regarding the modeling of complex nonlinear relationships between predictor variables. Algorithms like RF and XGBoost proved to be highly efficient in the analysis of structured geospatial data, due to their ability to detect complex interactions between factors that affect wildfire occurrence [
105]. On the other hand, DNNs and transformers enabled the identification of latent patterns in the data but are also able to model complex relationships between climatic, geomorphological, and anthropogenic factors [
120].
Ensemble modeling, which combines the predictions of all the models, was used to lower the variability of individual models and produce a more stable evaluation of wildfire susceptibility. Equation (5) shows that the ensemble probability is computed as the arithmetic mean of the predicted probabilities produced by the individual models:
where
M denotes the number of models and
pm denotes the predicted probability from model
m.
The ensemble model was also evaluated on the spatially independent test subset used for model validation. For each test sample, the ensemble probability was calculated as the arithmetic mean of the calibrated probabilities produced by the six individual models. The resulting ensemble predictions were then assessed using the same performance metrics as the individual models, including ROC-AUC and PR-AUC. This procedure ensured that the final ensemble susceptibility map was supported by an independent spatial generalization assessment rather than being interpreted only as a post-processing product.
Ensemble modeling represents one of the most reliable strategies in modern geospatial risk analysis, since it enables a combination of the advantages of various algorithms and reduces the impact of single-model errors [
118]. According to the ensemble model results, around 56.8% of the territory of China was classified as an area with very low wildfire probability, whereas 14.4% belonged to the category of low probability. Approximately 10.7% of the territory was determined to be of medium susceptibility, while areas of high and very high probability together make up around 18% of the total land area (
Figure 14).
The spatial distribution of the zones with increased wildfire susceptibility shows noticeable regional differentiation. China’s eastern and southern regions were found to have the highest concentrations of high-risk zones. These areas include large population densities, ideal climatic conditions for vegetation growth, and intense human activity, all of which raise the risk of wildfire ignition [
80,
83]. Conversely, because of the predominance of desert and high mountain ecosystems with little vegetation cover, the western and northwestern regions of China, such as Xinjiang and Tibet, exhibit lower susceptibility (
Table 7). A more detailed analysis was carried out on the level of 34 administrative units, enabling a more precise identification of regional susceptibility patterns.
The results show that the provinces of Fujian and Guangxi Zhuang are the most susceptible regions; the areas of high and very high wildfire susceptibility comprise 86.8% and 82.9% of their territory, respectively. A high level of susceptibility was also identified in the provinces of Guangdong, Jiangxi, and Heilongjiang, confirming that regions with developed forest ecosystems and intensive human activity are especially susceptible to wildfire occurrence.
The interpretation of modeling results was additionally improved using the methods of interpretable artificial intelligence, such as SHAP (Shapley additive explanations), which enabled a quantification of the contribution of individual predictor variables to the modeling predictions [
109]. To obtain an objective ranking of predictor importance, SHAP values were converted into mean absolute SHAP values for each variable across all samples. Predictors were then ranked in descending order according to this mean absolute contribution, rather than by visual inspection of the SHAP summary plots. The feature importance analysis showed that soil moisture was the highest-ranked predictor, followed by elevation, slope, global horizontal irradiance, air temperature, and wind speed. These variables therefore represented the dominant model-based contributors to wildfire susceptibility predictions. The SHAP results were interpreted as model-based feature contribution patterns rather than direct causal effects. Higher mean absolute SHAP importance indicates that a predictor contributed more strongly to model predictions, while positive and negative SHAP values were interpreted cautiously because some predictors showed mixed contributions across samples. These results suggest that moisture availability, terrain conditions, solar radiation, temperature, and wind-related factors played an important role in shaping the predicted susceptibility patterns, which is consistent with previous wildfire studies across different ecosystems [
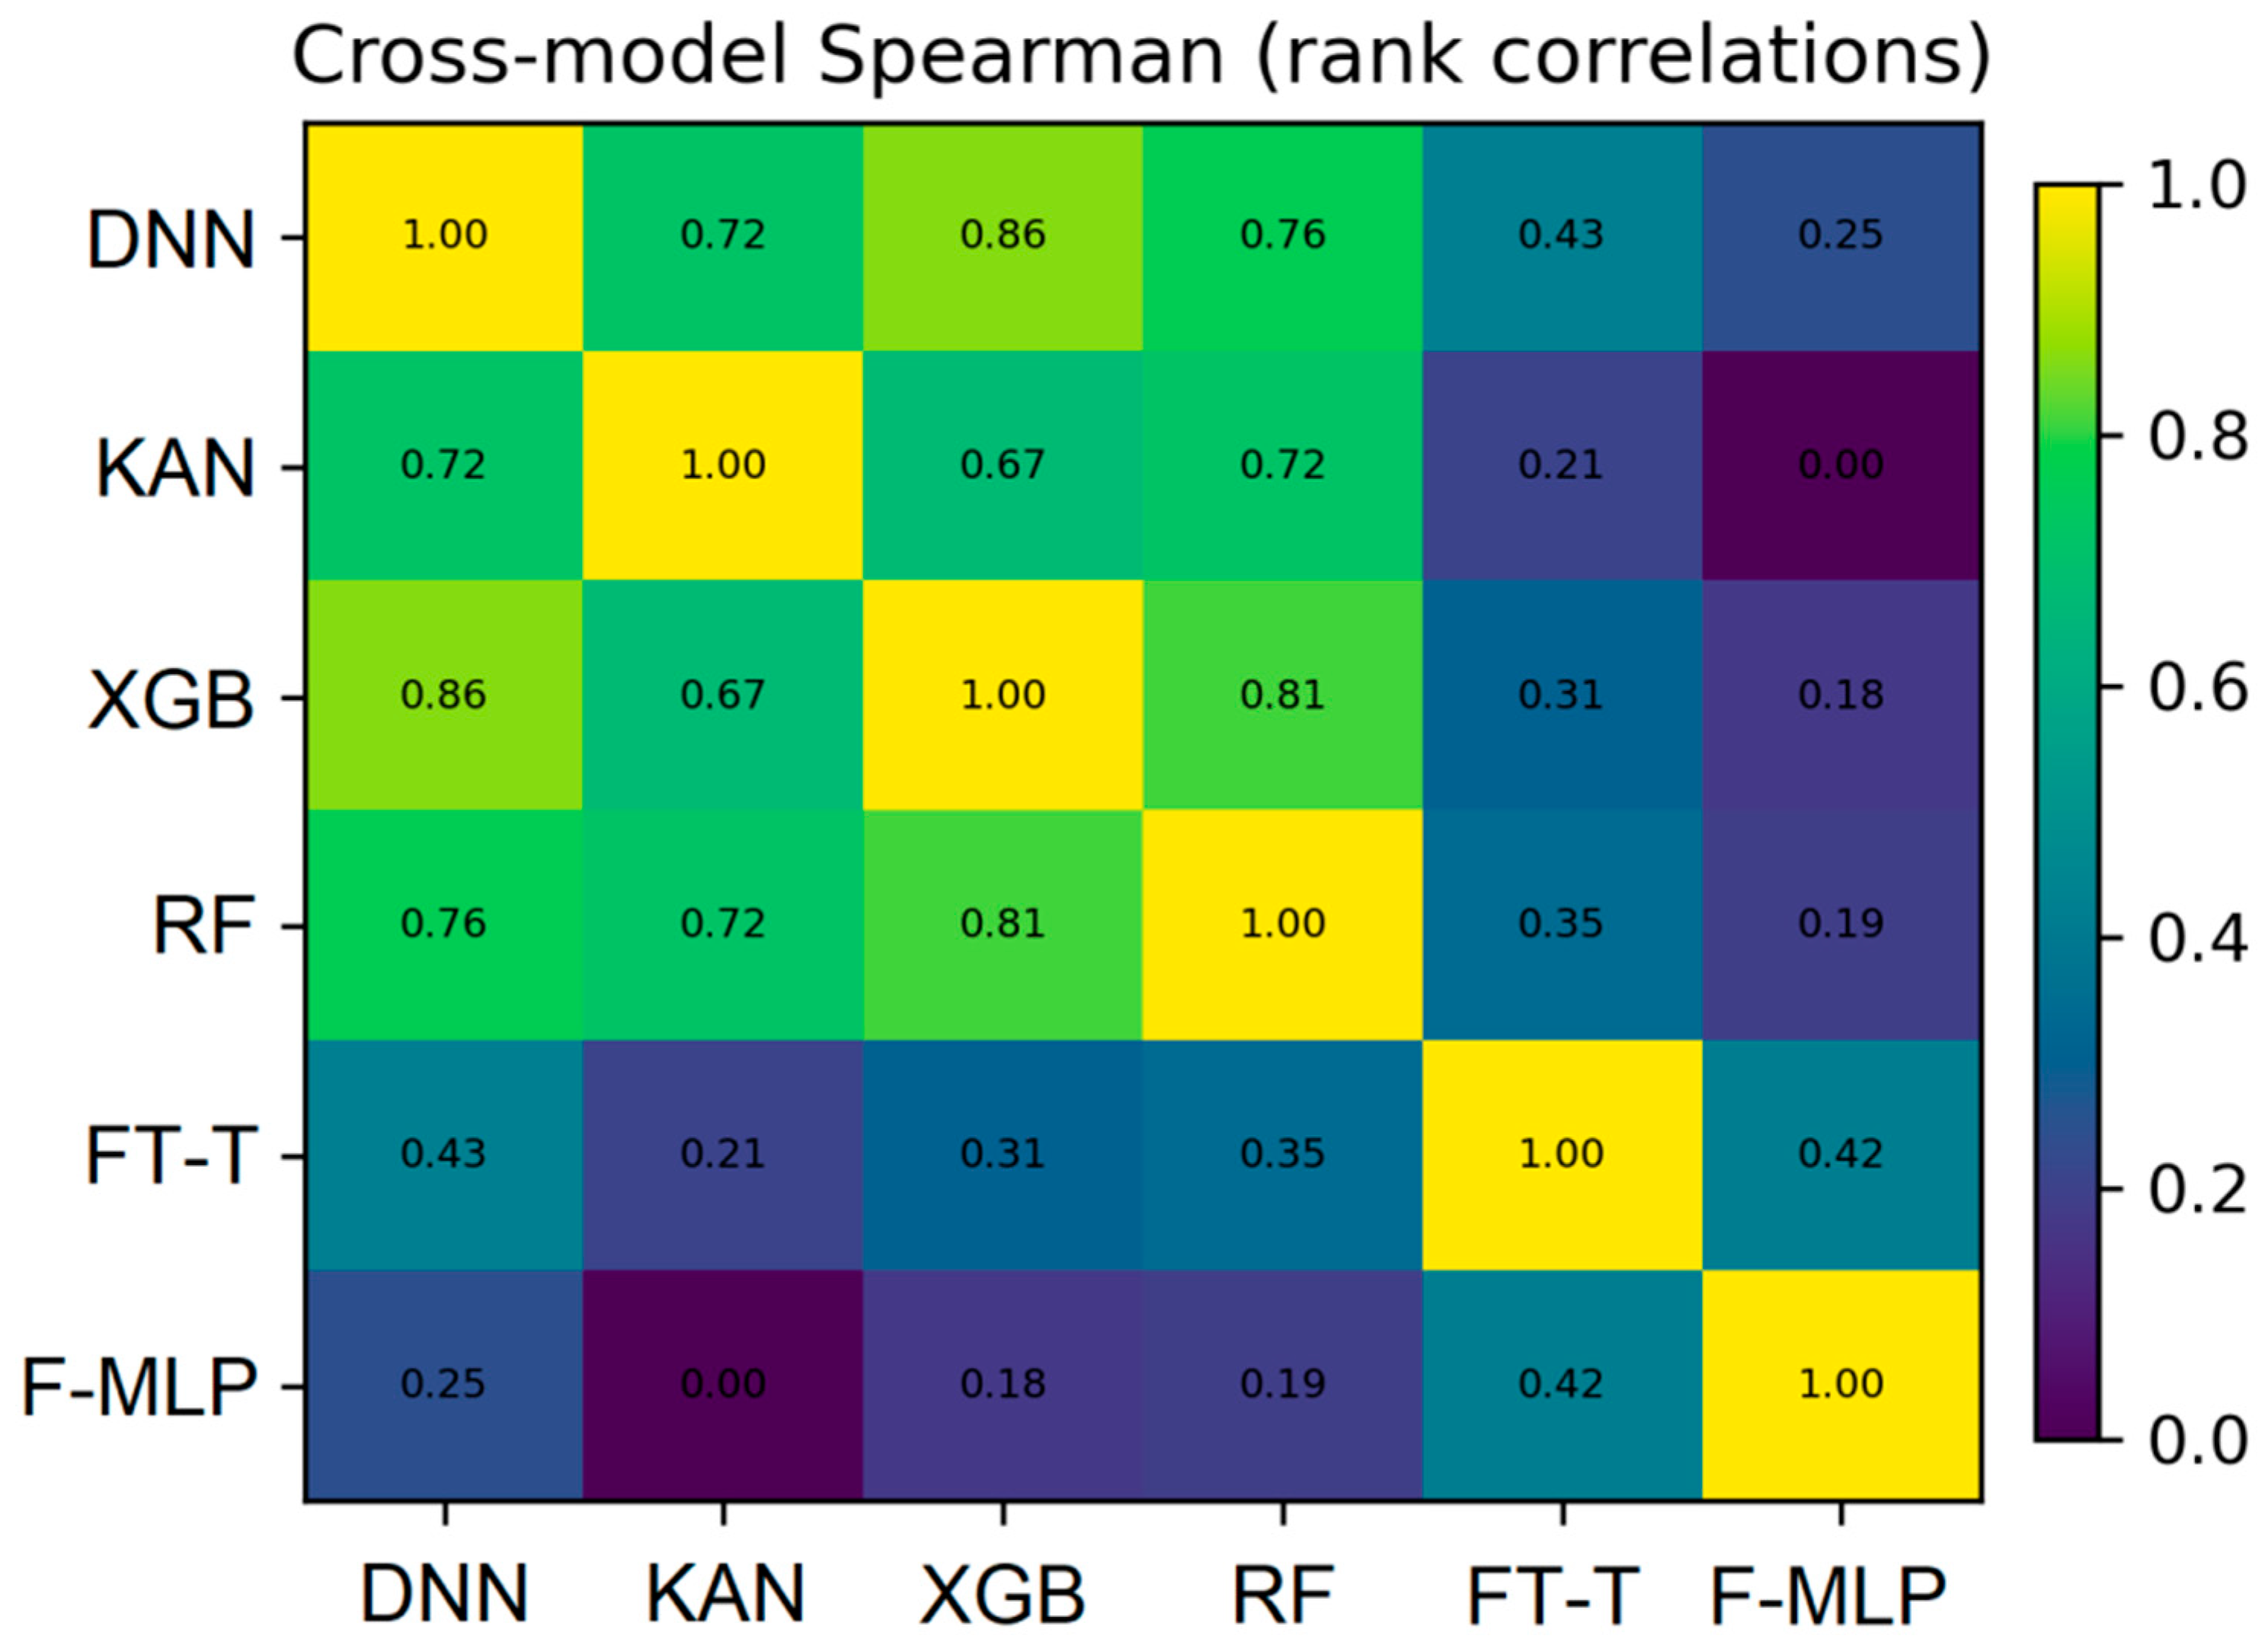
77]. A high degree of spatial agreement among the models indicates the robustness of the identified susceptibility patterns from a meteorological perspective. Analysis of correlations between model predictions showed high values of correlation, indicating that the various algorithms detect similar spatial trends of wildfire probability [
121]. Such consistency implies that integration of multiple algorithms improves the reliability of the results and enables more stable mapping of hazard zones.
4.5. Cross-Model Prediction Consistency
Although the evaluated models differ substantially in terms of both their mathematical foundations and learning mechanisms, it is important to assess whether they produce coherent susceptibility patterns. High classification performance alone does not guarantee structural agreement between predicted probability distributions; models may achieve similar discrimination capability while exhibiting different calibration characteristics or localized prediction behavior.
To quantify model agreement, cross-model prediction consistency was evaluated using pairwise error metrics and correlation analysis [
121]. Unlike classification metrics, this analysis focuses on the similarity of continuous wildfire probability estimates across the full spatial domain.
Table 8 summarizes the pairwise comparison results, including mean absolute error (MAE), root mean square error (RMSE), and Pearson correlation coefficients (PCC) computed between model predictions. The results reveal a generally high level of agreement among models, with correlation values consistently exceeding 0.88 across all pairwise combinations. The strongest consistency was observed between the RF and XGBoost models (corr = 0.9788), accompanied by the lowest MAE and RMSE values. This behavior indicates that tree-based ensemble models produce highly similar probability distributions and capture comparable susceptibility gradients. High degrees of correlation were also observed between neural network models and ensemble learners, particularly for DNN, KAN, and XGBoost combinations. The number of validation samples was N = 31,340,053 for all pairwise model comparisons.
Moderate reductions in agreement are evident for comparisons involving the Fourier MLP model. While correlations remain high, slightly elevated error metrics suggest that spectral feature mapping introduces variations in probability scaling and local sensitivity patterns. Similarly, the FT Transformer exhibits strong correlations with other models, indicating stable detection of dominant spatial trends.
Overall, cross-model consistency analysis confirms that the evaluated algorithms identify coherent large-scale wildfire susceptibility structures. Observed differences primarily reflect model-specific probability calibration characteristics as opposed to fundamental discrepancies in spatial prediction patterns. The high correlation structure indicates robust detection of underlying environmental drivers while preserving meaningful model diversity.
Figure 15 presents the cross-model Spearman rank correlations, highlighting the degree of agreement among probabilistic predictions.
4.6. Environmental Analysis and Importance of Predictive Features
The significance and trends of the predictive variables were examined using SHAP analysis. Points on the right side of the SHAP plot increase susceptibility to wildfires, while those on the left side reduce the risk of occurrence. The color represents the feature value, with blue indicating low values and red indicating high values (
Figure 16).
The ranking of environmental criteria was determined through a comparative analysis of the importance of predictive factors across all six models. The factor that most strongly influences wildfire susceptibility was soil moisture (
Table 9). The drier the soil, the higher the risk of fire, as combustible material becomes more flammable [
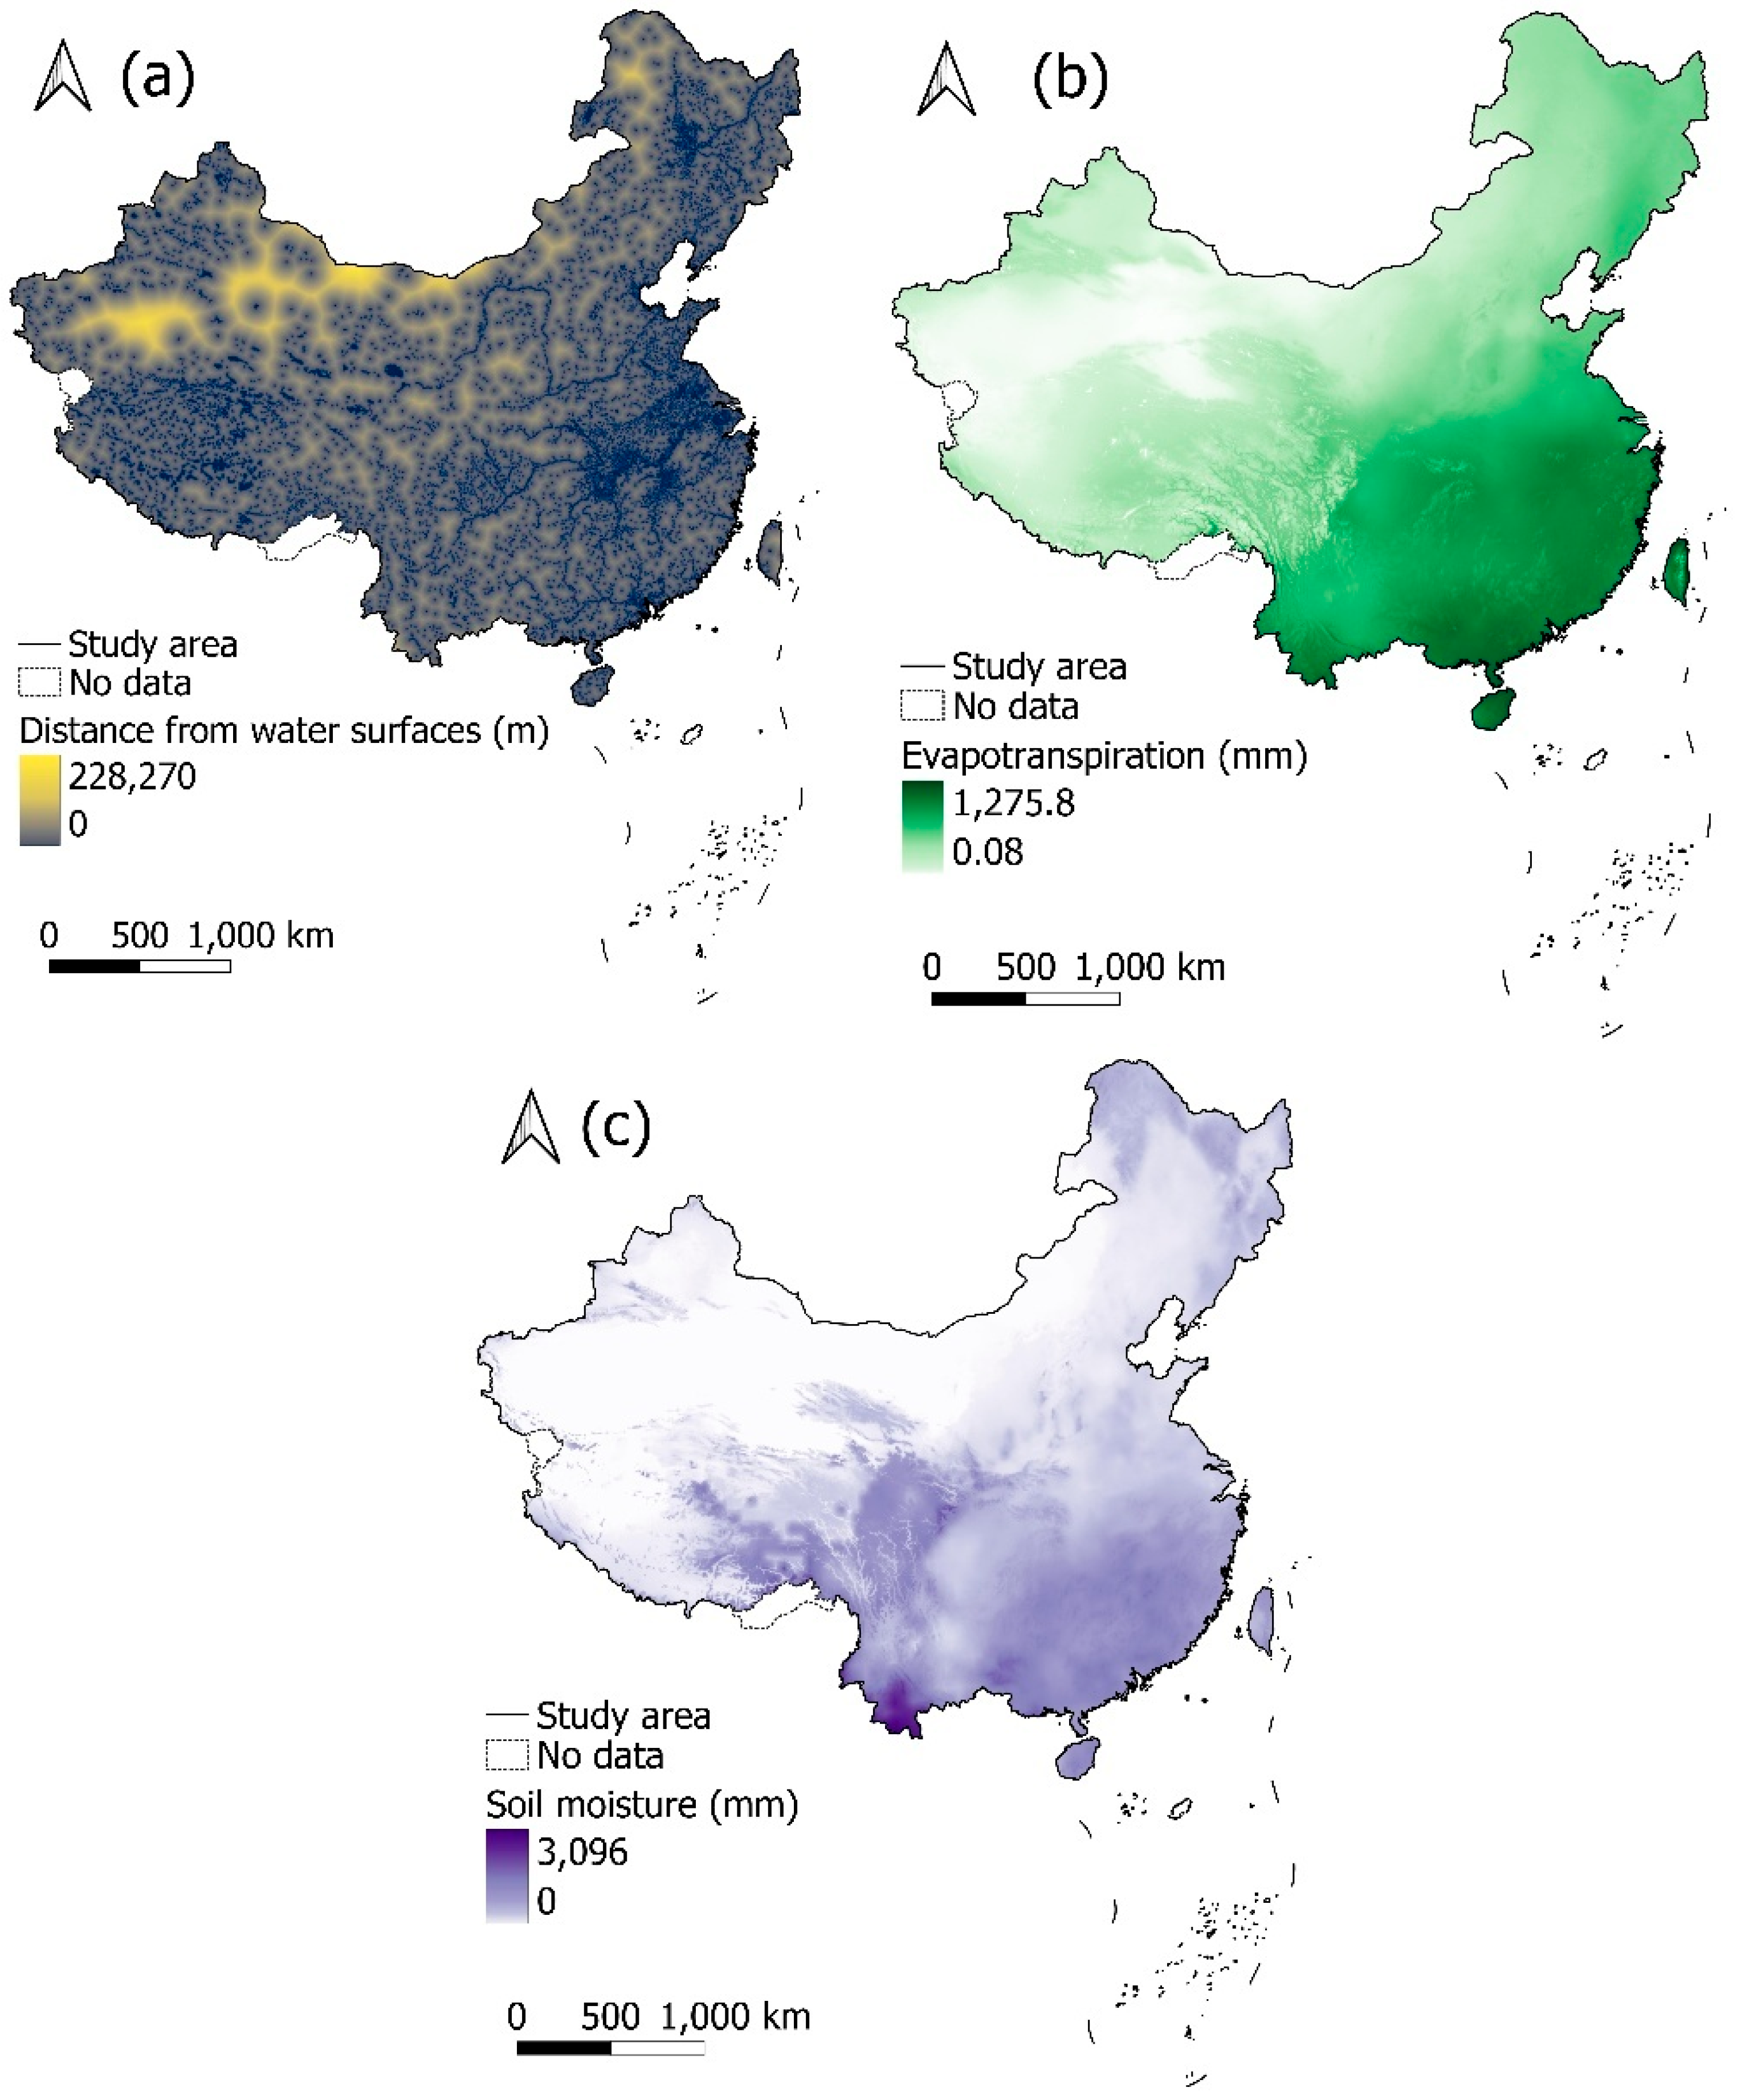
122]. However, in China, a positive correlation between soil moisture and wildfire probability was observed, which could be explained by the nonlinear relationships between dryness, fuel availability, and anthropogenic influences. Although desert areas are characterized by extremely low soil moisture, the absence of human activity and extremely sparse vegetation limit the presence of combustible biomass, thereby reducing the actual probability of fire occurrence. Therefore, at the national level, high wildfire susceptibility occurs in zones with moderate soil moisture, where sufficient vegetation is present and, under drought conditions, becomes highly flammable.
Other factors that are highly influential include topographic conditions, namely elevation and slope. Elevation and slope showed mixed SHAP contributions, indicating that their effects were context-dependent rather than strictly negative or positive. The synergistic effects of climatic conditions, spatial vegetation distribution, and anthropogenic influence could explain this trend. Lowland areas are characterized by higher air temperatures, which lead to faster drying of fuel material and increased flammability [
123]. At the same time, flat terrains tend to have greater levels of continuous vegetation cover, enabling more efficient horizontal fire spread. In addition, these zones are spatially associated with more intensive human activities, thereby increasing the probability of fire ignition. Following geomorphological factors, significant criteria include climatic conditions: global horizontal irradiance (GHI), air temperature, and wind speed. Higher values of GHI and air temperature increase surface and vegetation heating, accelerate evaporation processes, and reduce soil moisture content [
124,
125]. Although global horizontal irradiance generally increases vegetation flammability, the highest GHI values in China occur in high-altitude regions (the Himalayas), where wildfire frequency is very low. This indicates a nonlinear relationship between GHI and wildfire probability, where the effect of radiation depends on biomass availability and specific geoecological conditions.
A similar phenomenon is observed with air temperature. An exception appears when desert regions are included in the analysis, as, simultaneously, they are the warmest zones but exhibit very low wildfire frequency. Therefore, the relationship between temperature and wildfire susceptibility is not strictly linear. Extremely high temperatures in the absence of available fuel do not increase fire risk. The positive correlation between wind speed and wildfire probability indicates that higher wind speeds increase the likelihood of fire occurrence and spread. This is due to the fact that stronger winds increase the oxygen supply to the combustion zone, intensifying the oxidation process and raising the flame temperature [
126].
From a land use perspective, agricultural plots, meadows, and pastures also have notable significance. Agricultural areas represent zones of increased anthropogenic activity, thereby raising the probability of fire ignition [
49]. After harvest, crop residues and dry straw form a highly flammable fuel layer. During dry periods, meadows and pastures are characterized by grassy biomass with low moisture content, and a relatively low ignition temperature [
127]. In the arid and semi-arid regions of northern and western China, grassland ecosystems can contribute significantly to overall fire frequency. However, the influence of these land use types depends on the regional climatic context. In areas with sufficient moisture and intensive land management, the risk may be reduced due to vegetation fragmentation and the presence of firebreaks. Therefore, their effect on wildfire probability is not universal, but rather results from the interaction between fuel structure, seasonality, and anthropogenic factors.
Precipitation trends in relation to wildfire probability generally showed a negative correlation, whereby increased rainfall contributes to a lower likelihood of fire occurrence. Higher rainfall amounts increase soil and vegetation moisture, reduce fuel flammability, and prolong drying time. However, in the context of China, a nonlinear relationship arises due to extensive desert areas in the northwestern part of the country. These regions are characterized by extremely low levels of precipitation and minimal vegetation, which limit fuel availability and result in low fire frequency in spite of the arid conditions.
Distance from water surfaces also evidences a nonlinear relationship with wildfire probability, reflecting the pronounced geoecological asymmetry between the western and eastern parts of China. Desert regions are characterized by large distances from water bodies and extremely low fire frequency. Although these areas are far from rivers and lakes, the lack of vegetation limits fuel availability, thereby reducing the likelihood of fire. The effect of distance from water can therefore be seen to be dependent on its interaction with the spatial distribution of biomass. The negative relationship between distance from roads and wildfire probability suggests that areas closer to roads are generally more susceptible to wildfire. However, this pattern primarily reflects roads intersecting or bordering forested and natural landscapes rather than densely urbanized areas, where limited fuel availability reduces wildfire potential despite a high road density.
Criteria with very low importance included evapotranspiration, distance from settlements, and (presence of) forests, bare dry land (deserts), and wet barren land. Evapotranspiration shows a positive correlation with wildfire probability, indicating that higher values of this parameter are associated with a greater likelihood of fire occurrence. This relationship is influenced by the spatial distribution of desert areas in northwestern China, where evapotranspiration values are lowest due to extreme climatic and biogeographical conditions, and fire frequency is also low because of the absence of vegetation and human activity.
Shorter distances from settlements are associated with a higher probability of fire occurrence due to stronger anthropogenic influence and a greater number of potential ignition sources. A higher proportion of forest ecosystems increases risk due to greater quantities of combustible biomass [
128]. In contrast, desert areas, despite their pronounced aridity, are characterized by low wildfire risk due to the limited availability of fuel and minimal human activity. Wet barren lands also show reduced susceptibility to fires, as the combination of higher moisture levels and sparse vegetation limits flammability and the potential for spatial fire spread.
4.7. Comparison with Wildfire Studies in China and Model Performance Evaluation
Based on the created wildfire inventory (153,305 samples), it was determined that 54.2% of fire events occurred in forests, 35% in meadows and pastures, and 5.2% in the vicinity of settlements. This distribution clearly indicates that a substantial proportion of fires occur outside forest ecosystems, particularly in rangelands and areas influenced by anthropogenic activities. Therefore, wildfire research should not be limited solely to forest fire prediction, but should also address the broader phenomenon of wildfires, which includes all types of vegetation and land cover where fires may occur and spread. Machine learning models enable the enhancement of forest ecosystem management and wildfire prevention strategies, particularly in regions where climatic and anthropogenic factors are strongly associated with wildfire dynamics [
120].
Numerous studies addressing forest fires and wildfires have been conducted at the local level across the territory of the People’s Republic of China. Zhang et al. (2019) applied Convolutional Neural Networks (CNN) in order to predict forest fires in Yunnan Province for the period 2002–2010. By processing 14 environmental and anthropogenic factors, the results indicated that the CNN model achieved an AUC value of 86% [
129]. For the same province, Zhang et al. (2025b) applied six machine learning models to identify the optimal model and analyze the dominant factors influencing fire occurrence across different seasons [
120]. The LightGBM model achieved the highest AUC (89.5%), thus confirming the strong predictive performance of gradient-boosting ensemble methods.
Li et al. (2024b) investigated forest fire prediction in the eastern part of China by combining kernel density analysis, global and local spatial autocorrelation, deep learning techniques, the standard deviation ellipse method, and Geographic Information Systems (GIS) [
116]. The results showed that high-fire-frequency zones are primarily concentrated in Guangdong, Fujian, and Zhejiang provinces, with the model demonstrating strong predictive performance (88.2%). Pang et al. (2022) analyzed forest fire prediction at the national level using several machine learning models, including Artificial Neural Networks (ANN), Radial Basis Function Networks (RBFN), Support Vector Machines (SVM), and RF [
130]. The results indicated that AUC values ranged from 84% to 96%, with the RF model achieving the best performance (accuracy of 89.2% and AUC of 0.96).
In addition to studies focusing exclusively on forest fire prediction, several investigations in China have addressed wildfires more broadly, encompassing all types of vegetation fires. Yan et al. (2026) integrated multi-sensor data using five machine learning classifiers—RF, Gradient-Boosting Decision Trees (GBDT), XGBoost, Light Gradient Boosting Machine (LightGBM), and Logistic Regression (LR)—to predict wildfires within the “Three-North Shelterbelt Program” region [
131]. Model performance comparisons showed that tree-based ensemble models significantly outperform linear models, with LightGBM achieving the best results (AUC > 0.98). Jiang et al. (2024) developed a database comprising 11,507 historical wildfire events in Guangdong Province for the period 2011–2021 [
74]. They applied a Convolutional Neural Network, which demonstrated superior performance (AUC = 96.2%) compared to classical machine learning models. Finally, He et al. (2024) investigated six provinces in China and improved a Convolutional Neural Networks–Long Short-Term Memory (ConvLSTM) model, achieving AUC > 80% [
73]. These studies demonstrate that advanced machine learning and deep learning models can effectively capture complex relationships between environmental factors and wildfire occurrence, enabling accurate prediction across different spatial and temporal scales.
In our study, several advantages and novel contributions can be highlighted:
Development of a national wildfire inventory containing 153,305 filtered historical records of fire incidents;
Combined application of machine learning, deep learning, and transformer-based models for spatial wildfire prediction;
A spatial resolution of 500 m for both input parameters and final susceptibility maps, enabling adequate spatial differentiation of results from the national to the local level;
Identification of the most susceptible provinces across the territory of China;
SHAP analysis and the identification of nonlinear relationships among certain predictors, caused by the significant geographical asymmetry between eastern and western China.
In addition to its advantages, the study also has certain limitations. In this research, the spatial resolution of the input data was harmonized through resampling, as the predictor variables were derived from datasets with different native spatial resolutions. Another limitation of this study concerns the absence of seasonal wildfire prediction. While annual datasets for the predictor variables were available and incorporated into the modeling framework, consistent monthly data covering the entire study area were not available, preventing the development of season-specific wildfire prediction models.
Future studies should incorporate land use datasets spanning multiple time periods to improve the accuracy and reliability of the final results, particularly given the intensive land use changes occurring in China, such as increasing urbanization and large-scale afforestation. In addition, future research should place greater emphasis on incorporating temporal components and seasonal variability into wildfire prediction models. The use of monthly or seasonal environmental and climatic datasets would enable a more detailed analysis of intra-annual dynamics and improve the understanding of how seasonal changes influence wildfire occurrence. The integration of such temporal variability could significantly enhance the accuracy of wildfire susceptibility models, and support more effective early warning and fire risk management strategies. Future studies could perform separate wildfire susceptibility analyses for eastern and western China to better account for the pronounced geographical and environmental differences between these regions and potentially improve model performance.
Another limitation of this approach is that the dataset does not represent a fully spatiotemporal panel of fire and non-fire states. Non-fire/background samples correspond to locations with no recorded wildfire occurrence during the full study period, while locations that burned at least once are treated as fire-presence samples. Consequently, the model is intended for long-term spatial susceptibility mapping rather than short-term temporal fire forecasting. Future research could extend this framework by constructing annual or monthly fire/non-fire samples with time-varying climatic, vegetation, and human-activity predictors. In addition, future research could investigate the contribution of lagged climatic effects by incorporating the Standardized Precipitation Index (SPI) and the Standardized Precipitation Evapotranspiration Index (SPEI) to assess their potential for improving nationwide wildfire susceptibility mapping.
5. Conclusions
Due to increasingly frequent climate extremes, wildfires in China pose a major threat to the environment, socio-economic development, and biodiversity. Effective assessment and mapping of fire-prone areas are key approaches to preventive action and wildfire risk management. This study focuses on large-scale wildfire susceptibility modeling at the national level, with a spatial resolution of 500 m. Because the model is based on long-term mean climatic and environmental variables, it provides a long-term spatial assessment of wildfire susceptibility rather than an operational wildfire forecasting system. The development of the geospatial database began with the filtering and integration of satellite data from MODIS and VIIRS products, based on which a fire inventory containing 153,305 wildfire samples was generated for the period 2001–2024. A total of 14 topographic, climatic, hydrological, vegetation, and anthropogenic variables were processed as spatial predictors.
Regarding the methodological framework, six artificial intelligence models were applied: RF, XGBoost, DNN, Fourier MLP, KAN, and FT Transformer. The application of multiple ML, DL, and transformer-based models with different architectures enables the capture of nonlinear relationships and higher-order interactions among wildfire-related variables. This approach improves the robustness of the modeling framework while allowing comparative performance evaluation and identification of the most efficient model.
The results indicate that all models retained meaningful ranking capability under real spatial distribution conditions, with ROC-AUC values ranging from 0.871 to 0.910. RF achieved the strongest performance (ROC-AUC = 0.910), followed by XGBoost (ROC-AUC = 0.902) and Fourier MLP (ROC-AUC = 0.891). At the national scale, 10.6% of China’s territory was identified as highly susceptible and 7.4% as very highly susceptible to wildfires, with the most vulnerable provinces being Fujian (86.8%) and Guangxi Zhuang (82.9%). Due to the pronounced geographical and environmental asymmetry between eastern and western China, it was necessary to determine the importance and trends of predictive variables. SHAP analysis revealed that the three most influential factors affecting wildfire occurrence are soil moisture, elevation, and terrain slope.
This study provides relevant insights, as the results obtained can be applied in emergency situations from the perspective of wildfire management at both the national and local levels. The susceptibility maps can help responsible authorities better understand the spatial characteristics and risk trends of wildfires. Furthermore, the final outputs can contribute to the development of more efficient targeted wildfire prevention and control strategies.




 ,
,