Article

Enhanced Natural Remediation of Nitrate by Pumping Groundwater from Active Denitrification Depth


Graduate School of Advanced Science and Engineering, Hiroshima University, 1-7-1, Kagamiyama, Higashihiroshima 739-8521, Japan
*
Author to whom correspondence should be addressed.
Earth 2026, 7(4), 120; https://doi.org/10.3390/earth7040120
Submission received: 8 May 2026 / Revised: 26 June 2026 / Accepted: 11 July 2026 / Published: 14 July 2026

Abstract

The objective of this study was to propose a simple, low-cost in-situ remediation method for NO3-N that effectively utilizes natural denitrification processes. We verified the inflow of surrounding groundwater containing high concentrations of NO3-N when groundwater at the denitrification depth was pumped, as well as the denitrification effect at that depth, under two pumping flow-rate conditions (low and high) at a site where denitrification had been confirmed. The results suggest that pumping groundwater at the denitrification depth enables the inflow of surrounding groundwater, thereby enabling denitrification of high-concentration NO3-N in the surrounding groundwater under oxidizing conditions. The denitrification amounts were 72 mg-N/h for the high-flow Pumped Denitrification Test (PDT) and 3.3 mg-N/h for the low-flow PDT. Additionally, the nitrate removal efficiency of the high-flow PDT was higher than the results obtained in previous studies at the same site and season under natural groundwater flow. It was also comparable to that of artificially created denitrification environments at other sites when assuming conditions with high NO3-N concentrations in shallow groundwater. This study demonstrated that the pumping of reductive groundwater transports high concentrations of NO3-N along with the surrounding groundwater, and that denitrification occurs without impairing denitrification capacity.

1. Introduction

Globally, while the amount of nitrogen fertilizer applied in agricultural areas has been steadily increasing, the nitrogen use efficiency of crops has decreased by approximately 30% [1], and most of the nitrogen is released into the environment, causing global nitrogen pollution [2,3,4,5]. Eutrophication in lakes and coastal waters causes hypoxic and anoxic conditions, biodiversity loss, and high algal densities. In addition, because groundwater flows slowly, nitrate pollution accumulated over time may persist for many years before natural attenuation occurs [6,7]. Therefore, in terms of global environmental science, the reduction and mitigation of nitrate pollution in groundwater is important [8].
Primarily, one natural attenuation process for nitrate-contaminated groundwater is denitrification. This anaerobic process involves nitrate ions (NO3) serving as an electron acceptor, while organic carbon/sulfide acts as an electron donor in the presence of denitrifying bacteria, usually under reducing conditions. During this denitrification process, NO3-N is reduced to nitrous oxide or nitrogen gas [9,10]. The controlling factors of denitrification are the presence of electron donors and a reducing environment. In addition, denitrification has been confirmed in groundwater runoff areas such as lowland areas and coastal areas that satisfy these factors [11,12,13,14,15]. However, denitrification zones exist locally [16], and in aerobic groundwater recharge areas and shallow layers, denitrification is not observed and NO3-N is preserved [17,18,19]. Moreover, in urban regions with significant human activity, groundwater pumping reduces water pressure at depth, causing shallow groundwater to be drawn downward [20,21,22]. During pumping, shallow groundwater NO3-N was transported downward but was no longer detected in deep groundwater, suggesting that denitrification occurred during subsurface transport [20]. This suggests that artificial pumping can facilitate the movement of nitrate-contaminated groundwater from the surface layer into the denitrification zone, allowing the natural removal of nitrates.
Despite considerable research, there still exists insufficient quantitative evaluation of how shallow groundwater containing high concentrations of NO3-N is transported due to pumping, or how much NO3-N is removed through denitrification when it reaches deep reducing environments. In other words, the impact of deep pumping on groundwater flow and nitrate transport should be systematically evaluated, and the extent to which denitrification can be effectively used clarified.
Therefore, the objective of this study was to verify an in-situ pumping remediation method in which groundwater is extracted from a depth at which denitrification has been confirmed. By reducing the pressure head, this approach promotes the inflow of high-concentration NO3-N from the surrounding groundwater into the pumping zone, where denitrification is expected to occur. The study site selected was an agricultural island in western Japan, where annual nitrogen fertilizer application has led to pronounced NO3-N contamination of groundwater, while the coastal groundwater discharge zone provides a reducing environment suitable for denitrification.

2. Materials and Methods

2.1. Study Area

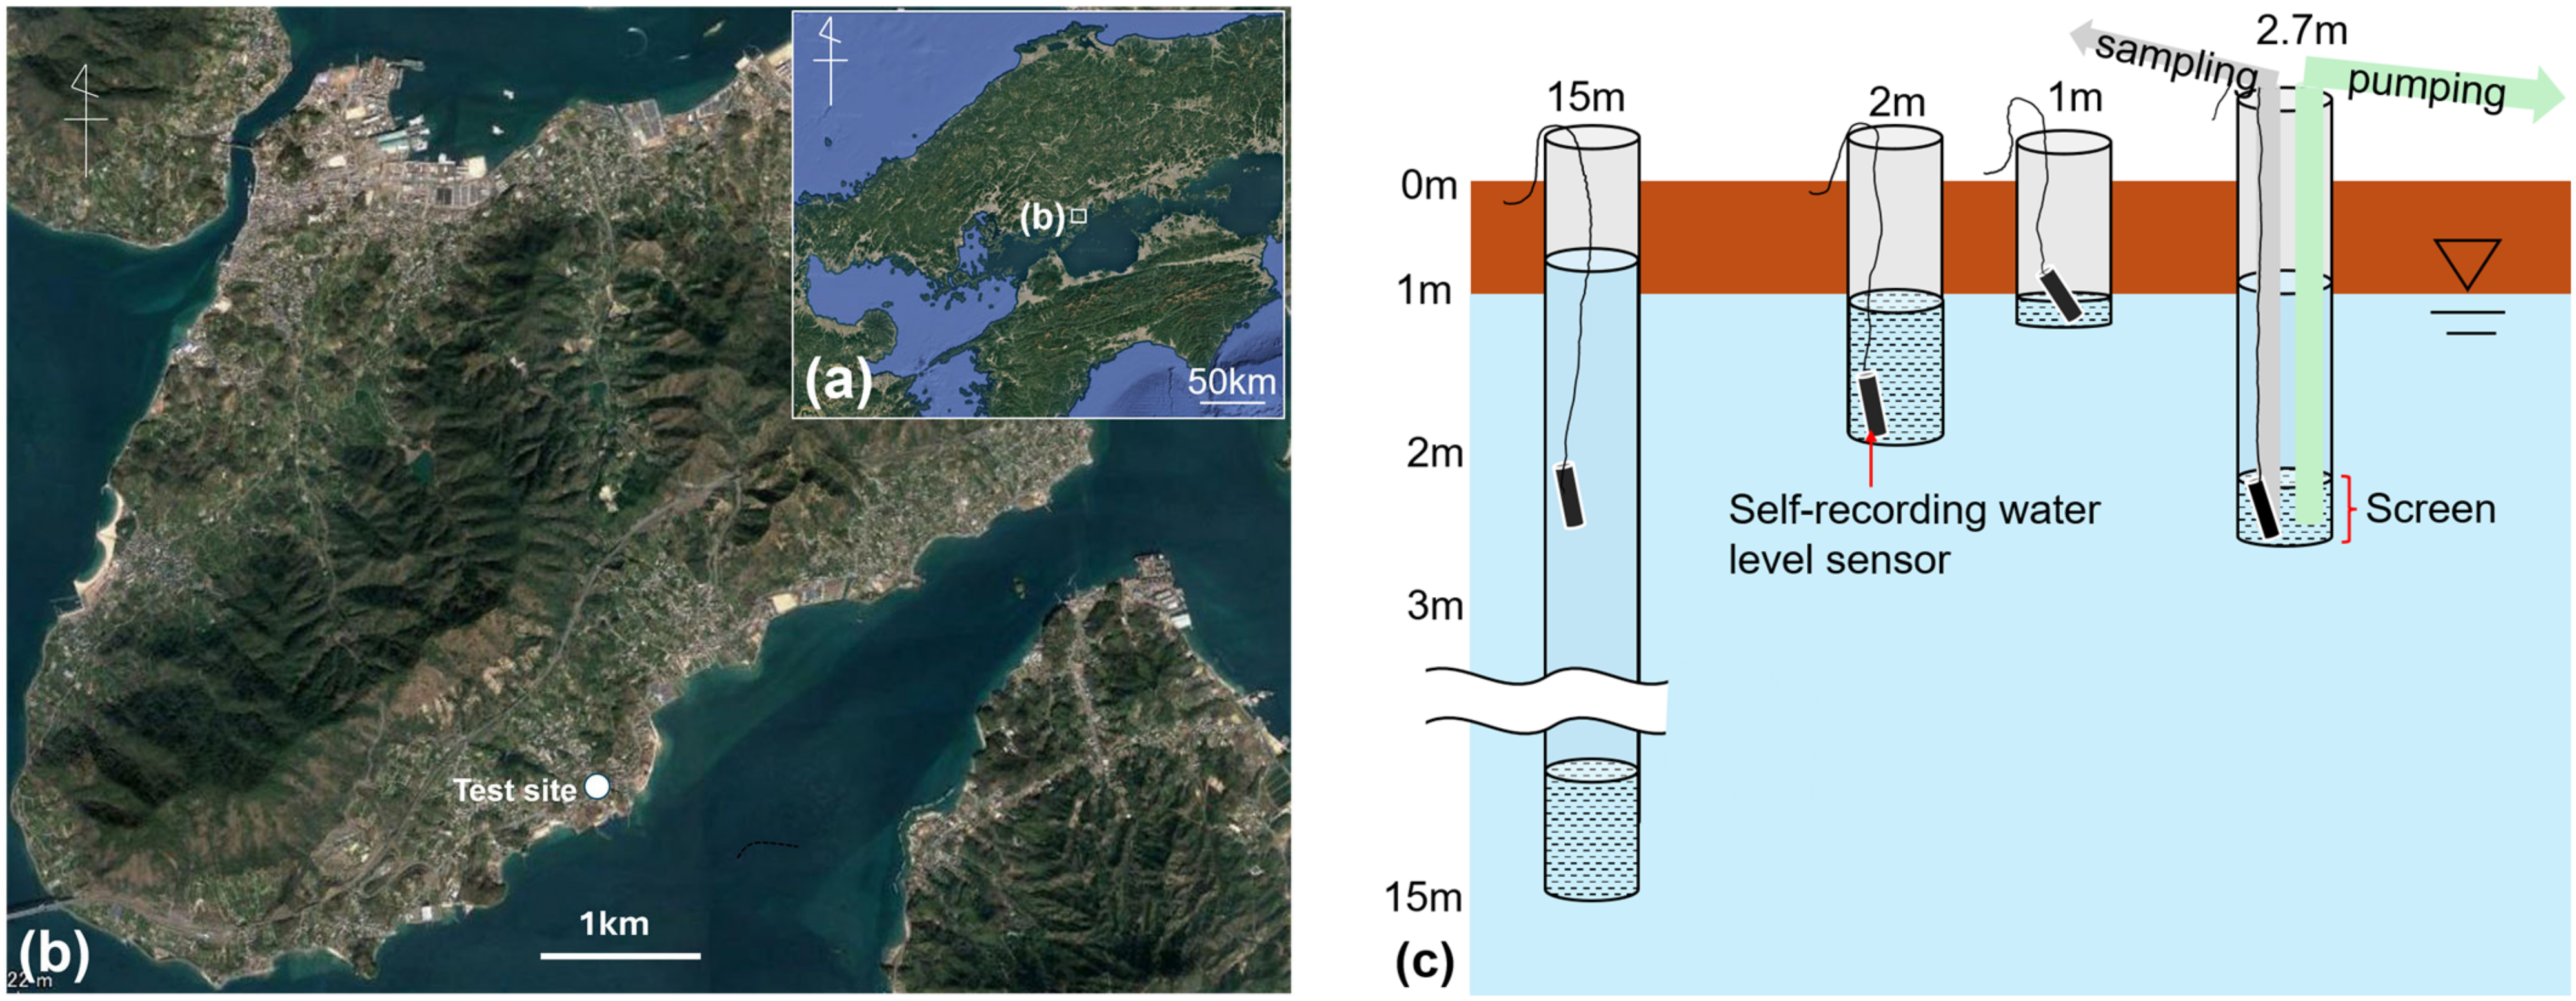
The test site is an orchard located on the lower slopes of the southern foothills of Ikuchijima Island, situated in the Seto Inland Sea in Western Japan (Figure 1). Ikuchijima covers approximately 31.21 km2 [23], and its average annual precipitation is 1138 mm. In addition, the average temperature was 15.9 °C from 1991 to 2020 [24]. Citrus cultivation is widespread on Ikuchijima Island, where approximately 40 kg/ha of nitrogen is applied in late March, approximately 96 kg/ha in late May, and approximately 64 kg/ha from October to late November. Owing to groundwater flow from the steeply sloped upstream area, denitrification of high-concentration NO3-N derived from fertilizers in the upstream area has been confirmed in the vicinity of the downstream test site [14,25,26,27].
Observation wells have been installed at the test site. The observation wells at depths of 1 m, 2.7 m, and 15 m have a diameter of 5 cm, and the observation well at a depth of 2 m has a diameter of 10 cm. The screen length is 1 m for the 2 m and 15 m observation wells and 50 cm for the 2.7 m observation well [23,28].

2.2. Field Test Methods

Verification of groundwater transport and denitrification effects through pumping (Pumped Denitrification Test (PDT)) was conducted in December 2024 and July 2025. Additionally, to estimate the inflow of groundwater into the observation well at 2.7 m owing to pumping, an in-situ permeability test was conducted in November 2024, and the permeability coefficient was determined based on the correlation between the hydraulic gradient and groundwater flow velocity during groundwater recovery.
During the PDT in December 2024, groundwater was continuously pumped from a depth of 2.7 m at a low flow rate for approximately 6 d. During the PDT in July 2025, groundwater at a depth of 2.7 m was pumped at a high flow rate for approximately 3 d. During pumping, groundwater samples were collected every 1 or 3 h at a depth of 2.7 m using an autosampler. Additionally, water levels at depths of 2 m, 2.7 m, and 15 m were measured using self-recording water level sensors. Before and after the test, water levels were measured manually, and groundwater samples were collected at depths of 1 m, 2 m, 2.7 m, and 15 m using a bailer. For samples whose sufficient volume was obtained, dissolved oxygen (DO) and oxidation-reduction potential (ORP) were measured on-site using portable meters.

2.3. Analysis of Dissolved Chemical Components

The collected water samples were filtered through a 0.2-μm membrane filter in the laboratory or field, transferred to 10-mL polypropylene tubes, and frozen until analysis. For analysis, a flow-injection spectrophotometer (BL TEC K.K., Tokyo, Japan) was used to measure the concentrations of nitrate ions (NO3-N) and silicon dioxide (SiO2-Si), and an ion chromatography (Shimadzu Corporation, Kyoto, Japan) was used to measure the concentrations of chloride ions (Cl) and nitrate ions.

2.4. Estimation of Groundwater Inflow

Groundwater inflow (Q) is generally calculated as the product of the Darcy flow rate and the cross-sectional area (A) of the flow path. The Darcy flow rate (q) is calculated as the product of the permeability coefficient (K) and hydraulic gradient (Δh/Δz) [29], as shown in Equation (1).
Q = AKΔh/Δz
To estimate the permeability coefficient in Equation (1), measurements collected in November 2024 were used to establish the relationship between groundwater inflow and the average hydraulic gradient (Δh/Δz ave). The average hydraulic gradient was calculated from water levels measured at depths of 2, 2.7, and 15 m, while groundwater inflow was estimated from changes in the recovery water level at the 2.7 m observation well. Linear regression analysis of these variables yielded the following Darcy-based relationship:
q = 1.1175 × 10⁻⁴ × (Δh/Δz ave) − 1.4765 × 10⁻⁵ (units: m/s)
The regression showed a high coefficient of determination (R2 = 0.9852). The observation results showed that (Δh/Δz ave) was always greater than 0.12; under steady-state conditions—that is, when q = 0—(Δh/Δz ave) was approximately 0.12. This implies that when (Δh/Δz ave) < 0.12, q < 0—that is, groundwater is flowing out of the 2.7 m deep observation well. Since the quantification of denitrification in this study considers only the inflow into the 2.7 m observation well, the total inflow was calculated by setting the inflow to zero when (Δh/Δz ave) < 0.12 (i.e., when q < 0).
Furthermore, the hydraulic gradient between depths of 2 m and 2.7 m during the high-flow PDT exceeded 1, indicating that Darcy’s law was not satisfied, and the inflow estimated using Darcy’s equation did not match the measured pumping volume. Therefore, assuming that the total pumping volume measured in five separate intervals ranging from 15 to 27 min immediately after the start of high-flow PDT was equal to the total inflow of groundwater into the 2.7 m observation well during that interval, we calculated the average water flux (q′) during that interval by dividing the total pumping volume during that interval by the time interval and the cross-sectional area of the screen in the 2.7 m observation well. We then plotted a scatter plot of the average flow rate and hydraulic gradient (Δh/Δz ave′), calculated based on the average water level during that interval. This yielded a linear approximation equation with an R2 of 0.8098: (q′ = 1.2755 × 10⁻³ × (Δh/Δz ave′) − 6.4335 × 10⁻⁴) (units: m/s). We then estimated the average flow rate and total inflow during the periods before and after the sampling time by calculating (Δh/Δz ave′) from the average water levels during those periods and substituting these values into the approximation equation.

2.5. Estimation of the Contribution Ratio of Inflow Components Associated with Pumping

When considering the denitrification of NO3 entering the pumping depth (2.7 m), it is necessary to determine whether the NO3-N concentration at a depth of 2.7 m during pumping has decreased due to denitrification or as a result of mixing with groundwater containing low concentrations of NO3-N. Therefore, groundwater mixing was estimated using the method described in Section 2.5, and the amount of denitrification was quantitatively evaluated using the method described in Section 2.6.
Assuming that the pumped water consists of three end members, the mixing ratio (contribution ratio) was calculated using the End Member Mixing Analysis (EMMA) method [30]. When two types of tracers are used, the following three material balance equations hold true.
Q·Ra + Q·Rb + Q·Rc = Q
C1a·Ra + C1b·Rb + C1c·Rc = C1m
C2a·Ra + C2b·Rb + C2c·Rc = C2m
where Q represents the total volume of the mixed water; C1 and C2 represent the concentrations of the two tracers; a, b, and c represent the three end members; and m represents the mixed water. In this PDT study, at a depth of 2.7 m during pumping, we assumed that groundwater originating from depths shallower than 2.7 m (shallow groundwater), groundwater originating from a depth of 2.7 m flowing in horizontally (2.7 m groundwater), and groundwater originating from the aquifer zone between 2.7 m and 15 m depth (deep groundwater) were mixed. Using Cl and SiO2-Si as tracers, we solved the system of Equations (2)–(4) to determine the contribution ratios of each end-member groundwater to the groundwater at a depth of 2.7 m during pumping (hereinafter referred to as mixed groundwater).

2.6. Quantitative Assessment of Denitrification

When the NO3-N concentrations in the shallow, 2.7 m, and deep groundwater in the pre-PDT environment are denoted as CNO3-N,a, CNO3-N,b, and CNO3-N,c, the NO3-N concentration under the assumption that NO3-N remains unchanged biologically and chemically, and solely results from mixing the three end-member groundwater types (mixed value CNO3-N,m) can be calculated using Equation (5).
CNO3-N,m = CNO3-N,a·Ra + CNO3-N,b·Rb + CNO3-N,c·Rc
Using the observed NO3-N concentration at each sampling time (n) obtained from the analysis as CNO3-N,n, and the total inflow of groundwater into the 2.7-m observation well before and after sampling time n as In, the mass of NO3-N removed by denitrification per unit time (denitrification amount DA) was calculated using Equation (6). The inflow rate In was calculated by defining the time segment for each sampling point as half of the interval to the previous sampling time plus half of the interval to the next sampling time, and dividing the total inflow within that segment by its duration.
DA = (CNO3-N,m − CNO3-N,n)·In
Furthermore, the ratio of denitrified NO3-N to the total inflow of NO3-N was calculated as the denitrification ratio (DR) using Equation (7).
DR = (CNO3-N,m − CNO3-N,n)/CNO3-N,m × 100

3. Results and Discussion

3.1. Water and Solute Transport with Low-Flow PDT

Table 1 shows the water level, DO, ORP, NO3-N, Cl, and SiO2-Si concentrations during low-flow PDT in December. During the low-flow PDT, the pump’s lifting capacity was low, and for most of the pumping period, the water level dropped by approximately 30 cm compared with that before pumping. DO and ORP were measured on-site using groundwater samples collected with a bailer after prewashing the sampling equipment. Therefore, it is highly likely that the measured DO and ORP values were higher than the actual values in the aquifer. DO and ORP at a depth of 1 m could not be measured because of the insufficient volume of groundwater samples. However, it was found that the area near the 1 m depth was the boundary between the saturated and unsaturated zones, and it is highly likely that the groundwater at 1 m depth, which was exposed to the atmosphere, was more oxidized than the groundwater at depths of 2 m and 2.7 m. Furthermore, the NO3-N concentration at a depth of 1 m was significantly higher than those at 2 m and 2.7 m, both before and after pumping. Evidently, NO3-N was reduced at depths of 2 m and 2.7 m under more reducing conditions, whereas the NO3-N concentration was high at a depth of 1 m, owing to an oxidizing environment and fertilizer inputs. In addition to denitrification, dissimilatory nitrate reduction to ammonium (DNRA) is considered a possible factor in nitrate reduction under anaerobic conditions. However, given that DNRA mainly occurs in strongly reducing sediments [31], and based on the observed DO and ORP values, the influence of DNRA on nitrate reduction at a depth of 2.7 m is considered to be smaller than that of denitrification. In contrast, research findings indicate that DNRA typically becomes stronger within the capillary fringe, with its intensity varying in response to fluctuations in the groundwater table [32]. Therefore, further investigation is needed regarding the effects of declining water levels caused by pumping.
Based on the depth distributions of Cl and SiO2-Si concentrations from 1 m to 15 m shown in Table 1 and Table 2, the Cl and SiO2-Si concentrations of the end members for shallow, 2.7 m, and deep groundwater were determined. For shallow groundwater, assuming that groundwater at a depth of 1 m did not flow into the 2.7 m depth during the low-flow PDT, the Cl and SiO2-Si concentrations at a depth of 2 m prior to pumping were used as the concentrations for shallow groundwater. For 2.7 m groundwater, the Cl and SiO2-Si concentrations of the groundwater at that depth prior to pumping were used. For deep groundwater, Groundwater at a depth of 15 m was not sampled prior to the low-flow PDT. However, it was assumed to be constant throughout the year, and the Cl and SiO2-Si concentrations in deep groundwater were set to the values of Cl and SiO2-Si concentrations in groundwater collected at a depth of 15 m prior to the high-flow PDT.
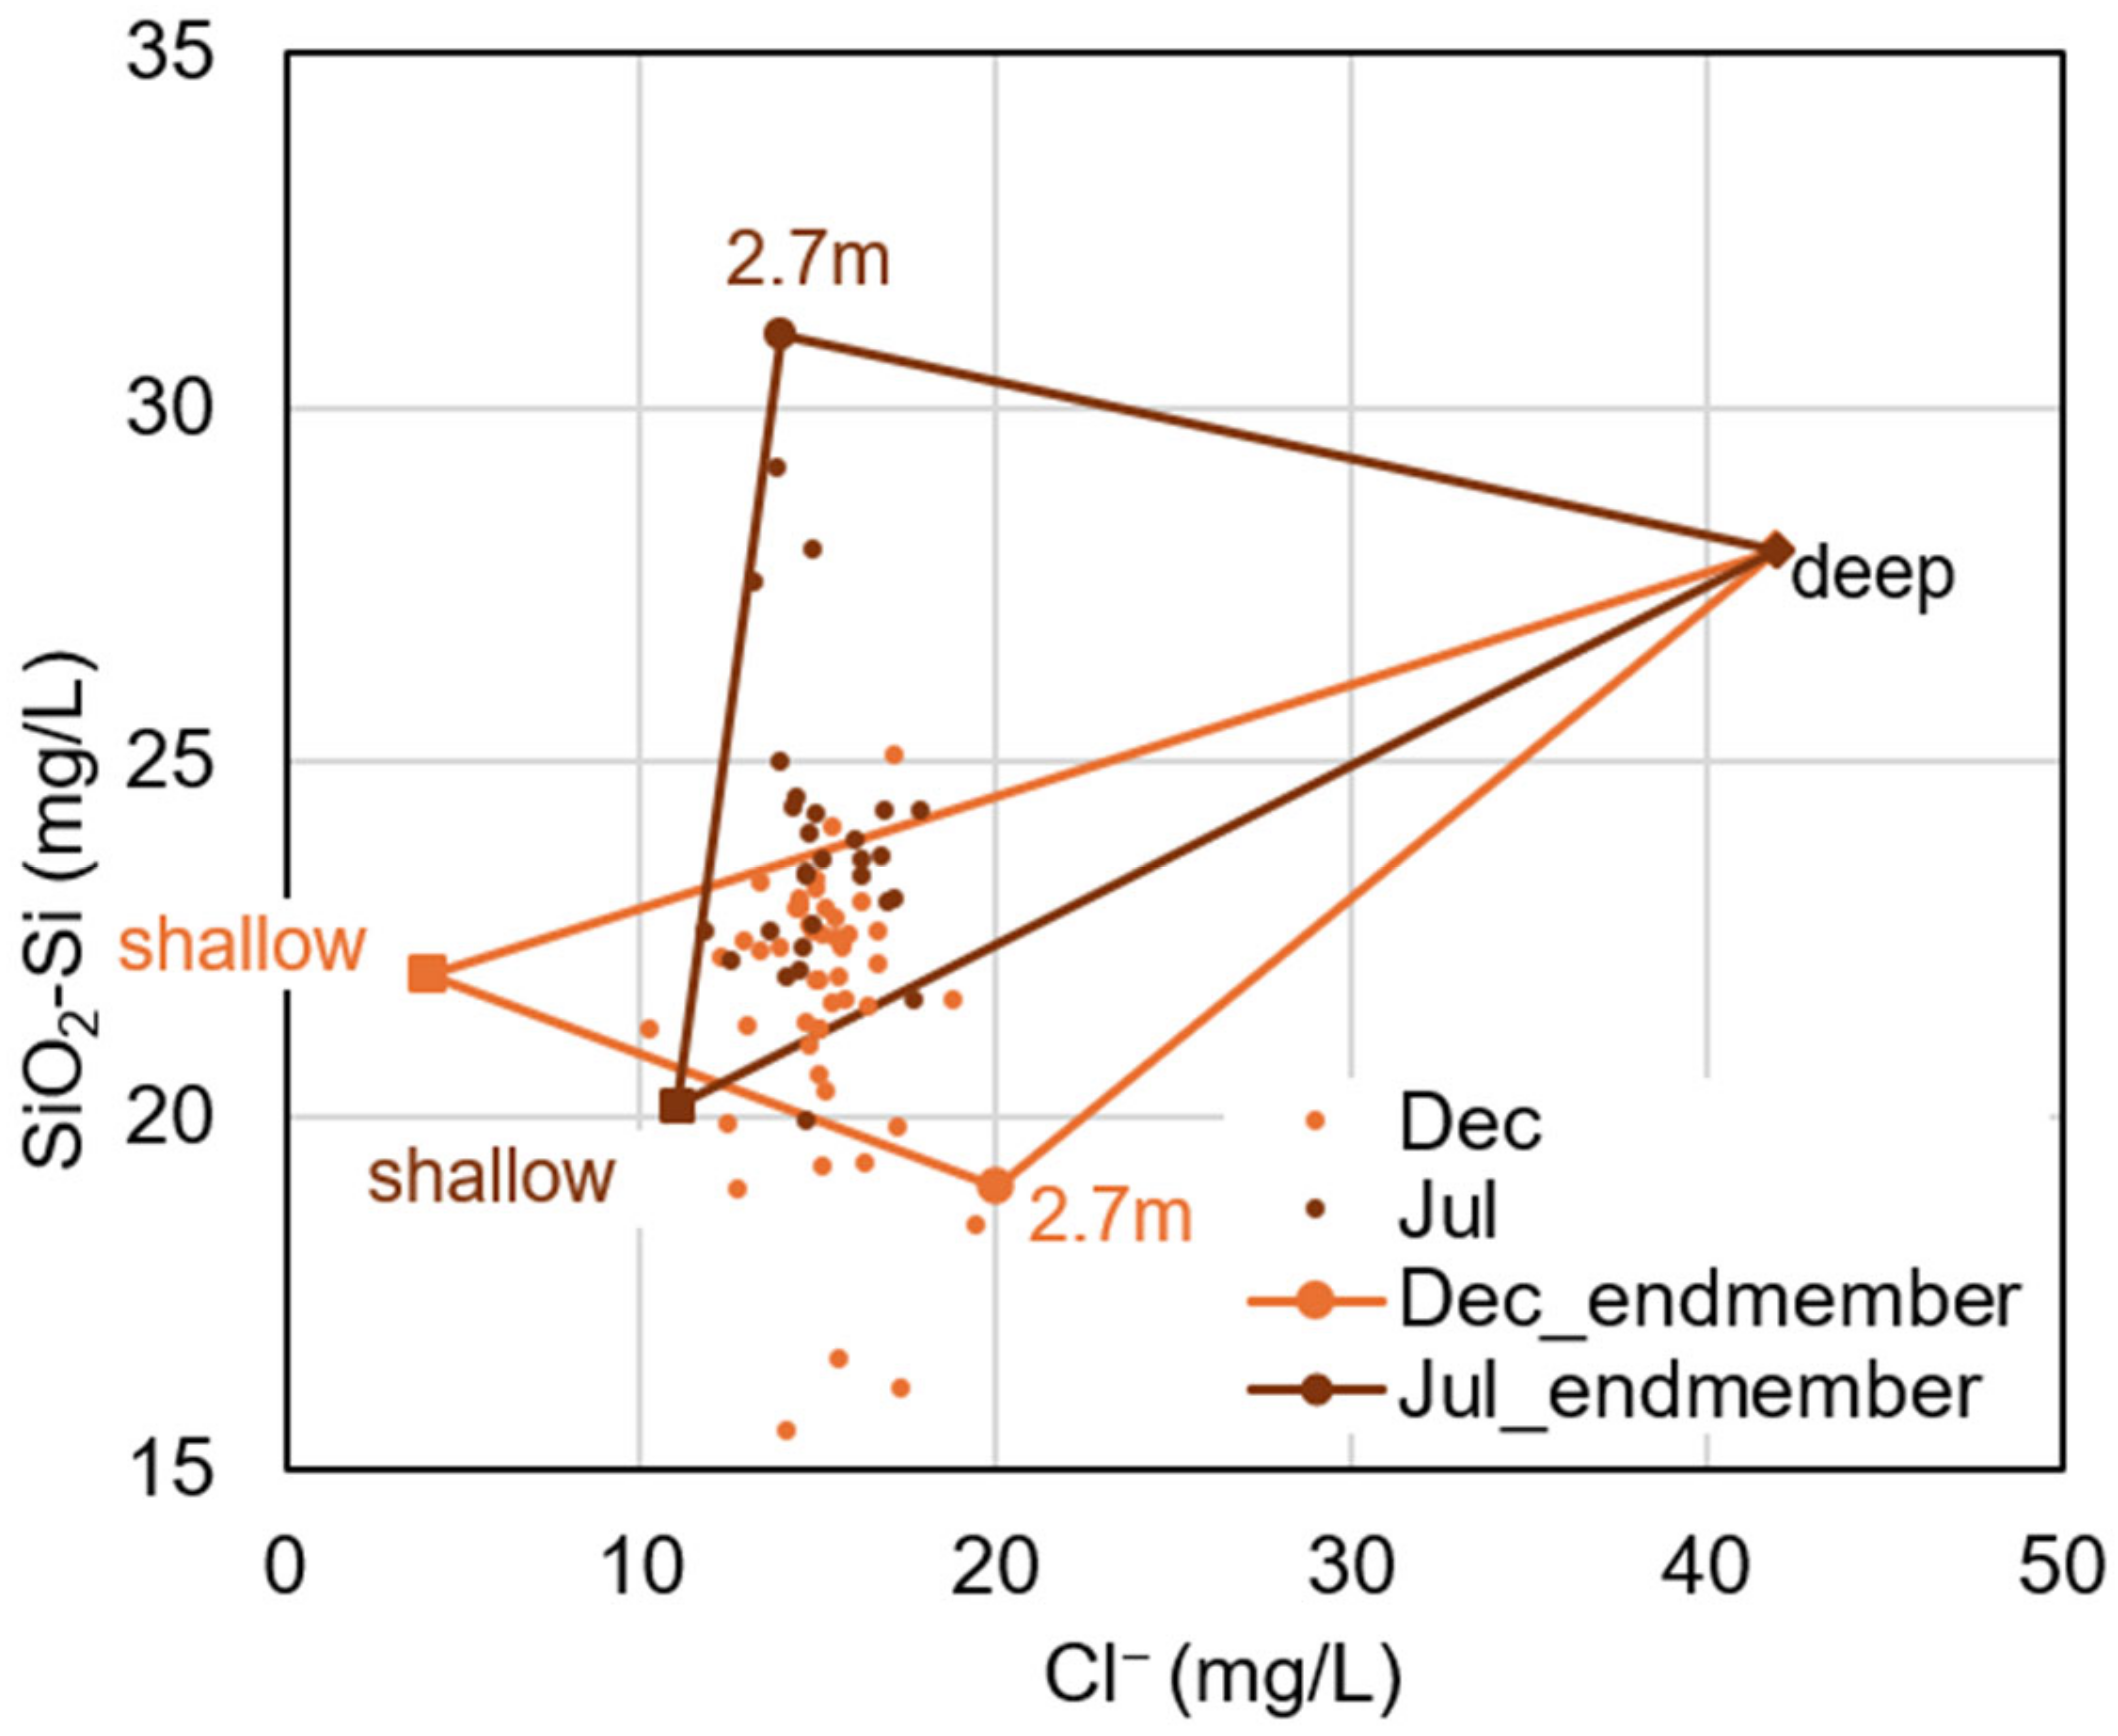
Figure 2 shows plots of the Cl and SiO2-Si concentrations for shallow, 2.7 m, and deep groundwater, as well as for groundwater at a depth of 2.7 m during pumping. Table 3 presents the Cl and SiO2-Si concentrations for each endmember and the contribution ratios calculated using the endmember method. For the 2.7-m-deep groundwater during pumping, data points that fell outside the endmember triangle in the plot in Figure 2 (whose mixing ratios were less than 0 or greater than 1) were excluded from the calculations. Several samples plotted outside the endmember mixing triangle, indicating limitations of the endmember mixing approach under the observed field conditions. This likely reflects the heterogeneous distribution of Cl and SiO2-Si with depth, such that the concentrations of groundwater inflowing from shallow and deep zones were not constant. Moreover, groundwater concentrations at the same depth may vary horizontally, and the tracers themselves could be affected by chemical or biological processes. Consequently, temporal and spatial variability in tracer concentrations limits the accuracy of mixing estimates obtained using the endmember method.

3.2. Water and Solute Transport with High-Flow PDT

Table 2 shows the water level, DO, ORP, NO3-N, Cl, and SiO2-Si concentrations during high-flow PDT in July. In high-flow PDT, the pump’s suction power was so strong that it occasionally reduced the volume of water from the 2.7-m-deep observation well to zero (a water level of 2.7 m). When the water in the 2.7-m-deep observation well was emptied and air entered the suction hose, the suction power decreased or stopped temporarily, causing the water level to rise. Once the water level rose sufficiently, the pumping hose was filled with water and pumping capacity recovered; then the water in the 2.7-m observation well would empty again. This cycle caused the water level at the 2.7-m depth to fluctuate between 2.7 and 2.1 m. DO and ORP values were relatively low at depths of 2 m and 2.7 m, and relatively high at depths of 1 m and 15 m. At a depth of 15 m, the NO3-N concentration was also substantially higher than that observed at the shallower depths. This trend is consistent with previous studies [26], which suggest that the deeper downstream groundwater is relatively oxidizing. Under these conditions, nitrate is less readily reduced than in the shallower groundwater, resulting in higher NO3-N concentrations. Prior to pumping, the NO3-N concentration at the 1-m depth was lower than that at the 2-m depth, despite the 1-m depth having a more oxidizing environment. One possible explanation for this is that 45.5 mm of precipitation was observed on Ikuchijima during 12 days before sampling [33], suggesting that the surface layer may have been diluted by rainwater.
Regarding the determination of Cl and SiO2-Si concentrations in the end-member groundwater, assuming that groundwater at a depth of 1 m also flowed into the 2.7-m depth, the average Cl and SiO2-Si concentrations of the groundwater at depths of 1 m and 2 m prior to pumping were used as the concentrations of the shallow groundwater. For the 2.7-m groundwater, the Cl and SiO2-Si concentrations of the groundwater at 2.7 m prior to pumping were used as the concentrations for the 2.7-m groundwater. Among the shallow groundwater samples collected in summer (June and July), those with the lowest Cl and SiO2-Si concentrations were selected to represent the shallow end-member. For the deep groundwater, the same Cl and SiO2-Si concentrations as those for the low-flow PDT were used. Figure 2 shows plots of the Cl and SiO2-Si concentrations for shallow, 2.7 m, and deep groundwater, as well as for groundwater at a depth of 2.7 m during pumping. Table 3 presents the Cl and SiO2-Si concentrations for each endmember and the contribution ratios calculated using the endmember method.

3.3. Comparison of Denitrification Amounts

For the calculation of mixed values under low-flow PDT, the NO3-N concentration at a depth of 2 m in December (prior to pumping) was used for shallow groundwater, and the concentration at a depth of 2.7 m was used for 2.7 m groundwater. Groundwater at a depth of 15 m is considered to be less sensitive to seasonal and weather variations. Therefore, the NO3-N concentration of groundwater at a depth of 15 m prior to the high-flow PDT was used for deep groundwater. For the calculation of mixed values in the high-flow PDT, the average NO3-N concentration at depths of 1 m and 2 m in July (prior to pumping) was used for shallow groundwater; the NO3-N concentration at a depth of 2.7 m was used for groundwater at 2.7 m; and the NO3-N concentrations at a depth of 15 m was used for deep groundwater.
Table 4 shows the set NO3-N concentrations for shallow, 2.7 m, and deep groundwater in both experiments; the average values of each NO3-N flux estimated from the inflow rates and NO3-N concentrations of each end-member groundwater; and the mixed and observed average values of the NO3-N concentration at a depth of 2.7 m during pumping. In the low-flow PDT, the observed NO3-N concentration after pumping was consistently higher than the concentration before pumping. However, owing to the inflow of NO3-N mainly from the deep aquifer, the mixed NO3-N concentration exceeded the observed concentration during most of the time period. In the high-flow PDT, the mixed value was similar to that of the low-flow PDT on average, while the observed value was, on average, approximately one-fifth of the concentration in the low-flow PDT.
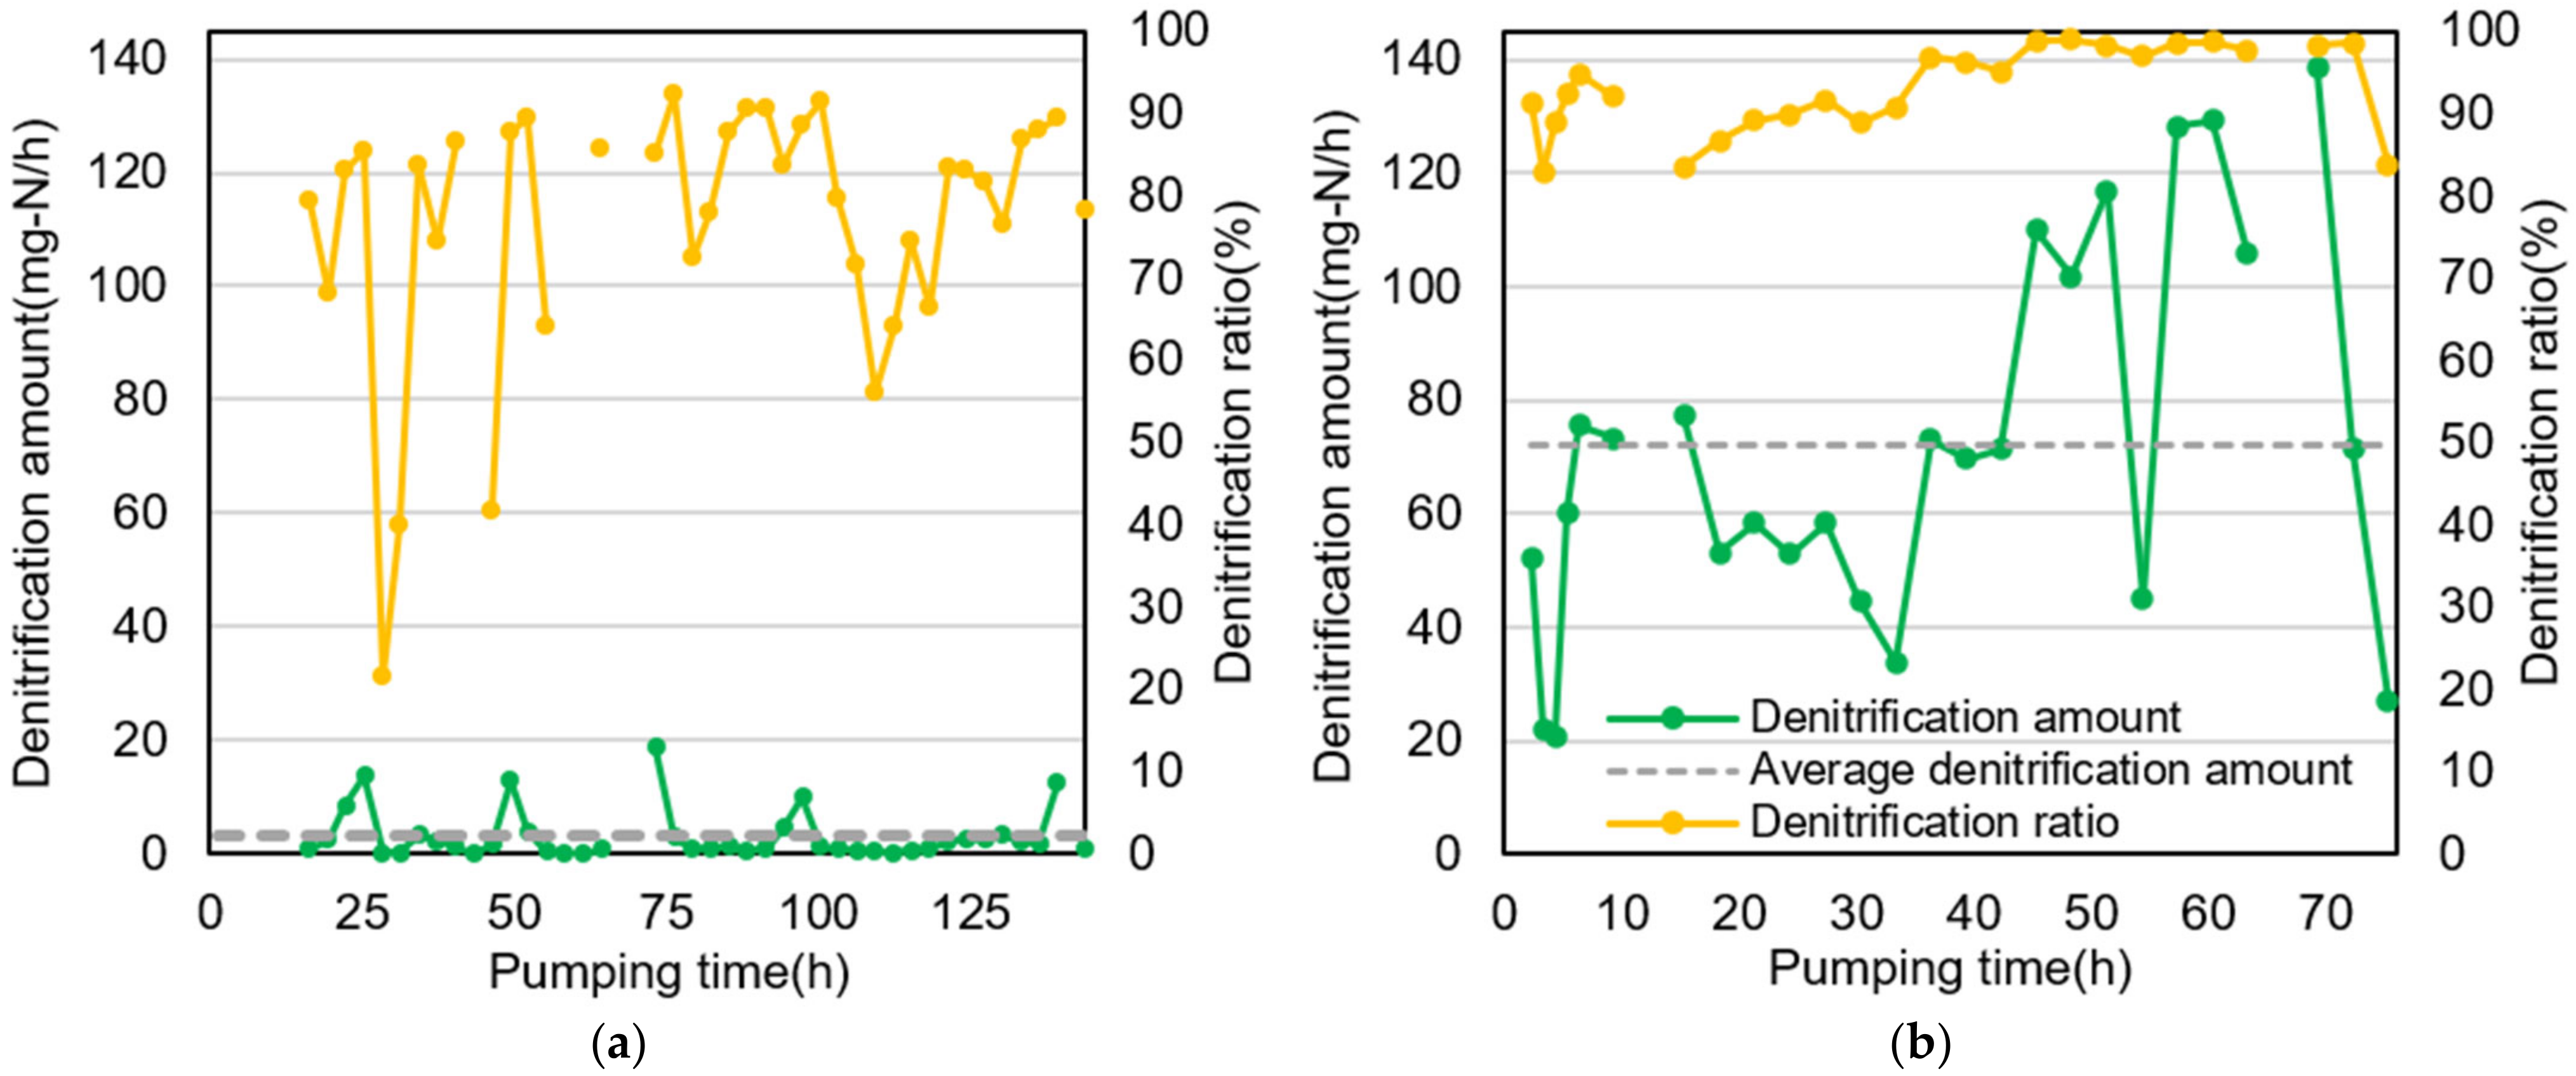
Figure 3 shows the temporal variation in denitrification amounts and denitrification ratios calculated using Equations (6) and (7). The average denitrification amount was approximately 3.3 mg-N/h for the low-flow PDT and 72 mg-N/h for the high-flow PDT. The denitrification amount depends on the total inflow of groundwater; in the high-flow PDT, where the average total inflow was approximately 27 times that of the low-flow PDT, the average denitrification amount was approximately 22 times that of the low-flow PDT. Regarding the denitrification ratios, while the low-flow PDT fluctuated between 22% and 92%, the high-flow PDT exhibited a high and stable denitrification ratio ranging from 83% to 99% starting 2 h after pumping.
In addition, Table 5 compares the results of the PDT in this study with nitrate removal under natural groundwater flow conditions at the same observation well obtained through push-pull tests [28], as well as nitrate removal in artificially created denitrification environments in other regions [34,35,36]. For comparison, the denitrification range in PDT was set at approximately 1.6 m3 within a radius of 1 m centered on the pumping point and at depths of 2.2–2.7 m, excluding the volume of the pumping well. The denitrification range in the Push-Pull test was assumed to be approximately 0.063 m3 within a radius of 0.2 m centered on the water intake point, and 2.2–2.7 m in depth. The unit for nitrate removal was standardized as g-Nm−3d−1.
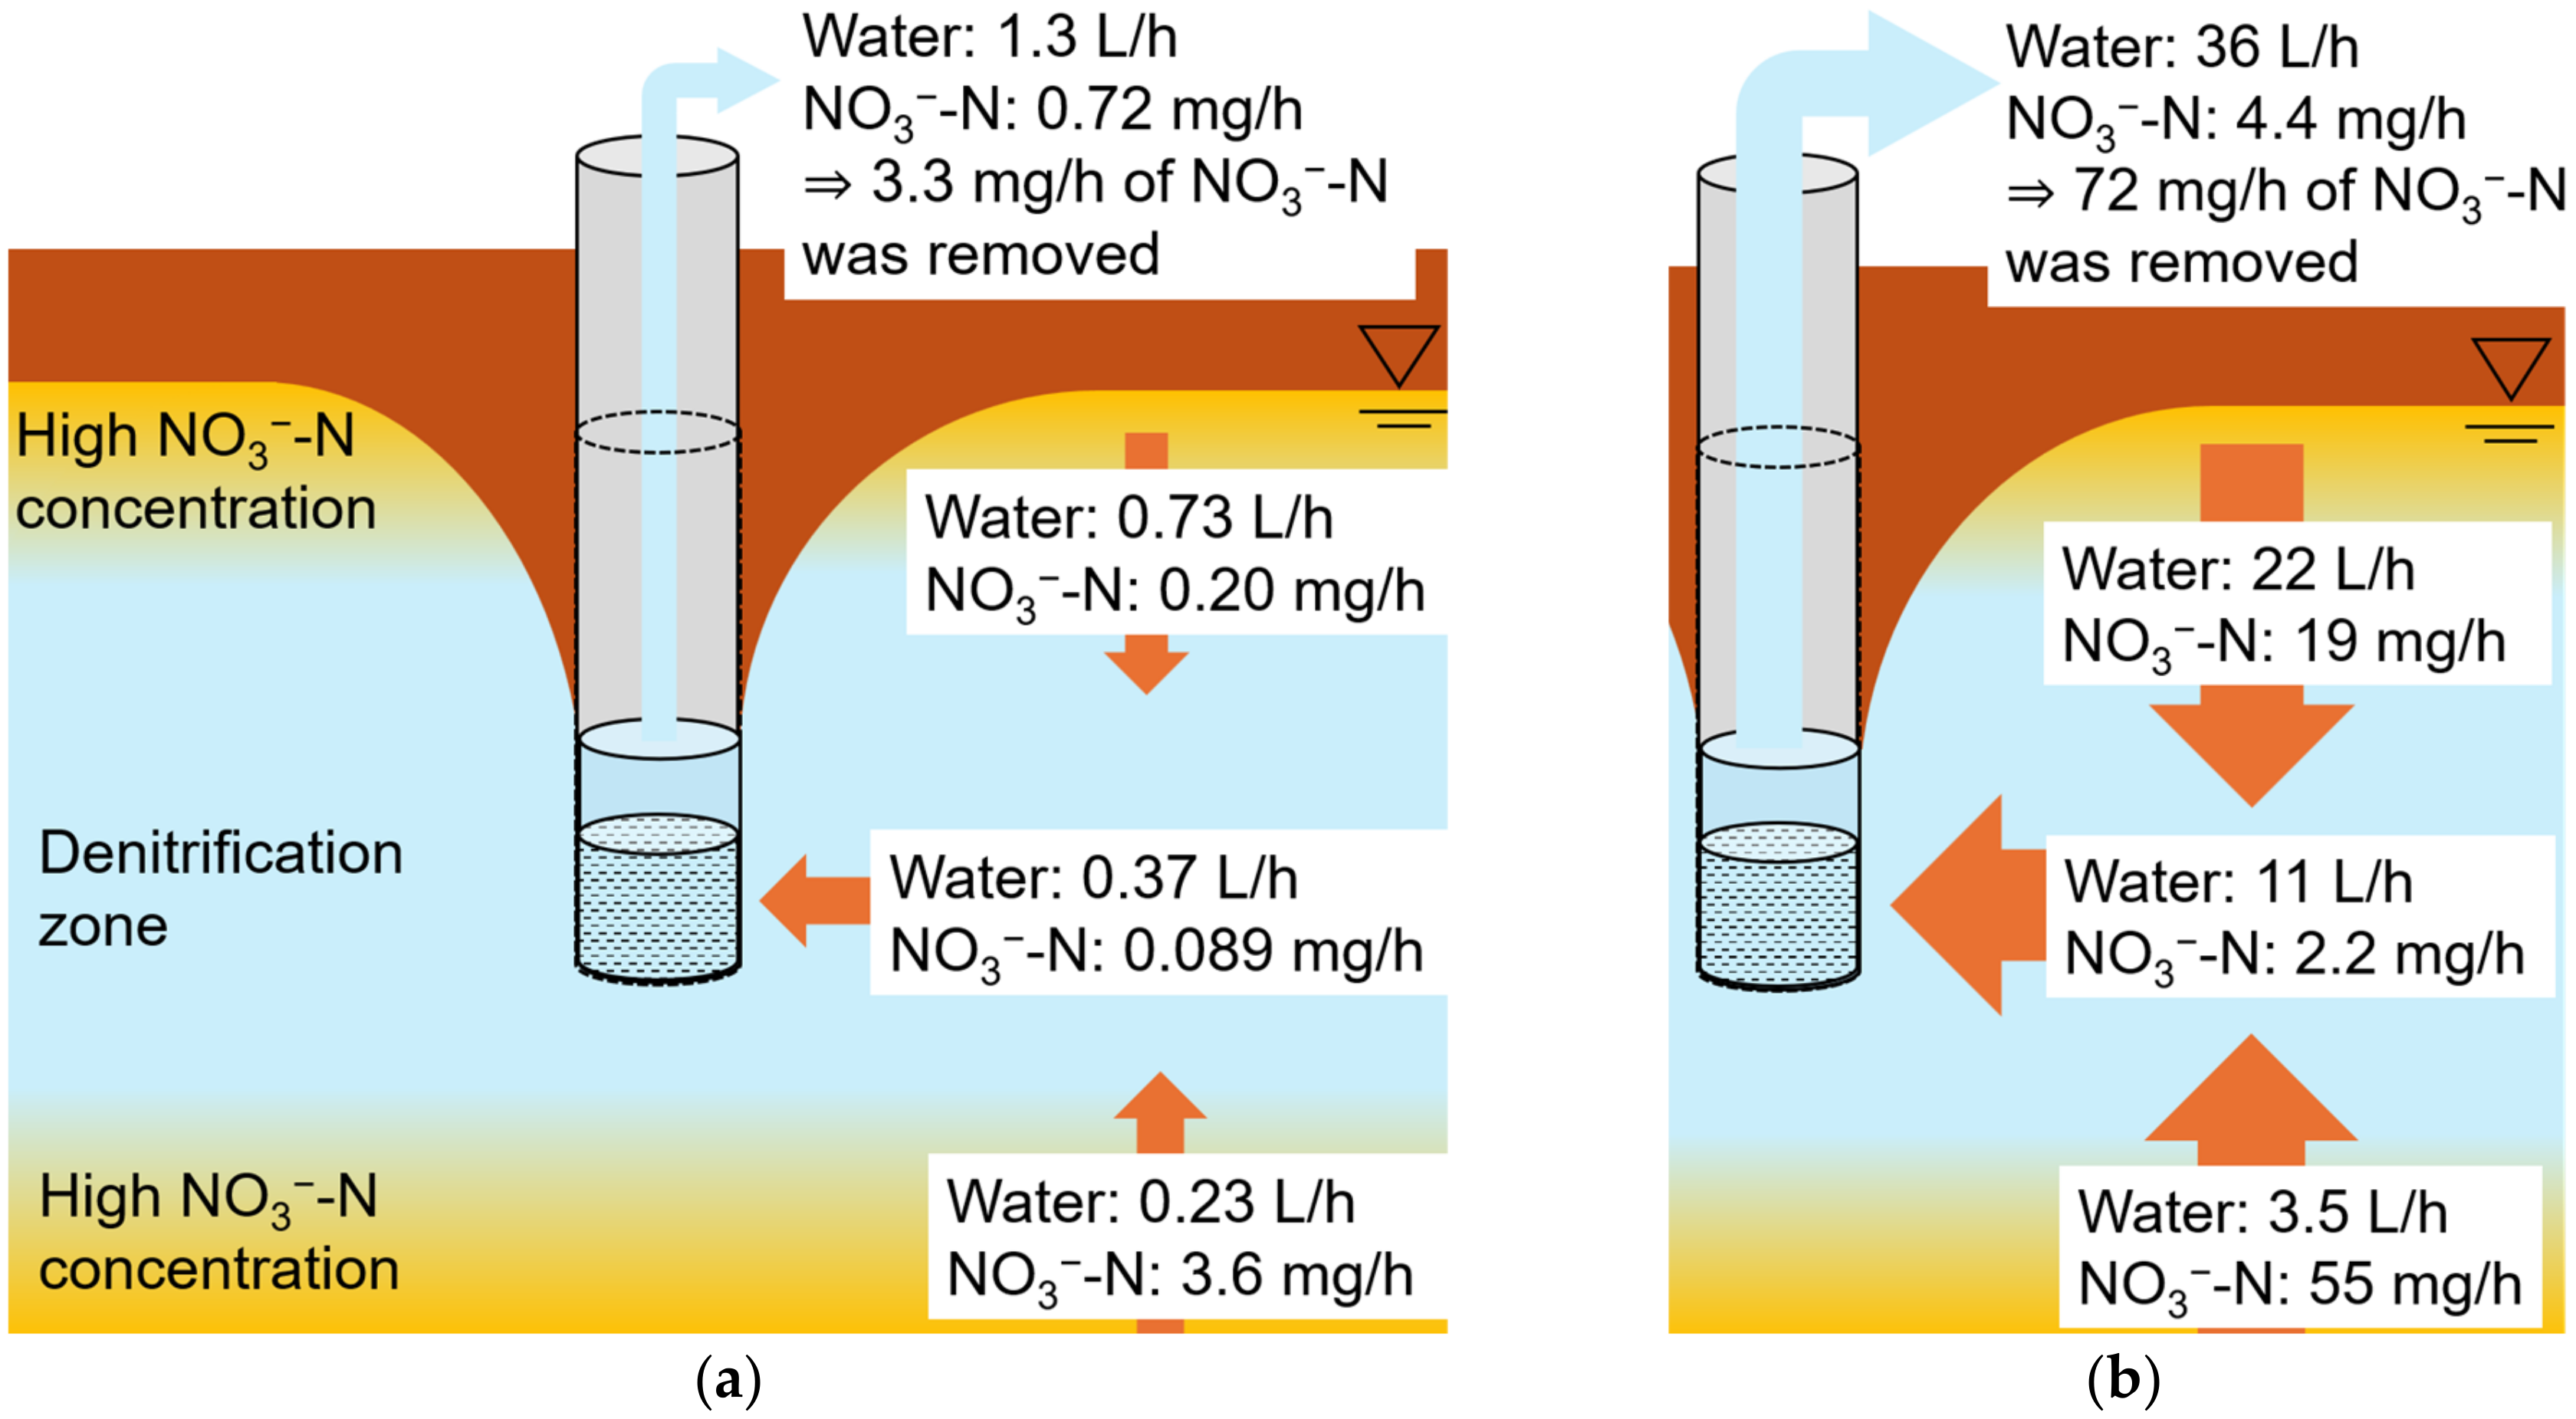
Compared with denitrification under natural groundwater flow in the 2.7-m observation well [28] during the same season, nitrate removal efficiency was lower in the low-flow PDT, whereas the high-flow PDT showed a higher nitrate removal efficiency. In the low-flow PDT, the maximum mixed NO3-N concentration was 4.4 mg/L, and the average was 2.9 mg/L. Conversely, during the Push-Pull test conducted in winter, the NO3-N concentration in the observation well immediately after the injection of high-concentration NO3-N reached a maximum of approximately 100 mg/L [28], indicating an abundance of NO3 suitable for denitrification; this is likely why the nitrate removal values in the Push-Pull test under natural groundwater flow were higher. In the high-flow PDT, the mixed NO3-N concentration was 3.7 mg/L at its maximum and 2.2 mg/L on average, showing little difference from the low-flow PDT; in the summer Push-Pull test, the NO3-N concentration immediately after high-concentration NO3-N injection exceeded 100 mg/L. However, nitrate removal in the PDT showed higher denitrification efficiency than that of the Push-Pull test conducted during the same season. Even when the mixed NO3-N concentration was not as high as in the low-flow PDT or Push-Pull tests, the high-flow PDT showed higher denitrification removal than the low-flow PDT or Push-Pull tests because the NO3-N flux was large owing to the inflow of a large amount of groundwater. This indicates that the effect of pumping on denitrification capacity at pumping depth is small, and the nitrate removal efficiency depends on the flux of NO3-N transported by strong pumping (Figure 4). Since the pumping time for the high-flow PDT is approximately 75 h, Table 3 indicates that the total volume of shallow groundwater transported during the entire high-flow PDT period is estimated to be approximately 1.6 m3. Assuming a porosity of 0.4 for this aquifer, 1.6 m3 of shallow groundwater corresponds to approximately 4.1 m3 of aquifer volume. If the shallow groundwater aquifer is assumed to be a cylinder 1.45 m high with a water level ranging from 1 m to 2.45 m, the radius of an aquifer with a volume of 4.1 m3 is calculated to be 0.94 m. In other words, although shallow groundwater within a radius of approximately 1 m was transported to a depth of 2.7 m and pumped up through the 2.7 m pumping well, as shown in Table 2, the reduced state (DO and ORP) at a depth of 2.7 m remained unchanged from the pre-pumping state, and nitrate continued to be removed. This is thought to be due to oxygen consumption resulting from the decomposition of organic matter within the aquifer [37].
Furthermore, when compared with several previous studies [34,35,36] on nitrate removal in artificially created denitrification environments using carbon sources, the high-flow PDT resulted in generally lower nitrate removal than in artificially created environments. If this method is implemented when high NO3-N concentrations are expected in the near-surface aquifer, such as immediately after fertilization, denitrification of NO3-N with even higher efficiency may be possible. Then, we calculated the nitrate removal when the NO3-N concentration in shallow groundwater was 10 mg/L and the observed NO3-N concentrations at each sampling time equaled those of the low-flow and high-flow PDT, and presented the results in Table 5. The estimated nitrate removal when the NO3-N concentration in shallow groundwater was 10 mg/L was approximately three times greater than the estimated nitrate removal under the actual pre-experimental conditions. When the NO3-N concentration in shallow groundwater was high, nitrate removal by high-flow PDT was similar to that in some artificial denitrification environments [35]. However, the range of space within which transported nitrate was denitrified in the low-flow and high-flow PDT remains unclear. To estimate the exact denitrification range and nitrate removal efficiency and to compare these results with other nitrate remediation methods, it is necessary to understand the impact of pumping on horizontal groundwater flow.
In this study, by using powerful pumping to introduce a relatively large amount of NO3-N along with surrounding groundwater, we were able to efficiently remove NO3-N using only natural denitrification activity. This method does not require additives such as external carbon sources or artificial reaction tanks; the only energy required for operation is the electricity used to pump groundwater. Consequently, this method has the potential to be more cost-effective than other nitrate removal methods in terms of both initial investment and operating and management costs. Although the method in this study requires the availability of a denitrification environment, such reducing environments have been confirmed in downstream discharge zones [15,18,38]. Therefore, this method is likely to be effective in such regions. However, the pumping period in this study was short, lasting a maximum of 6 days, and thus did not capture changes in the denitrification environment resulting from long-term pumping. Future research should include comparisons under conditions with varying initial NO3-N concentrations and reductive environments, as well as an evaluation of the long-term effects of pumping on the denitrification environment.

4. Conclusions

The objective of this study was to propose a natural remediation method for NO3-N that effectively utilizes denitrification. In the pumping tests conducted for this study, we confirmed the inflow of surrounding groundwater containing high concentrations of NO3-N and the denitrification effect at the denitrification depth when groundwater from the denitrification depth was pumped at a site where denitrification had been confirmed.
These results suggest that pumping groundwater from the denitrification zone creates a pressure gradient that draws in surrounding groundwater containing a high concentration of NO3-N. Before the transported NO3-N is discharged through the pumping well, it undergoes denitrification in the reductive environment of the denitrification zone (Figure 4). Based on the results of the two tests with different pumping volumes, the reducing environment was maintained even after pumping. Therefore, efficient NO3-N removal requires increasing the NO3-N flux through stronger pumping to enhance the inflow of surrounding groundwater. The high-flow PDT demonstrated nitrate removal efficiency comparable to that of artificially created denitrification environments. The method, which utilizes natural denitrification capacity using only the energy for well installation and pumping, is a low-cost NO3 remediation approach. However, these results reflect nitrate removal over a short period of approximately 3 or 6 days. Future studies should evaluate the long-term effects of pumping on groundwater flow, reducing conditions, and denitrification capacity.

Author Contributions

Conceptualization, S.-i.O. and M.S.; Methodology, M.A., S.-i.O. and M.S.; Formal analysis, M.A., K.T.T., and S.B.K.; Investigation, M.A., S.-i.O., M.S., K.T.T., and S.B.K.; Resource, S.-i.O. and M.S.; Data curation, M.A. and K.T.T.; Writing—original draft preparation, M.A., S.-i.O., and M.S.; Writing—review and editing, M.A., S.-i.O., and M.S.; Supervision, S.-i.O. and M.S.; Project administration, S.-i.O. and M.S.; Funding acquisition, S.-i.O. and M.S. All authors have read and agreed to the published version of the manuscript.

Funding

This research was funded by the Japan Society for the Promotion of Science (JSPS) Grant-in Aid for Challenging Research, grant number 22K19869, and Asia-Pacific Network for Global Change Research (APN) Grant No. CRRP2019-09MY-Onodera, Grant-in-Aid for Scientific Research (A) by Japan Society for the Promotion of Science (JSPS) KAKENHI Project No. 18H04151.

Data Availability Statement

The data presented in this study are available on request from the corresponding author.

Acknowledgments

We would like to thank the local people, including Japan Agricultural Cooperatives Setoda, for their cooperation in conducting this research. We express our deepest gratitude to them. We are grateful to our laboratory members for their assistance in sample collection and equipment preparation.

Conflicts of Interest

The authors declare no conflicts of interest.

References

  1. Tilman, D.; Gassman, K.G.; Maston, P.A.; Naylor, R.; Polasky, S. Agricultural sustainability and intensive production practices. Nature 2002, 418, 671–677. [Google Scholar] [CrossRef]
  2. Steffen, W.; Richardson, K.; Rockström, J.; Cornell, S.E.; Fetzer, I.; Bennett, E.M.; Biggs, R.; Carpenter, S.R.; Vries, W.D.; Wit, C.A.D.; et al. Planetary boundaries: Guiding human development on a changing planet. Science 2015, 347, 736. [Google Scholar] [CrossRef] [PubMed]
  3. Abascal, E.; Gómez-Coma, L.; Ortiz, I.; Ortiz, A. Global diagnosis of nitrate pollution in groundwater and review of removal technologies. Sci. Total Environ. 2022, 810, 152233. [Google Scholar] [CrossRef] [PubMed]
  4. Vinci, G.; Maddaloni, L.; Mancini, L.; Prencipe, S.A.; Ruggeri, M.; Tiradritti, M. The Health of the Water Planet: Challenges and Opportunities in the Mediterranean Area. An Overview. Earth 2021, 2, 894–919. [Google Scholar] [CrossRef]
  5. Lan, N.X.; Lan, P.T.M.; Ty, T.V.; Giao, N.T.; Minh, H.V.T. Detecting the Impacts of Climate and Hydrological Changes on the Lower Mekong River Based on Water Quality Variables: A Case Study of An Giang, Vietnam. Earth 2026, 7, 16. [Google Scholar] [CrossRef]
  6. Liu, X.; Beusen, A.H.W.; van Grinsven, H.J.M.; Wang, J.; van Hoek, W.J.; Ran, X.; Mogollón, J.M.; Bouwman, A.F. Impact of groundwater nitrogen legacy on water quality. Nat. Sustain. 2024, 7, 891–900. [Google Scholar] [CrossRef]
  7. Basu, N.B.; Van Meter, K.J.; Byrnes, D.K.; Van Cappellen, P.; Brouwer, R.; Jacobsen, B.H.; Jarsjö, J.; Rudolph, D.L.; Cunha, M.C.; Nelson, N.; et al. Managing nitrogen legacies to accelerate water quality improvement. Nat. Geosci. 2022, 15, 97–105. [Google Scholar] [CrossRef]
  8. Rockström, J.; Steffen, W.; Noone, K.; Persson, Å.; Chanpin, F.S., III; Lambin, E.F.; Lenton, T.M.; Scheffer, M.; Folke, C.; Joachim, H.; et al. A safe operating space for humanity. Nature 2009, 461, 472–475. [Google Scholar] [CrossRef] [PubMed]
  9. Appelo, C.A.J.; Postma, D. Geochemistry, Groundwater and Pollution; Balkema Publishers: Leiden, The Netherlands, 2005; p. 415-s487. [Google Scholar]
  10. Garcia-Segura, S.; Lanzarini-Lopes, M.; Hristovski, K.; Westerhoff, P. Electrocatalytic reduction of nitrate: Fundamentals to full-scale water. Appl. Catal. B Environ. 2018, 236, 546–568. [Google Scholar] [CrossRef]
  11. Trudell, M.R.; Gillham, R.W.; Cherry, J.A. An in-situ study of the occurrence and rate of denitrification in a shallow unconfined sand aquifer. J. Hydrol. 1986, 83, 251–268. [Google Scholar] [CrossRef]
  12. Seitzinger, S.; Harrison, J.A.; Böhlke, J.K.; Bouwman, A.F.; Lowrance, R.; Peterson, B.; Tobias, C.; Drecht, G.V. Denitrification Across Landscapes and Waterscapes: A Synthesis. Ecol. Appl. 2006, 16, 2064–2090. [Google Scholar] [CrossRef]
  13. Zaman, M.; Nguyen, M.L.; Gold, A.J.; Groffman, P.M.; Kellogg, D.Q.; Wilcock, R.J. Nitrous oxide generation, denitrification, and nitrate removal in a seepage wetland intercepting surface and subsurface flows from a grazed dairy catchment. Aust. J. Soil Res. 2008, 46, 565–577. [Google Scholar] [CrossRef][Green Version]
  14. Saito, M.; Onodera, S. Characteristics of seasonal NO3-N discharge by groundwater in a coastal agricultural catchment. Jpn. J. Limnol. 2009, 70, 141–151. [Google Scholar] [CrossRef]
  15. Böhlke, J.K.; Wanty, R.; Tuttle, M.; Delin, G.; Landon, M. Denitrification in the recharge area and discharge area of a transient agricultural nitrate plume in a glacial outwash sand aquifer, Minnesota. Water Resour. Res. 2002, 38, 10-1–10-26. [Google Scholar] [CrossRef]
  16. Hansen, B.; Aamand, J.; Blicher-Mathiesen, G.; Christiansen, A.V.; Claes, N.; Dalgaard, T.; Frederiksen, R.R.; Jacobsen, B.H.; Jakobsen, R.; Kallesøe, A.; et al. Assessing groundwater denitrification spatially is the key to targeted agricultural nitrogen regulation. Sci. Rep. 2024, 14, 5538. [Google Scholar] [CrossRef] [PubMed]
  17. Liu, X.; Yue, F.J.; Li, L.; Zhou, F.; Wen, H.; Yan, Z.; Wang, L.; Wong, W.W.; Liu, C.Q.; Li, S.L. Chronic nitrogen legacy in the aquifers of China. Commun. Earth Environ. 2025, 6, 58. [Google Scholar] [CrossRef]
  18. Richardson, C.M.; Peucker-Ehrenbrink, B.; Wyatt, S.; Bourbonnais, A.; Hatje, V.; Frey, C.; Sanders, T.; Varela, D.E.; Paytan, A. Effects of climate change on river and groundwater nutrient inputs to the coastal ocean. Commun. Earth Environ. 2025, 6, 761. [Google Scholar] [CrossRef]
  19. Nakamura, T.; Osaka, K.; Chapagain, S.K.; Nishida, K. Nitrogen Contamination and Denitrification Occurrence in Shallow Groundwater of Urbanized Area at Kathmandu Valley, Nepal. J. Geogr. 2023, 132, 183–196. [Google Scholar] [CrossRef]
  20. Onodera, S.; Saito, M.; Sawano, M.; Hosono, T.; Taniguchi, M.; Shimada, J.; Umezawa, Y.; Lubis, R.F.; Buapeng, S.; Delinom, R. Effects of intensive urbanization on the intrusion of shallow groundwater into deep groundwater: Examples from Bangkok and Jakarta. Sci. Total Environ. 2008, 404, 401–410. [Google Scholar] [CrossRef] [PubMed]
  21. Yamanaka, T.; Shimada, J.; Tsujimura, M.; Lorphensri, O.; Mikita, M.; Hagihara, A.; Onodera, S. Tracing a confined groundwater flow system under the pressure of excessive groundwater use in the lower central plain, Thailand. Hydrol. Process. 2011, 25, 2654–2664. [Google Scholar] [CrossRef]
  22. Tomozawa, Y.; Onodera, S.; Saito, M. Estimation of groundwater recharge and salinization in a coastal alluvial plain and Osaka megacity, Japan, using δ18O, δD, and Cl. Int. J. GEOMATE 2019, 16, 153–158. [Google Scholar] [CrossRef]
  23. Tomozawa, Y.; Onodera, S.; Saito, M.; Asai, K. Groundwater Dynamics near the Saltwater–Freshwater Interface in an Island of Seto Inland Sea. Water 2023, 15, 1416. [Google Scholar] [CrossRef]
  24. Japan Meteorological Agency. Average Value (Annual·Monthly Value). Available online: https://www.data.jma.go.jp/stats/etrn/view/nml_amd_ym.php?prec_no=67&block_no=0687&year=&month=&day=&view= (accessed on 29 March 2026).
  25. Saito, M.; Onodera, S.; Takei, T. Nitrate transport process in a small coastal alluvial fan catchment. Jpn. J. Limnol. 2005, 66, 1–10. [Google Scholar] [CrossRef]
  26. Onishi, K.; Onodera, S.; Saito, M.; Shimizu, Y.; Yoshikawa, M. Spatial distribution characteristics of dissolved N2O in unconfi ned groundwater of an agricultural catchment affected by signifi cant fertilizer application. Jpn. J. Limnol. 2014, 75, 1–11. [Google Scholar] [CrossRef]
  27. Nozaki, S.; Onodera, S.; Tomozawa, Y.; Saito, M. Spatial Distributions in Groundwater Discharge on Various Tidal Flats in a Small and Steep Island, Western Japan. Int. J. GEOMATE 2021, 20, 66–71. [Google Scholar] [CrossRef]
  28. Tarh, K.T.; Onodera, S.; Saito, M.; Kimbi, K.B.; Awamura, M. Effects of Groundwater Flux on Denitrification in a Steep Coastal Agricultural Island in Western Japan Using Push–Pull Tests. Hydrology 2026, 13, 23. [Google Scholar] [CrossRef]
  29. Freeze, R.A.; Cherry, J.A. Groundwater; Englewood Cliffs, N.J., Ed.; Prentice-Hall: Toront, OH, USA, 1979. [Google Scholar]
  30. Park, H.; Kim, Y.; Gibson, J.; Hiyama, T. Water tracer model-assessed contributions of source waters to changing circumpolar Arctic terrestrial evapotranspiration and river discharge. J. Hydrol. 2026, 664, 134379. [Google Scholar] [CrossRef]
  31. Thamdrup, B. New Pathways and Processes in the Global Nitrogen Cycle. Annu. Rev. Ecol. Evol. Syst. 2012, 43, 407–428. [Google Scholar] [CrossRef]
  32. Hao, Y.; Zheng, T.; Liu, L.; Li, P.; Ma, H.; Zheng, Z.; Zheng, X.; Luo, J. Occurrence of dissimilatory nitrate reduction to ammonium (DNRA) in groundwater table fluctuation zones during dissolved organic nitrogen leaching through unsaturated zone. J. Hazard. Mater. 2025, 489, 137501. [Google Scholar] [CrossRef] [PubMed]
  33. Japan Meteorological Agency, Daily Value. Available online: https://www.data.jma.go.jp/stats/etrn/view/daily_a1.php?prec_no=67&block_no=0687&year=2025&month=7&day=&view= (accessed on 25 April 2026).
  34. Warneke, S.; Schipper, L.A.; Bruesewitz, D.A.; McDonald, I.; Cameron, S. Rates, controls and potential adverse effects of nitrate removal in a denitrification bed. Ecol. Eng. 2011, 37, 511–522. [Google Scholar] [CrossRef]
  35. Schmidt, C.A.; Clark, M.W. Efficacy of a denitrification wall to treat continuously high nitrate loads. Ecol. Eng. 2012, 42, 203–211. [Google Scholar] [CrossRef]
  36. Iverson, G.; Humphrey, C.P.; O’Driscoll, M.; Sanderford, C.; Bean, E.; Underwood, W.J.; Pradhan, S.; Etheridge, J.R. Quantifying Nitrogen Treatment by an In-stream Bioreactor in a Watershed Served by Septic Systems. Environ. Process. 2024, 11, 22. [Google Scholar] [CrossRef]
  37. Saito, M. Nitrate Attenuation Process with the Groundwater Flow in the Coastal Agricultural Catchments. Ph.D. Thesis, Hiroshima University, Higashihiroshima, Japan, March 2008. [Google Scholar]
  38. Saito, M.; Onodera, S. Is Groundwater Flow A Controlling Factor of Denitrification Process? Recent accomplishments and future directions. J. Jpn. Assoc. Hydrol. Sci. 2011, 41, 91–101. [Google Scholar] [CrossRef]
Figure 1. Location of Ikuchijima Island (a) and the test site (b), Schematic illustrating the field test (c).
Earth 07 00120 g001
Figure 2. Plots of Cl·SiO2-Si concentration in low-flow and high-flow PDT.
Earth 07 00120 g002
Figure 3. Time-dependent changes in denitrification amount and denitrification ratios in low-flow PDT (a) and high-flow PDT (b).
Earth 07 00120 g003
Figure 4. Schematic illustrating the nitrate remediation method in low-flow PDT (a) and high-flow (b) PDT in this study.
Earth 07 00120 g004
Table 1. Water levels, DO, ORP, NO3-N, Cl, and SiO2-Si concentrations before and after pumping in low-flow PDT.
ParameterBefore/After the Test1 m2 m2.7 m15 m
Water level (m)Before1.140.970.990.69
AfterNA 11.021.24 20.71
DO (mg/L)BeforeNA 13.122.73NA 1
AfterNA 1NA 1NA 1NA 1
ORP (mV)BeforeNA 1−224NA 1
AfterNA 1NA 1NA 1NA 1
NO3-N (mg/L)Before5.770.270.24NA 1
After2.070.070.39NA 1
Cl (mg/L)Before20.544.3820.44NA 1
After19.00NA 114.98NA 1
SiO2-Si (mg/L)BeforeNA 122.0419.74NA 1
AfterNA 123.7621.54NA 1
1 NA indicates that no data is available. 2 indicates the average groundwater level during pumping.
Table 2. Water levels, DO, ORP, NO3-N, Cl, and SiO2-Si concentrations before and after pumping in high-flow PDT.
ParameterBefore/After the Test1 m2 m2.7 m15 m
Water level (m)Before1.050.970.950.64
AfterNA 11.412.22 20.81
DO (mg/L)Before4.651.802.533.49
AfterNA 13.662.854.80
ORP (mV)Before86−111−77140
AfterNA 1−71−78223
NO3-N (mg/L)Before0.501.230.1916.33
After1.701.050.1216.36
Cl (mg/L)Before11.6511.4414.4241.68
After15.3010.5411.7841.88
SiO2-Si (mg/L)Before16.9223.3731.2727.58
After19.3925.9322.6131.98
1 NA indicates that no data is available. 2 indicates the average groundwater level during pumping.
Table 3. How to determine the Cl and SiO2-Si concentrations and the calculated contribution ratios for each endmember.
ParameterPDTShallow2.7 mDeep
How to determineLow-flow2 m (December)2.7 m (December)15 m (July)
High-flowAverage of 1 m and 2 m (summer)2.7 m (July)
Cl (mg/L)Low-flow42042
High-flow1114
SiO2-Si (mg/L)Low-flow221928
High-flow2031
Average contribution ratioLow-flow0.540.290.17
High-flow0.610.290.10
Average inflow(L/h)Low-flow0.730.370.23
High-flow22113.5
Table 4. Comparison of groundwater flow and NO3-N concentration between low- and high- inflow PDT.
ParameterPDTShallow2.7 mDeep
How to determineLow-flow2 m (December)2.7 m (December)15 m (July)
High-flowAverage of 1 m and 2 m (July)2.7 m (July)
NO3-N of endmember (mg-N/L)Low-flow0.270.2416
High-flow0.860.19
Average NO3-N flux (mg-N/h)Low-flow0.200.0893.6
High-flow192.255
Average mixed NO3-N
(mg-N/L)
Low-flow2.9
High-flow2.2
Average observed NO3-N
(mg-N/L)
Low-flow0.55
High-flow0.12
Average denitrification amount (mg-N/h)Low-flow3.3
High-flow72
Table 5. Comparison of NO3 removal between PDT, natural groundwater flow through push-pull tests at the same test site, and an artificial denitrification environment.
Denitrification EnvironmentSeasonNO3 Removal (g-Nm−3d−1)Reference
Sand and gravel
(natural environment)
December0.051This study
July1.1
Sand and gravel
(when the NO3-N concentration of shallow
groundwater is 10 mg/L)
December0.16
July4.1
Sand and gravel
(natural environment)
December0.36[28]
August0.16
Woodchips and sawdust (pine wood)
(denitrification bed)
April6.7[34]
June0
September7.2
Novemver7.7
December4.6
January11.2
March8.4
Quartz sand and pine sawdust
(denitrification wall)
May3.35[35]
July2.95
Woodchips (in-stream bioreactor)Median0.04[36]
Disclaimer/Publisher’s Note: The statements, opinions and data contained in all publications are solely those of the individual author(s) and contributor(s) and not of MDPI and/or the editor(s). MDPI and/or the editor(s) disclaim responsibility for any injury to people or property resulting from any ideas, methods, instructions or products referred to in the content.